retrieval and application of land surface temperature paper-sun.pdf · retrieval and application of...
TRANSCRIPT

Ying Sun Term Paper – Retrieval and Application of Land Surface Temperature
1
Retrieval and Application of Land Surface Temperature
Ying Sun
Department of Geological Sciences University of Texas at Austin, Austin, Texas 78712, USA
Email: [email protected]
Abstract: Land surface temperature (LST) is a key variable in climatological and
environmental studies. However, accurate measurements of LST over continents are not yet
available for the whole globe. This paper first reviews the state of the science of land surface
temperature (LST) estimates from remote sensing platforms, models, and in situ approaches.
Considering the uncertainties, we review the current LST validation and evaluation method.
Then the requirements for LST products are specified, from the different user communities.
Finally we identify the gaps between state of the science and the user community
requirements, and discuss solutions to bridge these gaps.
1. Introduction
Land Surface Temperature (LST) is an important climate variable, related to surface energy
balance and the integrated thermal state of the atmosphere within the planetary boundary
layer (Jin 1996). Traditionally, LST was referred to standard surface-air temperature
measured by a sheltered thermometer 1.5–3.5 m above a flat grassy, well-ventilated surface.
With satellite technology, another type of LST, satellite-based surface temperature called skin
temperature, is becoming available globally (Dickinson 1994). Satellite LST products provide
an estimate of the kinetic temperature of the earth’s surface skin (Norman & Becker, 1995),
i.e., the aggregate surface medium viewed by the sensor to a depth of about 12 μm. Skin
temperature is inferred from the thermal emission of the earth surface and is generally some
average effective radiative temperature of various canopy and soil surfaces (Hall et al., 1992;
Betts et al., 1996).
LST is a key parameter in land surface processes, not only acting as a indicator of climate
change, but also due to its control of the upward terrestrial radiation, and consequently, the
control of the surface sensible and latent heat flux exchange with the atmosphere (Aires, 2001;
Sun 2003). For example, energy exchanges at the land-surface boundary are largely
controlled by the difference between the skin temperature and the surface air temperature, the
air and the surface reacting with different time and space scales to external forcing while still
being complexly interconnected. And the surface temperature responds more rapidly to
changes of the local balance of energy than the air temperature. On the other hand, surface
heat fluxes can induce local convection in the boundary layer, producing changes in air
temperature, surface winds, cloudiness, and (potentially) precipitation (Aires, 2001).

Ying Sun Term Paper – Retrieval and Application of Land Surface Temperature
2
Estimates of the surface temperature diurnal cycle can yield information about the soil
moisture via an estimate of the thermal inertia (Aires, 2001). Matsui et al (Matsui, 2002)
found that there is relationship between LST and rainfall variability in the North American
Monsoon. The substantial variability of skin temperature may modulate the temperature
gradient between land and ocean. In additional, skin temperature can be used for monitoring
vegetation water stress, assessing surface energy balance, detecting land surface disturbance,
and monitoring condition suitability for insect–vector disease proliferation, among other uses
(Pinheiro, 2006).
However, despite the recognized importance of land surface temperature, accurate
measurements of LST over continents are not yet available for the whole globe, for clear and
cloudy skies, with a time sampling adequate to resolve the diurnal cycle and to analyze
synoptic, seasonal, and interannual variability. The National Research Council (NRC, 2000)
and the Intergovernmental Panel on Climate Change (IPCC, Houghton et al, 2001) pointed
out the urgent need for long-term remote sensing–based land surface skin temperature (LST)
data in global warming studies to improve the limits of conventional 2-m World
Meteorological Organization (WMO) surface air temperature observations. Currently, the
long-term surface skin temperature dataset is only available over the ocean, i.e., sea surface
temperature (SST). Over land, developing such a dataset has proved more difficult due to the
land’s high surface heterogeneities, unknown surface emissivity and cloud contamination (Jin
2004).
The International Workshop on the Retrieval and Use of Land Surface Temperature: Bridging
the Gaps (workshop, 2008) was held at NOAA’s National Climatic Data Center (NCDC),
Ashevill, on April 2008. This workshop was designed to foster dialogue between the research
and user communities on the retrieval and use of land surface temperature products. In this
workshop, three different purposes for LST measurements were outlined: climate monitoring
of temperature changes, study of land-atmosphere interactions as reflected in variability of
temperatures on a range of time scales from diurnal to annual, and inference of properties of
the land surface from the variations of temperature (and emissivity). It was also emphasized
that, in analyses of a combination of different kinds of measurements, the differences should
be retained as indicative of the land surface properties.
In this report, LST product based on Remote Sensing, models are described in section 2 and
section 3, respectively. In section 4, some validation research work is shown. The section 5
focuses on the gaps between scientific research and community requirement using examples
of the presentations and posters on international workshop. A summary is given in the final
section.
2. Remote Sensing of LST
Satellite-based Land surface temperature can be determined from thermal emission at
wavelengths in either infrared or microwave which is “atmospheric windows”. However,
there are many uncertainties involved in the retrieval of LST from radiance which is directly

Ying Sun Term Paper – Retrieval and Application of Land Surface Temperature
3
measured by sensors onboard. Thermal infrared (TIR)-based LST retrievals are less uncertain
(1-2K) than microwave-based ones because of the smaller range of variation of surface
emissivities in the TIR domain and the stronger dependence of the radiance on temperature
(workshop, 2008). The range of surface emissivities in the microwave is much larger and the
temperature dependence is essentially linear leading to LST uncertainties that can be as large
as 10K. Infrared measurements are very much more sensitive to cloud contamination than are
microwave measurements. Strict cloud detection can reduce the uncertainty of infrared
temperature determinations to 2-3K (Rossow and Garder 1993, Prigent et al. 2003), whereas
the remaining cloud effects on microwave determinations are similar though much less
frequent. However, the need for a strict cloud detection severely limits the space-time
sampling of infrared measurements; in fact, the “clear-sky” bias of infrared results is
significant (of order 4K rms) and varies systematically with location, time of day and season.
In fact, the correlation of temperature variations and cloudiness in weather events precludes
an accurate determination of the synoptic variations as well. Microwave measurements are
much less limited in this regard but are much more uncertain because of the complex and
large variations of surface emissivity (including angle dependence).
The most popular remote sensed data used to derive LST is Advanced Very High Resolution
Radiometer AVHRR and Moderate Resolution Imaging Spectroradiometer MODIS. For the
sensor AVHRR, onboard National Oceanic and Atmospheric Administration NOAA
polar-orbiting satellite, is a cross-track scanning system with five spectral channels (Table 1).
Each channel has a nominal spatial resolution of 1.1 km at nadir (Pinheiro, 2006). The NOAA
polar-orbiting satellites have unique advantages for the LST dataset development because of a
long observation period, global coverage, easy data access, an abundance of excellent
research, and operational efforts to promote a retrieval process of the highest quality possible.
NOAA’s AVHRR uses thermal infrared channels to measure the radiative emission of the
surface. LST can be derived from AVHRR radiances after removing atmospheric and surface
emissivity effects (Ulivieri et al. 1994; Wan and Dozier 1996; Becker and Li 1995).
MODIS is an EOS instrument onboard Terra (EOS AM) and Aqua (EOS PM) that serves as
the keystone for global studies of atmosphere, land, and ocean processes (Running, 1994;
Wan, 1996). It scans ±55° from nadir in 36 bands, with bands 1-19 and band 26 in the visible
and near infrared range, and the remaining bands in the thermal infrared from 3-15 µm. It will
provide images of daylight reflection and emission of the Earth every 1-2 days, with
continuous duty cycle. The thermal infrared bands have an IFOV (instantaneous field-of-view)
of about 1km at nadir. MODIS will view cold space and a full-aperture blackbody before and
after viewing the Earth scene in order to achieve calibration accuracy of better than 1%
absolute for thermal infrared bands. MODIS is particularly useful because of its global
coverage, radiometric resolution and dynamic ranges, and accurate calibration in multiple
thermal infrared bands designed for retrievals of SST, LST and atmospheric properties.
Specifically, bands 3-7, 13, and 16-19 will be used to classify land-cover to infer emissivities,
band 26 will detect cirrus clouds, and thermal infrared bands 20, 22, 23, 29, 31, and 32 correct
for atmospheric effects and retrieve surface emissivity and temperature. The atmospheric
sounding channels of MODIS retrieve atmospheric temperature and water vapor profiles.
Ying Sun Term Paper – Retrieval and Application of Land Surface Temperature
4
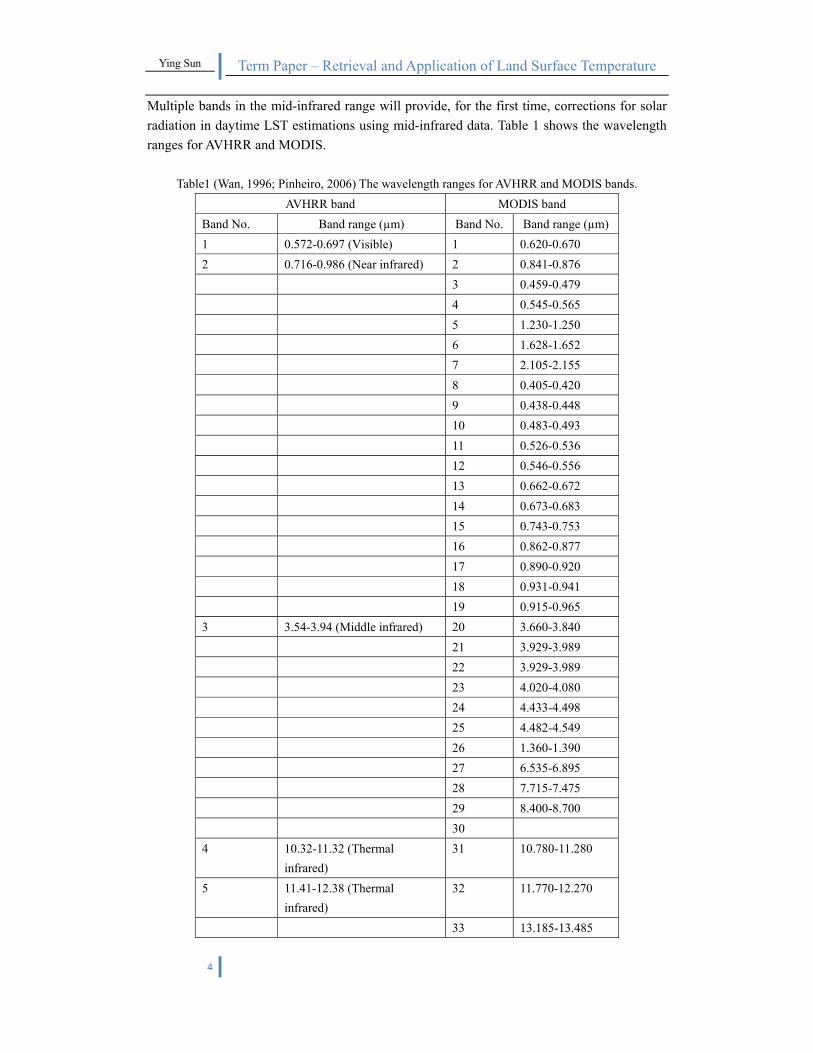
Multiple bands in the mid-infrared range will provide, for the first time, corrections for solar
radiation in daytime LST estimations using mid-infrared data. Table 1 shows the wavelength
ranges for AVHRR and MODIS.
Table1 (Wan, 1996; Pinheiro, 2006) The wavelength ranges for AVHRR and MODIS bands.
AVHRR band MODIS band
Band No. Band range (µm) Band No. Band range (µm)
1 0.572-0.697 (Visible) 1 0.620-0.670
2 0.716-0.986 (Near infrared) 2 0.841-0.876
3 0.459-0.479
4 0.545-0.565
5 1.230-1.250
6 1.628-1.652
7 2.105-2.155
8 0.405-0.420
9 0.438-0.448
10 0.483-0.493
11 0.526-0.536
12 0.546-0.556
13 0.662-0.672
14 0.673-0.683
15 0.743-0.753
16 0.862-0.877
17 0.890-0.920
18 0.931-0.941
19 0.915-0.965
3 3.54-3.94 (Middle infrared) 20 3.660-3.840
21 3.929-3.989
22 3.929-3.989
23 4.020-4.080
24 4.433-4.498
25 4.482-4.549
26 1.360-1.390
27 6.535-6.895
28 7.715-7.475
29 8.400-8.700
30
4 10.32-11.32 (Thermal
infrared)
31 10.780-11.280
5 11.41-12.38 (Thermal
infrared)
32 11.770-12.270
33 13.185-13.485

Ying Sun Term Paper – Retrieval and Application of Land Surface Temperature
5
34 13.485-13.785
35 13.785-14.085
36 14.085-14.385
2.1 Generalized Split- Window Algorithm for Retrieving LST (Wan, 1996)
Wan proposes a generalized split-window method for retrieving land-surface temperature
(LST) from AVHRR and MODIS data. Accurate radiative transfer simulations show that the
coefficients of this LST algorithm depends on viewing angle, if we are to achieve a LST
accuracy of about 1 K for the whole scan swath range and for the ranges of surface
temperature and atmospheric conditions over land, which are much wider than those over
oceans. They obtain these coefficients from regression analysis of radiative transfer
simulations, and analyze sensitivity and error over wide ranges of surface temperature and
emissivity and atmospheric water vapor abundance and temperature. Simulations show that
when atmospheric column water vapor increases and viewing angle is larger than 45̊°, it is
necessary to optimize the split-window method by separating the ranges of the atmospheric
column water vapor, lower boundary temperature, and surface temperature into tractable
subranges. The atmospheric lower boundary temperature and (vertical) column water vapor
values retrieved from MODIS atmospheric sounding channels can be used to determine the
range for the optimum coefficients of the split-window method. This viewing-angle
dependent algorithm not only retrieves LST more accurately, but it is also less sensitive than
viewing-angle independent LST algorithms to the uncertainty in the band emissivities of the
land-surface in the split-window and to the instrument noise. The major difficulty in using
this generalized split-window LST algorithm is how to assign appropriate band emissivities
for each pixel in real processing. It is necessary to enhance the emissivity knowledge base of
natural terrestrial materials and to develop new algorithms for simultaneously retrieving
surface emissivities and temperature for land covers with variable emissivities. The
methodology is shown below.
A. View-Angle ( v ) Dependent LST Algorithm
2)
1(
2)
1( 21
232121
2321
TTBBB
TTAAACTs
(1)
Where C , 1A , 2A , 3A , 1B , 2B , 3B are coefficient, depended on View-angle v . In
NOAA11 AVHRR, band 4 and band5 are used in the split-window LST algorithms,
representing 1T and 2T ; while in MODIS band 31 and 32 are used in this algorithms.
B. Using Column Water Vapor in the v Dependent LST Algorithm
Simulations also indicate that although the rms LST error is smaller than 1 K, the maximum
LST error exceeds 2 and 3.5K at viewing angles 45°and 69°. They further improve the
LST accuracy by separating the column water vapor range into 1 or 0.5 cm intervals. If the

Ying Sun Term Paper – Retrieval and Application of Land Surface Temperature
6
LST algorithm for column water vapor intervals of 0.5 cm is used, the rms error does not
exceed 0.5-1 K and the maximum error does not exceed 1.7 K, even at viewing angle 69°. In
the viewing angle range up to 45°, the rms error does not exceed 0.27 K and the maximum
error does not exceed 0.91 K.
C. Using Atmospheric Lower Boundary Temperature in the v Dependent LST Algorithm
When column water vapor in a tropical atmosphere is greater than 4 cm, the atmospheric
transmission functions in AVHRR bands 4 and 5 reduce to 0.22 and 0.12, respectively, and
LST retrieval from satellite TIR data becomes difficult at large viewing angles. The maximum
temperature deficit in AVHRR band 4 may be as large as 27 K. In order to get a quantitative
assessment of the retrieved LST accuracy, they developed two sets of 8-dependent algorithms
for two ranges of the atmospheric lower boundary temperature, one from 300-310 K, the
other from 300-305 K. The rms and maximum errors of the LST algorithm for the wider Tair
range may be larger than 1 K and 3.8 K, respectively. The maximum LST error can be
reduced by 1-2 K if the 300-305 K LST algorithms is used.
2.2 Comparison of split-window algorithm and day-night algorithm to analyze MODIS
data (Workshop 2008)
In the workshop, one study shows that for the MODIS data, there are two different LST
retrieval algorithms being used to retrieve LST: the split-window algorithm, where the surface
emissivity is specified (as a function of a land surface classification), and the physically based
day-night algorithm, where the day-night contrast at each location is used to separate
temperature and emissivity values. Results comparing these two approaches show that there is
too much variation in the retrieved emissivities from the latter method. Although the
coefficients for this type of algorithm are determined from radiative model simulations of
atmospheric effects, ancillary atmospheric data are not used explicitly. Evaluation of these
products, such as the new ones based on MODIS remains difficult because of the lack of in
situ datasets covering a comprehensive range of regimes. A specific example of this difficulty
was illustrated for Greenland ice sheet surface temperature. Evaluation of the satellite surface
temperature was possible in this case but required determination of a good statistical
relationship with near-surface air temperatures being measured at the surface. Uncertainty
was associated not only with use of this relationship but with the comparison of point to area
measurements.
2.3 A daily long term record of NOAA-14 AVHRR LST over Africa (Pinheiro et al, 2006)
Pinheiro et al sets up a methodology for developing a six-year daily (day and night)
NOAA-14 AVHRR LST dataset over continental Africa for the period 1995 through 2000. In
this study, they describe the processing methodology used to convert the Global Area
Coverage Level-1b data into LST and collateral data layers, such as sun and view geometries,
cloud mask, local time of observation, and latitude and longitude. This paper uses the
Ulivieri’s (Ulivieri, C. et al, 1994) split window algorithm to determine LST values. The

Ying Sun Term Paper – Retrieval and Application of Land Surface Temperature
7
processing chain is developed within the Global Inventory Modeling and Mapping System
(GIMMS) at NASA's Goddard Space Flight Center (Fig.1).
This algorithm requires as input values of surface emissivity in AVHRR channels 4 and 5.
Thus, they develops continental maps of emissivity (Fig.2) using an ensemble approach that
combines laboratory emissivity spectra, MODIS-derived maps of herbaceous and woody
fractional cover, and the UNESCO FAO soil map.
The AVHRR-derived LST map over Africa is shown in Fig. 3. A preliminary evaluation of the
resulting LST product over savanna woodland in South Africa showed a bias of less than 0.3K
and an uncertainty of less than 1.3 K for daytime retrievals (less than 2.5 K for night). More
extensive validation is required before statistically significant uncertainties can be determined.
Pinheiro concludes that the LST production chain described here could be adapted for any
wide field of view sensor (e.g., MODIS, VIIRS), and the LST product may be suitable for
monitoring spatial and temporal temperature trends, or as input to many process models (e.g.,
hydrological, ecosystem).
Fig.1 Schematic representation of NOAA-14 AVHRR GIMMS LST data set processing system for the
thermal infrared channels

Ying Sun Term Paper – Retrieval and Application of Land Surface Temperature
8
Fig.2 (a) Ensemble emissivity maps for AVHRR channel 4 and (b) channel 5
Fig.3 Composite AVHRR-derived land surface temperature for (a) July 1996 (overpass around 1:30
PM) and (b) July 2000 (overpass around 4:00 PM). The compositing process (maximum temperature
over the month was retained) removed most of the clouds. However, some clouds are visible (blue
areas) near the equator in (b). We did not use information available in our product’s auxiliary
cloudiness field for this demonstration.
2.4 Analysis of Land Skin Temperature Using AVHRR Observations (Jin, 2003)
Jin develops a long-term skin temperature diurnal cycle dataset (LSTD) from AVHRR
observations. This dataset covers global snow-free land areas and spans from 1981 to 1998.
This 18 year dataset can be used to estimate the changes of skin temperature, to study
interactions in the land–biosphere–atmosphere system, and to evaluate model simulations.
This study first identifies the main challenges in developing a LST from AVHRR. These
include orbit drift, uncertainties in skin temperature retrieval (such as that induced by
unknown surface emissivity), unknown cloud occurrence during a day other than at observing

Ying Sun Term Paper – Retrieval and Application of Land Surface Temperature
9
time, lack of LST diurnal cycle measurement, and volcanic eruption. And Jin also proposes
approaches to these problems.
A. Orbit drift
AVHRR skin temperature measurements can’t be directly used in climate change studies
because of orbit drift in the NOAA satellites, particularly, NOAA-7, -9, -11, and -14 (Fig.4)
over the course of these satellites’ lifetimes (Jin and Treadon 2003). This orbit drift effect
results in a significant cooling effect on LST measurements. A physically-based “typical
pattern technique” is applied to remove the orbit drift effect from LST. The GCM-generated
typical patterns of the LST diurnal cycle are functions of vegetation type, season, and latitude,
and are combined with satellite observations to remove the cooling effect. Applying this
methodology to 18 year of AVHRR (1981–1998) LST observations evidently yields an
improved skin temperature dataset suitable for climate change study (Jin and Dickinson
2002).
Fig.4 Schematic diagram of the equatorial crossing time for NOAA-9, -10, -11, -12, -14, -15, and
-16. The y direction is local equatorial crossing time, and the x direction is time of year. NOAA-7
is not shown here, but has a similar orbit drift as the afternoon satellites of NOAA-9, -11 and -14.
B. Emissivity uncertainty in skin temperature retrieval
In the retrieval of temperature, corrections for atmospheric effect are usually required even in
the most transparent spectral windows for clear skies. The split-window technique mentioned
before is the most widely used correction technique for AVHRR skin temperature retrieval.
However, emissivity is one of the largest uncertainty sources in this technique. The currently
used approach is to set two emissivities for channels 4 and channel 5, respectively, and
assumes they do not vary over the globe, which is unrealistic and induce errors in LST
retrieval. In this study, Jin utilized MODIS-based emissivity in the LSTD process which is

Ying Sun Term Paper – Retrieval and Application of Land Surface Temperature
10
much more realistic than simply assuming two fixed spectral emissivities for AVHRR
channels 4 and 5 over the globe, a treatment due to the lack of emissivity measurements. The
MODIS LST product MOD11B1 provides emissivities in bands 20, 22, 23, 29, and 31–32,
from which broadband emissivity can be inferred (Jin and Liang 2003). Fig.5 shows that
emissivity has obvious variations over the globe, because it is a function of soil and
vegetation conditions.
Fig.5 Global distribution of MODIS-observed land surface emissivity. It is broadband emissivity
converted from MODIS spectral emissivity using MODTRAN. Data for oceans, Antarctica, and some
equatorial deserts that are lower than 0.8 are missing values.
C. Cloud contamination
Cloud contamination causes two problems in LSTD: an inability to directly measure LST
when the surface is obscured by clouds, that is, the “cloudy pixel problem,” and the
appearance of cloud formation during the day at times other than when the measurements
were made. Jin and Dickinson (2000) designed a method to calculate LST for a satellite
cloudy pixel. This treatment is a hybrid technique of “neighboring pixel” and “surface air
temperature” techniques. The principle is based on the surface energy balance to infer a
cloudy pixel’s LST from the neighboring clear pixel’s LST and overlying Tair.
D. Lack of diurnal cycle
In general, polar-orbiting satellites observe a given pixel twice per day, which means
available LST observations for most land surfaces are twice per day. Jin and Dickinson (Jin &
Dickinson, 1999) develope an approach to interpolate AVHRR twice-per-day LST into a
diurnal cycle. In this approach, the climatological diurnal cycles of LST are derived from the
most advance model, NCAR CCM3 BATS, which served as the information base for the most
likely behavior of diurnal cycle. Typical LST patterns are functions of land cover, latitude,
season, and soil moisture conditions, and are archived in lookup tables.

Ying Sun Term Paper – Retrieval and Application of Land Surface Temperature
11
E. View angle
View angle is another possible uncertainty source for LST retrieval. However, the view-angle
effect may be ignored when the angle is less than 45° (Wan & Li 1997). Similarly, when
averaged over several pixels, the view-angle effect is also reduced. Emissivity may also vary
with the viewing angle (Rees & James, 1992). Currently, no acceptable method exists to
accurately correct the view angle effect. Their quality control technique for comparing the
change of 2-m Tair with that of LST can, to some degree, remove bad pixels severely affected
by view-angle effect.
Finally, a long-term skin temperature diurnal cycle dataset is developed which covers global
snow-free land areas and spans from 1981 to 1998. Also, some validation process was done
(Fig.6). As mentioned before, this 18 year dataset can be used to estimate the changes of skin
temperature, to study interactions in the land–biosphere–atmosphere system, and to evaluate
model simulations.
Fig.6 Comparison of (a) TOVS skin temperature with (b) AVHRR-based LSTD
diurnal-averaged LST. Both AVHRR and TOVS data are the monthly mean for Jul 1993. The
resolution of AVHRR LSTD data is 0.5°*0.5° and TOVS data is 1°*1°. The ocean LST
information is purposely kept to show the strength of TOVS data, that is, it covers high
latitudes and ocean surface.
2.5 Estimation of LST from a GOES-8 (Sun 2003)
The temporal measurement frequency of the polar orbiting satellite systems NOAA-AVHRR
is 2 times per day, inadequate for many applications. Therefore, Land Surface Temperature
Diurnal Cycle (LSTD), the important element of the climate system and is not captured by the
polar orbiting satellites. As mentioned before, Jin and Dickinson (Jin and Dickinson, 1999)
propose a method to interpolate the derived surface temperatures from the AVHRR
instruments into a diurnal cycle. However, the spatial resolution of CCM3/BATS is 2.8°
(about 280 km), too low for many applications. However, geostationary satellites provide
diurnal coverage, which makes them attractive for deriving information on LST. The
geostationary satellite GOES observes the surface continuously at a nadir pixel resolution of
about 4 km (Menzel & Purdom, 1994).

Ying Sun Term Paper – Retrieval and Application of Land Surface Temperature
12
Two algorithms are developed and applied to observations from the Geostationary
Operational Environmental Satellite (GOES) to enable frequent estimate of Land Surface
Temperature (LST) representing the diurnal cycle. Both algorithms are based on radiative
transfer theory: one is a new split window algorithm, while the other is a three-channel
algorithm. The three-channel LST algorithm aims to improve atmospheric correction by
utilizing the characteristics of the middle-infrared (MIR) band. Effects of both the atmosphere
and the surface emissivity are accounted for. The simulations from the proposed algorithms
are compared with previously developed generalized split window algorithm, and a split
window algorithm with water vapor correction.
The advanced split-window algorithm (for day time LST retrieval)
The developed split window LST algorithm, referred to as advanced split window, is one
where a separate equation is established for each surface type by using 11.0 and 12.0 µm split
window. Considering that when the satellite viewing angle increases, the optical path
increases and the atmospheric attenuation increases, Sun added a zenith angle correction term
(secθ-1) to LST retrieval equation. A second term of the brightness temperature difference
(T11 - T12)2 was added to further remove the atmospheric effect (eq.2).
)1)(sec())(()()()()( 42
121131221110 kaTTkaTkaTkakakTs (2)
Where k is the index of the surface types and θ is the satellite viewing angle.
The three-channel LST algorithm (for night time LST retrieval)
The three-channel algorithm developed may be applied to a combination of any three thermal
infrared channels. The three-channel LST algorithm aims to improve atmospheric correction
by utilizing the characteristics of the middle-infrared (MIR) band. Effects of both the
atmosphere and the surface emissivity are accounted for.
33
352
2
251
1
143322110
111i
i
ii
i
ii
i
iiiis TaTaTaTaTaTaaT
(3)
The retrieval scheme for LST or LSTD from the GOES-8 observations is presented in Fig.7.
The simulations from the proposed algorithms are compared with previously developed
generalized split window algorithm, and a split window algorithm with water vapor correction.
During daytime, the proposed new split window algorithm gives the best LST retrievals,
while during night time, the proposed three-channel algorithm gives the best retrievals, both
within a rms error of less than 1 K and without a significant bias. Evaluations against the
Atmospheric Radiation Measurement (ARM) observations of radiometric surface
temperatures and Surface Radiation Network (SURFRAD) observations of outgoing long
wave (LW) radiation indicate that LST can be determined from the actual GOES-8
observations within an rms accuracy of about 1–2 K, standard error of about 1 K, and bias of
less than 1 K. When evaluated against the North Carolina Agricultural Research Service
(NCARS) soil temperature as observed at depth of 8 in. and against air temperature
observations, the amplitude of the retrieved LST is found to be significantly greater than that

Ying Sun Term Paper – Retrieval and Application of Land Surface Temperature
13
of the observed soil temperature, lower than the nighttime air temperature, and higher than the
daytime air temperature. When the soil observations are ‘‘corrected’’ to account for the depth
difference, they are in good agreement with the LST retrieved from the satellite observations.
This indicates that observations of soil temperature, which are more readily available than
measurements of ‘‘skin’’ temperatures, can be useful in evaluating satellite-based estimates.
The LST retrieved from both of the proposed algorithms and from a NOAA/NESDIS
algorithm, are generally very close to the converted skin temperature from the SURFRAD
surface outgoing LW radiation. In most cases, the newly proposed algorithm shows better
agreement with ground observations.
Fig.7 Schematic Flow of LST estimation
3. Modeling of LST
The surface temperature in global and regional models is crucially important because of its
relevance to the computations of the turbulent heat fluxes as well as the terrestrial radiation.
Most models calculate this variable LST, e.g. the global climate model (GCM) land surface
schemes, the NOAA National Centers for Environmental Prediction (NCEP) model, and the
National Center for Atmospheric Research (NCAR) Community Land Model version 2
(CLM2) (Jin 2005). It is important to understand that the LST calculation comes down to
solving a budget or balance equation, and that a multitude of parameterizations ultimately
affect the resulting values of temperature, including the surface and boundary layer
parameterizations, vegetation and heterogeneity, quality of clouds (both in quantity and
optical properties) and soil moisture through antecedent precipitation. Each model has its own
parameterization and land specification data, and usually its own grid structures. While the
land parameterizations affect the simulated data, equally important is the forcing. For example,
there are wide variations in the amount and properties of clouds feedback into the near surface
air temperature and boundary layer (or vice versa). Even relatively homogeneous regions,
such as arid deserts and glacial surfaces, can show large differences compared with remotely
sensed LST (workshop, 2008).

Ying Sun Term Paper – Retrieval and Application of Land Surface Temperature
14
3.1 Improvement of Land Surface Emissivity Parameter for Land Surface Models (Jin,
2006)
Conventionally, land surface emissivity ε is simply set as a constant in most models due to
many uncertainties involved, e.g. GCM land surface schemes, NCEP model, and NCAR
CLM2. This is the so-called constant-emissivity assumption. To better simulate the land
surface climate, accurate broadband emissivity data are required as model inputs. This study
demonstrates that the constant-emissivity assumption induces errors in modeling the surface
energy budgets; especially over large arid and semiarid areas where ε is far smaller than unity.
One feasible solution to this problem is to apply the satellite-based broadband emissivity into
land surface models.
MODIS measures spectral emissivitiesε in six thermal infrared bands. The empirical
regression equations have been developed in this study to convert the spectral emissivities to
broadband emissivity required by land surface models. The linear relationship between
broadband emissivity ε and MODIS spectral emissivities εi through regression analysis:
323129148 5256.04606.00139.0 (4)
Although MODIS has four bands in 8- 12μm (bands 29–32), not all of them are incorporated
in the formula above because of their correlation and large uncertainties in estimating the
spectral emissivity at band 30. The emissivity map is shown in Fig.8
Fig. 8 (a) MODIS broadband emissivity for January 2003. The broadband emissivities are derived from
the MODIS spectral band emissivities using a regression equation–based MODTRAN simulation. The
resolution of original MODIS emissivity data is 1 km and here is averaged to the T42 resolution of the
climate model. (b) Same as in (a), but for July 2001.
The observed emissivity data show strong seasonality and land-cover dependence.
Specifically, emissivity depends on surface-cover type, soil moisture content, soil organic
composition, vegetation density, and structure. For example, broadband ε is usually around
0.96–0.98 for densely vegetated areas (LAI > 2), but it can be lower than 0.90 for bare soils
(e.g., desert). To examine the impact of variable surface broadband emissivity, sensitivity
studies were conducted using offline CLM2 and coupled NCAR Community Atmosphere
Models, CAM2–CLM2. These sensitivity studies illustrate that large impacts of surface ε
occur over deserts, with changes up to 1°–2°K in ground temperature, surface skin
temperature, and 2-m surface air temperature, as well as evident changes in sensible and

Ying Sun Term Paper – Retrieval and Application of Land Surface Temperature
15
latent heat fluxes (Fig.9)
Fig.9. Coupled CAM2–CLM2 simulated emissivity impact on surface temperature (K) for two random
days in September. The difference is the control run minus the sensitivity run. The control run uses
CLM default soil emissivity (ε= 0.96), and sensitivity run uses satellite-observed emissivity at T42
resolution.
3.2 Estimation of large-scale evaporation fields based on assimilation of remotely sensed
LST (Sini, 2008)
High quality observations provide a constraint on the model development. Data assimilation
ultimately confronts the model with the observations. Assimilation is the process of finding
the model representation which is most consistent with the observations (Lorenc, 1995). In
essence, data assimilation merges a range of diverse data fields with a model prediction to
provide that model with the best estimate of the current state of the natural environment so
that it can then make more accurate predictions.
In this paper, Sini proposes a model for surface energy fluxes estimation based on the
assimilation of land surface temperature from satellite. The data assimilation scheme
combines measurements and models to produce an optimal and dynamically consistent
estimate of the evolving state of the system. The assimilation scheme takes advantage of the
synergy of multisensor-multiplatform observations in order to obtain estimations of surface
fluxes, flux partitioning, and surface characteristics. The model is based on the surface energy
balance and bulk transfer formulation. A simplified soil wetness model, which is a filter of
antecedent precipitation, is introduced in order to develop a more robust estimation scheme.

Ying Sun Term Paper – Retrieval and Application of Land Surface Temperature
16
Fig10 . Land Surface Data Assimilation Process
This approach is implemented and tested over the Southern Great Plain field experiment
domain. Comparisons with observed surface energy fluxes and soil moisture maps have
shown that this assimilation system can estimate, when compared with the ground truth
observations, the surface energy balance and the partitioning among turbulent heat fluxes. The
introduction of the simplified soil wetness model forced by precipitation data improved
evaporative fraction estimation. Further research is still required to analyze the reliability of
retrieved fluxes in periods where radiation is the limiting factor for latent heat flux.
3.3 Assimilation satellite data over land for NWP applications (Bart, 2002)
Land surface parameterizations in Numerical Weather Prediction (NWP) describe the
exchange of energy and water at the land-atmosphere interface. NWP models need
observations for initialization, adjustment of the forecast, and parameter calibration. Remotely
sensed land surface temperature data are considered to contain valuable information on the
presence and nature of vegetation, heat fluxes, and the moisture availability. This paper
describes a case study in which data from the Along Track Scanning Radiometer (ATSR)
instrument on board the ERS-2 satellite are used to estimate component vegetation and soil
temperature, and subsequently to update prognostic variables and roughness fields in a limited
area NWP.

Ying Sun Term Paper – Retrieval and Application of Land Surface Temperature
17
In a variational assimilation scheme, the NWP model is forced to match the observed
component temperatures by changing both the soil moisture content and the aerodynamic
roughness for the heat exchange of the bare ground component. It appeared that the optimal
solution differed significantly for the two regions. For The Netherlands, changing the
aerodynamic roughness did not affect the correspondence to observations, and soil moisture
had to be changed to increase the overall model performance. For the Spanish case, in
contrast, aerodynamic roughness had to be changed significantly. The Spain case study was
extended by analyzing a time series of ATSR-1 and ATSR-2 data. The evaluation of results
focuses on the temporal variability of aerodynamic roughness for heat transport.
3.4 Limitations in implementing LST assimilation (workshop 2008)
While surface temperature assimilation has been studied for many years, there still exist
numerous limitations in implementing LST assimilation to the best possible capability. Data
assimilation assumes that the differences between the model and observation are not biased.
However, systematic uncertainties exist among LST remote sensing products (due to variable
observation angles, cloud clearing and retrieval algorithms). Models tend to project
temperature vertically, while the satellite observations are angle dependent. Satellites observe
real surfaces while heterogeneity is parameterized in models (if at all). These inconsistencies
add uncertainty to the comparison of model and remotely sensed LST for data assimilation
purposes. While some inconsistencies are likely not to be eliminated completely, data
assimilation must account for them as a matter of practice. Furthermore, biases of LST may
have diurnal components, so that assimilation of LST requires observations that resolve the
diurnal cycle, in order to function properly. In addition, many LST data sets are for cloud-free
conditions only. While clear-sky data are useful, the strong effects of clouds on the surface
temperature are not linear and all-sky conditions need to be considered for unambiguous
results.
4. Validation and Evaluation of LST
4.1 Validation approaches overview
The main validation and evaluation approaches for LST products are (1) Using in situ data
from radiometers; (2) Using in situ proxy data and (3) Using airborne data. Proxy data are
similar data to Land Surface Temperature (LST) such as air temperature and bulk temperature
which are directly measured by the satellite but under some conditions they are a proxy for
what the satellite measures. Evaluation approaches include comparisons between LST
datasets derived from different instruments as well as comparisons between LST datasets and
modeled LST. The comparisons between datasets from different instruments included ASTER,
ATSR, MODIS and AIRS as well as differences between versions for a given instrument.
4.2 Validating MODIS land surface temperature products using long-term nighttime
ground measurements (Wang, 2007)
Ying Sun Term Paper – Retrieval and Application of Land Surface Temperature
18
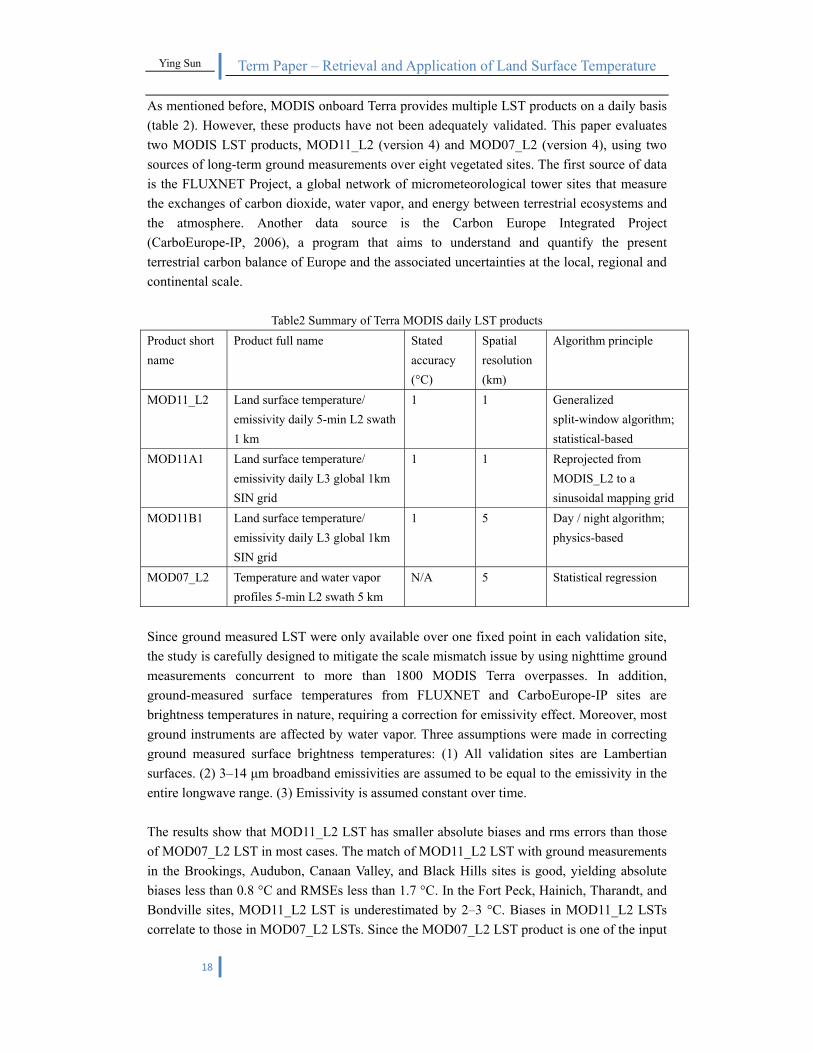
As mentioned before, MODIS onboard Terra provides multiple LST products on a daily basis
(table 2). However, these products have not been adequately validated. This paper evaluates
two MODIS LST products, MOD11_L2 (version 4) and MOD07_L2 (version 4), using two
sources of long-term ground measurements over eight vegetated sites. The first source of data
is the FLUXNET Project, a global network of micrometeorological tower sites that measure
the exchanges of carbon dioxide, water vapor, and energy between terrestrial ecosystems and
the atmosphere. Another data source is the Carbon Europe Integrated Project
(CarboEurope-IP, 2006), a program that aims to understand and quantify the present
terrestrial carbon balance of Europe and the associated uncertainties at the local, regional and
continental scale.
Table2 Summary of Terra MODIS daily LST products
Product short
name
Product full name Stated
accuracy
(°C)
Spatial
resolution
(km)
Algorithm principle
MOD11_L2 Land surface temperature/
emissivity daily 5-min L2 swath
1 km
1 1 Generalized
split-window algorithm;
statistical-based
MOD11A1 Land surface temperature/
emissivity daily L3 global 1km
SIN grid
1 1 Reprojected from
MODIS_L2 to a
sinusoidal mapping grid
MOD11B1 Land surface temperature/
emissivity daily L3 global 1km
SIN grid
1 5 Day / night algorithm;
physics-based
MOD07_L2 Temperature and water vapor
profiles 5-min L2 swath 5 km
N/A 5 Statistical regression
Since ground measured LST were only available over one fixed point in each validation site,
the study is carefully designed to mitigate the scale mismatch issue by using nighttime ground
measurements concurrent to more than 1800 MODIS Terra overpasses. In addition,
ground-measured surface temperatures from FLUXNET and CarboEurope-IP sites are
brightness temperatures in nature, requiring a correction for emissivity effect. Moreover, most
ground instruments are affected by water vapor. Three assumptions were made in correcting
ground measured surface brightness temperatures: (1) All validation sites are Lambertian
surfaces. (2) 3–14 μm broadband emissivities are assumed to be equal to the emissivity in the
entire longwave range. (3) Emissivity is assumed constant over time.
The results show that MOD11_L2 LST has smaller absolute biases and rms errors than those
of MOD07_L2 LST in most cases. The match of MOD11_L2 LST with ground measurements
in the Brookings, Audubon, Canaan Valley, and Black Hills sites is good, yielding absolute
biases less than 0.8 °C and RMSEs less than 1.7 °C. In the Fort Peck, Hainich, Tharandt, and
Bondville sites, MOD11_L2 LST is underestimated by 2–3 °C. Biases in MOD11_L2 LSTs
correlate to those in MOD07_L2 LSTs. Since the MOD07_L2 LST product is one of the input

Ying Sun Term Paper – Retrieval and Application of Land Surface Temperature
19
parameters to the MOD11_L2 LST algorithm, biases in MOD11_L2 LSTs may be influenced
by biases in MOD07_L2 LSTs. The errors in both products depend weakly on sensor view
zenith angle but are independent of surface air temperature, humidity, wind speed, and soil
moisture.
4.3 An assessment of remotely sensed land surface temperature (Isabel, 2008)
In this paper, LST is estimated from the spinning enhanced visible and infrared imager
(SEVIRI) onboard Meteosat, making use of a generalized split-windows algorithm. Then
SEVIRI LST is compared with retrievals from MODIS, collocated in space and time, for three
10°* 10° areas (Iberian Peninsula, Central Africa, and the Kalahari), and for six 7-day periods
between July 2005 and May 2006.
The result shows that the overall SEVIRI LSTs are warmer than MODIS values, with
maximum discrepancies generally observed for daytime. The mismatches between the two
satellite retrievals are then analyzed in terms of (1) satellite viewing angle differences, (2)
surface topography, and (3) surface type. Daytime discrepancies are strongly impacted by
differential heating rates of elements within a pixel (e.g., vegetation types, bare ground),
leading to a relatively wide range of MODIS-SEVIRI LST differences, with strong
dependency on the MODIS view zenith angle. In contrast, average nighttime discrepancies
are generally below 2°C.
Fig.11 Land SAF LST (°C) obtained for 14 September 2005 for (a) 0 UTC, (b) 6 UTC, (c) 12 UTC,
and (d) 18 UTC. The Land SAF LST is retrieved for four areas within the Meteosat disk (Europe,
Northern Africa, Southern Africa, and South America). Missing values (white areas) correspond to
land pixels beyond the maximum viewing angle admitted for the LST algorithm (57.5°) or covered by
clouds.
Ying Sun Term Paper – Retrieval and Application of Land Surface Temperature
20
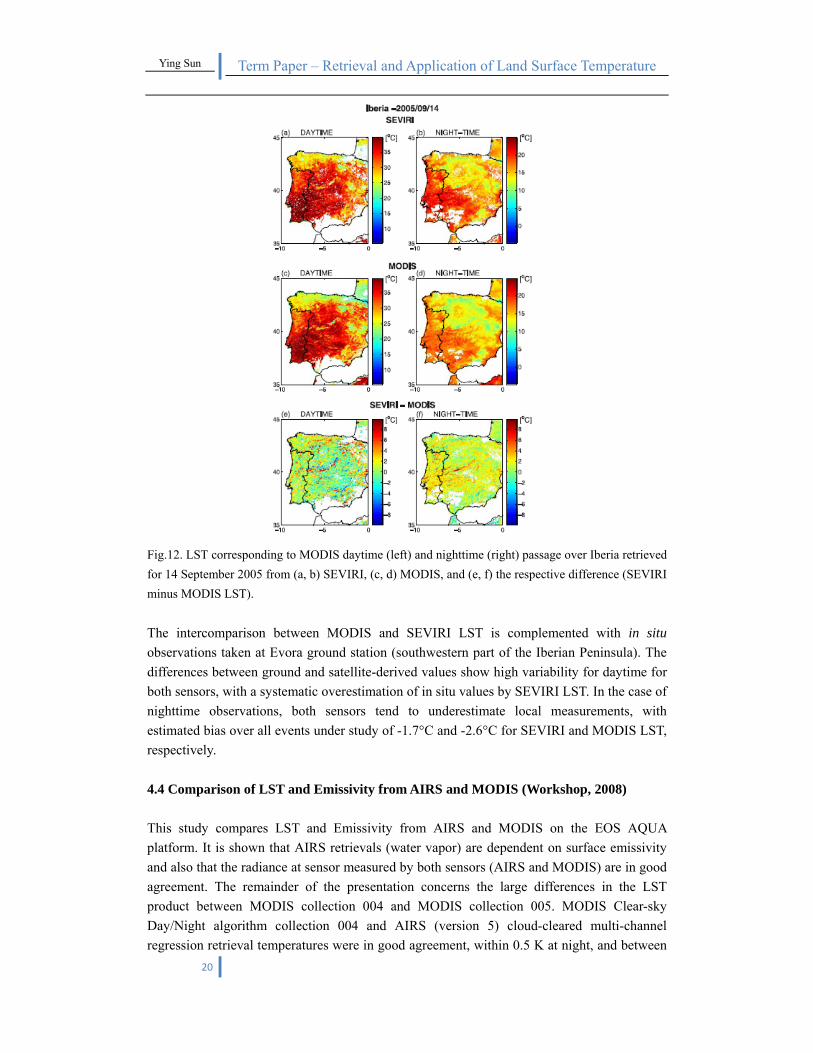
Fig.12. LST corresponding to MODIS daytime (left) and nighttime (right) passage over Iberia retrieved
for 14 September 2005 from (a, b) SEVIRI, (c, d) MODIS, and (e, f) the respective difference (SEVIRI
minus MODIS LST).
The intercomparison between MODIS and SEVIRI LST is complemented with in situ
observations taken at Evora ground station (southwestern part of the Iberian Peninsula). The
differences between ground and satellite-derived values show high variability for daytime for
both sensors, with a systematic overestimation of in situ values by SEVIRI LST. In the case of
nighttime observations, both sensors tend to underestimate local measurements, with
estimated bias over all events under study of -1.7°C and -2.6°C for SEVIRI and MODIS LST,
respectively.
4.4 Comparison of LST and Emissivity from AIRS and MODIS (Workshop, 2008)
This study compares LST and Emissivity from AIRS and MODIS on the EOS AQUA
platform. It is shown that AIRS retrievals (water vapor) are dependent on surface emissivity
and also that the radiance at sensor measured by both sensors (AIRS and MODIS) are in good
agreement. The remainder of the presentation concerns the large differences in the LST
product between MODIS collection 004 and MODIS collection 005. MODIS Clear-sky
Day/Night algorithm collection 004 and AIRS (version 5) cloud-cleared multi-channel
regression retrieval temperatures were in good agreement, within 0.5 K at night, and between

Ying Sun Term Paper – Retrieval and Application of Land Surface Temperature
21
0 and -1.5K during the Day, excluding snow/ice covered land. MODIS collection 005 Clear
Land Classification algorithm is found to be 0.5 to 3 K colder than collection 004 (and colder
than AIRS v5). This change is due to a stronger dependence of the day/night algorithm on the
split-window algorithm. This demonstrates that estimating surface emissivity from land cover
classification in the split-window algorithm may lead to large systematic biases in barren
areas. For example, differences of up to 8 degrees are observed in the collection 005 MODIS
LST product and the AIRS product over barren areas. This comparison may be complicated
by different footprints, uncertainties in the AIRS cloud fraction and the MODIS saturation in
bands 20 and 22.
5. Community Requirements for LST (workshop, 2008)
5.1 The requirement for LST product
The workshop identifies that the requirements for LST for the different user communities are
very different and have to be analyzed and considered separately. A compilation of the most
common uses of LST is provided in the NASA White Paper on LST and Emissivity Needs.
This document describes the state of the science of remote sensing of LST (from thermal
infrared sensors) and identifies the user communities for LST and their requirements for the
product. Specific application areas identified by that document included: (1) hazard prediction
and mitigation (including wild fire risk assessment, detection and monitoring of onset and
progression of volcanic activity, etc); (2) water management (assessment of agricultural/urban
water consumption assessment of water losses from riparian areas and reservoirs, etc); (3)
Crop management (drought/crop stress detection, irrigating scheduling, crop yield mapping /
forecasting); (4) non-renewable resource management (geothermal resource exploration,
differentiation of rock-lithologies).
Table3: LST and emissivity product requirements (source: NASA White Paper for LST&E)
Land Surface Temperature and Emissivity Earth System Data Record (LSTE-ESDR)
Subproduct Spatial
Resolution
Temporal
Resolution
Accuracy Precision Current
Data
Sources
Future
Data
Source
Global 10-20 km Hourly 0.5K 0.1-0.3K AIRS
GOES
MSG
CrIS
GOES
MSG
Regional 1-5 km 2-4 times
daily
0.5-1.0 K 0.1-0.3K MODIS
AVHRR
ATSR
VIIRS
AVHRR
ATSR
Local 30-100 m Once
every 8-16
days
0.5-1.0K 0.1-0.3K ASTER
Landsat
Emissivity 1% or better (in 8-12.5µm) and 3% or better (in 3.6-4.2µm) all resolutions

Ying Sun Term Paper – Retrieval and Application of Land Surface Temperature
22
The white paper table concentrates on current and future (planned) capabilities, while the
specific application requirements for spatial and temporal resolution of TIR imagery are listed
in Table 4. Naturally, for many of the applications, current and future satellite platforms will
not meet the requirements. However, this table is provided to emphasize the need for
administrators in regulatory, natural resources and research agencies, and government
officials and policy makers to seriously consider the benefits of having the necessary LST
capabilities to address many of the environmental and resources problems faced in the U.S.
and worldwide.
Table 4 Applications and Associated LST Target Pixel and Temporal Resolution
Application Resolution
(m)
Temporal
Sampling
Specific Requirements
National Drought Assessment 1000 1 hr Co-located veg cover info
Regional Drought Monitoring 50 1-7 day Co-located veg cover info
Agriculture Yield and Water
Use
50 1-7 day Co-located veg cover info
Weather NWP 1000 1-3 hr
Soil Moisture and Runoff 50 0.5-7 day One obs near peak or diurnal range
Climate Science 5000 1-3 hr Sensors overlap
Watersheds and Ecological
Services
50 1-7 day
Landuse and Urban Heat Island 50 0.5-30 Diurnal range useful
Fire 50 0.5-7 day Height temperatures sensitivity
Lithology and Geological
Hazards
50 0.5-7 day Diurnal range useful; High temperatures
sensitivity
Cryosphere 100 0.5-7 day
5.2 Examples of LST application
LST products have been extensively used as inputs into assimilation routines to help improve
the estimate of model state and prognostic variables. These are in turn used to improve the
understanding and quantifications of surface fluxes, water availability, to aid resources
management and improve weather forecasts. Through improved estimates of soil moisture
and evapotranspiration, LST products are also outside of assimilation schemes to monitor
drought at continental and regional scales. Following are some examples.
The first example demonstrates the use of satellite-derived observations of land surface
temperature (LST), from the SEVRI sensor, as inputs in a data assimilation scheme, aims at
retrieving parameters that describe the energy balance at the land surface .The approach uses
a parsimonious 1-D multiscale variational assimilation procedure. This assimilation scheme
has been coupled with the non-hydrostatic limited area atmospheric model RAMS, in order to
improve the quality of the energy budget at the surface in RAMS by replacing the lower

Ying Sun Term Paper – Retrieval and Application of Land Surface Temperature
23
boundary condition of the atmospheric domain.
Another example demonstrates the use of thermal infrared (TIR) data (GOES) as a valuable
remote indicator of both evapotranpiration (ET) and the surface moisture status.
Ensemble filters and LST assimilation in basin-scale hydrological models for flood
forecasting: This study evaluates the fundamental differences (threshold process, preferential
trajectories for convection and diffusion, low observability of the main state variables and
high parametric uncertainty) between distributed hydrologic models and other
geo-fluid-dynamics models, and explores them through some numerical experiments on a
continuous hydrologic model, MOBIDIC.
The research on operational regional-scale soil moisture with assimilation of satellite LST
describes the operational implementation over the Italian territory of an experimental
operational system of soil moisture monitoring, based on the assimilation of LST and other
satellite-derived products. The assimilation scheme is based on the surface energy balance.
The study Vegetation monitoring through retrieval of NDVI and LST time series from
NOAA-AVHRR historical databases simultaneously analyzes the annual evolutions of NDVI
and LST, with the purpose of a better mapping of the vegetation than when only NDVI
parameter is used.
5.3 The main challenges associated with the use of LST products for applications
The workshop specifies the challenges that hinder the widely application of LST products, as
listed below.
1) Limited number of products available
2) Difficult to ascertain exactly what is available
3) No comprehensive “catalog” of all products
In addition, for those products available:
4) Not many are operational (systematic; long-term continuation assured)
5) The majority is insufficiently validated (stratification approaches required: land
cover types, climate regimes, day vs. night)
6) Show discontinuous in space and time (cloud, orbital characteristics)
7) Insufficiently long term records
8) Inadequate latency
9) Spatial resolution/ temporal resolution dichotomy
10) May be sensor – or algorithm-specific
Specifically, when the application involves the use of models, additional challenges
are:
11) Remote Sensing products and model state variables are inherently inconstant
(vertical scale): satellite sees “skin” temperature in thin layer, whereas model

Ying Sun Term Paper – Retrieval and Application of Land Surface Temperature
24
“surface” temperature is typically a mixture of temperatures of thicker layers.
12) Satellite skin temperature and model surface temperature may be inherently
inconsistent (horizontal scale): Satellite “sees” a great variety of spatial
heterogeneity, whereas a model is limited in the spatial variability it can
represent.
13) Tskin is different from Taerodynamic (needed for energy balance calculations).
5.4 Main concerns regarding the LST products that will and will not become available
in the future
1) Lack of longevity and consistency of products
2) Lack of adequate cover of diurnal cycle
3) Lack of inter-calibrated data from data from satellite to satellite to get uniform
long term global data
4) Inadequate spatial resolution (high resolution required)
5) Limited availability of products
6) Existence of systematic biases in products
7) Lack of consistency of instrument or spectral channels across platforms
8) Inadequate accuracy to meet user needs
9) Most products are clear-sky biased
10) Inadequate cloud mask
11) Combination of polar orbiters and geostationary provides real opportunities.
12) Feasibility of multi-sensor multi-platform LST products.
5.5 Solutions to bridge the gap between science and community
1) Expand Table 4 to include the other criteria/requirements/issues and reach a final
agreement on what are the acceptable requirements
2) Determine the feasibility of generating satellite LST products for all-sky
conditions.
3) Demonstrate the usefulness of LST versus air temperature for operational systems.
Identify what additional information is provided by LST compared with Tair.
4) How can we reliably accommodate differences between LST (Tskin) and the
aerodynamic temperature (Taerodynamic) for energy balance calculations and to
compare with land surface model simulations.
5) Evaluate the relationship between air temperature and surface temperature for
different land surface types: their diurnal cycle, the diurnal range, the monthly
and annual averages, etc.
6. Summary
Remote sensing based LST are determined from thermal emission at wavelengths in either
infrared or microwave. The most popular method to retrieve LST is split window algorithm.
However, there are too many uncertainties involved, e.g. view angle effect, cloud
contamination, emissivity determination and so on. Most researches focus on reduction of

Ying Sun Term Paper – Retrieval and Application of Land Surface Temperature
25
uncertainties and to improve the retrieval accuracy. Some researches constructed the LSTD to
represent the diurnal variation of LST.
There has been tremendous progress in the development of instruments, calibration and high
level data products. Yet, an essentially interdisciplinary collaboration between those
developing the models and observation data sets could yield significant improvement in both
fields. From the models, output diagnostics, more closely representing the data recorded from
remote sensing could be derived. Since model data exists through clear and microwave LST
observations.
Validation approaches included comparisons between LST datasets derived from different
instruments as well as comparisons between LST datasets, modeled LST and in situ LST. The
comparisons between datasets from different instruments included ASTER, ATSR, MODIS
and AIRS as well as differences between versions for a given instrument.
There are still some challenges associated with the use of LST products for applications. In
addition, some uncertainties make it impossible for the future accurate LST product. Some
suggestions have been proposed to solve these problems and bridge the gap between
application community and research society.
Reference:
Dickinson, R. E., 1994: Satellite systems and models for future climate change. Future
Climates of the World: A Modelling Perspective, A. Henderson-Sellers, Ed., 16, World Survey
of Climatology, Elsevier, 27.
Wan Z. and Jeff Dozier, 1996: A Generalized Split- Window Algorithm for Retrieving
Land-Surface Temperature from Space. IEEE Trans. Geosci. Remote Sens., 34 (4), 892-905.
A.C.T. Pinheiro, R. Mahoney, J.L. Privette, and C.J. Tucker, 2006: Development of a daily
long term record of NOAA-14 AVHRR land surface temperature over Africa, Remote Sens.
Environ, 103, 153-164.
International Workshop on the Retrieval and Use of land Surface Temperature: Bridging the
Gaps, 2008.
Jin M., 2004: Analysis of Land Skin Temperature Using AVHRR Observations, Am. Meteorol.
Soc.,587-600.

Ying Sun Term Paper – Retrieval and Application of Land Surface Temperature
26
Sun D. and Rachel T. Pinker, 2003: Estimation of land surface temperature from a
Geostationary Operational Environmental Satellite (GOES-8), J. Geophys. Res.,108,
4326-4241.
Jin M., and Liang S., 2006: An Improved Land Surface Emissivity Parameter for Land
Surface Models Using Global Remote Sensing Observations, Am. Meteorol. Soc., 2867-2881.
F.Sini, G. Boni, F. Caparrini, and D. Entekhabi, 2008: Estimation of large-scale evaporation
fields based on assimilation of remotely sensed land temperature, Water Resources Research,
44, 1-15.
Bart J.J.M., van den Hurk, Li Jia, and Massimo Menenti, 2002: Assimilation of land surface
temperature data from ATSR in an NWP environment case studies with ATSR data in Spain
and The Netherlands, IEEE Trans. Geosci. Remote Sens., 36-38.
Wang W., Liang, S., and Tilden Meyers, 2007: Validating MODIS land surface temperature
products using long-term nighttime ground measurements, Remote Sens. Environ, 112,
623-635.
Isabel F. Trigo, Isabel T. Monteiro, Folke Olesen, and Ewa Kabsch, 2008: An assessment of
remotely sensed land surface temperature, J. Geophys. Res.,113, 1708-1719.
Toshi Matsui and Venkat Lakshmi, 2002: Links between Snow Cover, Surface Skin
Temperature, and Rainfall Variability in the North American Monsoon System, J. Climate, 16,
1821-1829.
Aires, F., C. Prigent, W. B. Rossow, and M. Rothstein, 2001: A new neural network approach
including first-guess for retrieval of atmospheric water vapor, cloud liquid water path, surface
temperature and emissivities over land from satellite microwave observations, J. Geophys.
Res., 106, 14887-14907.
Becker, F., & Li, Z. L. 1995. Surface temperature and emissivity at various scales: Definition,
measurement and related problems. Remote Sensing Reviews, 12, 225–253.
Hall, F. G., K. F. Huemmrich, S. J. Goetz, P. J. Sellers, and J. E. Nickeson, Satellite remote
sensing of surface energy balance: Success failures, and unresolved issues in FIFE, J.
Geophys. Res., 97, 19,061– 19,089, 1992.
Betts, A. K., J. H. Ball, A. C. M. Beljaars, M. J. Miller, and P. A. Viterbo, 1996: The land
surface-atmosphere interaction: A review based on observational and global modeling
perspectives, J. Geophys. Res., 101, 7209– 7225.
S. W. Running, C. Justice, V. Salomonson, D. Hall, J. Barker, Y. Kaufman, A. Strahler, A.
Huete, J.-P. Muller, V. Vanderbilt, Z. Wan, and P. Teillet, 1994: Terrestrial remote sensing
Ying Sun Term Paper – Retrieval and Application of Land Surface Temperature
27
science and algorithms planned for EOS/MODIS, J. Int. J. Remote Sensing, 15(17),
3587-3620.
Ulivieri, C., M. M. Castronuovo, R. Francioni, and A. Cardillo, 1994: A split-window
algorithm for estimating land surface temperature from satellites. Adv. Space Res., 14, 59–65.
Becker, F., and Z.-L. Li, 1995: Towards a local split window method over land surface. Int. J.
Remote Sens.,3, 17–33.
Jin, M,. and R. E. Treadon, 2003: Correcting the orbit drift effect on AVHRR skin temperature
measurements. Int. J. Remote Sens., 24, 1–16.
Jin, M,. and R.E Dickinson, 2000: A generalized algorithm for retrieving cloudy sky skin
temperature from satellite thermal infrared radiances. J. Geophys. Res., 105, 27 037–27 047.
Wan, Z., and Z. Li, 1997: A physics-based algorithm for retrieving land-surface emissivity
and temperature from EOS/MODIS data. IEEE Trans. Geosci. Remote Sens., 35, 980–996.
Menzel, W. P., and J. F. Purdom, 1994: Introducing GOES-I: The first of a new generation of
Geostationary Environmental Satellites, Bull. Am. Meteorol. Soc., 75, 757– 781.
Lorenc, A. C. 1995: Atmospheric Data Assimilation. Meteorological Office Forecasting
Research Div. 34, The Met Office, UK.
CarboEurope-IP. (2006). http://www.carboeurope.org.