retrieval of stratospheric background aerosol scattering coefficient from twilight polarization...
TRANSCRIPT

Retrieval of stratospheric background aerosol scatteringcoefficient from twilight polarizationmeasurements
Beiying Wu and Daren Lu
A backward Monte Carlo computation procedure has been used to simulate the intensity and degree of
polarization of the twilight sky during 1977. It was found that the single scattering approximation isapplicable for detection of stratospheric aerosols by twilight measurement during background periods.Based on the simulation, a scheme is proposed for retrieving the stratospheric aerosol scattering coefficient
utilizing the measured degree of polarization at the 0.7-jum wavelength in the zenith direction of the twilightsky. Compared with the in situ measurement, both the retrieved total optical depth and the retrieved profileof the aerosol scattering coefficient below 30 km agree reasonably well with measurements.
1. Introduction
In view of research work' that has shown abnormalwarming in the stratosphere after eruptions of Agungand El Chichon, it is possible that the enhancement ofstratospheric aerosols resulting from volcanic erup-tions may also contribute to climatic changes. Indeed,considerable effort has been made to assess the optical,radiative, and chemical properties of volcanic aerosolsand their possible climatic effects. However, thebackground state of stratospheric aerosols has re-ceived much less attention. In fact, the backgroundconcentration of stratospheric aerosols is an importantparameter not only for accurately determining the en-hancement of stratospheric aerosols after a volcaniceruption but also for numerically modeling the strato-spheric radiative and chemical processes. Further-more, as the world becomes increasingly industrial-ized, human activities have the potential to affect theglobal environment. It is, therefore, worth investigat-ing the chronological variation of stratospheric aero-sols and whether human activities have causedchanges in the background concentration.
A computer procedure has been developed for thepurpose of providing a tool for use in -studying thepropagation of visible radiation in a spherically lay-
The authors are with Chinese Academy of Sciences, Institute ofAtmospheric Physics, Beijing, China.
Received 1 August 1987.0003-6935/88/234899-08$02.00/0.©) 1988 Optical Society of America.
ered atmosphere. Employing the backward MonteCarlo method,2 this procedure3 considers the effects ofthe atmospheric refraction, Rayleigh and aerosol mul-tiple scattering as well as ozone absorption can be usedto compute the Stokes vectors of the scattered anddirect light at various receiver positions as a functionof direction. A brief description of this procedure andthe application of this procedure to simulating effectsof stratospheric aerosols after the eruption of the ElChichon volcano on the intensity and polarization oftwilight sky will be published by Wu and Lu.3
In this paper, we first present a Monte Carlo simula-tion of the intensity and polarization of twilight sky inthe zenith direction during 1977, which is regarded as avolcanically quiet or background period; next a schemeis discussed based on this simulation for retrieving thevertical profile of the stratospheric aerosol scatteringcoefficient utilizing photometer observations duringthe twilight period, and finally a retrieval test is carriedout.
11. Simulation of Skylight in 1977
The period extending more or less from mid-1977through early 1980 has been cited by several studiesusing several measurement techniques as a back-ground period when the stratospheric aerosol was freefrom major volcanically induced increases. Measure-ments4 showed that the peak concentration of strato-spheric particles with a radius >0.15,um was 10 cm- 3 in1974 immediately after the Fuego eruption and fell to aminimum of 0.7 cm- 3 in 1979. The peak concentra-tion in 1977 already fell to 1 cm-3, which indicates thatstratospheric aerosols at the beginning of 1977 were ina quasi-background condition. During the spring of1977, Coulson56 performed an extensive set of mea-
1 December 1988 / Vol. 27, No. 23 / APPLIED OPTICS 4899
surements of the polarization and intensity of twilightin the direction of the zenith at Mauna Loa Observa-tory at a height of 3400 m. Reliable data were ob-tained on 63 different days for over 350 h of continuousmeasurements of skylight intensity, degree of polariza-tion, and orientation of the plane of polarization.Nine of the very clear days that occurred during themeasurement period were selected as low turbiditydays, and average low turbidity curves were computedfrom the nine sets of data. The main criterion wasthat the zenith polarization at sunrise should be atleast 85% at X = 0.80 Aim. The following sectionsdescribe a Monte Carlo simulation of the 0.7-gm sky-light intensity, degree of polarization in the zenithdirection, and the comparison of the simulation withthe low turbidity average data measured by Coulson56
in 1977.
A. Selection of Parameters
The profiles of the Rayleigh scattering coefficientand atmospheric refraction index were calculatedbased on the U.S. Standard Atmosphere.7 The ozoneabsorption coefficient was taken from Elterman's ta-bles.8 Aerosol absorption was neglected, and the aero-sol scattering phase function was calculated from Deir-mendjian's9 Haze M distribution with mode radius r =0.05 Am. (The effect of the phase function is discussedin Sec. III. E.) Two profiles of the aerosol scatteringcoefficients were used: Profile A was calculated exact-ly according to the HANDBOOK OF GEOPHYSICSAND SPACE ENVIRONMENTS1 0 which was basedon the measurements by Junge et al. during 1959-1960; profile B was the same as profile A below 15 km,but the coefficients above 15 km were increased by afactor of 10.
B. Results and Analysis
1. Effect of Multiple ScatteringThe ratios of the scattered intensities of various
orders to first-order scattered intensity correspondingto profiles A and B are shown in Tables I and II,respectively. It is obvious that first-order scatteringdominates in these cases. The maximum intensity ofsecond-order scattering is only 9% of the first order(at a solar zenith angle of 86°). Third-order scatteredintensity is only 3% of first-order scattered intensity.As an approximation, second- and third-order scatter-ings are negligible. This is consistent with Coulson'sassertion but completely different from the situationafter the eruption of the El Chichon volcano.3
2. Evidence of Change in Stratospheric AerosolConcentration
Shown in Figs. 1 and 2 are the comparison of thesimulated degree of polarization and relative intensitywith measured values. It is clear that the simulatedintensity coincides well with measurements (Fig. 2).But the degree of polarization for profile A is consider-ably higher than measured data in the region of 0 >900, while the degree of polarization corresponding to
profile B is closer to the measured data. According toa primary computation test, the uncertainty in theaerosol size distribution is unlikely to be the cause of sogreat a difference as between the result for profile Aand measured data. Therefore, the discrepancy ismainly attributed to the enhancement of the aerosolscattering coefficient in the stratosphere resultingfrom the increase of the aerosol concentration. Itfollows that the concentration of aerosols in the springof 1977 was greater than what Junge et al. measuredduring 1959-1960 if we assume that there was no sig-nificant difference in the size distributions and refrac-tive indices of aerosols in these two cases.
There is other evidencel- 3 for the higher concen-tration in the period from 1977 to 1979. Hofmann andRosen,13 for example, concluded that "it appears thatthe 20 km aerosol level has increased by a factor of -5during the approximately 20-year period."
Several minor volcanic eruptions may be responsiblefor this increase of aerosol background concentration.For example, Fegley et al.14 reported an upper tropo-spheric aerosol layer, thought to have originated at thevolcano Nyiragonga (1.50 S, 29.20E), that appeared topenetrate the tropical tropopause in Jan. 1977. How-ever, whether there is any anthropogenic component inthe increase and whether it has influenced the radia-tion and dynamics in the stratosphere remain un-known.
The consistency of the inference derived from thepresent simulation with the measured data obtained inother ways shows that valuable information on strato-spheric aerosols is contained in the zenith polarizationdegree observed during the twilight period. However,multiple scattering usually plays an important role in
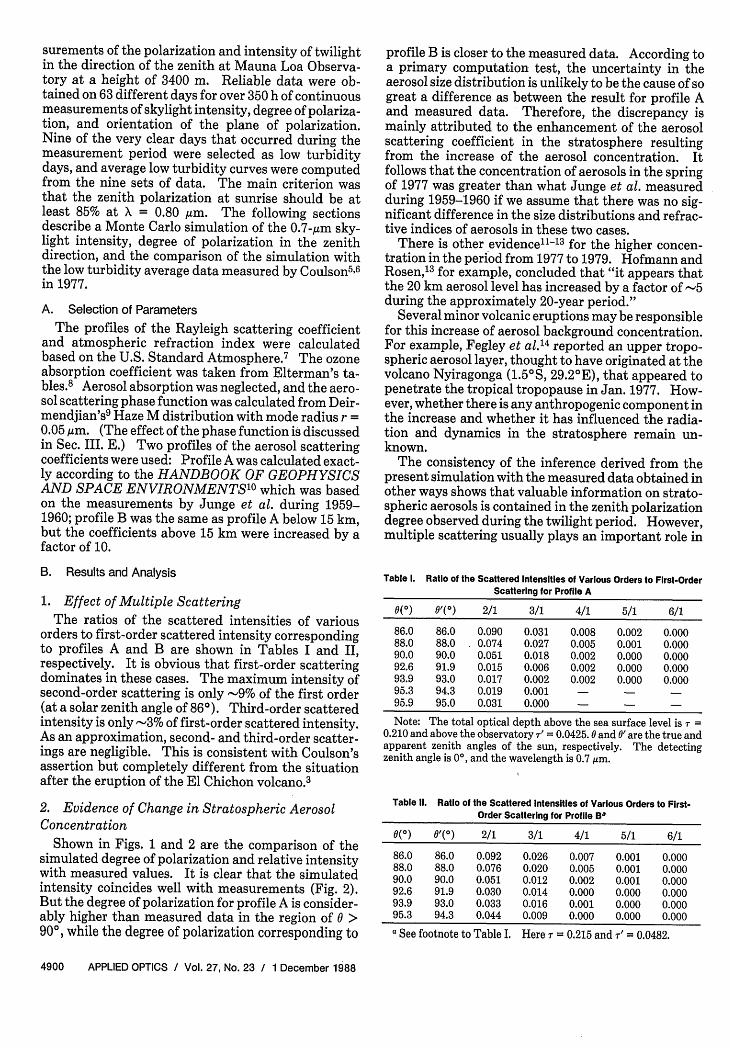
Table 1. Ratio of the Scattered Intensities of Various Orders to First-OrderScattering for Profile A
O(0) 0(o) 2/1 3/1 4/1 5/1 6/1
86.0 86.0 0.090 0.031 0.008 0.002 0.00088.0 88.0 0.074 0.027 0.005 0.001 0.00090.0 90.0 0.051 0.018 0.002 0.000 0.00092.6 91.9 0.015 0.006 0.002 0.000 0.00093.9 93.0 0.017 0.002 0.002 0.000 0.00095.3 94.3 0.019 0.001 - - -95.9 95.0 0.031 0.000 - - -
Note: The total optical depth above the sea surface level is r =
0.210 and above the observatory T' = 0.0425.0 and 0' are the true andapparent zenith angles of the sun, respectively. The detectingzenith angle is 0, and the wavelength is 0.7 um.
Table 11. Ratio of the Scattered Intensities of Various Orders to First-Order Scattering for Profile Ba
O() 0(o) 2/1 3/1 4/1 5/1 6/1
86.0 86.0 0.092 0.026 0.007 0.001 0.00088.0 88.0 0.076 0.020 0.005 0.001 0.00090.0 90.0 0.051 0.012 0.002 0.001 0.00092.6 91.9 0.030 0.014 0.000 0.000 0.00093.9 93.0 0.033 0.016 0.001 0.000 0.00095.3 94.3 0.044 0.009 0.000 0.000 0.000
a See footnote to Table I. Here = 0.215 and T' = 0.0482.
4900 APPLIED OPTICS / Vol. 27, No. 23 / 1 December 1988

100
90
80
70
601
501
4 0 -4 -8SUN EEVATION( 0)
polarization. Solid line, observation; 0, simulationfor profile A; X, for profile B.
1
1
4 0 -4 -8SUN ELEVATION (0)
but also simplifies analysis of the physical processes.As a result, it is easier to investigate the main factorsand develop an adequate retrieval scheme. In thefollowing section this simplification and resulting re-trieval scheme are described.
Ill. Retrieval of Stratospheric Aerosol ScatteringCoefficient Using a Single Scattering Approximation
A. Analytical Model for Single Scattering
If only first-order scattering is taken into consider-ation, the parallel and vertical components I, and I2 ofthe scattered light received in the direction of thezenith when the solar zenith angle is 0 can be expressedas
I1,2(0) = 2 [km(h)Pm1,m2(0,h) + ka(h)Pa,a2(0,h)
JhX ex+ fo [k,(h') + k,(h') + koz(h')]dh'
X exp+ -I [km(r) + k 0(r) + k 0z(r)]dr Iodh,r(h) J
(1)
where k = S Ca(a)n(a)da is the scattering coefficient(km-'), P(0,h) = (Pi + P2)/2 is the scattering phasefunction, the subscripts m, a, and oz represent mole-cule, aerosol, and ozone, respectively. koz is the ozoneabsorption coefficient, Io is the incident intensity(photons sr-' kmi 2/source photon kmi2), hi is theheight of the earth's shadow, h2 is the height of theupper boundary of the atmosphere, rb is the position ofthe incident solar light on the upper boundary of theatmosphere.
With the assumption that Pm and Pa do not varywith height, I, and I2 can be numerically computedwith specific vertical profiles Of km, ka, and koz. There-fore, the degree of polarization can be derived through
(2)
Comparison of the results by using Eqs. (1) and (2)with that by Monte Carlo simulation in the same atmo-spheric condition is shown in Table III. The maxi-mum relative differences of these two results are -10%for the degree of polarization and 20% for the intensity.The differences decrease as the solar zenith angle in-creases. These differences are reasonable because thecontribution by multiple scattering to the intensity is-15%, as shown by the Monte Carlo simulation. Thecomputation speed of the analytical model is morethan 180 times faster than the Monte Carlo simulation.
Fig. 2. Zenith intensity; see Fig. 1 caption.
the twilight light, which makes it difficult to analyzethe effects of various physical factors and even moredifficult to retrieve stratospheric aerosols. This studyhas shown that as a first-order approximation forbackground conditions single scattering alone can beconsidered, neglecting higher-order scattering. Thissimplification not only saves much computation time
Table lil. Comparison of Calculated Intensity and Polarization a forSingle Scattering Model with those for Monte Carlo Simulation Using the
Iterated Aerosol Profile; Optical Depth r' = 0.0513
I(X 10-2) 6
O0) M-C Single M-C Single
88.0 0.13 0.10 0.79 0.8590.0 0.089 0.075 0.82 0.8692.0 0.038 0.035 0.84 0.8594.0 0.007 0.006 0.76 0.77
1 December 1988 / Vol. 27, No. 23 / APPLIED OPTICS 4901
- ° 0
I
H- i x
- I
- X I
I
IIlll
oz0H
H
0P:
(r
Fig. 1. Zenith
z
WX
Ix
-21
.
6 = U2 - ION1 + I2)-

B. Iteration Scheme for Retrieving the Profile of theStratospheric Aerosol Scattering Coefficient
With the single scattering approximation, the de-gree of polarization in Eq. (2) can be written as
A: 2km(h)[Pm2(0,h) - Pm(0,h)] + k0 (h)[Pa2(0,h) - Pai(0,h)]jEo(EmEadh
6(0)-J| I2km(h)[Pm2(0,h) + Pmi(0,h)] + k(h)[P. 2(0,h) + Pai(0,h)]JEozEmEadh
where
E = exp (-I kdh) exp (- kdr) (4)
when 0 - 90, Pa2 - Pai ',' 0.001 and P,1,2 - P,, 0.05.Based on Ref. 8, we assumed that ka and k in the 15-25-km layer are of the same order of magnitude, but kais slightly greater than k. Therefore, the term ofaerosol scattering in the numerator can be neglectedand the numerator becomes
km[Pm2(0) - Pmi(1)], (5)
whereas in the denominator Pa2 + Pal Pm2 + P -0.05. Therefore, the degree of polarization can beapproximately expressed as
a0) - 1/[1 + ka(h*)/km(h*)] - kI(h*)Ik.(h*),
whereJ
km(h*) = 2 km(h)[Pm2(0,h) + Pmi(0,h)]EozEmEadh,
k.(h*) = 2 ka(h)[Pa2 (0,h) + Pai(0,h)IEozEmEadh,
U9
(6)
(7)
(8)
are the weighted averages of km and ha, respectively, byusing the mean theorem; h* is the height of the con-tributing region. An iteration scheme can be con-structed from Eq. (6) whereby
6(r)(0)/60(0) = k-(r+ ) Wyk(r)(h*)(9)
and where k )(h*) is the rth iterated value of theaerosol scattering coefficient, 60(0) is the observed de-gree of polarization, 6(r)(0) is the degree of polarizationderived from k(r)(h*) through Eqs. (1) and (3). Stein-horst15 has used this iteration method but for iteratingthe aerosol concentration. In the present work thescattering coefficient rather than the aerosol concen-tration is derived since the phase function is not wellknown.
C. Height of the Contributing Region
With the single scattering approximation, the heightof the region where aerosols make most of the contri-bution to the measurement at a specific solar zenithangle can be investigated further in detail.
Since 2 is much greater than I1 in the scattered light,both the intensity and degree of polarization containmainly the contribution by I2. Therefore, the heightof the contributing region of Q = I2- I can be estimat-ed by the vertical distribution of the weighting func-tion in the integration for intensity. The integrands ofEq. (1) corresponding to a set of solar zenith angles are
Fig. 3. Integrands of
6I ( X 10- 5 )'Eq. (1) correspondingzenith angles.
to a set of solar
shown in Fig. 3 as a function of height from which arelation of the solar zenith angle with the height of thecontributing region for the degree of polarization isdetermined (Table IV).
D. Retrieval Results
With the same vertical profile of the Rayleigh scat-tering coefficient, ozone absorption coefficient, andatmospheric refractive index as described in Sec. II,the iteration is carried out according to Eq. (9). The
Table IV. Relationship of Solar Zenith Angle with Height of theContributing Region for the Degree of Polarization
O() 91.0 92.0 92.5 93.0 93.5 94.0 94.5
Height (km) 10.0 13.0 16.0 19.0 21.0 22.0 24.0
4902 APPLIED OPTICS / Vol. 27, No. 23 / 1 December 1988
(3)

=20
0116
12
8
4-
10-6 10-4 102 100 102
SCATTERING COEFFICIENT( km 1)Fig. 4. Profiles of the aerosol scattering coefficient. Curve 0 is thefirst guess; curves 1 and 2 are the tenth and sixtieth iterated results
with the Haze H phase function, respectively.
U~~~~
E161-6
12
8
4
10- 0 -4 10-2 100 io2
SCATTERING COEFFICIENT(km1)
Fig. 5. Profiles of the aerosol scattering coefficient derived from
aerosol measurements. Curve 1, measurements by Junge et al. in1959-1960; curves 2 and 3, minimal and maximal values in measure-
ments by Hofmann and Rosen in 1978-1979, respectively.
90
background profile of the aerosol scattering coefficientis adopted as a first guess. The measured 0.7 -,imdegree of polarization in the zenith direction by Coul-son in 1977 is used as 60. The iterated results corre-sponding to aerosol scattering phase functions Haze Hare shown in Fig. 4. For comparison, Fig. 5 shows thevariation range of the aerosol scattering coefficientcalculated from the concentration of aerosols with ra-dius r > 0.15,gm measured by Hofmann and Rosen13 atLaramie during 1978-1979. The comparison of thedegree of polarization calculated from the iterated pro-file of the scattering coefficient with the measureddegree of polarization is depicted in Fig. 6, and theiterated optical depth along with the statistics of errorsis in Table V. The results in Table V indicate that theiterated aerosol optical depth above 11 km is morethan 10 times that of the background value calculatedfrom the measurements in 1959 by Junge et al.
It is found from Figs. 4 and 5 that below 24 km themajor part of the iterated profile falls within the varia-tion range of the measurements, whereas above 24 kmthe iterated value is slightly higher than the measure-ments. The sources of the -10-5 scattering coefficientin the 30-40-km layer cannot be explained. One of thesources might be various errors, which are discussed inthe following section. On the other hand, the spatialresolution of the twilight detection is rather low. Theretrieved profile of the aerosol scattering coefficient is
dP
1-080
0
H
EZ
.:7
r
z:0a4
50F
40 _86 88 90 92 94 96
SUN ZENITH ANGLE (0)
Fig. 6. Degree of polarization for Haze H. Curves 0, 1, and 2correspond to the profiles shown in Fig. 4, respectively; curve 3 is the
measurement.
a weighted average. It is probable that aerosol parti-cles concentrate only in a thin layer near 30 km ratherthan being distributed over upper layers. Thus thereis some uncertainty in the aerosol profile, especially
1 December 1988 / Vol. 27, No. 23 / APPLIED OPTICS 4903
1 i2
3
I U1 1

the profile above 24 km. Nevertheless the iteratedtotal optical depth of the whole column is almost inde-pendent of the shape of the aerosol profile because thedifferences between the iterated and measured degreeof polarization at solar zenith angles of <90° are takeninto consideration in the iteration convergent criteri-on. This is one of the advantages of the present itera-tion scheme.
E. Discussion
1. Effect of the Scattering Phase FunctionSince the size distribution and refractive index of
aerosols are unknown, an assumption on the aerosolscattering phase function has to be made. Two phasefunctions were selected in the iteration for estimatingthe effects on the iterated results. One is the phasefunction calculated from the Haze H size distribution,which can be regarded as similar to a stratosphericaerosol size distribution. The other is the phase func-tion from the Haze M distribution, which is generallyconsidered to be a broad tropospheric size distribu-tion. The phase functions corresponding to these sizedistribution are shown in Fig. 7. It is clear that thescattering of the Haze M phase funtion is stronger bothin the forward and backward directions than that ofthe Haze H phase function because of the existence oflarger particles in the Haze M size distribution. Theintensities and degrees of polarization correspondingto these two phase functions with the same profile ofthe aerosol scattering coefficient are shown in Table VIand Figs. 8 and 9, respectively. The difference inintensity is small, especially when the solar zenithangle is >90°. The difference in the degree of polar-ization is -0.04 for 86° < 0 < 92.5°; -0.08 for 930 < 0 <95°. The difference in the intensity resulting fromadopting different phase functions is 1 order of magni-tude less than that caused by neglecting the higher-order scattering. But the difference in the degree ofpolarization is equal to or slightly greater than thatcaused by the single scattering approximation (TableIII).
The shapes of these two iterated profiles are similar,but the aerosol optical depth above 11 km for the HazeH phase function is almost twice that for the Haze Mphase function (Table V). This test illustrates onesource of the uncertainty in the iterated profile. In theiteration, it is necessary to adopt a phase function that
Table V. Iterated Results and Errors
Max('/bo)Cases T' Tm Ta Tal (%) rms
Haze H 0.0513 0.0369 0.0198 0.00894 1.80 0.013Haze M 0.0482 0.0369 0.0167 0.00591 0.39 0.012First guess 0.0425 0.0369 0.0110 0.00065 - -
Note: T', Tm, Ta, and Tal are the total optical depth above theobservatory, the molecular optical depth above the sea surface levelthe aerosol optical depth above the observatory, and the aerosoloptical depth above 11km, respectively. 6' is the difference betweenthe observed degree of polarization 50 and that derived from theiterated aerosol profiles.
ED
Fig. 7. Aerosol6 (0)
scattering phase functions corresponding to twodifferent size distributions.
is close to the actual phase function. In fact, it isunlikely that there is ever a size distribution in thestratosphere as broad as the Haze M distribution, ex-cept during a volcanic eruption. The size distributionmay also vary with height. Since the phase functionsused in this test correspond to two extreme cases, thereal aerosol profile should lie somewhere between thetwo iterated profiles.
2. Effects of the Upper and the Lower AtmosphericLayers
Dietze16 found that a strong correlation existed be-tween the zenith polarization and the ground turbidityup to a solar zenith angle of 101°. He also found thatthe degree of polarization in the zenith direction stillvaried with the ground visibility and with the type oftropospheric air mass (the range of the variation in thedegree of polarization is -0.15) up to a solar zenithangle of 1030. Therefore, he suggested that otheratmospheric parameters be used for indicating strato-spheric dust instead of twilight observations. Theenhancement of multiple scattering resulting from theincrease of aerosols in the troposphere was regarded asthe cause of the tropospheric influence on the degree of
Table VI. Results by Using Single Scattering Model
I(X 10-2) 5O0) Haze H Haze M Haze H Haze M
86.0 0.12 0.12 0.87 0.8388.0 0.10 0.10 0.88 0.8490.0 0.077 0.077 0.89 0.8591.0 0.060 0.060 0.90 0.8692.0 0.036 0.036 0.89 0.8592.5 0.027 0.026 0.88 0.8393.0 0.018 0.018 0.84 0.7893.5 0.012 0.011 0.81 0.7394.0 0.0066 0.0065 0.78 0.7094.5 0.0036 0.0035 0.79 0.7295.0 0.0015 0.0015 0.85 0.7996.0 0.00019 0.00019 0.98 0.98
4904 APPLIED OPTICS / Vol. 27, No. 23 / 1 December 1988
20'-4
16
12-
8-
4-
10 -6 4 2 10 1 2
SCATTERING COEFFICIENT(km1)
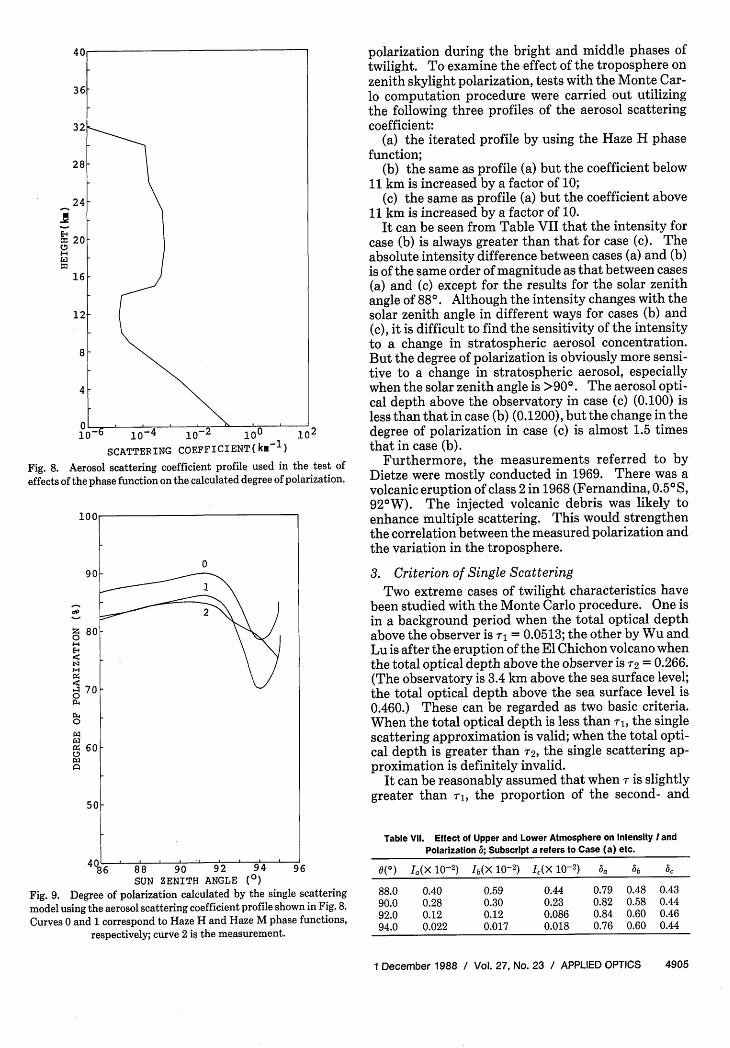
Fig. 8. Aerosol scattering coefficient profile used in the test of
effects of the phase function on the calculated degree of polarization.
100
09 0 8
2~~~~~~~E-I
-
- 70-0
0
60-
50-
8 6 88 90 92 9'4 96SUN ZENITH ANGLE (0)
Fig. 9. Degree of polarization calculated by the single scatteringmodel using the aerosol scattering coefficient profile shown in Fig. 8.
Curves 0 and 1 correspond to Haze H and Haze M phase functions,respectively; curve 2 is the measurement.
polarization during the bright and middle phases oftwilight. To examine the effect of the troposphere onzenith skylight polarization, tests with the Monte Car-lo computation procedure were carried out utilizingthe following three profiles of the aerosol scatteringcoefficient:
(a) the iterated profile by using the Haze H phasefunction;
(b) the same as profile (a) but the coefficient below11 km is increased by a factor of 10;
(c) the same as profile (a) but the coefficient above11 km is increased by a factor of 10.
It can be seen from Table VII that the intensity forcase (b) is always greater than that for case (c). Theabsolute intensity difference between cases (a) and (b)is of the same order of magnitude as that between cases(a) and (c) except for the results for the solar zenithangle of 880. Although the intensity changes with thesolar zenith angle in different ways for cases (b) and(c), it is difficult to find the sensitivity of the intensityto a change in stratospheric aerosol concentration.But the degree of polarization is obviously more sensi-tive to a change in stratospheric aerosol, especiallywhen the solar zenith angle is >900. The aerosol opti-cal depth above the observatory in case (c) (0.100) isless than that in case (b) (0.1200), but the change in thedegree of polarization in case (c) is almost 1.5 timesthat in case (b).
Furthermore, the measurements referred to byDietze were mostly conducted in 1969. There was avolcanic eruption of class 2 in 1968 (Fernandina, 0.50 S,920 W). The injected volcanic debris was likely toenhance multiple scattering. This would strengthenthe correlation between the measured polarization andthe variation in the troposphere.
3. Criterion of Single ScatteringTwo extreme cases of twilight characteristics have
been studied with the Monte Carlo procedure. One isin a background period when the total optical depthabove the observer is r, = 0.0513; the other by Wu andLu is after the eruption of the El Chichon volcano whenthe total optical depth above the observer is 72 = 0.266.(The observatory is 3.4 km above the sea surface level;the total optical depth above the sea surface level is0.460.) These can be regarded as two basic criteria.When the total optical depth is less than ri, the singlescattering approximation is valid; when the total opti-cal depth is greater than T2, the single scattering ap-proximation is definitely invalid.
It can be reasonably assumed that when r is slightlygreater than sr, the proportion of the second- and
Table VII. Effect of Upper and Lower Atmosphere on Intensity andPolarization ; Subscript a refers to Case (a) etc.
0) Ia(X 10-2) Ib(X 10-2) IC(X 10 2) 5a 6b c .
88.0 0.40 0.59 0.44 0.79 0.48 0.4390.0 0.28 0.30 0.23 0.82 0.58 0.4492.0 0.12 0.12 0.086 0.84 0.60 0.4694.0 0.022 0.017 0.018 0.76 0.60 0.44
1 December 1988 / Vol. 27, No. 23 / APPLIED OPTICS 4905
third-order scattering in the total scattering will begreater, but the total contribution of these two is stillless than first-order scattering. In such a case thecontribution of multiple scattering can be calculatedbeforehand by a Monte Carlo procedure and then sub-tracted from the total intensity or the degree of polar-ization. This correcting method was proposed bySteinhorst. 15
4. Errors in the Iterated ResultsAs some simplifications are made in deriving Eq. (9),
it is necessary to analyze the resulting errors.The main error sources are as follows:(1) Adoption of the single scattering approxima-
tion. This type of relative error is $15%. Therefore,the resulting absolute error in the iterated stratospher-ic optical depth is about 0.001. There might be 50-100% uncertainty in the profile of the aerosol scatter-ing coefficient above 24 km. Since the aerosol scatter-ing coefficient above 24 km is -10-5 km- 1 , this uncer-tainty will not seriously affect the total optical depth.
(2) The variation of the aerosol scattering phasefunction obviously influences the degree of polariza-tion, which can change the iterated total optical depthsignificantly.
Ill. Conclusion
We have employed a backward Monte Carlo compu-tation procedure for studying the propagation of visi-ble radiation in a spherically layered atmosphere tosimulate the intensity and degree of polarization at0.7-,im wavelength in the zenith direction of twilightsky in 1977. We found that the single scattering ap-proximation is applicable for the detection of strato-spheric aerosols by twilight measurement during thebackground periods.
Based on our Monte Carlo simulation, a scheme isproposed for retrieving stratospheric aerosols utilizingthe measured degree of polarization at 0.7-Am wave-length in the zenith direction of the twilight sky. Aniteration was carried out by using the data of MaunaLoa Observatory in 1977. Compared with the in situmeasurement of stratospheric aerosols in 1978-1979,both the retrieved total optical depth and the retrievedprofile of aerosol scattering coefficient below 30 km arereasonable.
The authors wish to thank J. DeLuisi of GeophysicalMonitoring for Climatic Change of NOAA in Boulder,CO and K. L. Coulson, professor emeritus of the Uni-
versity of California, Davis and the former head ofGeophysical Monitoring for Climatic Change at Mau-na Loa, for providing the measurement data and help-ful comments. Thanks are also due to reviewers whocarefully reviewed the manuscript and corrected mis-takes in language.
This work was supported by the Chinese Academy ofSciences grant R850294.
References
1. K. Labitzke and B. Naujokat, "On the Effect of the VolcanicEruptions of Mount Agung and El Chichon on the Temperatureof the Stratosphere," Geofiz. Int. 23-2, 223 (1984).
2. D. G. Collins, W. G. Blattner, M. B. Wells, and H. G. Horak,"Backward Monte Carlo Calculations of the Polarization Char-acteristics of the Radiation Emerging from Spherical-Shell At-mospheres," Appl. Opt. 11, 2684 (1972).
3. B. Wu and D. Lu, "Simulating the Characteristics of the Twi-light Sky After a Volcanic Eruption by Monte-Carlo Method,"submitted to Atmos. Sci. (in Chinese).
4. R. C. Whitten, Ed., The Stratospheric Aerosol Layer, Topics inCurrent Physics, Vol. 28 (Springer-Verlag, New York, 1982), p.33.
5. K. L. Coulson, "Characteristics of Skylight at the Zenith DuringTwilight as Indicators of Atmospheric Turbidity. 1: Degree ofPolarization," Appl. Opt. 19, 3469 (1980).
6. K. L. Coulson, "Characteristics of Skylight at the Zenith DuringTwilight as Indicators of Atmospheric Turbidity. 2: Intensityand Color Ratio," Appl. Opt. 20, 1516 (1981).
7. U.S. Standard Atmosphere, National Oceanic and AtmosphericAdministration, National Aeronautic and Space Administra-tion, U.S. Air Force (1976).
8. L. Elterman, "UV, Visible and IR Attenuation for Altitude to 50km," AFCRL-68-0153 (1968).
9. D. Deirmendjian, Electromagnetic Scattering on SphericalPolydispersions (Elsevier, New York, 1969), p. 78.
10. Handbook of Geophysics and Space Environments (1965),AFCRL.
11. E. K. Bigg, "Size Distributions of Stratospheric Aerosols andTheir Variations with Altitude and Time," J. Atmos. Sci. 33,1080 (1976).
12. T. J. Swissler, P. Hamill, and M. Osborn, "A Comparison ofLidar and Balloon-Borne Particle Counter Measurements of theStratospheric Aerosol 1974-1980," J. Atmos. Sci. 39,909 (1982).
'13. D. J. Hofmann and J. M. Rosen, "On the Background Strato-spheric Aerosol Layer," J. Atmos. Sci. 38, 168 (1981).
14. R. W. Fegley, H. T. Ellis and J. L. Heffter, "Volcanic Contribu-tions to the Stratospheric Sulfate Layer," J. Appl. Meteorol. 19,683 (1980).
15. G. Steinhorst, "Stratospheric Aerosol Concentration Deter-mined by an Iterative Method from Twilight Polarization Mea-surements," Contrib. Atmos. Phys. 50, 508 (1977).
16. G. Dietze, "On the Aerosol Factor in the Twilight Method," PureAppl. Geophys. 77, 159 (1969).
4906 APPLIED OPTICS / Vol. 27, No. 23 / 1 December 1988