returns on fdi: does the u.s. really do better? …
TRANSCRIPT
NBER WORKING PAPER SERIES
RETURNS ON FDI: DOES THE U.S. REALLY DO BETTER?
Barry BosworthSusan M. Collins
Gabriel Chodorow-Reich
Working Paper 13313http://www.nber.org/papers/w13313
NATIONAL BUREAU OF ECONOMIC RESEARCH1050 Massachusetts Avenue
Cambridge, MA 02138August 2007
This paper was prepared for the Brookings Trade Forum 2007: Foreign Direct Investment, and anearlier version was presented at the conference in May 2007 in Washington DC. The views expressedherein are those of the author(s) and do not necessarily reflect the views of the National Bureau ofEconomic Research.
© 2007 by Barry Bosworth, Susan M. Collins, and Gabriel Chodorow-Reich. All rights reserved. Shortsections of text, not to exceed two paragraphs, may be quoted without explicit permission providedthat full credit, including © notice, is given to the source.
Returns on FDI: Does the U.S. Really Do Better?Barry Bosworth, Susan M. Collins, and Gabriel Chodorow-ReichNBER Working Paper No. 13313August 2007JEL No. F21,F3,F41
ABSTRACT
According to the U.S. external accounts, U.S. investors earn a significantly higher rate of return ontheir foreign investments than foreigners earn in the United States. This continued strong performancehas produced a positive net investment income balance despite the deterioration in the U.S. net assetposition in recent years. We examine the major competing explanations for the apparent differentialbetween the rates of return. In particular, almost the entire difference occurs in FDI, where Americanfirms operating abroad appear to earn a persistently higher return than that earned by foreign firmsoperating in the U.S. We first review a number of explanations in the literature for this differential.We then offer some new evidence on the role of income shifting between jurisdictions with varyingrates of taxation. Using country-specific income and tax data, we find that about one-third of the excessreturn earned by U.S. corporations abroad can be explained by firms reporting "extra" income in lowtax jurisdictions of their affiliates.
Barry BosworthSenior FellowThe Brookings Institution1775 Massachusetts AvenueWashington, DC [email protected]
Susan M. CollinsJoan and Sanford Weill Dean of Public PolicyGerald R. Ford School of Public PolicyWeill Hall, Suite 4300735 South State StreetAnn Arbor, MI 48109-3091and [email protected]
Gabriel Chodorow-ReichThe Brookings Institution1775 Massachusetts Avenue, NWWashington D.C. [email protected]
Draft
June 29, 2007
Returns on FDI: Does the U.S. Really Do Better? by
Barry Bosworth, Susan Collins, and
Gabriel Chodorow-Reich
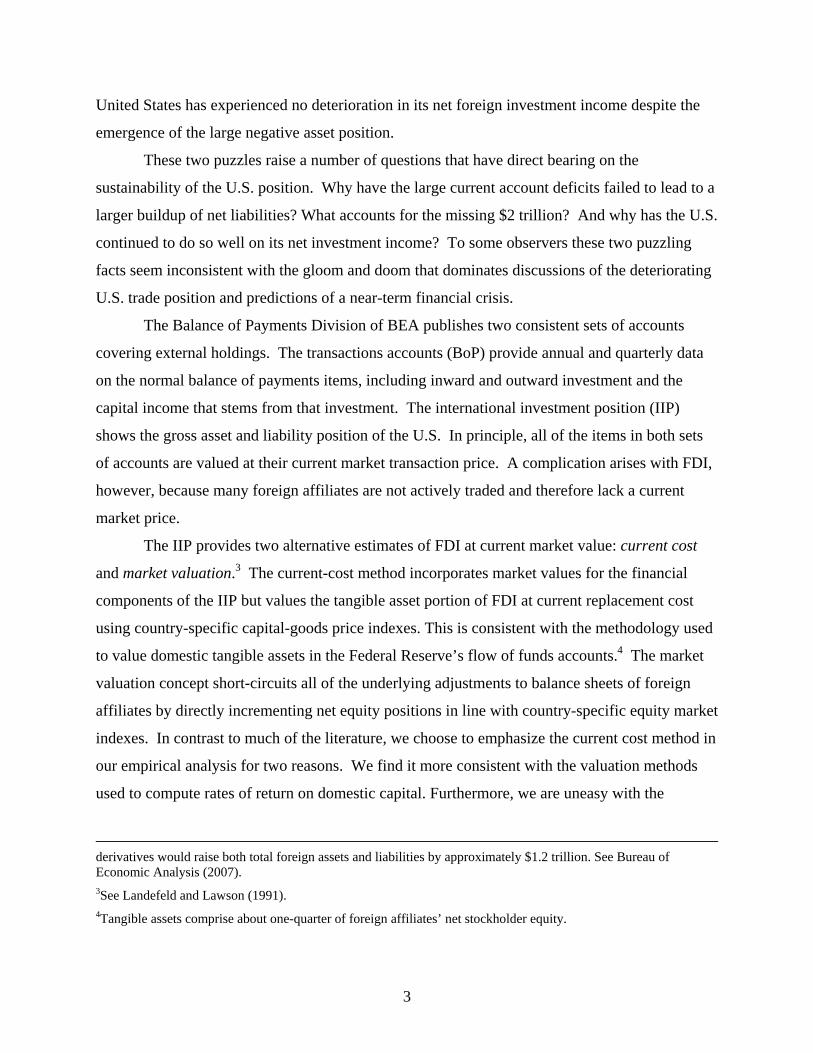
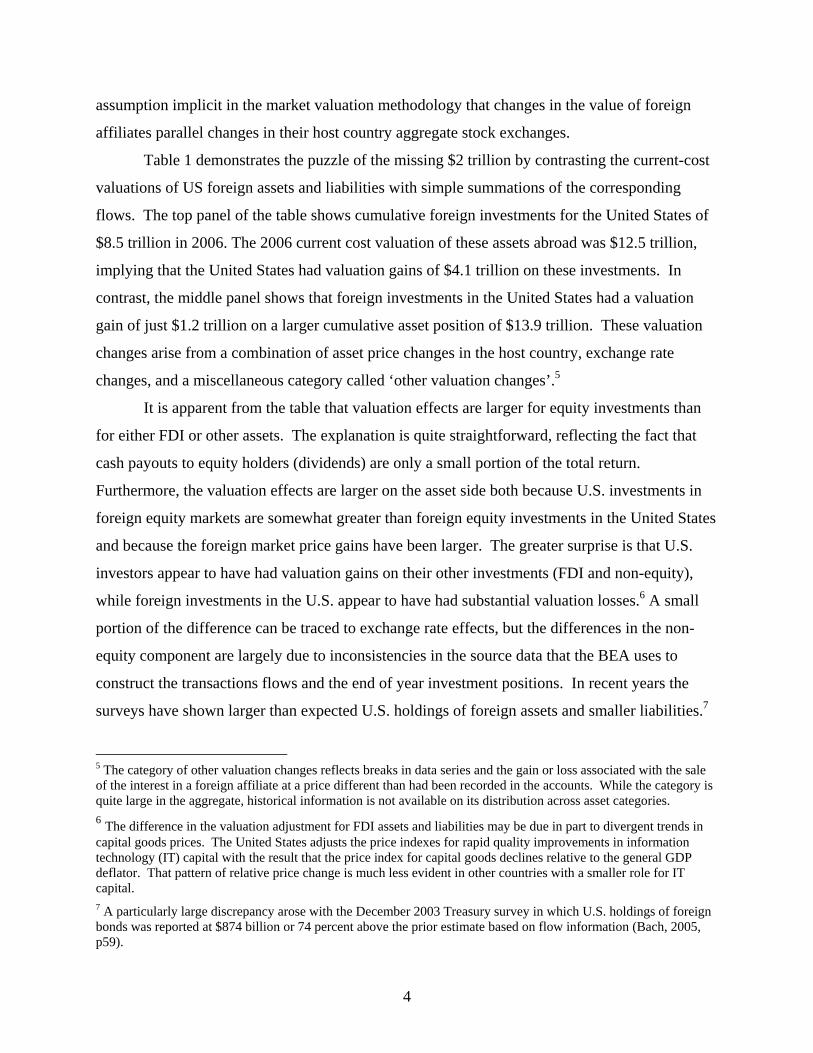
Over the past quarter century, the United States has undergone a striking shift from the
world’s largest creditor nation, with a net international investment position equal to 11 percent of
GDP, to its largest debtor, with a net indebtedness of $2.6 trillion or -20 percent of GDP at the
end of 2006 (Table 1). Yet, net income from U.S. foreign investments remained positive
throughout this transition.1 This surprising state of affairs is highlighted in figure 1. According
to official data, the strong continued income account performance reflects the fact that U.S.
investors earn a significantly higher rate of return on their foreign assets than foreigners earn in
the United States. But despite considerable recent research, analysts do not agree on whether the
U.S. really does do better, and if so, why.
Some scholars argue that published data are implausible and suggest possible errors in
the reported data for either income flows or estimated net asset position. For example,
Hausmann and Sturznegger (2006) argue that the value of the U.S. foreign asset position is
understated, leading to overstatement of the return on outward FDI. In particular, they believe
that U.S. trade statistics fail to capture the full amount of U.S. exports of intangible capital. In
contrast, Gros (2006a, 2006b) points to asymmetries in the data sources used to construct
estimates of income and payments on foreign direct investment. He believes that U.S. payments
to foreigners, and thus the return on inward FDI, are understated. Gourinchas and Rey (2007)
change the presentation of the data to emphasize the total return (inclusive of capital gains) and
conclude that the U.S earns a premium because it acts as an international venture capitalist,
borrowing in relative safe short-term liabilities while investing in riskier long-term assets. 1 We are indebted to our discussant for alerting us to the substantial upward revisions to net investment income in the June 2007 balance of payments release. For 2001-2006, the newest release incorporates average cumulative upward revisions of $40 billion over the initial estimates.
2
The purpose of this paper is to examine in greater detail some of the competing
explanations for the apparent differential between the rates of return on U.S. foreign assets and
liabilities. In particular, we focus on the rate of return on foreign direct investment (FDI). As
we show, almost the entire return differential occurs in FDI, where American firms operating
abroad appear to earn a persistently higher return than that earned by foreign firms operating in
the U.S. We first review a number of explanations in the literature for this differential. We then
offer some new evidence on the potential role of income shifting between jurisdictions with
varying rates of taxation.
In summary, we do not believe that the differential in returns is an illusion of bad data, as
alleged by much of the recent discussion. While the Bureau of Economic Analysis (BEA) --the
statistical agency that collects and reports the relevant data -- is handicapped by unreliable source
data, we believe that the existing accounts it puts together are superior to suggested alternatives.
However, we argue that the current literature places too little emphasis on the potential role for
tax-related income shifting. In particular, we find statistically significant evidence of a
substantial diversion of income to low-tax jurisdictions, suggesting that the reported earnings on
FDI are distorted by efforts to avoid U.S. corporate taxation.
The following section examines the official statistics on the balance of payments (BOP)
and the international investment position (IIP) of the United States. Section three discusses the
main competing explanations, some of which assert that the official measures are incorrect.
Section four contains our argument on tax considerations. Section five concludes.
What do the published data show?
The official statistics on the U.S. external position are surprising in two respects. First,
despite the enormous size of the nation’s external indebtedness, the net debt has actually grown
more slowly than would have been expected from a simple summation of the annual current
account deficits, which are now in the range of $700-800 billion per year. The cumulation of past
current account balances would suggest a net liability position of about -$5.5 trillion at the end of
2006, compared to an actual value of -$2.6 trillion (Table 1).2 Second, as mentioned above, the
2 The 2007 release of the asset position data includes a new category for financial derivatives, but only for year-end 2005 and 2006. To preserve historical comparability, we exclude the contribution of financial derivatives from the totals reported in Table 1, Table 2 and Figure 1 and cited throughout the paper. In 2006 including financial
3
United States has experienced no deterioration in its net foreign investment income despite the
emergence of the large negative asset position.
These two puzzles raise a number of questions that have direct bearing on the
sustainability of the U.S. position. Why have the large current account deficits failed to lead to a
larger buildup of net liabilities? What accounts for the missing $2 trillion? And why has the U.S.
continued to do so well on its net investment income? To some observers these two puzzling
facts seem inconsistent with the gloom and doom that dominates discussions of the deteriorating
U.S. trade position and predictions of a near-term financial crisis.
The Balance of Payments Division of BEA publishes two consistent sets of accounts
covering external holdings. The transactions accounts (BoP) provide annual and quarterly data
on the normal balance of payments items, including inward and outward investment and the
capital income that stems from that investment. The international investment position (IIP)
shows the gross asset and liability position of the U.S. In principle, all of the items in both sets
of accounts are valued at their current market transaction price. A complication arises with FDI,
however, because many foreign affiliates are not actively traded and therefore lack a current
market price.
The IIP provides two alternative estimates of FDI at current market value: current cost
and market valuation.3 The current-cost method incorporates market values for the financial
components of the IIP but values the tangible asset portion of FDI at current replacement cost
using country-specific capital-goods price indexes. This is consistent with the methodology used
to value domestic tangible assets in the Federal Reserve’s flow of funds accounts.4 The market
valuation concept short-circuits all of the underlying adjustments to balance sheets of foreign
affiliates by directly incrementing net equity positions in line with country-specific equity market
indexes. In contrast to much of the literature, we choose to emphasize the current cost method in
our empirical analysis for two reasons. We find it more consistent with the valuation methods
used to compute rates of return on domestic capital. Furthermore, we are uneasy with the
derivatives would raise both total foreign assets and liabilities by approximately $1.2 trillion. See Bureau of Economic Analysis (2007). 3See Landefeld and Lawson (1991). 4Tangible assets comprise about one-quarter of foreign affiliates’ net stockholder equity.
4
assumption implicit in the market valuation methodology that changes in the value of foreign
affiliates parallel changes in their host country aggregate stock exchanges.
Table 1 demonstrates the puzzle of the missing $2 trillion by contrasting the current-cost
valuations of US foreign assets and liabilities with simple summations of the corresponding
flows. The top panel of the table shows cumulative foreign investments for the United States of
$8.5 trillion in 2006. The 2006 current cost valuation of these assets abroad was $12.5 trillion,
implying that the United States had valuation gains of $4.1 trillion on these investments. In
contrast, the middle panel shows that foreign investments in the United States had a valuation
gain of just $1.2 trillion on a larger cumulative asset position of $13.9 trillion. These valuation
changes arise from a combination of asset price changes in the host country, exchange rate
changes, and a miscellaneous category called ‘other valuation changes’.5
It is apparent from the table that valuation effects are larger for equity investments than
for either FDI or other assets. The explanation is quite straightforward, reflecting the fact that
cash payouts to equity holders (dividends) are only a small portion of the total return.
Furthermore, the valuation effects are larger on the asset side both because U.S. investments in
foreign equity markets are somewhat greater than foreign equity investments in the United States
and because the foreign market price gains have been larger. The greater surprise is that U.S.
investors appear to have had valuation gains on their other investments (FDI and non-equity),
while foreign investments in the U.S. appear to have had substantial valuation losses.6 A small
portion of the difference can be traced to exchange rate effects, but the differences in the non-
equity component are largely due to inconsistencies in the source data that the BEA uses to
construct the transactions flows and the end of year investment positions. In recent years the
surveys have shown larger than expected U.S. holdings of foreign assets and smaller liabilities.7
5 The category of other valuation changes reflects breaks in data series and the gain or loss associated with the sale of the interest in a foreign affiliate at a price different than had been recorded in the accounts. While the category is quite large in the aggregate, historical information is not available on its distribution across asset categories. 6 The difference in the valuation adjustment for FDI assets and liabilities may be due in part to divergent trends in capital goods prices. The United States adjusts the price indexes for rapid quality improvements in information technology (IT) capital with the result that the price index for capital goods declines relative to the general GDP deflator. That pattern of relative price change is much less evident in other countries with a smaller role for IT capital. 7 A particularly large discrepancy arose with the December 2003 Treasury survey in which U.S. holdings of foreign bonds was reported at $874 billion or 74 percent above the prior estimate based on flow information (Bach, 2005, p59).

5
The second puzzle is illustrated by combining the BoP capital income data with matching
measures of assets and liabilities from the IIP so as to compute rates of return for U.S.
investments abroad and foreign investments in the United States. To begin with, we have
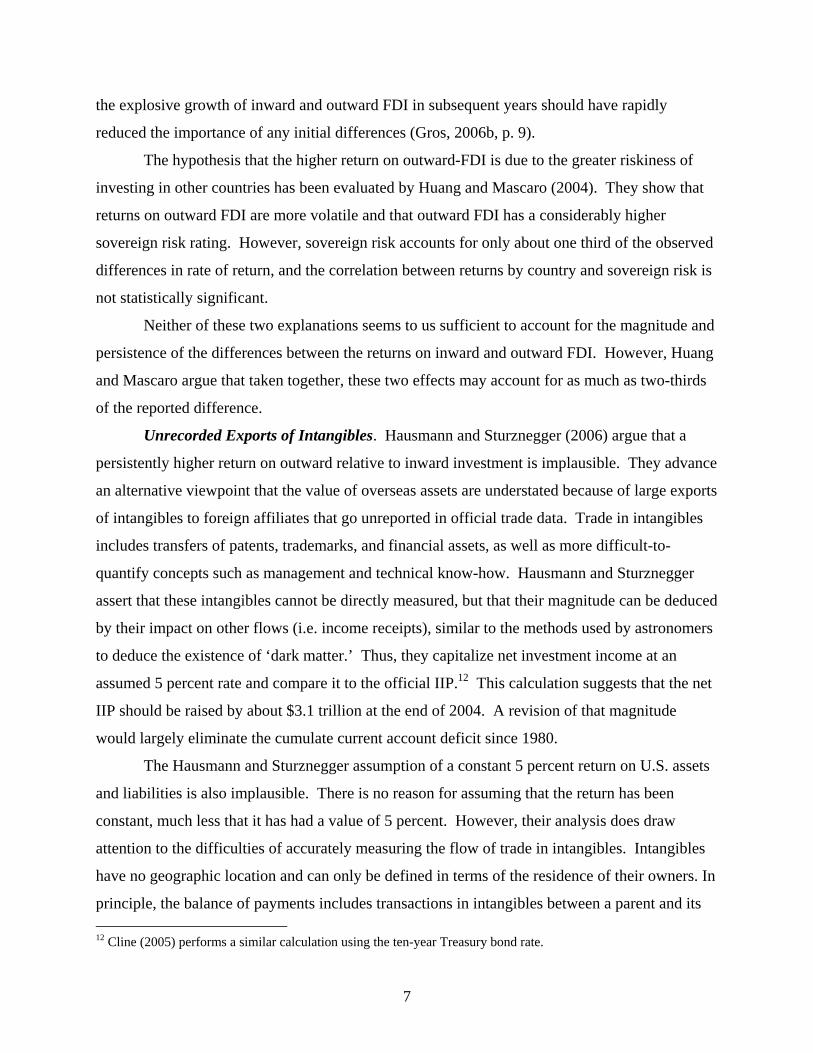
divided the data into two categories, FDI and all other investments. Surprisingly, figure 2
illustrates that U.S. and foreign investors have earned nearly identical rates of return on non-FDI
assets over the past quarter century. Moreover, those returns appear to have declined in line with
observed market interest rates. This close correspondence is unexpected in view of the common
belief that foreign portfolio investments are concentrated in short-term U.S. government
securities with low yields, whereas U.S. investments are relatively concentrated in equities and
other high-yield assets. Part of the explanation is that low-yield foreign official holdings are
only about 20 percent of total non-FDI liabilities, a smaller share than typically believed. In
addition, equities are a large portion of U.S. assets, and as discussed above, cash dividends are a
small share of their total yield. The total return, which includes both dividend income and
capital gains, is significantly higher.8
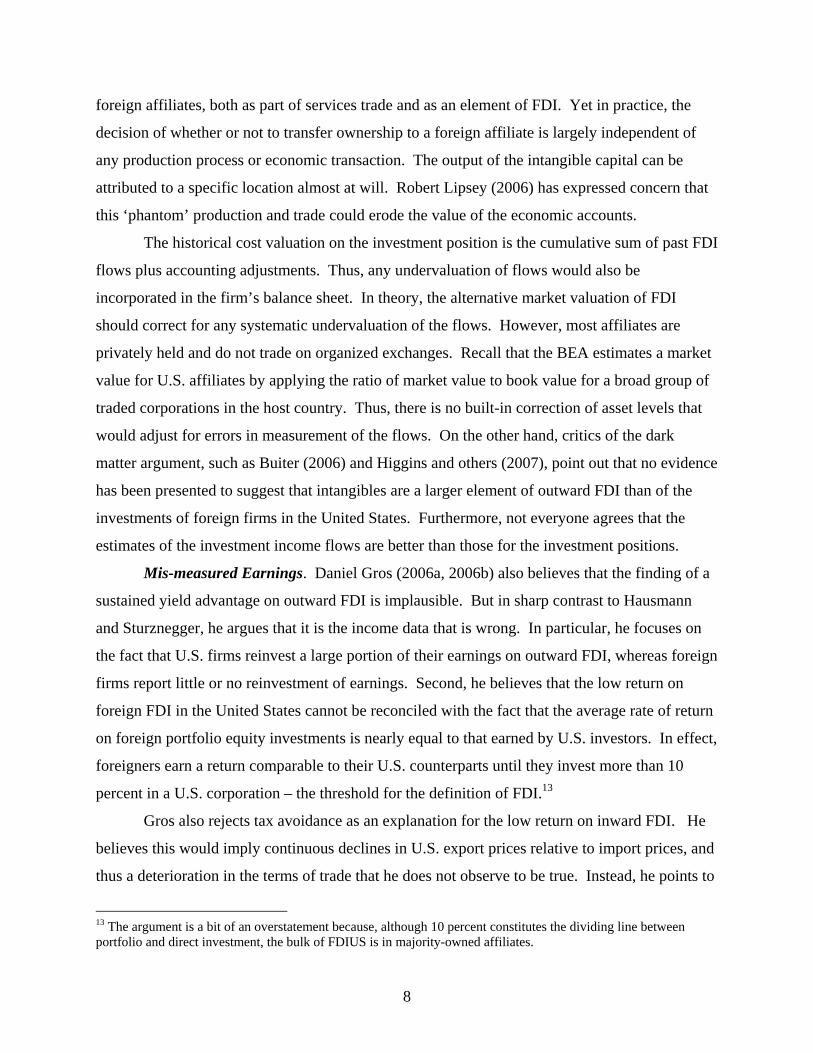
Instead, the higher earnings on U.S. foreign investments can be traced to a much larger
return reported for the FDI of U.S. resident business enterprises (USDIA), compared to foreign
firms operating in the United States (FDIUS). As shown in figure 3, the differential has been
large and persistent, averaging six percent over the 1977-2006 period. We have emphasized
measures of the rate of return that are based on valuing physical plant and equipment at current
replacement cost, but the alternative of adjusting owners’ equity in line with country-specific
equity indexes (market valuation) yields similar results.
The gap in FDI returns seems to suggest that U.S. firms use their capital more efficiently
than their foreign counterparts. If so, it is interesting to ask whether U.S. firms have made
unusually high returns abroad, or foreign firms operating in the U.S. have done especially poorly.
As a benchmark measure, figure 3 also shows the after-tax return on domestic nonfinancial
corporate capital over 1976-2005.9 It consistently lies between the estimated returns on outward
and inward FDI, suggesting both an above-average return on USDIA and a low reported return
8 The balance of payments and the national accounts both exclude capital gains and losses from the income flows. We will return to the measurement of total returns in a later section of the paper. 9 The rate of return includes profits, net interest and rent in the numerator to avoid issues of distinguishing between the returns to bondholders and stockholders. The denominator measures mid-year tangible assets at replacement costs, and therefore the return is a real rate free of inflation effects.

6
for FDIUS. Until recently, most of the discussion and research has focused on the perceived low
return on FDIUS. A belief that foreign-controlled corporations operating in the United States
were shifting their income abroad in order to avoid U.S. taxation was a significant topic in the
1992 elections, and various explanations for their low returns were frequent topics of research.10
More recently, the discussion has shifted to put a greater emphasis on the high return on
USDIA.11
Competing Explanations
The observation that the rates of return on outward and inward FDI differ by a substantial
magnitude has been noted by many researchers. The on-going discussion revolves around five
alternative explanations: (1) Differing characteristics of USDIA and FDIUS, (2) errors in
accounting for exports of U.S. intangibles and a consequent underestimate of the USDIA asset
position, (3) errors in the reporting of earnings on USDIA and FDIUS, (4) alternative measures
of the return, and (5) tax incentives. We discuss the first four below, leaving the role of taxes to
be evaluated in a subsequent section in which we offer some new empirical results.
Differing characteristic of FDI. The sharply differing rates of return on inward and
outward FDI are longstanding and frequently noted in the research literature. In the 1990s, the
basic assumption was the differences were real, and researchers sought explanations in different
characteristics of the enterprises. Most frequently, the differential has either been attributed to
the fact that American foreign subsidiaries have been in operation for a longer period of time
than foreign subsidiaries in the United States, or to the claim that the risks of doing business may
be greater for U.S. firms operating abroad than for foreign firms operating in the United States.
Landefeld and others (1992) reported that firms acquired by foreigners had below
average rates of return at the time of purchase; and Grubert and others (1993) found that rates of
return did tend to rise in the years following an acquisition within a dataset of individual foreign-
controlled corporations in manufacturing. Mataloni (2000) also found strong maturation effects
for a panel of manufacturing companies over the period of 1987-97. However, the size of the
age effect is quite small relative to the total gap in the return on inward and outward FDI.
Furthermore, while U.S. firms were investing greater amounts abroad in the years prior to 1980, 10 Mataloni (2000) and Grubert (1997). 11 Hausmann and Sturznegger (2006), Buiter (2006), McGrattan and Prescott (2006), and Kitchen (2006).
7
the explosive growth of inward and outward FDI in subsequent years should have rapidly
reduced the importance of any initial differences (Gros, 2006b, p. 9).
The hypothesis that the higher return on outward-FDI is due to the greater riskiness of
investing in other countries has been evaluated by Huang and Mascaro (2004). They show that
returns on outward FDI are more volatile and that outward FDI has a considerably higher
sovereign risk rating. However, sovereign risk accounts for only about one third of the observed
differences in rate of return, and the correlation between returns by country and sovereign risk is
not statistically significant.
Neither of these two explanations seems to us sufficient to account for the magnitude and
persistence of the differences between the returns on inward and outward FDI. However, Huang
and Mascaro argue that taken together, these two effects may account for as much as two-thirds
of the reported difference.
Unrecorded Exports of Intangibles. Hausmann and Sturznegger (2006) argue that a
persistently higher return on outward relative to inward investment is implausible. They advance
an alternative viewpoint that the value of overseas assets are understated because of large exports
of intangibles to foreign affiliates that go unreported in official trade data. Trade in intangibles
includes transfers of patents, trademarks, and financial assets, as well as more difficult-to-
quantify concepts such as management and technical know-how. Hausmann and Sturznegger
assert that these intangibles cannot be directly measured, but that their magnitude can be deduced
by their impact on other flows (i.e. income receipts), similar to the methods used by astronomers
to deduce the existence of ‘dark matter.’ Thus, they capitalize net investment income at an
assumed 5 percent rate and compare it to the official IIP.12 This calculation suggests that the net
IIP should be raised by about $3.1 trillion at the end of 2004. A revision of that magnitude
would largely eliminate the cumulate current account deficit since 1980.
The Hausmann and Sturznegger assumption of a constant 5 percent return on U.S. assets
and liabilities is also implausible. There is no reason for assuming that the return has been
constant, much less that it has had a value of 5 percent. However, their analysis does draw
attention to the difficulties of accurately measuring the flow of trade in intangibles. Intangibles
have no geographic location and can only be defined in terms of the residence of their owners. In
principle, the balance of payments includes transactions in intangibles between a parent and its 12 Cline (2005) performs a similar calculation using the ten-year Treasury bond rate.
8
foreign affiliates, both as part of services trade and as an element of FDI. Yet in practice, the
decision of whether or not to transfer ownership to a foreign affiliate is largely independent of
any production process or economic transaction. The output of the intangible capital can be
attributed to a specific location almost at will. Robert Lipsey (2006) has expressed concern that
this ‘phantom’ production and trade could erode the value of the economic accounts.
The historical cost valuation on the investment position is the cumulative sum of past FDI
flows plus accounting adjustments. Thus, any undervaluation of flows would also be
incorporated in the firm’s balance sheet. In theory, the alternative market valuation of FDI
should correct for any systematic undervaluation of the flows. However, most affiliates are
privately held and do not trade on organized exchanges. Recall that the BEA estimates a market
value for U.S. affiliates by applying the ratio of market value to book value for a broad group of
traded corporations in the host country. Thus, there is no built-in correction of asset levels that
would adjust for errors in measurement of the flows. On the other hand, critics of the dark
matter argument, such as Buiter (2006) and Higgins and others (2007), point out that no evidence
has been presented to suggest that intangibles are a larger element of outward FDI than of the
investments of foreign firms in the United States. Furthermore, not everyone agrees that the
estimates of the investment income flows are better than those for the investment positions.
Mis-measured Earnings. Daniel Gros (2006a, 2006b) also believes that the finding of a
sustained yield advantage on outward FDI is implausible. But in sharp contrast to Hausmann
and Sturznegger, he argues that it is the income data that is wrong. In particular, he focuses on
the fact that U.S. firms reinvest a large portion of their earnings on outward FDI, whereas foreign
firms report little or no reinvestment of earnings. Second, he believes that the low return on
foreign FDI in the United States cannot be reconciled with the fact that the average rate of return
on foreign portfolio equity investments is nearly equal to that earned by U.S. investors. In effect,
foreigners earn a return comparable to their U.S. counterparts until they invest more than 10
percent in a U.S. corporation – the threshold for the definition of FDI.13
Gros also rejects tax avoidance as an explanation for the low return on inward FDI. He
believes this would imply continuous declines in U.S. export prices relative to import prices, and
thus a deterioration in the terms of trade that he does not observe to be true. Instead, he points to
13 The argument is a bit of an overstatement because, although 10 percent constitutes the dividing line between portfolio and direct investment, the bulk of FDIUS is in majority-owned affiliates.
9
the inclusion of reinvested earnings as the source of the difference and favors focusing on
dividend repatriation rather than on earnings to compare returns on inward versus outward FDI.
Eliminating the reinvested earnings component would eliminate about two-thirds of the reported
return on outward FDI thereby substantially narrowing the rate of return gap.
Like Hausmann and Sturzenegger, Gros presents no evidence that the reported returns on
FDI are wrong, only that he regards the differential as implausible. However, his discussion
does highlight an important inconsistency in national reports of FDI. Although the 5th edition of
the Balance of Payments manual adopted a measure of income from FDI that includes reinvested
earnings, not all countries have done so. However, Gros cannot resolve the puzzle of large FDI
return differentials by simply excluding the reinvested component. The low return on FDIUS is
not just a reporting problem because it is also reflected in the audited tax returns of foreign-
controlled U.S. corporations.14 Furthermore, because U.S. firms only pay taxes on repatriated
foreign income, it is not surprising that they reinvest a large portion of that income. More
fundamentally, we believe that Gros is too quick to reject tax avoidance as a contributor because
he adopts too narrow a perspective on the potential for shifting income among jurisdictions.
Alternative Measures of the Return. The BOP accounts, as with the national income
accounts, exclude capital gains and losses. Excluding valuation changes is consistent with a
desire to focus on resource use and resource transfers. However, the exclusion seems less
relevant for financial transactions in which earnings are often reinvested and incorporated in
asset price changes. The resulting interest in valuation effects and in measures of total return
explains a large part of the increased focus on the asset and liability positions reported in the
IIP.15 However, the measures of the returns on FDI and other financial assets and liabilities that
we described previously exclude those valuation elements.
As discussed earlier in connection with the data in table 1, valuation effects are large and
quite favorable to the United States. Table 2 provides a more detailed perspective on the BEA
data by separating the total valuation change into three components: asset price changes,
exchange rate changes, and other valuation changes due to coverage changes and inconsistencies
in the basic source data on stocks and flows. We have consolidated the data for 1990 to 2006 into
14 We present the tax return data in table 3 in the section on tax policy and income shifting. 15 See as well the important research of Lane and Milesi-Ferretti (2001, 2003) to create measures of the IIP for a large number of countries. The importance of wealth valuation effects is also highlighted in Tille (2005).
10
three comparable subperiods. As shown, the combined revaluations have consistently favored
the asset side of the accounts. A large portion of the net change, however, can be traced to
revaluations that are due to the ‘other valuations’ category. The effect of exchange rate changes
has been negative over the period as a whole, but it is highly variable. It is also noteworthy that
the net effect of price changes varies substantially between the versions with FDI at current and
market valuations. Thus, we infer that the greatest differences revolve around the question of
how to value FDI, a category for which we have no direct market measure. An important
shortcoming of the BEA data is that it is not possible to disaggregate the valuation changes at the
level of individual asset categories.
Gourinchas and Rey (2007) address these issues by constructing their own measures of
the U.S. external position that emphasize the total return (inclusive of capital gains and losses)
instead of nominal receipts and payments. Particularly for the years after 1980, their measures of
aggregate investment flows and stocks are very similar to those of the BEA.16 However, they
use a quite different methodology for calculating the returns on assets and liabilities. Instead of
supplementing the official estimates of capital-income receipts and payments with estimates of
capital gains/losses, they fully replace the income flows with their own estimates of total return,
which are based on the performance of country-specific market indexes and the country
composition of U.S. investments. Similarly, on the liability side, U.S. payments to foreigners are
based on the total return estimates of U.S. market indexes.17
For FDI, Gourinchas and Rey exclude the income reported by BEA on both inward and
outward FDI and replace it with their measures of the total return derived as explained above
from the country-specific equity market indexes. In effect, they switch the focus from a debate
about the sources of a differential rate of return on inward versus outward FDI to a focus on the
simpler question of whether or not foreign equity markets outperform those of the United States.
In their version of the accounts, the United States earns a slightly higher return on its
FDI, but the advantage is substantially smaller than that of non-FDI assets. In striking contrast to
the returns shown in figure 2, the Gourinchas-Rey data show the United States advantage to lie
16 The capital flow data are virtually identical to those of the BEA with some reclassification; and except for FDI, they benchmark their asset positions to those of the BEA in the 4th quarter of every year. The FDI flows are identical to those of BEA. 17 We were unable to obtain the Gourinchas and Rey data for direct comparison with that of the BEA, but the appendix to their paper provides a very thorough documentation of their methodology.

11
outside FDI, since it substantially outperforms other countries in its investments in each of the
categories of equity, debt, and bank credit. However, we cannot compare their measure of
returns, excluding the capital gain or loss, to the income and payments data from BEA because
only the total return is reported in their published paper.
The alternative set of international accounts constructed by Gourinchas and Rey reflects
an argument similar to that of Gros in that they reject BEA’s FDI income data and replace it with
a series that largely eliminates any difference in the returns on inward versus outward FDI. The
resulting focus on the relative performance of equity markets assumes away the possibility that
affiliates may do better or worse than the average firm in the host country. They posit instead an
alternative puzzle of why the United States does so well on its non-FDI investments.
We agree with Gourinchas and Rey about the importance of developing effective
measures of the total return on international financial investments. However, we do not
understand why they went so far in rejecting the BEA data on capital incomes. In addition,
Curcuru and others (2007), using a methodology similar to that of Gourinchas and Rey, conclude
that the United States does not earn substantially higher returns within the two categories of
bonds and stocks. We favor a less extreme approach in which BEA would publish the three
components of the official valuation measure -- price change, exchange rate changes, and
statistical discontinuities -- for each of the major asset categories. Researchers could then use
either the nominal or the total return, depending on the specific circumstances.
Tax Policy and Income Shifting
The influence of taxation on decision making by multinational corporations has long been
a major topic of economic research. A recent survey by James Hines (1997) highlights the wide
range of those studies, and the consistent evidence that taxes do have important consequences.
However, most of the studies have focused on the effects of taxation on the location of
investments. Less attention has been paid to the issue of greatest interest in the present context:
Do firms shift income from the United States to jurisdictions of relatively low tax rates?18 We are
not only concerned about the extent to which tax incentives affect the placement of FDI, but also
18 Huizinga and Laeven (2006) conduct such an analysis for European multinational firms operating within Europe. They find evidence of substantial tax-related profit shifting.
12
about whether those incentives lead firms to disproportionately assign income to low-tax
jurisdictions beyond an amount implied by their investment decisions.
There are two important mechanisms by which firms might shift reported net income.
The first, which has attracted most of the attention, relies on the adjustment of cross-border
transfer prices among affiliates within the same corporation. Governments try to control tax-
induced transfer price adjustment by requiring the use of prices based on comparable arms-
length transactions. However, this process involves substantial ambiguities. The second similar
mechanism involves the transfer of intangible capital between a parent corporation and its
affiliates. The use of the capital, in the form of manufacturing or marketing knowledge, is
allocated to affiliates in low-tax jurisdictions at a price below the appropriate arms-length
royalty.
Although it is within the U.S. customs union, Puerto Rico is a striking example of the
potential for income shifting. Until recently, Section 936 of the Tax Reform Act of 1976 made
income earned in Puerto Rico completely exempt from U.S. taxation. The provision was
intended to encourage U.S. firms to establish manufacturing facilities on the island -- but it also
created strong incentives for income shifting. Mainland pharmaceutical firms, for example,
correctly reported a low value for raw materials exported to the island and a high value for final
products exported from the island. Much of the difference between the two reflected the rent the
companies earned on research and development for new patented drugs, the whole of which was
attributed to the Puerto Rican affiliates. In effect, R&D expenses were recorded in the United
States where the tax rate was high, while the returns were recorded in Puerto Rico where the tax
rate was zero. This income-shifting is estimated to account for a 17-31 percent overstatement of
Puerto Rico’s GDP in 2004.19 Grubert and Slemrod (1998) report rates of return in excess of
100% on tangible assets for the Puerto Rican affiliates of corporations in pharmaceuticals and
electronic equipment.
Honohan and Walsh (2002) find comparable evidence of extraordinary returns by
multinationals with large amounts of intangible capital operating in Ireland, another low foreign
tax jurisdiction.20 Microsoft provides a particularly good example, as it operates an affiliate in
19 Bosworth and Collins (2006), pp.23-29. 20 Honohan and Walsh (2002), pp.39-44 and their appendix.
13
Ireland that receives much of its revenue from sales outside the United States. In 2004, the Irish
affiliate reported assets of $16 billion and profits of $9 billion.21
Existing Literature. Broad evidence of income shifting by U.S. multinationals is
provided by Grubert and Mutti (1991). Their analysis of the profitability of U.S. affiliates as a
function of host countries’ statutory tax rates for 1982 found a significant and large negative
correlation, implying that firms declared more income in low-tax countries. Similarly, Hines and
Rice (1994) analyzed the reports of U.S. nonbank majority-owned affiliates in 1982 and found a
negative relationship between local tax rates and profits, controlling for the capital and labor
inputs. In the early 1980s, however, the U.S. corporate tax rate was not particularly high relative
to those of the countries in which its FDI was concentrated. Thus, it was uncertain whether tax
shifting would result in a net reallocation of income away from the United States.
A link to the U.S. parent was provided by Harris and others (1993) who reported that
firms with affiliates in low-tax jurisdictions had lower U.S. tax ratios. In addition, Bernard and
others (2006) used a new dataset with customs records of exports and export prices that
distinguished between sales to foreign affiliates and arms-length transactions. They found that
exporters consistently charged lower prices to affiliates, and that the difference varied inversely
with the tax rate in the destination country. They estimated a loss of $15 billion in the trade
balance for 2004, or about six percent of U.S. FDI income.
Related research focused on foreign-controlled corporations operating in the United
States has not found evidence that income shifting is a major contributor to the low reported
return on inward FDI. Foreign firms do appear to have consistently earned a below average rate
of return over the past quarter century (figure 3). However, Mataloni (2000) found no significant
negative correlation between the returns earned by foreign-controlled corporations and their
reliance on intra-firm trade. Grubert (1997) used data from U.S. corporate tax returns to examine
the behavior of foreign-controlled corporations over the period of 1987-93.22 He concluded that
a large portion of the difference between the returns of foreign-controlled and domestic
corporations can be accounted for by non-tax factors. Furthermore, he found that firms with less
than 50 percent foreign ownership also had low relative rates of return. Since income-shifting
21 “Irish Subsidary Let’s Microsoft Slash Taxes in U.S. and Europe.” Wall Street Journal, November 7, 2005, p. A1, Column 5. 22 The paper is an update of an earlier article by Grubert and others, 1993.

14
would seem to be more difficult in the presence of other stockholders, he viewed this finding as a
significant argument against the hypothesis.
In table 3, we present more recent information on the income of domestic and foreign-
controlled corporations, as shown in the Statistics of Income data of the Treasury (see Hobbs,
2006). One interesting characteristic is the much higher incidence of negative or zero income
among foreign-controlled corporations than domestic corporations (30.2 versus 12.7). This fact
plays a dominant role in accounting for the overall difference in the rate of return on net worth
between the domestic and foreign-controlled firms (columns 3 and 6). Notably, if the
comparison is restricted to firms with positive net income, domestic and foreign firms have
roughly equivalent rates of return. However, panel b shows that this restriction has the greatest
impact on the comparison of firms in the financial sector (FIRE), where the rate of return of
foreign firms is substantially higher. The negative positive earnings differential for domestic
relative to foreign firms remains in industries such as manufacturing and wholesale trade.
New results. We re-examine the issue of income shifting using more recent data from
the BEA’s survey of U.S. multinational corporations. For the years 1999-2004 we have income
and balance sheet data for U.S. majority-owned foreign affiliates in 51 countries. We
constructed effective tax rates for each country, smoothing the data by taking three-year centered
moving averages.23 We then estimated simple gravity-style equations in which the log of income
from country i was related to the log of the country’s GDP, the log of its distance from the
United States, the ratio of total trade to GDP as a measure of openness, and the effective tax rate.
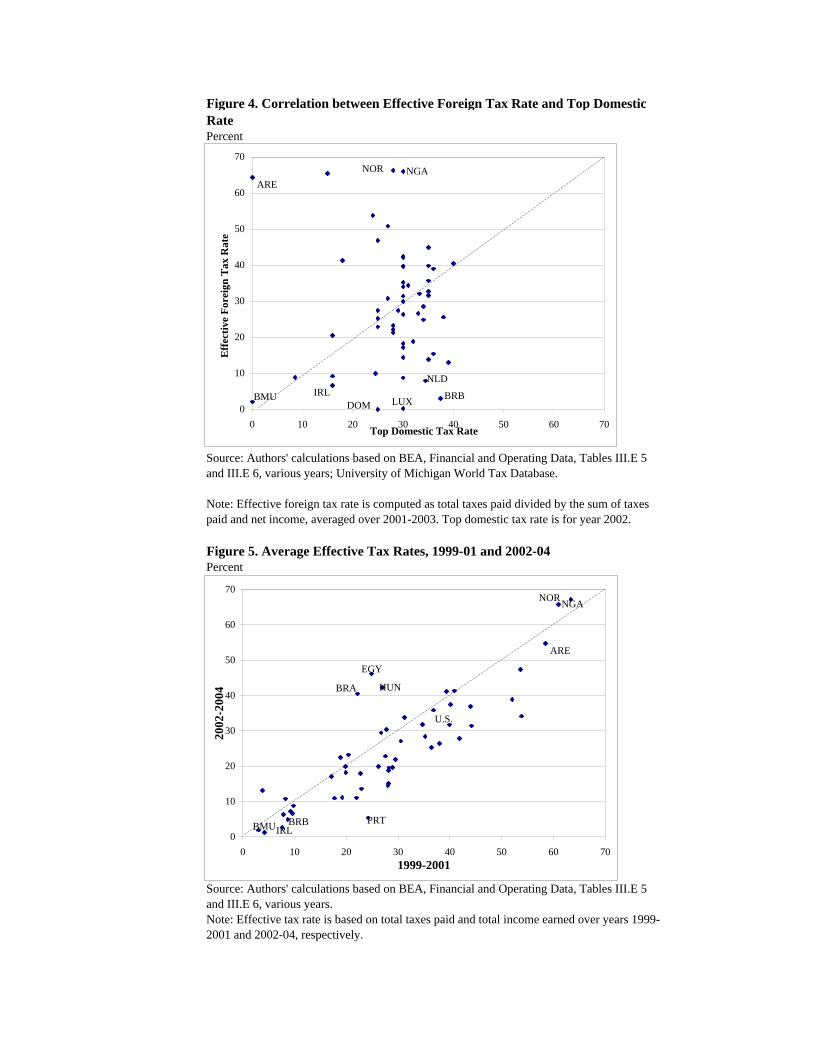
As shown in figure 4, the effective tax rate on foreign firms often is quite different from
the top statutory domestic tax rate in the host country.24 These differences reflect other aspects
of the tax law, such as depreciation allowances and the common practice of granting preferences
to foreign investors. For example, the effective tax measure more clearly highlights the low tax
applied to FDI in the Netherlands and Luxembourg. At the same time, it indicates the
importance of excluding oil-exporting countries where the effective tax is very high.25 We also
23 The calculation was suppressed in those situations in which the net income was negative. For 1999 (respectively, 2004), the tax rate was set equal to the centered three-year average for 2000 (respectively, 2003). 24 The statutory tax rates are from the World Tax Database compiled by the Office of Tax policy Research at the University of Michigan: http://www.bus.umich.edu/OTPR/otpr/introduction.htm 25 We believe the high effective tax rates reported in oil producing countries may be due to firms’ grouping royalty payments in with foreign taxes. Such payments are conceptually quite different from tax payments, and we
15
find a consistent pattern of decline in the effective tax rates between the two subperiods (figure
5). Countries have reacted to the international competition by reducing the taxation of
corporations.
How do tax rates abroad compare to those in the U.S.? Table 4 reports the average
effective tax rate across the sample of countries, weighted by the stock of FDI. As shown, the
U.S. tax rate was roughly 15 percentage points above the weighted foreign rate during 1999-
2001. The 2002 tax reduction lowered the gap slightly, but the United States tax rate has
remained considerably above the average of the countries in which its multinational corporations
invest.
The basic regression results for exploring cross-country differences in FDI income are
reported in table 5. The first three columns report the results for FDI income of the U.S. parent
companies. The first two of these use annual data for 1999-2004 giving a total of 290
observations, with the caveat that the tax rate is a centered moving average as described above.26
In column 1, the estimated coefficient on tax rate is negative and highly significant, a result that
is very much in line with the prior finding that U.S. corporations are sensitive to tax
considerations in the allocation of their investments.
Column 2 reports the same specification but with the country-specific stock of direct
investment included on the right hand side.27 Importantly, the tax rate coefficient remains
negative and statistically significant even when the accumulated investment stock is controlled
for. We interpret this finding as reflective of income-shifting since firms seem to go beyond the
simple redistribution of their investments to reallocate income to low-tax jurisdictions. The last
three columns repeat the regressions using total affiliates’ income and equity, with no adjustment
for the U.S. parent’s share. The results appear quite robust to this alternative formulation.
We used the regression results of table 5, column (2) to estimate the magnitude of net
income shifting. Thus, we show in column (1) of table 6 the level of FDI income that would be
predicted each year using each country’s effective tax rate, summed over the 51 countries in our therefore exclude the three oil-producing outliers in figure 4 (United Arab Emirates, Norway, and Nigeria) from the regressions reported below. 26 Because of concerns about correlations of the error term across years, but with a common country, columns 3 and 6 report the same specification as columns 2 and 5, but with all of the data converted to two non-overlapping subperiods. 27 Direct investment is measured here at historical cost, as the BEA does not provide a geographical breakdown of direct investment position at either current cost or market value.
16
sample.28 The same calculation is repeated in column (2) but with every country assumed to
have the U.S. tax rate instead of its own effective tax rate. Since the U.S. tax rate consistently
exceeds the average tax rate abroad (table 4), the “predicted income” in column (2) is
consistently below that for column (1). The difference between the two values is our estimate of
the net income shifted out of the United States, and is shown in column (3). The 51 countries
accounted for 81.5 percent of FDI income receipts in 2004. 29 We find that U.S. firms reported
an “extra” $28.5 billion earned abroad in 2004, or an average of 15 percent of total receipts over
the 6 years. Thus, income shifting on outward FDI could account for as much as 1-1.5
percentage points of the return on FDI assets shown in figure 3, equal to about one-third of the
gap between the return earned on outward investment and the benchmark return of nonfinancial
corporate capital.
Conclusion
Whether the United States can continue to earn positive or near-zero net investment
income will have a direct impact on the size of the current account imbalance over the short to
medium term. The fact that the U.S. has done so to date, despite a large and growing net
international indebtedness position, has provoked a stream of research on the sources of the rate
of return differential. Such explanations have focused on observable characteristics of firms,
data quality issues, and the importance of including valuation changes in the measure of the
return.
We argue here that tax-induced income shifting is an important part of the story. Using
country-specific income and tax data, we find that about one-third of the excess return earned by
U.S. corporations abroad can be explained by firms reporting “extra” income in low tax
jurisdictions of their affiliates. We caution, however, against more extreme attempts to reconcile
the return puzzle by restating the official balance of payments figures. The official data may
exaggerate the U.S. FDI premium, but its size and persistence suggest that the return differential
is quite real.
28 Due to data limitations the number of countries included was below 51 in some years. 29 The geographical distribution of direct investment income is reported without a current cost adjustment and net of withholding taxes. In 2004 these adjustments reduced aggregate income earned on direct investments abroad by $23 billion.

17
We conclude by stressing the importance of the BEA’s expanding the accounts to
document the separate contributions of price changes, exchange rate changes and revaluations at
the level of individual asset categories. At least three research papers (Curcuru et al, 2007,
Gourinchas-Rey, 2007, and Tille, 2003) have produced unofficial measures; but only the BEA
can produce consistent estimates that would facilitate analysis based on both nominal and total
returns.
18
References
Bach, Christopher L. 2005. “Annual Revisions of the U.S. International Accounts, 1991-2004,”
Survey of Current Business (July): 54-67.
Bernard, Andrew B., J. Bradford Jensen, and Peter K. Schott. 2006. “Transfer Pricing by U.S.-Based Multinational Firms,” Tuck School of Business Working Paper No. 2006-33.
Bosworth, Barry P., Susan M. Collins. 2006. “Economic Growth,” in Susan M. Collins, Barry P. Bosworth, and Miguel A. Soto-Class eds., The Economy of Puerto Rico (Washington, D.C.: Brookings Institution): 17-69.
Buiter, Willem. 2006. “Dark Matter or Cold Fusion?’ Global Economics Paper no. 136, London: Goldman Sachs (16 January).
Bureau of Economic Analysis. 2007. “News Release: U.S. International Investment Position, 2006.” http://www.bea.gov/newsreleases/international/intinv/2007/pdf/intinv06.pdf.
Cline, William. 2005. The United States as a Debtor Nation, Washington D.C.: Institute for International Economics and the Center for Global Development.
Curcuru, Stephanie E., Tomas Dvorak, and Francis E. Warnock. 2007. “The Stability of Large External Imbalances: The Role of Return Differentials,” NBER Working Paper 13074, Cambridge, MA.
Gourinchas, Pierre-Olivier and Hélène Rey. 2007. "From World Banker to World Venture Capitalist: US External Adjustment and the Exorbitant Privilege," in Richard H. Clarida (ed.), G7 Current Account Imbalances: Sustainability and Adjustment, The University of Chicago Press, pp. 11-55.
Gros, Daniel. 2006a. “Foreign Investment in the US (I): Disappearing in a Black Hole?” CEPS Working Document No. 242, Centre for European Policy Studies, Brussels, April.
______. 2006b. “Foreign Investment in the US (II): Being Taken to the Cleaners?” CEPS Working Document No. 243, Centre for European Policy Studies, Brussels, April.
Grubert, Harry. 1997. “Another Look at the Low Taxable Income of Foreign-Controlled Companies in the United States,” U.S. Treasury Department, Office of Tax Analysis Paper 74 (October).
Grubert, Harry, Timothy Goodspeed, and Deborah Swenson. 1993. “Explaining the Low Taxable Income of Foreign-Controlled Companies in the United States,” in Alberto Giovannini, R. Glen Hubbard, and Joel Slemrod, eds., Studies in International Taxation. (Chicago: University of Chicago Press): 237-70.
Grubert, Harry, and John Mutti. 1991. "Taxes, Tariffs and Transfer Pricing in Multinational Corporation Decision Making," Review of Economics and Statistics (May): 285-293.
Grubert, Harry, and Joel Slemrod. 1998. “The Effect of Taxes on Investment and Income Shifting to Puerto Rico,” Review of Economics and Statistics, Vol 80, No. 3: 365-73.
19
Harris, David, Randall Morck, Joel Slemrod, and Bernard Yeung. 1993. "Income Shifting in U.S. Multinational Corporations," in Alberto Giovannini, R. Glenn Hubbard, and Joel Slemrod (eds.), Studies in International Taxation (Chicago: University of Chicago Press): 277-98.
Hausmann, Ricardo and Federico Sturzenegger. 2006. “Global Imbalances or Bad Accounting? The Missing Dark Matter in the Wealth of Nations.” Harvard University, Center for International Development Working Paper 124.
Higgins, Matthew, Thomas Klitgaard, and Cédric Tille. 2007. “Borrowing without Debt? Understanding the U.S. International Investment Position,” Business Economics, 42, No 1.
Hines, James R. Jr. 1997. “Tax Policy and the Activities of Multinational Corporations,” in Alan J. Auerbach (editor), Fiscal Policy: Lessons from Economic Research. Cambridge Mass.: MIT Press: 401-45.
Hines, James R.Jr., and Eric M. Rice. 1994. “Fiscal Paradise: Foreign Tax Havens and American Business,” The Quarterly Journal of Economics, Vol. 109, No. 1. (Feb.): 149-182.
Hobbs, James.2006. “Foreign-Controlled Domestic Corporations, 2003,” Statistics of Income Bulletin (Summer): 67-112. Available at: http://www.irs.gov/taxstats/article/0,,id=162576,00.html
Honohan, Patrick, and Brendan Walsh. 2002. “Catching Up With the Leaders: the Irish Hare,” in William C. Brainard and George L. Perry eds., Brookings Papers on Economic Activity, I: 1-57.
Huang, Juann H., and Angelo Mascaro. 2004. “Return on Cross-Border Investment: Why Does U.S. Investment Abroad Do Better?” Technical Paper no. 2004-17, Washington, D.C.: Congressional Budget Office (December).
Huizinga, Harry and Luc Laeven. 2006. “International Profit Shifting within Multinationals: a Multi-country Perspective.” European Economy, European Commission Economic Papers, number 260. Brussels, Belgium.
Kitchen, John. 2006. “Sharecroppers or Shrewd Capitalists? Projections of the U.S. Current Account, International Income Flows, and Net International Debt.” Unpublished manuscript, Office of Management and Budget (February).
Landefeld, Steven and Ann Lawson. 1991. “Valuation of the U.S. Net International Investment Position,” Survey of Current Business (May): 40-49.
Landefeld, J. Steven, Ann M. Lawson, and Douglas B. Weinberg. 1992. “Rates of Return on Direct Investment.” Survey of Current Business, Bureau of Economic Analysis, (August): 79-86
Lane, Philip R., and Gian Maria Milesi-Ferretti. 2001. “The External Wealth of Nations: Measures of Foreign Assets and Liabilities for Industrial and Developing Nations,” Journal of International Economics, Vol. 55, Issue 2, pp. 263–94.
______. 2003. “International Financial Integration,” IMF Staff Papers, 50 special issue: 82-113.
Lipsey, Robert. 2006. “Measuring International Trade in Services,” NBER Working Paper 12271. Cambridge, MA.

20
Mataloni, Raymond J. Jr.2000. “An Examination of the Low Rates of Return of Foreign-Owned U.S. Companies,” Survey of Current Business (March): 55-73.
McGrattan, Ellen R., and Edward C. Prescott. 2006. “Technology Capital and the U.S. Current Account,” Federal Reserve Bank of Minneapolis Research Department Working
Paper 646 (November).
Tille, Cédric. 2003. “The Impact of Exchange Rate Movements on U.S. Foreign Debt.” Current Issues in Economics and Finance 9 (1), Federal Reserve Bank of New York.
______. 2005. “Financial Integration and the Wealth Effect of Exchange Rate Fluctuations,” Staff Reports 226, Federal Reserve Bank of New York.

Figure 1. U.S. Net Investment Income and International Assets, 1976-2006Billions of Dollars
Source: BEA, U.S. International Transactions Accounts and International Investment Position at Yearend. Available at: http://www.bea.gov/international/index.htm
-160
-120
-80
-40
0
40
80
1976 1981 1986 1991 1996 2001 2006-2,800
-2,100
-1,400
-700
0
700
1,400Net investment income
(left scale)
Net international assets(right scale)
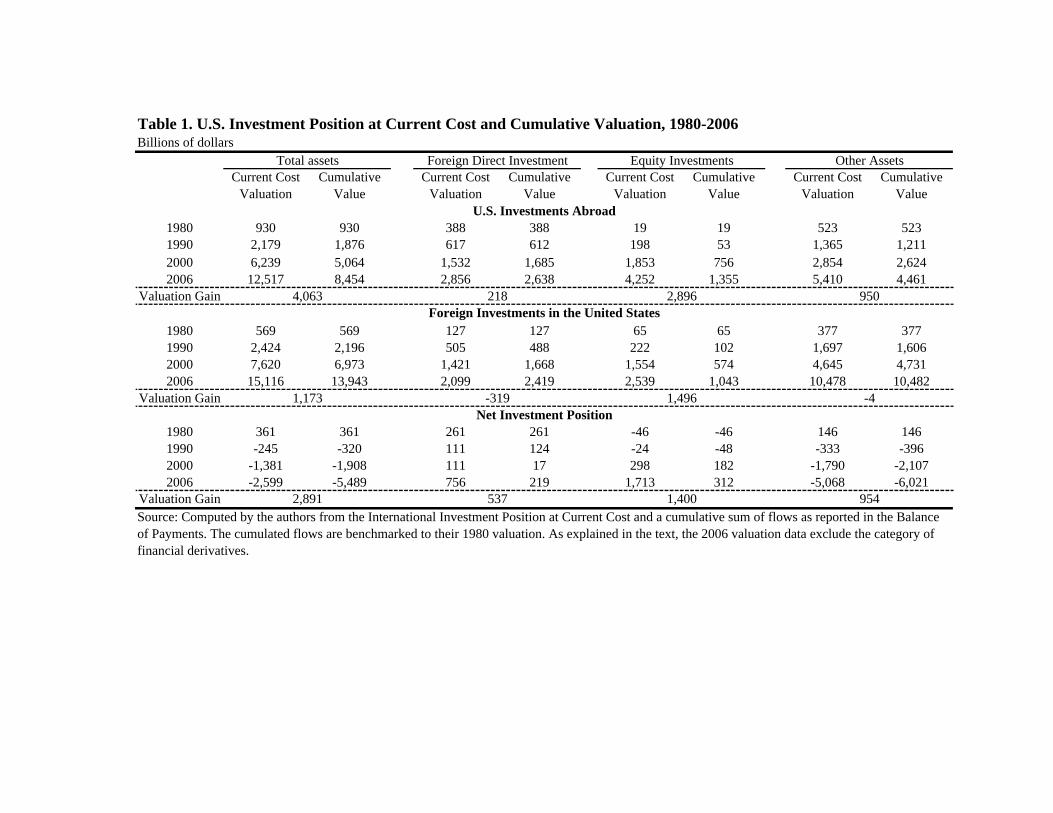
Table 1. U.S. Investment Position at Current Cost and Cumulative Valuation, 1980-2006Billions of dollars
Current Cost Valuation
Cumulative Value
Current Cost Valuation
Cumulative Value
Current Cost Valuation
Cumulative Value
Current Cost Valuation
Cumulative Value
1980 930 930 388 388 19 19 523 5231990 2,179 1,876 617 612 198 53 1,365 1,2112000 6,239 5,064 1,532 1,685 1,853 756 2,854 2,6242006 12,517 8,454 2,856 2,638 4,252 1,355 5,410 4,461
Valuation Gain
1980 569 569 127 127 65 65 377 3771990 2,424 2,196 505 488 222 102 1,697 1,6062000 7,620 6,973 1,421 1,668 1,554 574 4,645 4,7312006 15,116 13,943 2,099 2,419 2,539 1,043 10,478 10,482
Valuation Gain
1980 361 361 261 261 -46 -46 146 1461990 -245 -320 111 124 -24 -48 -333 -3962000 -1,381 -1,908 111 17 298 182 -1,790 -2,1072006 -2,599 -5,489 756 219 1,713 312 -5,068 -6,021
Valuation Gain 954
-41,496
2,896
1,400
2184,063
2,891 537
-3191,173
Source: Computed by the authors from the International Investment Position at Current Cost and a cumulative sum of flows as reported in the Balance of Payments. The cumulated flows are benchmarked to their 1980 valuation. As explained in the text, the 2006 valuation data exclude the category of financial derivatives.
Total assets Foreign Direct Investment Equity Investments Other Assets
U.S. Investments Abroad
Foreign Investments in the United States
Net Investment Position
950
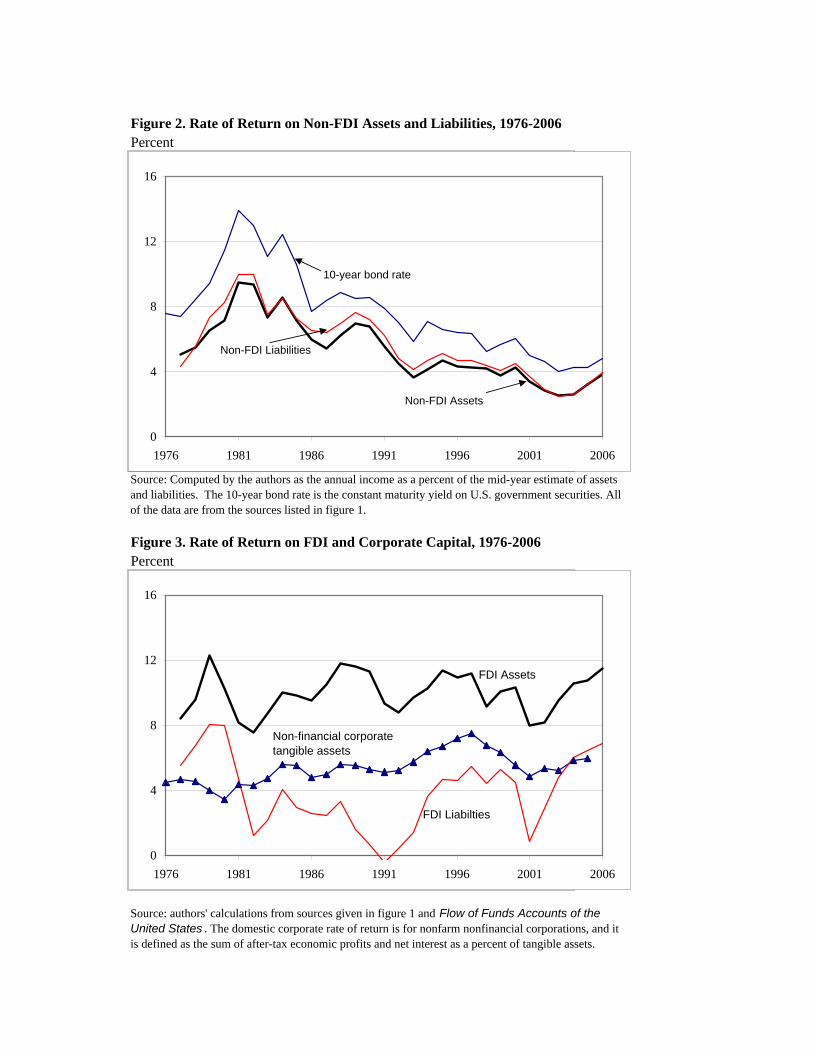
Figure 2. Rate of Return on Non-FDI Assets and Liabilities, 1976-2006Percent
Figure 3. Rate of Return on FDI and Corporate Capital, 1976-2006Percent
Source: Computed by the authors as the annual income as a percent of the mid-year estimate of assets and liabilities. The 10-year bond rate is the constant maturity yield on U.S. government securities. All of the data are from the sources listed in figure 1.
Source: authors' calculations from sources given in figure 1 and Flow of Funds Accounts of the United States . The domestic corporate rate of return is for nonfarm nonfinancial corporations, and it is defined as the sum of after-tax economic profits and net interest as a percent of tangible assets.
-100.00
-75.00
-50.00
-25.00
0.00
25.00
50.00
1976 1981 1986 1991 1996 2001 2006-2,800
-2,100
-1,400
-700
0
700
1,400Net investment income
Net international assets(right scale)
0
4
8
12
16
1976 1981 1986 1991 1996 2001 2006
Non-FDI Assets
Non-FDI Liabilities
10-year bond rate
-100.00
-75.00
-50.00
-25.00
0.00
25.00
50.00
1976 1981 1986 1991 1996 2001 2006-2,800
-2,100
-1,400
-700
0
700
1,400Net investment income
Net international assets
0
4
8
12
16
1976 1981 1986 1991 1996 2001 2006
FDI Assets
FDI Liabilties
Non-financial corporate tangible assets

Table 2. Valuation Changes on the International Investment Position, 1990-2006USD Billions
Total PriceExchange
RateOther
Revaluations Total PriceExchange
RateOther
RevaluationsNet1990-95 299 -73 42 330 239 -157 77 3191995-2000 180 -5 -370 555 -208 15 -563 3402000-06 2,235 924 311 1,000 2,905 1,604 470 832
Outward1990-95 464 169 57 237 663 331 94 2371995-2000 582 840 -419 161 1,416 1,867 -607 1562000-06 2,593 1,281 408 904 2,690 1,324 561 804
Inward1990-95 165 243 15 -93 424 488 17 -811995-2000 402 845 -49 -394 1,625 1,852 -43 -1842000-06 358 357 96 -96 -216 -280 91 -27Source: BEA, Changes in selected major components of the international investment position, 1989-2006. As explained in the text, the 2005 and 2006 data exclude the category of financial derivatives.
With FDI at Market ValueWith FDI at Current Cost

Table 3. Rate of Return, Domestic and Foreign-Controlled Firms, 1995-2003Percent
Domestic Controlled
Foreign Controlled
Differential (1-2)
Domestic Controlled
Foreign Controlled
Differential (4-5)
(1) (2) (3) (4) (5) (6)Panel A. All Sectors
1995 7.1 4.0 3.1 9.8 10.1 -0.41996 6.9 3.7 3.3 9.5 9.2 0.31997 6.6 4.1 2.5 9.0 8.6 0.41998 5.2 2.3 2.9 7.9 8.3 -0.31999 5.0 2.8 2.2 7.7 8.5 -0.82000 4.4 2.3 2.1 7.9 8.2 -0.32001 2.8 -0.8 3.6 6.8 7.1 -0.32002 2.7 -0.6 3.2 6.4 7.6 -1.12003 3.4 0.8 2.6 6.3 6.4 -0.1
Panel B. All Sectors excluding FIRE1995 10.8 5.1 5.7 15.8 10.9 4.91996 11.0 3.5 7.5 16.0 9.1 6.91997 10.8 3.6 7.2 16.3 8.6 7.71998 8.1 2.3 5.8 13.9 8.9 5.01999 7.1 2.5 4.6 13.3 9.3 4.02000 5.4 2.1 3.3 12.4 8.3 4.12001 3.2 -1.1 4.3 11.1 7.3 3.82002 3.1 -0.5 3.6 10.9 8.3 2.62003 4.9 0.5 4.4 11.1 7.2 3.9
Memo: 1995-2003 average share of total net worth in firms reporting zero or negative income (all sectors).Domestic Controlled 12.7
Foreign Controlled 30.2
Source: U.S. Department of Treasury, Statistics on Income, and authors' calculations.
All firms Firms with positive net income
Percent
Figure 5. Average Effective Tax Rates, 1999-01 and 2002-04Percent
Note: Effective tax rate is based on total taxes paid and total income earned over years 1999-2001 and 2002-04, respectively.
Source: Authors' calculations based on BEA, Financial and Operating Data, Tables III.E 5 and III.E 6, various years; University of Michigan World Tax Database.
Source: Authors' calculations based on BEA, Financial and Operating Data, Tables III.E 5 and III.E 6, various years.
Note: Effective foreign tax rate is computed as total taxes paid divided by the sum of taxes paid and net income, averaged over 2001-2003. Top domestic tax rate is for year 2002.
Figure 4. Correlation between Effective Foreign Tax Rate and Top Domestic Rate
ARE
BMU
NGA
DOMBRB
NOR
LUXIRL
NLD
0
10
20
30
40
50
60
70
0 10 20 30 40 50 60 70Top Domestic Tax Rate
Eff
ectiv
e Fo
reig
n T
ax R
ate
U.S.
IRL
NOR
BRB
NGA
BMU
ARE
HUN
PRT
BRA
EGY
0
10
20
30
40
50
60
70
0 10 20 30 40 50 60 701999-2001
2002
-200
4
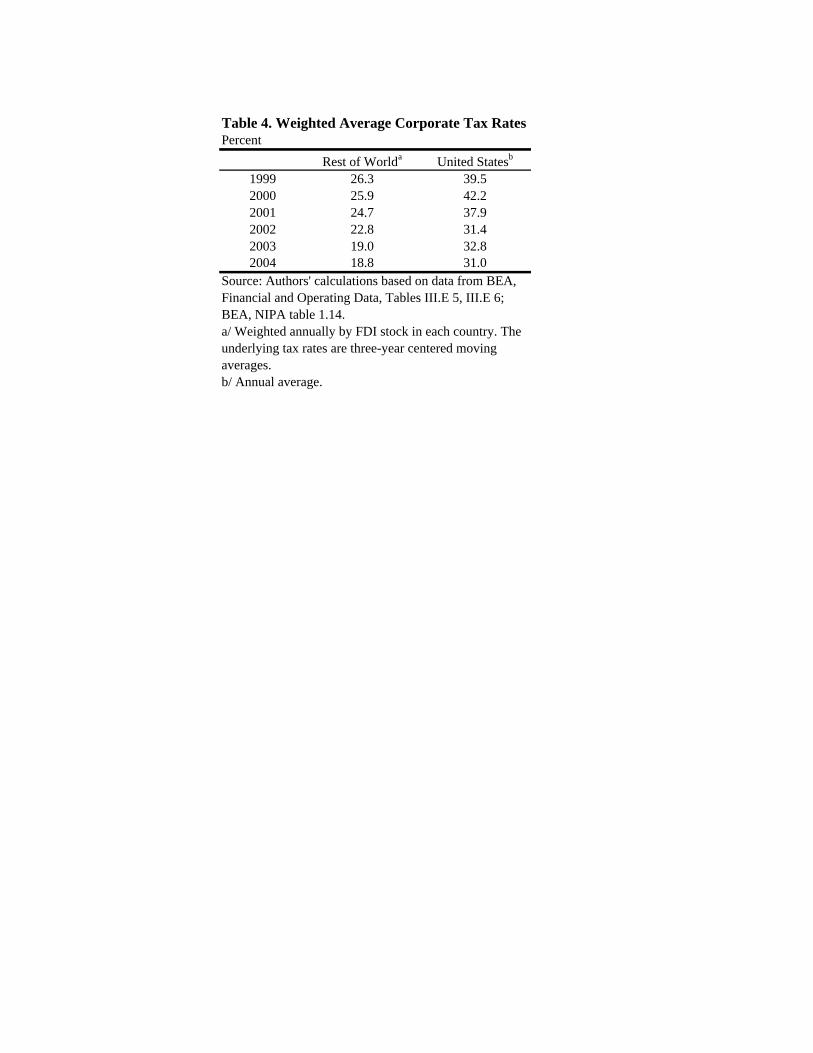
Table 4. Weighted Average Corporate Tax RatesPercent
Rest of Worlda United Statesb
1999 26.3 39.52000 25.9 42.22001 24.7 37.92002 22.8 31.42003 19.0 32.82004 18.8 31.0
b/ Annual average.
Source: Authors' calculations based on data from BEA, Financial and Operating Data, Tables III.E 5, III.E 6; BEA, NIPA table 1.14.a/ Weighted annually by FDI stock in each country. The underlying tax rates are three-year centered moving averages.

Table 5. OLS Regressions of Foreign Income
Annual Annual 3 year average Annual Annual 3 year average(1) (2) (3) (4) (5) (6)
Tax Rate -0.032 -0.015 -0.016 -0.045 -0.018 -0.014(6.84) (4.78) (2.92) (9.80) (5.90) (3.55)
Log GDP 0.78 0.12 0.09 0.83 0.23 0.20(19.28) (2.79) (1.28) (22.47) (6.15) (3.75)
Trade/GDP 0.009 0.003 0.002 0.007 0.001 0.002(8.48) (3.93) (1.69) (6.95) (1.88) (1.64)
Log Distance -0.57 -0.15 -0.02 -0.49 -0.04 -0.07(5.77) (2.14) (0.19) (5.33) (0.59) (0.76)
Log DI Stock 0.77 0.83(19.52) (13.26)
Log equity 0.73 0.75(21.16) (15.09)
Constant 2.48 -0.27 -1.47 2.37 -1.46 -1.08(2.79) (0.45) (1.58) (2.94) (2.75) (1.38)
Adjusted R-squared 0.63 0.85 0.87 0.70 0.88 0.91Observations 290 285 97 284 284 100
T statistics are reported in parentheses.
Log Direct Investment Income Log Foreign Affiliate Income
Source: BEA, Financial and Operating Data, Tables III.E 5, III.E 6, and III.B 1-2, various years; BEA, U.S. Direct Investment Abroad Historical Data, Tables 11_9905 and 13_9905; World Bank, World Development Indicators; and authors' calculations.
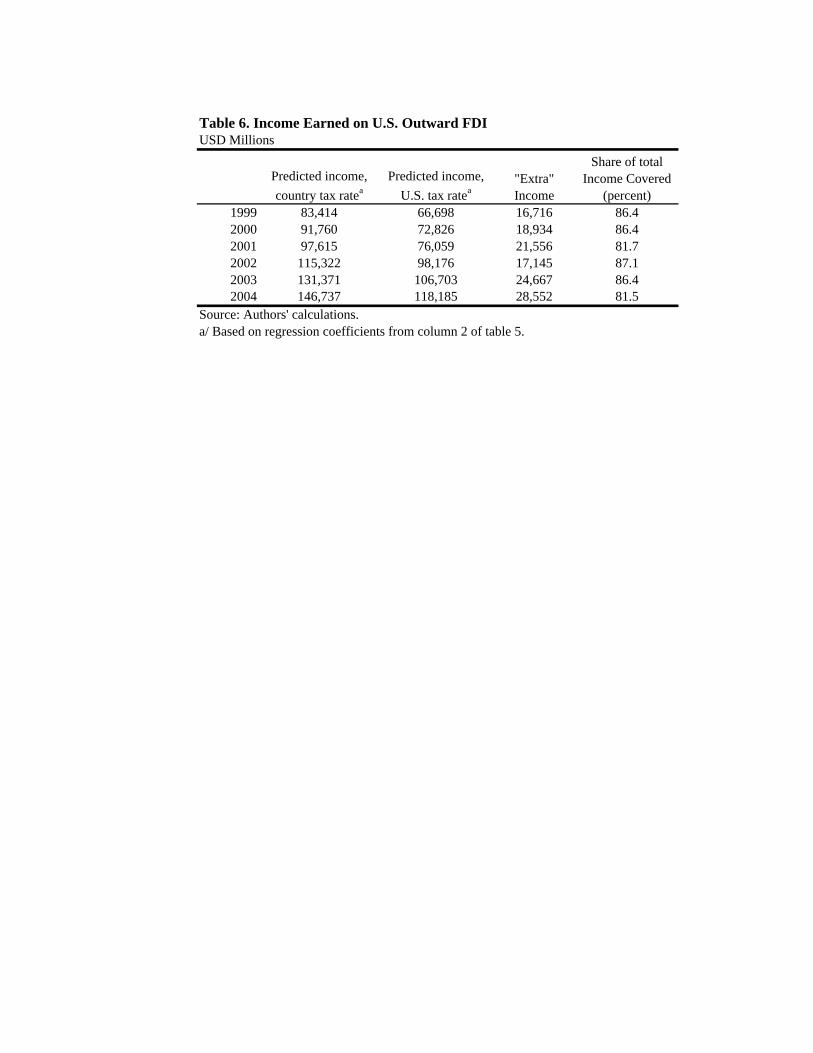
Table 6. Income Earned on U.S. Outward FDIUSD Millions
Predicted income, country tax ratea
Predicted income, U.S. tax ratea
"Extra" Income
Share of total Income Covered
(percent)1999 83,414 66,698 16,716 86.42000 91,760 72,826 18,934 86.42001 97,615 76,059 21,556 81.72002 115,322 98,176 17,145 87.12003 131,371 106,703 24,667 86.42004 146,737 118,185 28,552 81.5
Source: Authors' calculations.a/ Based on regression coefficients from column 2 of table 5.