returns to research for beef carcass quality...
TRANSCRIPT
33rd Annual Conference of the Australian Agricultural Economics Society, Lincoln College, New Zealand, 7·9 February 1.989
RETURNS TO RESEARCH FOR BEEF CARCASS qUALITY IIVIPROVEMENT IN AUSTRALIA
Thomas Voon and Geoff Edwards School of Agriculture, LaTrobe University
ABSTRAc'r
Dark .. cutting (DC) in beef has become an important quality problem facing the Australian beef industry. DC beef appears dark, firm and dry (DFD), an] compared with meat of normal pH, DFD meat bas a lower organoleptic property (reduced meat flavour) and a poorer keeping qualit.y which makes it unsuitable for V2.cuum packa.~ing and export. It is rejected as high quality table beef by the meat industry The uV'''rage incidence of DC in A ustralia has been estimated to be in the range 8·10%.
DC is reducing the overall returns to Australian beef producers, and is redistributing income from producers whose production exhibits a relatively low incidence of DC to those wLose production has a high incidence. Economic losses are incurred in the form ol! depressed prices for DFD carcasses, diversion of top quality primal cuts to mince or manufactured meat, and possib!y lower demand due to loss of reputation for the beef ind'lstry.
The incidence of DC may be reduced by research into animal management (e.g. improved handling of animals) and alternative marketing systems (e.g. computer marketing). An inadvertent flow of DFD meat from the abattoir to consumers could be avoided if some form of sorting or objective classification were available.
There is a lack of scientific and economic research into m· 11. quality for the Australian beef industry. Past research focussed on shifting su?ply curves by reducing costs and raising yields. In the present paper, an economic framework based on the concept of economic surplus is developed to make an illustrative calculation of the size of economic gains accruing to producers and consumers as a result of intprovement in meat colour in beef carcasses. Meat colour improvemellt in carcasses eliminates the price reduction effect caused by DC at carcass sales. It is estimated that, on a national basis, improvement in meat colour in beef carcasses resulting from 50% reduction in DC would contribute a gross annual saving averaging $ 10 million in table quality beef, (.f which 20% accrues to producers and 80% to consumers.
Our current analysis consi itutes only a part of an overall assessment of reducing DC in beef. The present estimation )fily covers a certain percentage of dark carcasses acceptable at retail trade with appropria' e price discounting, Due to DC and product hetetogeneity, meat colour of beef carcasses, aries widely {rom normal and mature-red meat to extremely dark coloured meat. A certain oercentage of carcasses with very dark and dull meat colour may not be acceptable for retail trade even with pi-ice discounting. These carcasses 10uld be diverted to alternative uses (e.g. the production (If mince and processed meat) by wholesalers or abattoir operators. Our present analysis does not account for benefits and costs that a reduction in DC would cause through reducing the 'diversion' effect and the inadvertent flow of undetected DC meat from the abattoir to consumers. Further research is need("d to allow for a full benefit-cost appraisal of reducing DC in beef.
1 An Economic Evaluation of DarktA~JuttingBeef in Australia
1.1 The Probleln of Meat Colour Variation in Beef Carcasses
Quality is a. collective attribute or characteristics which make a. product what it is. It may be precisely expressed by the value of different traits which described the product. Past research revealed that meat colour has been an important trait. An empirical study by Porter and Todd (1985) showed that meat colour, rat colour, meat texture and rat tex.ture were important explanators o£ carcass price variations. In a $ul'vey on the attitudes of retailers to beef carcass ciassificiJ,tion, Wilson and Wissemann (1981) discovered that mea.t colour was considered the most importan.t charaderistic to be included in future objective classifi~ation system. This view is supported by the results of Portf"r and Todd (1985).
Changes in meat colour could influence consumers' acceptability of the product. In the market place, buyers would naturally prefer fresh bright-red beef to either pale or dark coloured beef. This is due to the Cact that most buyers presume that discoloured beef may be derived f"'om old, sicked or diseased animals. Besides, buyers have a notion that di5coloured beef may be stale, da.ted, unfresh or contaminated. This happens in spite of the fact that there seems to be no dear relationship between colour defects and meat spoilage. Buyers are willing to purchase more and/or pay a higher price for normal bright.-ted meat rela.tive to the dark meat.
Colour variation in beef carcasses is mainly caused by the dark-cutting (DC) phenomenon and by the age of an animal (see WarneI I 1988 for detail). The darker colour of meat due to dark .. cutting and the more red colour of meat from older animals have traditionally conveyed messages of p~or eating quality.
1.2 Economic Implications of Discolouration in Meat
Ea.rly studies on the effects of discolouration on consumers' demand for beef (round 5~eak) was undertaken by Hood and Riordan (1973). The studies shows that the percent total sales of round steak at Dublin supermarkets decreased proportionately with increase in the extent of discolouration. In other words, consumers' demand tor .. ':-t'nd steak dropped when the rate of discolouration rises. In a survey of 141 Dublin housewives, for instance, 72% stated that they disliked both dath-ted and brown beef since they considel·et~ such discoloured meat to be of inferior quality. Consumers tend to be very sensitive to meat co!our variation particuJ.d.r1y at retail chains or hig butcher shops where arrays of dIfferent types of rf'!! ~eat are ..fi/~played together. Supermarket operators would not normally accept discok,ured mea.t unle'is it is discounted to a pomt at which profitabIlity is not sacrificed.
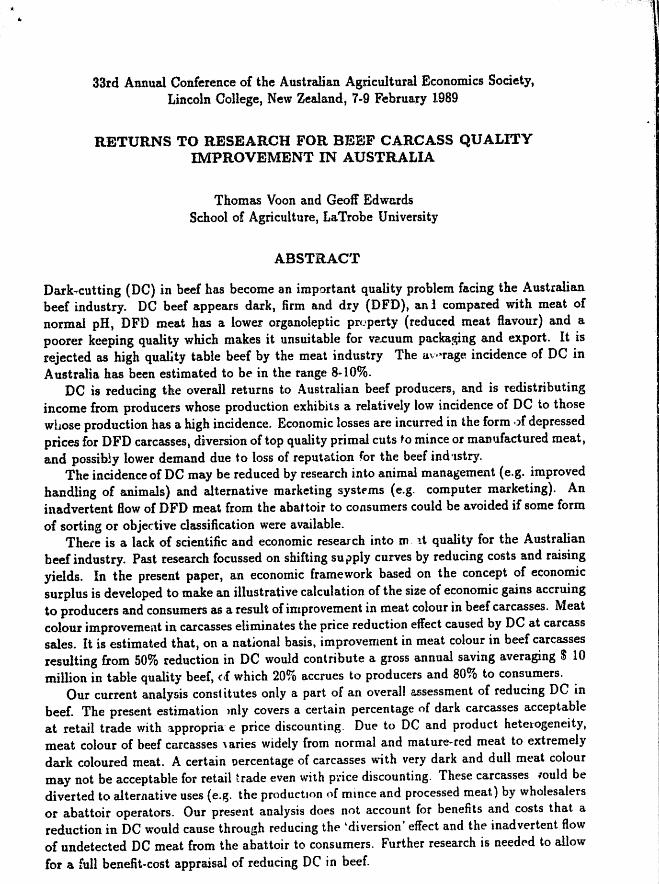
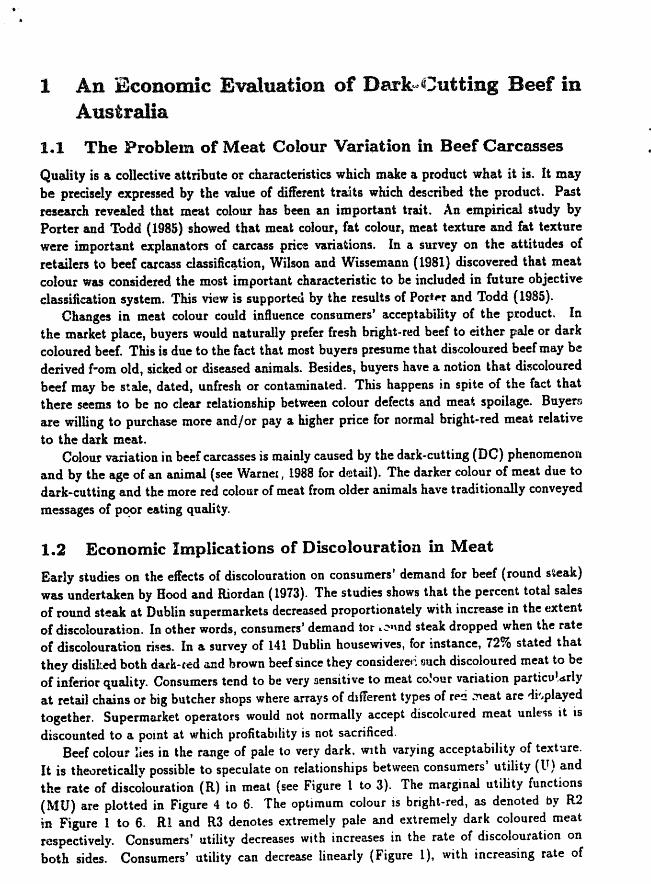
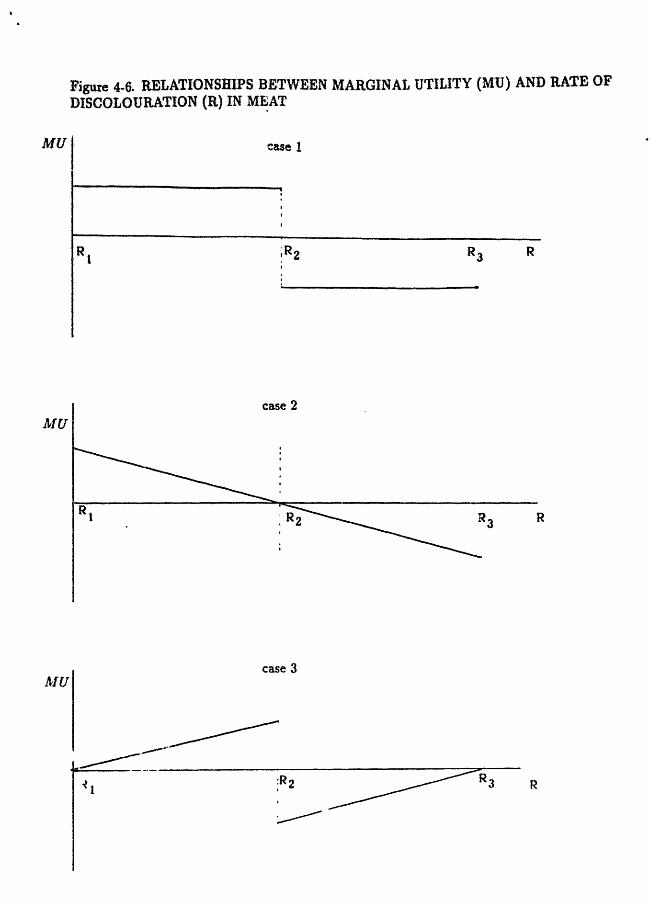
Beef colour lies in the range of pale to very dark. WIth varying acceptability of text:n.re. It is thearetically possible to speculate on relationships between consumers' utility (U) and the rate of discolouration (R) in meat (see Figure 1 to 3). The marginal utility functions (MU) are plotted in Figure 4 to 6. The optimum colour is bright-red, as denoted by R2 in Figure 1 to 6. Rl and R3 denotes extremely pale and extremely dark coloured meat respectively. Consumers' utility decreases with increases in the rate of discolouration on both sides. Consumers' utility can decrease linearly (Figure 1), with increasing rate of

Figure 1 .. 3. RELA'rIONSHIPS BETWEEN CONSUMER UTILITY (U) AN.D RATE OF DISCOLOURATluN (R) ~. MEAT
u case 1
(J case 2
case 3 u
. \
o
R a
D
R
D
lvlU
AIU
Figure 4.6. RELATIONSmpS BETWEEN MARGINAL UTILITY (MU) AND RATE OF DISCOLOURATION (R) IN M~AT
case 1
R
case 2
R
case 3
<ii.colouration (Figure 2) or with decreasing rate of discolouration (Figure 3) depending on the type of mea.t, the nature of discolouration and individual tastes and preferences. For linear .funcnon (case l), consumers' satisfaction drops in a constant fashion when meat either turns paler {towards the left) or darker (~I)wards the right). For increasing {unction (case 2), consumers' utility drops very slowly in th~ beginning in either directions, that is consumers seem to be quite indifferent to or unaffected by initial colour change. When discolouration increases, however, consumers' utility begins to drop sharply. The opposite changes apply to the decreasing function (case 3) in which consumers' utility drops very rapidly in the beginning indicating that consumers are extremely sensitive to discolouration in meat. At points Rl and RaJ the commodity could be completely discarded by consumers in the market place due to extreme discolouration. In the economists' point of view, case 3 phenomenon could yield a more severe economic repercussion than either case 2 or case 1 phenomenon because meat with even slight discolouration will be discriminated against by the buyers. Quality impl'')vement in this case would increa.se consumers' utility markedly and this can be socially desir&ble. Thus, one of the criteria for quality (colour) improvement research ma.y be based on the way in which consumers' utility or the consumption patterns Call relative to meat colour change.
The existence of linearity and non-linearity functions were investigated by Hayenga et al. (1985) in their studies on a carcass merit system for pork. Their studies were based on hedonic price variations in relation to incremental changes in carcass weight, backfat thickness and muscling. When the backfat and carcass weight variables are specified as continuous rather than discrete, carcass weight exhibits a non-linear relationship with carcass value, with increasing discounts appropriate as carcass weight increases. However, the backCat carcass value relationship did not exhibit any significant non-linea.rity. In analysis of meat colour, similar premium-discount matrix for assessing carcass values resulting from variations in meat colour can be obtained provided such da.ta exist. This, however, warrants further research because as yet there is no objective system for appraising meat colour. Research priority should thus be devoted to studying as well as deVIsing appropriate objective classification methods for assessing meat colour.
1.3 Economic Losses and The Alternative Uses of Dark-Cutting Beef
DC beef has the following characteristics: dark, firm and dry conditions; reduced shelf-life; reduced meat flavour; and the presence of spoilage odours. The extent to which economic losses are incurred Crom DC in beef depends on the specific methods used for measuring 0 FD meat, the ways in which beef are marketed and the ways in which DFD meat are used. Up to now J commercial assessment of .DC bet'!f has been subjectively based on individunl appraisal of appearances} particularly meat colour. Measurement of pH values as a means for judging al1d confirming the occurrences of OC poses some technical problems to the beef industry. It is extremely difficult, for instance, to accura.tely determine a threshold point at which DC occurs. Due to the eX:6tence of intermediate stages betwt't"n 'extreme' DFD meat and so-called normal meat, meat which is considered to be OFO may havt" normal appearance. Therefore. under current subjective assessment, DFO meat may bt" presumt"d to be normal by some traders and consequently this may lead tn an under-estImatIon of economic losses
r
-il .... --IZ'Ia"I'~.i
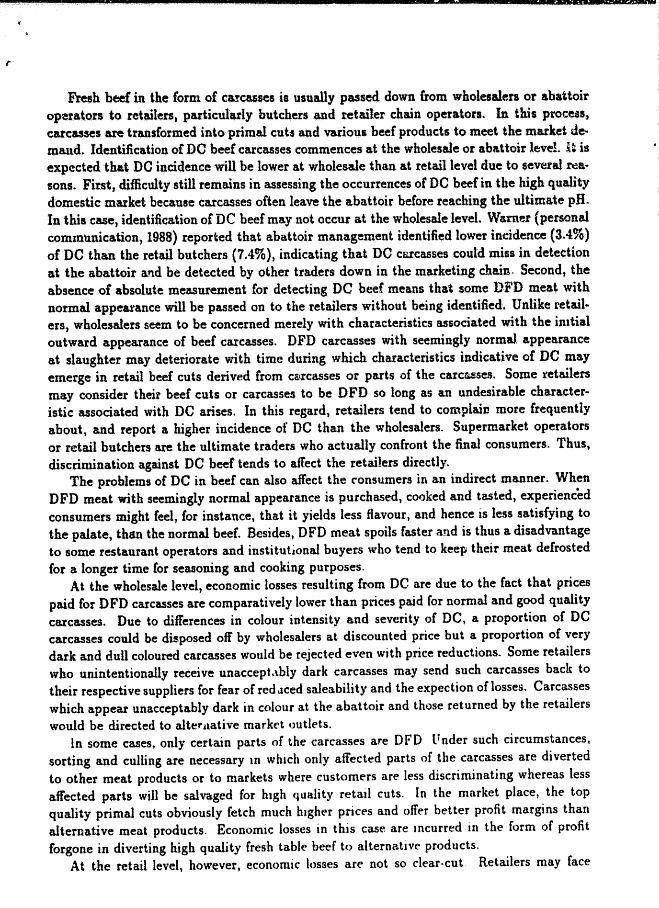
FreJ5h beef in the form of carcuses is usually passed down from wholesalen ot abattoir operators to retailers. particularly butchers and retailer chain operators. In this procca.) carcasses are transformed into primal cub and vadoUlbeef products to meet the muket demand. Identification of DC beef carcasses commences at the wholesale or abattoir level. U is expected that DC incidence will be lower at wholesale than at tetaillevel due to several rea· sons. First, difficulty stilltemains in assessing the occurrences of DC beef in the high quality domestic market because carcasses often leave the abattoir before reaching the ultimate pH. In this case, identification of DC beef may not occur at the wholesale level. Warner (personal communication, 1988) reported that abUottoir management identified lower incidence (3.4%) of DC than the retail butchers (7.4%), indicating that DC carcasses could miss in detection at the abattoir and be detected by other traders down in the marketing chain. Second, the absence of absolute measurement for detecting DC beef means that some DF'D meat with normal appearance will be passed on to the retailers without being identified. Unlike retail· ers, wholesalers seem to be concerned merely with characteristics associated with the instial outward appearance of beef carcasses. DFD carcasses with seemingly normal appearance at slaughter may deteriorate with time during which characteristics indicative of DC may emerge in retail beef cuts derived from ca\tcasses or parts of the carcuses. Some retailers may consider their beef cuts or carcassetJ to be D FD so long as an undesirable characteristic associated with DC arises. In this regard, retailers tend to complain more frequently about, and report a higher incidence of DC than the wholesalers. Supermarket operators or retail butchers are the ultimate traders who actually confront the final consumers. Thus, discrimination against DC beef tends to affect the retailers directly.
The problems of DC in beef can also affect the consumers in an indirect manner. When DFD meat with seemingly normal appearance is purchased, cooked and tasted, experienced consumers might feel, for instance, that it yields less flavour, and hence is less satisfying to the palate, than the normal beef. Besides, DFD meat spoils faster and is thus a disadvantage to some restaurant operators and institubonal buyers who tend to keep their meat defrosted for a longer time for seasoning and cooking purposes.
At the wholesale level, eeonomic losses resulting from DC are due to the fact that prices paid for DFD carcasses are comparatively lower than prices paid for normal and good quality carcasses. Due to differences in colour intensity and severity of DC, a proportion of DC carcasses could be disposed off by wholesalers at discounted price but a proportion of very dark and dull coloured carcasses would be rejected even with price reductions. Some retailers who unintentionally receive unaccept.\bly dark carcasses may send such carcasses badt to their respective suppliers for fear of red Jced saleability and the expection of losses. Carcasses which appear unacceptably dark in colonr at the abattoir and those returned by the retailers would be directed to alterl1ative market t)utlet,s.
in some cases, only certain parts of the carcasses are DFD Pnder such circumstances, sorting and culling are necessary ill which only affected parts of the carcasses are diverted to other meat products or to markets where customers are less discriminating whereas less affected parts will be salvaged for hIgh quality retail cuts. In the market place, the top quality primal cuts obviously fetch much lugher prices and offer better profit margins than alternative meat products. EconomIc losses in this case are lflcurred III the form of profit forgone in diverting high quality fresh table beef to alternative products.
At the retail level, however, economic losses are not so clear-cut. Retailers may face

the problems wsing from reduced saleability of DFD meat due to abnormal appearances.
Quality deterioration ofa product would certainly lead to a lower demand ror tha.t product.
It b neveriheless very difficult to quantify economic losses resulting from reduced saleability
or a product unless data. are available indicating the actu$llo$s in sales" There are instances
where losses are due to reduced sheJI;.U£e of DC beef particulady when it is vacuum .. packed.
DC bL-ef with seemingly normal appearance poses some problems for the retaners as well.
Indirect loasesare incurred from reduced storability and unexpected discolouration. In cases
where DC beef is sent back to the wholesalers, retailers may still lia.ble to unnecessary
transporta.tion charges and may face the difficulties of filling orders or meeting demand of
their customers. Consumers. could also be aft"ected by the incidence of DC directly and indirectly via
unexpected consumption of m.eat which yields less flavour (le51\ tasty) or meat which appears
darker in C61our. Consequently, the beef industry ma.y, to a certain extent, suffer from lower
domestic and export sales due to loss of reputation for not being able to con&.tantly supply
beef with expected quality standards. In maximising their utility or satisfaction, afFected
consumers would subsequently select their bundle of goods with a smaller quantity of beef in
it. This, however, depends on individual taste and preferences. The demand for meat is price
and perhaps quality elastic implymg that the substitution effect is strong. The case where
ove.rall table quality beef consumption is depressed by an unexpected and unsatisfactory
consumption of some poorer quality beef can happen as a result of information assymmetries
and previous unpleasant experiences. The possible occurrences of depressed demand due to
loss of industry reputation and reduced consumers' utility could ultimately cause greater
economic losses. Theoretically, economic losses resulting from an ina.dvertent flow of DC beef from abattoir
to consumption point may be avoided if an objective measurement for DC beef is available
and if quality control is being enforced. The way in which this may be accomplished warrants
further research. As a consequence of apparent rejection of DC beef at the retail and consumption levels,
wholesalers may divert DFD meat to the production of mince beef, small-goods, processed
meat and meat products (e.g. canned beef, corned beef, ground beef, mea.t pie. quick-frozen
beef and some pre-cooked mf!at) or to markets where customers are less discriminating (e.g.
in the preparation of ready-ta-cook dishes). The main reason for using DFD meat in cooking
or curing processes is it's high water-holding capacity and this is important when meats are
finally comminuted for mince or for use in meat emulsions. It is nevertheless unsuitable for
the manufacture of dry sausa.ges or other dry processed meat products.
1.4 Economic Implications of Dark-Cutting Beef in Australia
The seventy of DC in beef vanes from area to area. and from country to country due to
differences in the wa.ys in which beef cattle are produced and marketed. differences in climatic
conditions, infra.structure a!:~ ;>re- and post-slaughtering management. In Victorip the mean
Incidence ot DC beef has been estimated to be 9.6% based on pHu greater than or equal to
5.8 (Warner et aI., 1988). An estimated average of 8% of cattle (excluding mature bulls and
cnnmals younger than 1 year) slaughtered in Australia have ultimate pH valut"s greater than
6.0 (Shorthose, 1988). In Australia. most regard the M. Longissimus dorsi (LO) muscle,
irol1n 18 month old animals, as 'dark' once it's pHu exceeds 5.7-5.8 (Shorthose, 1988).
-
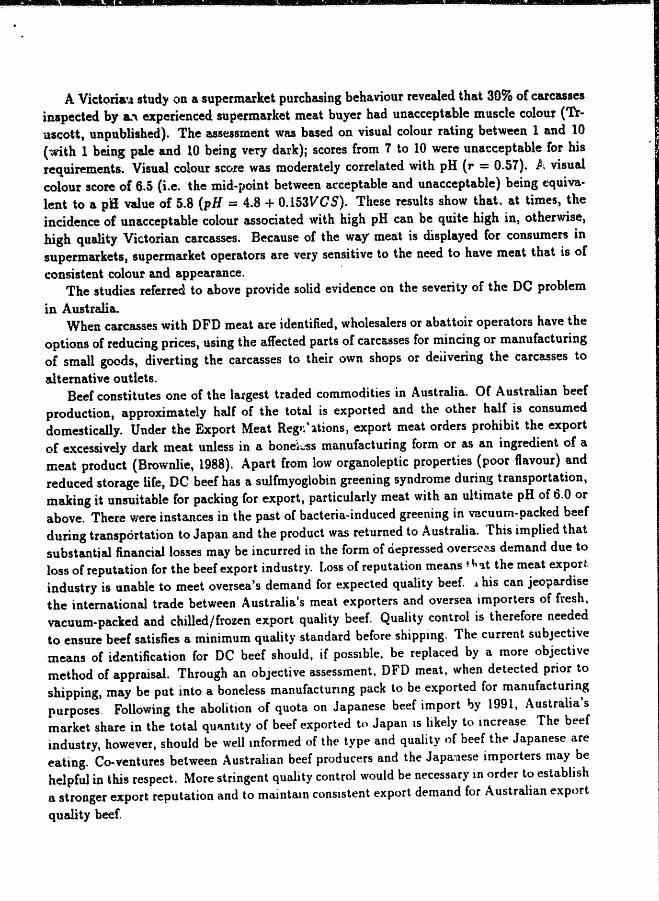
A Victoria'J. stud)' on a supermarket purchasing behaviour revealed that 30% of carcasses inspected by.&.'\ experienced supermarket meat buyer had unacceptable muscle colour (Tr. uscott. unpublished). The assessment was based on visual colour rating betw-een 1 and 10 (with 1 being' pale and 10 being very dark); scores from 7 to 10 were unacceptable for his requirements. Visual colour SCote was moderately correlated with pH (r = 0.57). Jh visual colour score of 6.5 (i.e. the mid-IJoint between acceptable and unacceptable) being equivalent to a pH. value of 5.8 (pH = 4.8 + O.lS3VC S). These results show that. at times, the incidence of unacceptable colour associated with high pH can be quiiehigh in, otherwise, high quality Victorian carcasses. Because of the way meat is displayed for consumers in supermarkets, supermarket operators are very sensitive to the need to have meat that is of consistent colour and appearance. .
T.he studies referred to above provide solid evidence on the severity of the DC problem in Australia.
When carcasses with DFD meat are identified, wholesalers or abattoir operators have the opt.ions of reducing prices, using the affected parts of carc&sses for mincing or manufacturing of small goods, diverting the carcasses to their own shops or deiivering the carcasses to alternative outlets.
Beef constitutes one of the latgest traded commodities in Australia. or Australian beef production, approximately half of the total is exported and the other half is consumed domestically. Under the Export Meat Reg'~'ltions, export meat orders prohibit the export of excessively dark meat unless in a. bonek'Ss manufacturing form or as an ingredient of a meat produd (Brownlie, 1988). Apart from low organoleptic properties (poor flavour) and reduced storage life, DC beef has a sulfmyoglobin greening syndrome durin!~ transportation, making it unsuitable for packing for export, particularly meat with an uit.irnate pH of 6.0 or above. There were instances in the past of bacteria-induced greening in vacuum-packed beef during transportation to Japan and the product was returned to Australia. This implied that substantial financial losses may be incurred in the form of ciepressed overseM demand due to loss of reputation for the beef export industry. I,oss of reputation means t h:t.t the meat export industry is unable to meet oversea's demand for expected quality beef. .1 his can jeopa.rdise the internat.ional trade between Australia's meat exporters and oversea importers of fresh, vacuum-packed and chilled/frozen export quality beef. Quality control is therefore needed to ensure beef satisfies a minimum quality standard before shippmg. The current subjective means of id~ntification for DC beef should, if possible, be replaced by a more objective method of a.ppraisal. Through an objective assessment, DFD meat, when detected prior to shipping, may be put into a boneless manufacturmg pack to be exported for manufacturing purposes. Following the abolition of quota on Japanese beef import l:>y 1991, Australia.'s market share in the total quantity of beef exported to Japan 1S likely to increase. The beef industry, however, should be well mformed of the type and quality of beef the Japanese are eating. Co-ventures between Australian beef producers and the Japa:llese importers may be helpful in this respect. More stringent quality control would be necessary in order to establish a stronger export reputa.tion and to maintam consistent export demand for A ustralian export quality beef.

2 QUality Improvement and Demand Shift
2.1 Introduction
A better quality beef carcass is equivalent to altering one or more of the amount of a char .. acteristic in each unit of the product. In some cases, quality improvement is perceived as "dding one or more of unique and desirable characteristics (i.e. characteristics which previously did not. exist) to the prodnct. Such innovations would give rise to a 'new' ptOt:lucti a product which has a different fOfm and is more desirable than the one prior to innovations.
Quality improvement can be depicted as a rightward or upward shilt of consumer demand function. Figure 7 showed a parallel right.ward shirt of linear demand function. A rightward shift of demand Cor a product implies that consumers a.re willing to purchase an increased quantity of that product at each price level (del\ot'!d by v in Figure 7») or alternatively, consumers are willing to pay higher prices for that produci at each quantity level (denoted by w in Figure 1). The increase in quantity demanded or increase in willingness to pay is reflected by a rise in consumer's utility obtained from each unit of the product. From Figure 7 t the price premium resulting from quality Improvement, as denoted by W t is equivalent t.o Pt,( .. ;'(,~ - Xij), where Psi is the implicit price of cha.racteristic j; Xi; is the new amount of characteristic j obtained from one unit; and Xl, is the old amount of characteristic j obtained from one unit before the technical change.
When demand shift is measured as the consumption increase, that is, the projected output change v (Figure 1), rather than the premium w, then,
v = nQwlP,
where n is th,e own price elasticitJ of demand, and P and Q are t>quilibnum pI'ice and quantity. Let Ie = wi P, then,
v:::; knQ.
2.2 Differences Betwp~:a Demand-shifting and Supply-shifting Research
There are two distinct types of supply-shifting research, the output expanding retearch (e.g. improved animal breeds and hIgh-yielding crop variety) and the cost-reduction research (e.g. technological changes resultmg tn lower cost of production). In the former, the output per unit input is increased and in the latter, the samt~ previous output IS possible with reduced input. Nevertheless. the destred level of productIOn can be adjusted according to market demand by the desired level of input.s. Thus. an output expanding research advance can be interpreted as a. cost-reductIon. for tnstance. a wee higher production rate from a new breed of ca.ttle or a higher yielding va.rlety can be mterpreted as a 10% reductIOn in per umt output cost of production.
In contrast to supply shifting research. demand.shlftmg ft'sea.rch IS caused by quality improvement and technical changes In marketing processes Quality Improvement tncreast"s willingness of consumers to consume more of a product and or to pay a hu~her price for it. An upward shift of demand for a produd tmplit·s that consum~r5 are wilhng to allocl.tt> greater budget (I) for consumption of that product rela.tlve tn other products (I =: PQ) due
Tn ..

Price I D'
D
'" "
D D Quantity
Figure 7. PARALLEL RIGHT\VARD SHIFT ()F LI1'Jr:AR £)EMA~D CPRVE

to increued level of .atisfaction. Therefore, willingness to consume 10% more of a product can bf" intetpreted as willingness to pay a 10% hi6her per unit price of a. product in order to achieve the sl,fqe level of satisfaction.
Changes in marketing processes, on the other hand, reduce the marketing costs (the marketing margin) of a product a.nd ca.use an upward shift in the farm demand function.
The magnitude of & demand shift is represented either by w (the vertical distance between the two demand functions) Of 1) (the horizontal distance between the two demand functions). Unlike yield raising, quantity data. associated with v are often not availa.ble. In the case of supply, scientists are able to measure quantity increase per unit inputresuUing from improved breed or high yielding variety, but in the case of demand, extra quantity which consumers are willing to consume resulting from quality improvement is often not measura.ble. The price da.ta w. however, may be determined from cross .. sectional da.ta showing variation in prices with product quality. Regression of prices against quality characteristics with respect to a standard yields respective premiums and discounts for different gra.des of the product. In Unnevehr's paper, supply of rice was assumed to be perfectly elastic a.nd rice grain quality improvement led to an absolute increase in consumption. Benefits from quality improvement were empirically quantified by the estimation of implicit price w. For beef carcasses, saleyard a.uction data. (Porter and Todd, 1985) showed that !lrices of carcasses varied with differences in various quality characteristics. Poorer quality carcasses werp, heavily discounted whereas better quality carC8.9ses received certain premiums.
2.3 The Implications of Elastic and Inelastic Demand Shift
Given the same vertical shift in demand represented by wand a. fixed supply S, the relative change in price (elP) a.nd quantity of a product (dQ) depends on the price elasticity of demand (Figure 8). For beef, retail demand is relatively elastic with respect to it's own price and substitution effect between other meats and beef is great as price relativity changes. However, farm demand for beef carcasses is relatively price inelastic. An upward shift in farn.. ·f" mand resulting from beef carcasses quality improvement would theoretically result in relatively large increase in consumption but small increase in price. Calculation on relative changes .~ price (dP) and quantity (dQ) is shown in the appendix. These price and quantity changes are represented bYi
n dP = w(_· -),
e+n
dQ -= wQo/ Po( __ en - ). e+n
where UI is the Implicit price, n as own pnce elastlclty of rlemand. e is own price elasticity ()f supply, Po and Qo are the pnce and quantity at initial equilibrIum point respectively. Compared with inelastic demand, elastIC demand gIVes rIse to higher equilibrium price and quantity level (el versus el in Figure 8) except when supply 15 perfectly inelastic. When dem.a.nd is relatively elastic, higher equilibrium prIce and quantity levels are obtained, and producers derive a greater surplus.
In the short-run, supply of a commodity is usually inelastic but becomes increasingly elastic in the long· run as producers are able to alter both their fixed and variable costs in the long run. When ~upply is perfectly tnelashc, a dghtward shift of demand results tn an a.bsolute pric.e rJse (Figure 9) and the change In econOmlt surplus accrues entuely to the
7
j
I

dce
\
\
~t\ _ .. ' . Po· - D' r
..-------:Quantity
Figure 8 PARALLEL RIGHTWARD SHIFT IN DEMAND WITH TWO DiffERENT ELASTICITIES Bl'T WITH AN IDENTIC' AL CHANGE IN PREMn'M (UI)
!
\
r

price
~~----------~~~----~
~~--------------~~~+-~~---------------~
Quantity
Figure 9. PARALLEL RIGHTWARD SHIFT IN DEMAND RESULTING FROlVI QUALITY IMPROVEMENT
producers; consumers will have no extra surplus. As supply gets more and more elastic, moving Crom 81 to 53) quality improvement will result in an increasing quantity consumed at equilibrium and an increasing economic surplus derived. If supply is perfectly elat$tic, quality improvement WIll increase consumption but leave price unchanged. The increase in change in economic surplus is then at it's maximum, and it accrues entirely to the consumers; producers will have no surplus but get normal profit on an increased sales volume.
2.4 Parallel and Convergent shift in Demand
Unnevehr (1986), in a study of consumer de! "and for rice grain quality, assumed thnt rice grain quality improvement caused a pa.rallelrig.(Aioward shift of a linear demand curve.F'attors contributing to a. rightward/upwa.rd sbift of demand curve for a product include the product quality improvement, population growth, income growth, increase in prices of substitutes, and advertising and promotion of tile product. Research in marketing processes leading to a reduction in marketing costs (e.g. costs of trt~sport, handling, packaging, processing, storage, distribution services etc.) would cause an upward shift of the derived demand curve (which is the consumer demand curve less the marketing margin). Freebairn, Davis and Edwards (1982) assumed a parallel shift of linear demand curve caused by technological changes in the marketing stage showing tha.t. per anit reduction in marketing costs is constant at all quantity or production levels. However, for quality improvement of a product, depending on the type of produqt, the chara~teristics to be altered and the extent of inlprovement, the assumption of & parallel shift of the demand curve may not always be realistic. Quality improvement means eahancement of certain desirable product characteristic{s) or impartation of new charactetistlc{S). Unlike l'Psearch inducing cost reductions, quality improvement involving enhancemen~ of product characteristic( 5) often leads to a change of product form or appearance, and those involving addition of new characteristic(s) could cause formation of a new end differentiated product. Quality of a washing powder has improved if1 for instance, a sppcial substance were a.dded which gives the product a unique power to clean all unwanted .:;tw.ns on clothes. Such a unique attribute may not be present in it'5 close substitutes and co lseq'lently, ttl~ product &ctually deviates from it's own group of substitutes which a consunler can Cnmp!lle, becoming unique and becolning more a product by itself. The elasticity of d~mand facint., Ii brand is a function of the number and the closeness of substitutes which a consumer can c\.)mpare. The grea.ter the number of close substitutes facing a product, the more competitive is the market fot the product. and an increase in competitiveness makes the demand for a. product more price elastic. Quality improvement of a brand in some cases reduce!4 closeness of the brand and it's substitutes, thus causing the brand less competitive relatIve to other brands. As a result, cunsumer demand could become less price elastic. More inelastic demand indicates that the slopp of the demand curve has increased, that is, a steeper slope is formed (as price elasticity of demand is directly related to the slope of the demand curve). The extent to which a product deviates from it's own group of substitutes depends on the type, the nature, the desirabillty and the magnitudp of characteristic(s) to be improved.
From abovt:: ( ·scussion, it is proposed that quality improvement could lead to convergent shift of a linear demand curve. [n a later section. it is grapically shown that a greater pconomic surplus call be derived from convergent shift than from a parallel or divergent shift. Convergent sh.itt also means that the demand curves bf'fofe and aftt'r quality ImprovE-ment

will not intersect. This is because in a competitive market where market inlormation is readily available, consumers always demand more of an ;mproved quality product. Intersection of demand curves before and after quality improvement implies inconsistent consumer behaviour, that is, poorer quality product is preferred to better quality products.
Quality improvement in terms of reduction of DC in beef may cause beef mea.t to be more desirable relative to other meats and meat products due to an improvement in taste, pbysical attractiveness and stor-ability. Changes in such attributes may not necessarily te~ ducecompetitiveness, thus elasticity changes would be small. Change in elasticity fot beef carcasses resulting from quality improvement would eve.n be smaller than those for primal cuts displayed in supermarkets.
Rightward shift of the demand curve can also be induced by ad'Vt.rtising and promotion. Advertising and promotion will not alter the product characteristics; it makes a product well-known to the consumers by changing conSUIr.er perception of the product. Advertising and promotion are sometimes used as a means to inform consumers ora new brand or new substitute in the market place. When a new brand, sayan experience good, is launched and recommended in the market, it has first to be experienced by a consumer in order to test its quality (Nelson, 1970). The product has not been included in the range of products which a consumer can compare. During the experimental or the promotional period, demand is expected to be very inelastic. If the consumer samples at random, that elasticity of demand must be ze"o (perfectly inelastic). The overall elastidty of demand is a weighted average of the experimental and post-experimental elasticities (Nelson, 1970). Over a period of time after the brand has become popular and that consumers begin to select the new product amongst all other close substitutes, elasticity of demand facing the product increases. Thus, advertising and promotion of a new product brand and qualih' Improvement of a wellknown product which reduces market competitivene.)s tend to ha.e ~pposite effects on price elasticity of demand.
Rightward shift of the demand curve can also be induced by income growth and population growth. Unlike quality improvement and promotion and advertising, growth of income and populatioll will not affect a product's competitiveness vis-a-vis its substitutes. Thus, conceptually, the fact that income and population growth would lead to a parallel shift of consumer demand function seems reasonable.
2.5 The Concepts of Consumer and Producer Surplus
The concepts of consumer and producer surplus and the sum total Jf these surpluses {social or economic surplus} are frequently adopted in applied welfare analysis to quantify changes in welfare of consumers. producers and the SOCIety as a whole resulting from alterations in corresponding shifts of demand and lor supply fuuctions of commoditIes (see Gunawardana, 1988 for a review). The demand curve shown in Figure 10 can be interpreted as a 'marginal willingness.to-pay curve', Consumers are willing to pay a price P for a quantity of commodity Q purchased. Thus, the total area below the demand curve and above the price line Ph (area Pab in Figure 10) represents the consumer surplus. It IS an economic measure of satisfaction which Marshall (1890) defined as 'the excess of prIce which a consumer \~vuld be willing kl
pay rather than go without the tlung over that whIch he actually does pay', It is the extra utility or satisfaction derived from purchase of a commodity.
As in the case of a consumer (buyer), Marshall suggested that a producer (seller) may

,,-"""-----~-"--------------------------
also receive a. 'surplus' from a transaction, and that this surplus can be measured in a geometrically symmetric manner with the consumer surplus. Producer surplus is interpreted as the extra. profit derived from sale of a commodity. It is shown by the area Pbo in Figure 10 which i~ above the supply curve and below the price line. The producer surplus may be said to be p .. "'!Sent whenever a seller makes a sale (or a sum greater than the least sum for which he: would have been willing to make the sale (Boulding, 1945). The measure or a change in producer surplus may be estimated by a. change bl economic rent or 'quasi .. rent f (!'Jiishan, 1968). Similatly, a change in producer surplus involved a change in profit or rent accruing to owners of firms in an industry (Varian, 1978).
Adoption of consumer, producer and social surplus enables one to evaluate ultimate gains or losses to each group resulting from a technical change induced by research and development. The extf.llt to which each surplus varies depends on the magnitude of demand shift, the nature of market demand and supply curves (linear or non-linear), the nature of shift (parallel or non-parallel) and the price elasticity of demand and supply.
Price J
Figure 10. TH.E MARSHALLIAN PRODrC~ .. R AND (,ONSr~IER SlTRPLt'S

3 Return to Research for Beef Carcass Quality Improvement in Australia
3.1 Literature Review
The-n: is alack or scientific and economic research on meat and carcass quality h lprovement in Australia as well as othel' parts of the world. Demand shifts resulting from meat/carcass quality improvement have received no previous "esearch attention. Past research was mostly devoted to shifting supply curves by reducing costs and raising yields. There have been no previous estimates of returns to quality improveme.nt research in beef meat and carcasses.
Norton et aI. (1981) examined the benefits of agricultural research and extension in an ex .. ante consumer-producer surplus framework for several commodities in Peru. The effects of demand shift caused by lncorne and population growth were studied. Edwards and Freebairn (1982) alfiO allowed for shift in demand due to increase in income and population. Income or popUlation growth results in parallel shift of consumer demand curve. Their studies showed that substantial returns to public investment can be derived from researd.· and extension.
Unnevehr (1986) aUempted a. study on consumer demand for rice g,l'ain quality and estimated returns to research Cor rice grain quality improvement in Southeast Asia. The returns to ~search for rice grain quality improve.ment were shown to be &ubstantial and there was an indication of underinvestment in this type of research. Unnevehr made a number of simplifying assumptions which enabled him to estimate the gains from research into rice grain quality improvement. First, he assu"led a parallel shift of a linear deme.nd function. It has been argued in section 2.4 that changes in product characteristics could impart uniqueness to a product and reduce product competitiveness. Consequently, the demand shift could be convergent in nature, indicating a more inelastic demand. In this paper, we attempt to estimate research benefits occurring as a result of both ~arallel and non-parallel shifts of linear demand curves.
Second, Unnevehr (1986) assumed an infinitely elastic supply of rice at the retail level. This caused an increase in quantity demanded without any change in price. It is often observed that the supply for most commodities, including rice, is less than perfectly elastic. Improved quality rice (or any commodity) tends to be marketed at a premium price, particularly in the short run. Thus, the assumption of p~rft"ctly elastic supply may not be realistic. In this paper, a ~ess-tha.n perfectly elastic supply has been incorporated into our model for assessing research gains from beef carcass quality ImprQvement.
3.2 Effects of Quality Improvement on the Supply Fuut}: .. tion
Meat colour improvement in beef carcasses can be achIeved by res.:arch into reducing DC in beef. This may bt:' Accomplished by Improved preslaughter management of ct.:.tle 0.: well as postslaughter management of meat I carcasses. Production and marketing costs may no~· be affected by improved animal handling tE'chniques but can be affected by improvement of the livestock marketing system (e.g. computer marketing). TheoretIcally, direct marketing reducef pres laughter stress in cattle resulting in lower mcidencE' of DC. In additiou, previ· ous empirical studies showed that direct markebng reduced productlOn costs duE' to higher operational and pricing efficiencies. In this case. an upw'ard shift of farm demand and a

downward shift otfann supply functions occur simultaneously. A downward shift of supply function reluItingf.romadoption of computer marketing can be divergent in na.ture due to constant reduction in coats when marketing volume increases. A divergent shift in supply implies tha.t high cost producers would benefit more than low cost producers. In this paper) we assume that quality improvement. has no effect I~ .. l the farm supply function.
3.3 Scope of the Study
Our results represe.nt only a. partial analysis of the demand shilt resulting &om meat quality improvement in beef carcuses du.e to a reduction in DC. As a result of DC, meat colour in beef carcalses varies from normal bright-red meat to extremely dark coloured meat. Our empirical analysis of the economic benefits from quality improvement relates to those DC carcasses which are at present disposed by abattoir operators or wholesalers at discounted prices. It does not cover those very dark ano rlull coloured carcasses which are rejected by buyers even with price rerludions.. At the bobaUoir, very dark and dun coloured meat in carc8ss~swou1d be diverted to alternative uses (e.g. production of mince and processed meat). The diversion effect at the wholesale level causes variation in supply of grade 1 meat relative to grade 2 meat. The important aspect of meat diversion due to an emergence of a proportion of unacceptG.bly dark and dull coloured meat in DC carcasses warrant fur'her research.
It is anticipated that a certain proportion of DC meat would be passed on to the consumers due t.o the absence of sorting and objective measurement of meat colour. This would result in depressed demand for the Australian table quality beef both in the domestic and export markets due to a 105s of reputa.tion (i.e. the beef industry is unable to meet the expected quality requirements of consumers). Reduction in DC would cause a smaller proportion of the poorer quality mea.t to be passed on to consumers giving rise to ("conomic gains to conslimers. Our present analysis does not a.ccount for benlfits and costs that a reduction in DC would cause through reducing the inadvertent flow of undetected DC mea.t from abattoir to consumers.
There are also additional hem-fit s from qualit f improvement due to increase in income and population which have not been considered in this paper.
3.4 Analytical framework for assessing returns to research for quality improvement in beef carcasses
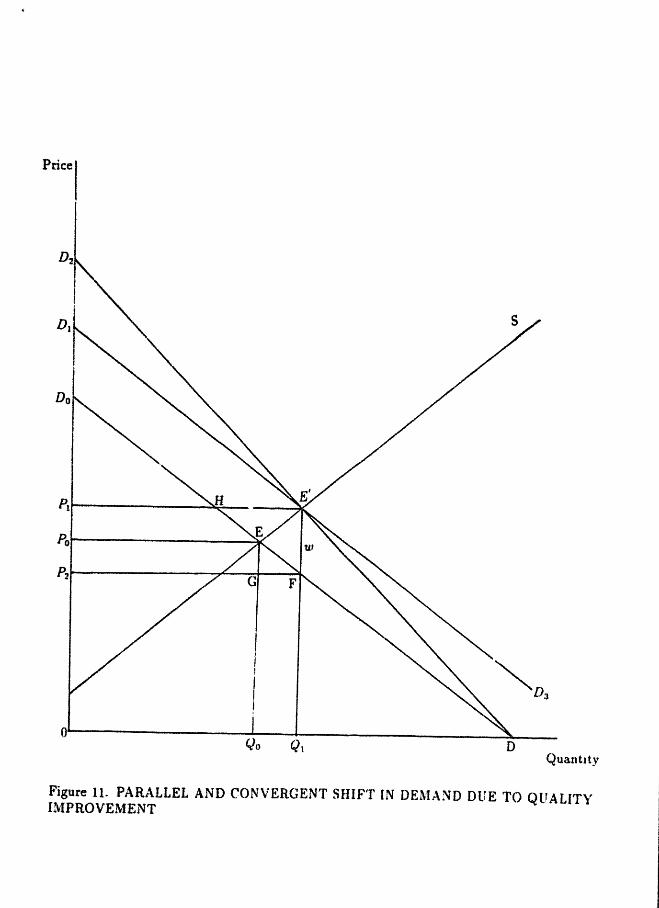
An ex-post evaluation of meat colour begins at th~ aba.ttoir Ie-vel becaust" data relating to retail bee! prices and meat colour variatlOns are not avrulable. The' DC phenomena, are identified mainly from meat discolouration tn beef carcasses. Ruyers presume tha.t DC carcasses have dark and dull appeara.nces. In Figure ll.w represents the premium which buyers are willing to pay for normal bright-red, that IS, non-DFD carcasses. VarIous cost factors ansing from DC (e.g. meat discolouratwn, pourer kt"epmg quahty and down-grat!!ng of carcasses) would be included In our empirical appratsal of DC m beef carC&l;ses. At auction centres, buyers would have taken mto conSIderation cnnSf'quencf'S and possible "OSt5
of purchasing dark carcasses Such costs are rf"flt.-ctf'd 10 th(' discounted price for rarcasst's. The benefits of research into meat c(')iour improvement In bt'l:'f C'arcasst's arl:' ql.lantlfied
using an economic surplus criterion Illustrntlvt' calculatIOns art" provldt~d of gains a.-:cruing
12
Quantlty
Figure 11. PARALLEL AND CONVERGENT SHIFT IN DEMASD DUE TO QUALITY IMPROVEMENT

to producers, consumers and the industry as a whole Cram reducing dark-cutting. Consumerproducer $urplus has disadvantages as measures of welfare changes due to the errOr caused partly by ignoring the income effect of price changes. However. income effect is likely to be amen because consumers .pend only a small percentage of their budget on & particular food product with the result that an increase in its price has only a small im.part on their real income.
The model f..lr &ssessing research gains trom quality improvement in bee! carcasses has been developed (see Figure 11). This is a market clearing model involving partial equilibrium analysis of meat colour in beef carcasses. The demand and supply curves relate just to the demand for and supply of Australian table quality beef. The manufacturing quality beef produced mainly for export is not included in our analysis. The implicit plice values for meat colour as represented by tv in Figure 11 were obtained from regression estimates of cross· sectional data collected in tW() carcass auction centres in Perth metropolitn.n areu (see Porter and Todd, 1985). The farm demand function before quality improvement iii given by the line DoD. Quality improvement ca.uses an upward shift of the farm demand curve. A parallel shift is shown by the Hne Dl D3 and a convergent shift by D3 LJ. The industry supply curve is S5. The initial equilibrium price (Po) and quantity \QoJ are point E. The eqciUbrium price after quality improvement (Pd and quantity (Qd nrc point E'. The implicit price (Le. the price premium resulting from meat colour in'tprovemt:"nt in beef carcasses) is shown by the line EJ F. The final equilibrium price for a parallel shift It. the same as that for non .. pata.llel shift. Both types of shift have identical w sillce the price premiums paid rOt improved colour in carcasses and final equilibrium price at tarcass auction are the same regardless of the nature of tr" shift. Thus. for parallel and convergent shIft, the shift is defined to be equal at the new equilibrium, not at the initial equilibriunl.
In this section, diagram and algebra are used to evaluate research gains from me1: t colour improvement ip beef carcasses. Several formulae have been developed to measure the areas in Figure 11 that represent consumer t produc~r, and total net economic surpluses Differences ar~ caused by alternative specifications of the supply and demand curves (e.g. linear versus constant elasticity), the na.ture of demand shin (convergent versus f. arallel), and whetner the demand shirt is measured horizontally as a consumption increase or vertically as a price premium (i.e. the extra price which buyers are willing to pay for an improved quality product). Formulae for parallel and convergent shift of farm demand are presented below. The derivation of formulae is presented In th~ appendix.
Fot parallel shift (case 1). the change in producer benefits from the demand shtft is represented by th~ area Pl E' E Po and the cha.nge In consumer surplus is represented by the area Dl E' BDo less area PI HE Po. Th(" net economIc bent'fits to producers and consumers equal the sum of the changes In producer and C(lRsumf.·r surplus:
PIE1EPo '" D\E'HDo " P1HEPo · DIE'EVo-
For convergent shift (case 2), the change m producer benefits 15 rl~'en by the area PI E' EPo and the change in consumer surplus IS area D'JE' H Do less area It HE Po The net economic surplus is represented by
PlE' E Po ... D,E' H Do PIli E Po - .'J,c' E Do.
Let CT S be change 1n total net t'cnnOIDlC surplus, CPS b~ "hange In prt)ducer surplus, CC S be change In consumer surplus, Ie be the proportlonatt' v~rtlcal sluft (w' Po) 10 tht"
13

"emand curve, due to quality improvement, Po and Qo be equilibrium price and quantity without & demand shift, PI and Ql be the equilibrium price and quantity with a demand shift, e be the supply elasticity &~ initial equilibrium point POQOl n be the demand elasticity at initial equilibrium point PoQoJ nF be the demand elasticity at point F (P,Ql), and Z = kn/( e + n). The changes in economic surplus in the case of a parallel shift are calculated as
CTS:: 1/2kPoQo(2 + eZ), (1)
(2)
cos = eTS - CPS. (3)
In the case of non .. parallel convergent shift, changes in economic surplus are calculated as
1 + 2n- eZ CTS:: 1l2kPoQo( Z )(1 + eZ)- (eZ»),
n-e (4)
(5)
CCS = CTS - CPS. (6)
Once the changes in consumer I producer I and total net economic surplus are calculated, the present values of the benefits and the marginal internal rates of return to agricultural research (IRR) (or beef quality improvement can be calculated.
3.5 Data Collection
Values of key price and quantity variables reqUIred to apply the formulae are listed in Table 1. They r~fer to average 1988 conditions. Both the price and quantity variables refer to the wholesale level. Po is the a'lerage whole carcass pricl~ for the top quality yearling beef at S2A7/kg a.nd a. lower grade bpef (i.e. very lean beef with less desirable muscle conrormation) at $2.34/kg. Qo is equivalent to the total beef and v~a1 table quality carcass production (i.e. the total production less export quality manufat·turtng beef).
The implicit price data. were obtained from rec~.lt e' timates by Porter a.nd Tndd (1985) based on 1981 conditions. These prtces were con\~rtt-.J into percent gains, losses of total careas.'> value ('pink' meat has an economic gain ~qul\('h'nt to 3.11 ~ of total carcass valUp. whereas lmature red' and 'dark red' meat I .,t' 706<"'(1 and lU29% of tota! carcass value respectively) and were converted back t,) relevant prt"I!llUm and discounts using current beef carCass price data based on 1988 conditions l\tea t vlour Improvement tn carcasses IS seen in two different angles: a change from mature red aua dark red colour to brIght red colour of normal meat (bright red colour as rontrol). and from bnght.rt"d colour to pink ("olour. Pink colour has been reported to be the most dt'sirahle and a premium of WI is added to each kg of sueh ca.rcass produced (Porter and Todd, 19R5). Howevt"r. both fItature rt"d and dark red meat ate discounted by Wl and W3 respt'ctlvt"ly wlth ft"ference to the lUJrmal brtght-red
14

.=;.;;;;;,;=_~'= Ta!~~~J! ~Y!1':l~~"~of,y~a.bl~~"for Estimation of Research. &ai!ls in At1;s.~!a:l!~ VariobleVcitie'-"'- ~D;s~piion' ,. .., '- .. . , " ~-'"
'-=--;~ -_.- iO.075/kg Impllcit price estimate (price premium) for 'pink' meat-
W2 SO.l70/kg Implicit price estimate (discounted price) {or 'mature red' meatO W3 SO.248jkg Implicit price estimate (discounted price) for 4dark' meatO Po S2.41/kg A verage wholesale price of table quality beef carcasses& Qo 835.14 kt Domestic table quality beef production (carcass weightt= 111 0.05 Lowest value of demand elasticity for beef carcassesd
112 0.50 Highest value of demand elasticity for beef carcasses!!! el 0.67 Short-run supply elasticity of beef carcasses! e2 1.34 Long-run supply elasticity of beef carcasses9
Q Implicit prices {or meat colour from regression estimates by Porter and Todd (1985). 6t From The Victorian Meatwork ASSOcIatIOn. C From Australian Bureau of Statistics. quarterly publications. d From Papadopalous (1973). II! From ~tarceau (1967). J From Wicks and Dillon (1978). IJ From Hall a.nd Menz (1985).
colour (see Table 1). The dark red m~at is persumed to be mea· from DC carcasses but the mature re~ meat is presumed to be meat from older animals. Beef carcasses are adjudged to be DC in :elation to the meat colour alone since a more objective measu.rement of pHu in meat (which is a better description of DC m beef) was not made at the time of data collectIon. It .must be clarified here that, apart from the dark red colour of DC meat (which has been the main focuss of this paper), the other two classes of meat (pink and mature red) are included in our empirical analysis mainly for the purpose of interest and comparisons.
The elasticity of demdond and supply data were available from various authors. The lowest and highest values of demand elasticity were chosen becaust" demand elasticity varies from one state to another in Australia. Both the short run and long run supply elastIcity values were selected for comparison.
3.6 Results and Discussion
Some estimates of the sIze and distrtbutlOn of the economIc benefits from mt~at quality improvement a.re reported in Table 2 The values in Table 2 are expressed in terms of 100% carcasses. In reality~ we merely expect improvement up to a maximum of 9.6~ of the total c.arcasses (which is the incidence of DC 10 Australia). Estimates of present values fOf quality improvement are listed in Table 3.
Results from parallel shIft of demand sh\.)wed that, on a. nattonal basts. If half the inctdence of DC (4.8%) 10 beef were avolded as a result of research. a gross annual savmg of $10 million could be derived, r)f whIch 20CC accrUt' to produc("fs sellers and SOO:O to consumers/buyers. Reduction 10 the lncldence of DC IS feflt'cted by the Improvement of meat colour 10 beef carcasses from dark to normal brtght rt-d colour
Our empirical results show that tht're IS an lllcellttve for research IOto prociuctll)fi of pmk coloured mea.t 10 beef carcasses, Assummg ("urrent mClCi(~nce of pink ('areasst':. til be 12%
15

(based on data. in Porter and Todd. 1985), it is estimated that a. gross annual benefit of $55
million has been ,forgone due to the industry's failure to produce pink mea.t in 100% carcasses
in Australia.. Results in this paper also reveal that substantial benefit ma.y be derived from
reducing incidence of mature red meat in carcasses, for instance, by marketing the livestock
at an earlier age.
The distribution of benefits between carcass buyers and sellers is given in Table 2. Distri
butional '1Ulaiions are caused by differences in dema.nd and supply elasticity a.nd the D,a.ture
demand shift. Where price elasticity of demand is high, producers' share of benefit is tel
atively greater. On the contrary, wht>n price elasticity of supply is high (in a. longer run),
producers' share of benefit is .:lepressed relative to consumers' share.
In contrast to a pa.rallel shift, exceptionally large aggregate values were I')btained from
a. convergent shift. particularly with very inelastic demand. Theoretically. a smaller addi
tional benefit would be derived from a convergent shift when the base demand is relativdy
elastic. Unlike many consumer products, induding those retail primal beef cuts displayed
at supermarkets, beef carcasses face a very small number of close 5ubstitutefi and conse
quently dema.nd is very price inelastic. For some consumer products facing a large number
of close substitutes and whose demand are relatively price elastic, alteration of certain prod.
uct charactenstics could make them uniquely differentiated from their substitutes resulting
in a decline in demand elasticity. For beef carcQSses, however I this may not ~e 50 since ca.r
casses are not competit.ive by nature and quality improvement, for instance, an lmprovement
of meat colour characteristic in a small proportlon of total beef carcass production, w(:<uld
not make the product uniquely different from other animal carcasses (e.g shet'p catcaSSeS
and pig carcasses). Thus, assumption of parallel shift seemed to be more rralistlc in f 'lSPss·
ment of farm demand for carCa5.ses. Consequently, we accept only the analytica.l result~ from
parallel shift presented in this paper,
The present values given in Table 3 are calculated in terms of 100% carcasses. The
actual values ~e thus the stated values multiplied by the improved incidences. Note h~t
the assumption of parallel and convergent shIft gtve enorlTlously different results.
16

Table 2: ~Itimat~d A~u~_Re~urn~_<~!?=~ ~e:~ ~e..~t. ?~~O~!J~~ro!~m~nt (S million) Recipients of benefits°
Demand Shift ._9u_~ity I~~~ovem~~~~ Elasticity Farmer Consumer Aggre~t!_ --'--'---'-"~ -.
.. .'IOU ~J/II~"._
711 el 4.353 58.328 62.68\ WI 711 e, 2.2~5 60.451 62.682
712e l 26.887 36.028 62.915
'I12e, 17.117 45.873 62.990
'hel 9.881 132.410 142.291 Parallel W, 'lIe:! S.ll9 137.180 142.299
112e t 61.322 82.171 143.493
",?!e, 39.099 104.784 143.883
111 el 14A17 193.194 "2oi.tfff W3 'he, 7.467 200.161 207.628
11,e.l 89.815 120.351 210.166
'l,e'2 57336 153.659 210.995
'llel ·4.353 705.262 709.615
WI 'lIe, 2.255 708.093 710.348
fhel 26.887 100.941 127.828
'l2e, 17.117 110.787 127.904
111 e t 9.881 1662.848 1672:129 Convergent w, rile, 5.119 1671.854 1676.973
1I2et 61322 236.256 297.578
'l2e, 39.099 262.335 301.434
'll el 14A17 2505.664 2520.081
W3 'ltel 7467 2522.257 2529.724
1I2et 89.815 353.595 443.410
'1,e, 57336 394.645 451.981 ·'··~tlmatlon based on formulas 5.4 t.o 5.9 in text
Table 3: Returns to Research for Qualit) ·-.prove~nentQ (I million) -Ueonand ShIft Quality Improve~ent PreSt~t Valu~
Wt 506 Parallel w, 1152
W3 16~
WI 3374 Convergent w-: 7952
W3 11972 # The estimates on returns to research were based on average own-pnce elastlclty of dematl<l
and supply where Y'/ = 0.275 and e = 101 b Present values summed over 30 year~ and dIscount rate of l2<1C used to obtam pr~sent values. It is assumed that domesttc productaon (and consumption) would he constant over
the 30 yearn penod.
17

REFERENCES BOULDING, K E. (1945). 'The concept of econolnic surplus'. American economic review.
35: 851-69.
BROWNLIE, L.E. (1988). 'Dark-cutting beef in the export meat trade'. Australian meat and livestock corporation, Sydney. Unpublished.
FREEBAIRN, J.W., DAVIS, J.S. and EDWARDS, G.W. (1982), 'Distribution of research gains in multi-stage production system'. American journal of agricultural economics. 64: 39·46.
GUNAWARDANA, P.J. (1988). 'Rice pr:cing and marketing policies in Sri Lanka, 1952-1984: A welfare evaluation'. Unpublished ph.D thesis, LaTrobe UniversH.y, Victoria.
HALL, N.H. and MENZ, K.M. (1985). 'Product supply elasticities for the Australian broadacre industries, estimated with a programmimg model'. Review of marketing and agricultural economics. 53; 6·13. 'C.
HAYENGA, M.L., GRISDAl,E, B.S., KA~.~FFMAM, R.G., CROSS, B.R. and CHRISTIAN, L.L. (1985). 'A carcass merit prici'lg system for the pork industry'. Americanjournal of agricultural economics. 61: 315·19.
HOOD, D.E. and RIORDAN, E.B. (1973). 'Discolouration in prepackaged beef: measurement by reflectance spectrophotometry and shoppers discrimination'. Journal of food technology. 8: 333·43.
MARCEAU,.I.W. (1961). 'Quarterly estimates of the demand and price structure for meat in New SO'Jth Wales'. Australian journal of agricultural economics. 11: 49-62.
MARSHALL, A. (1890). 'Priciples of economics'. 1930 and 1959 editions. London. Macmillan Press.
MISHAN, E.J. (1968). 'What is producer's surplus' American economic review. 58: 1277-19.
NELSON, P. (1970). 'Information and consumer behaviour'. Journal of political economy. 78: 311·29.
NORTON, G.W., VICTOR, G.G. and POMAREDA, C (1987). 'Potential benefits of agricultural research and extension in Peru'. American journal of agricultural economics. 69: 241-57.
PAPADOPOLOUS, C. (1913). 'Factors determluing Australian saleyard price for beef cattle'. Quarterly review of agicultural economics. 26: 159-70.
PORTER, D. and TODD, M. (1985). 'The effect of carcass quality on beef carcass auction prices'. Australian journal of agricultural economics. 29: 225-34.
SHORTHOSE, W.R. (1988). 'Dark-cutting in beef and sheep carcasses under the different environments of Australia'. Unpublibhec !'laper.

UNNEVEHR, L.J. {1986}. 'Consumer demand for rice grain quality and returns to re· search for quality improvement in Southeast Asia'. American journal of agricultural economics. 67: 634-41.
VARIAN, H.R. (1978). 'Microeconomic analysis'. New York, No.rton.
WARNER, R.D. (1988). 'Objective description of meat and fat colour in beef carcasses' For AMLC workshop on automated measurement of beef'. Sydney, Sept. 5-6.
WARNER, R.D., TRUSCOTT, T.G., ELDRIDGE, G.A. and FRANZ, P.R. (1988). 'A survey of the incidence of high pI! beef mea.t in Victoria abattoirs'. Proceedings of the 34th international congress of meat science and technology, Brisbane.
WICKS, J.!'1. ~nd DILLON, J.t. (1978). 'APMAA estimates of supply elasticities for Austrdian wool, beef and wheat'. Review of marketing and agricultural economics. 46: 48·57.
WILSON, T.P. and WISSEMANN, A.F. (1981). 'A note on the attitudes of retailers to beef carcass classification'. Revip.w of marketing and agricultural economics. 49: 47·60.
19
APPENDIX
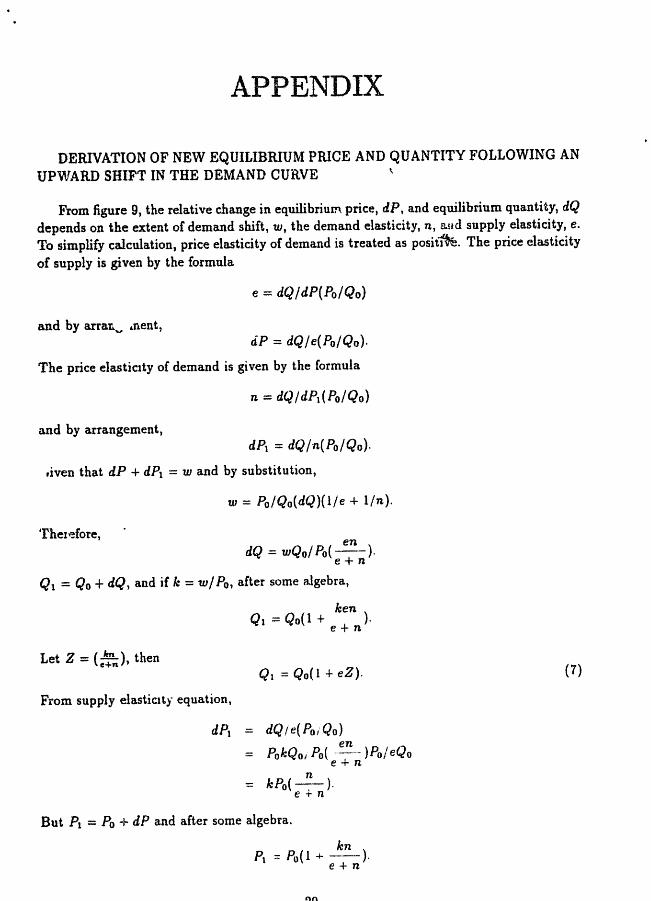
DERIVATION OF NEW EQUILIBRIUM PRICE AND QUANTITY FOLLOWING AN UPWARD SHIFT IN THE DEMAND CURVE \
From figure 9, the relative change in equilibrium price, dP, and equilibrium quantity, dQ depends on the extent of demand shift, w, the demand elasticity, n, aud supply elasticity, e. To simplify calculation, price elasticity of demand is treated as posit~. The price elasticity of supply is given by the formula
e = dQldP(PoIQo)
and by ana.L..., ~nent, ciP = dQ/e(Po/Qo).
The price elastiClty of demand is given by the formula
n = dQ/dPdPo/Qo)
and by arrangement, dPl == dQ/n(Po/Qo).
riven that dP + dPl = wand by substitution,
w = PoIQo{dQ)(l/e + lin).
Thel~fore, en
dQ == wQo/Po(-). e+n
Ql = Qo + dQ, and if k = wI Po, after some algebra,
ken Ql == Qo(l + ).
e+n
Let Z = (e7:n)' then Ql == Qo(l + eZ).
From supply elastiCIty equation,
dPl == dQle(Po/Qo)
== PokQo, Po( ~-) Pol eQo e+n
n -::: kPo(-)·
e + n
But Pi = Po + dP and after some algebra,
kn P1 ::: Po(l -+- ~-).
e+n
(7)

Subltitnting .«;,. into Z, we have
P1 == Po(l + Z).
From dema.nd elasticity equa.tion,
dP1 == dQ/n(Po/Qo
= Polt-Qot Po( ~ )Po/nQo e+ n
== Po(~). e+n
But P2 == Po - dPl and after some algebra,
Let Y = e~C!fl' then
Ice P2 == Po(1- --).
e+n
P, == Po(i - Y).
(8)
(9)
DERIVATION OF DEMAND ELASTICITY AT POINT F AND THE LINE D 2Dp
By definition, the demand elasticity !unction DoD at the initial equilibrium point E (moving from point E to point E' ), is given by
n == (QoQtI PoPd(OPo/OQo).
For simplicity, the value of n is treated as positive. The two triangles 6E FG and 6F DQl are similar because both of them are right triangles sharing the same angle LQoED, theref Jre the third "angles are necessarily equal. In geometry, the corresponding sides of similar triangles are proportional. Hence,
GF/EG == QoD/EQo == QoQdPoP, == QoDjOPo.
Substituting this equality into the right SIde vI the expression for elasticity, we h l\ve
Tberefore, by simpl~rYlDg the above Lerm, we have
Given also in geometry that parallel lines cut any straIght lines into proportional segments. Since DoOIi EQo, thert'fC're
By substitution, we have n :;:; ED, ;:')E (lit)
Similarly, using identical principle. elasticity of demand at point F on the same demand functioll DoD, is given by
(11 )

To calculate tb nUT4erical value of demand elasticity at point F t the following method is adopted:-
nF :;: dQldP(P·::lQIl·
The slope of the demand curve dQ I tiP :;: nQol POl and previously it was deduc-.;d that P, = Po(l- Y) and Ql :;: Qo(1 + nY) where,
y :;: .'::.... There£ol:e, by substitution
1 - }'" nF :;: n(l + nY)
n- nY ::.
(1 + f,l") n-eZ -- (1 + eZ)
From Figure 14, it can be seen that tria.ngle 6F E' D and triangle f::t.DO[l2D are similar sharing the same angle IE' DF and since D2 DoilE' F, the other two angles a.re necessarily equal. In geometry, the corresponding sides of similar triangles are proportional, ~o
By arrangement,
D2DO = (D;;F +FD) (E' F). FD
Since E' F is represented hlt U1 and by arra.ngement,
Previously it was shown that nF :;: F D I DoF I hence 11 n p = Do F I F D and
and by arrangement,
D D _ (nF + 1) 2U-W--
nF
DERIVATION OF EQUATIONS
Case 1: Parallel shift
CTS .:: Area(DtE'FDo) - .4rea(EE'P)
-, kPOQl - 1/2kPo(Ql- Qo)
:::: kPoQo(l + eZ)- 1/2kPo(QoeZ)
= 1/2kPoQo(2 + eZ)
??
(12)

OPS = Area.( P1 E' E Po)
= 1/2(Qo + Qtl(Pl - Po)
= 1/2(Qo + Qo + QoeZ)(PoZ)
= 1/2PoQoZ(2 + eZ)
= 1/2PoQo(2Z + eZ2)
Case 2: Converge.nt shift
OT S = Area( DaE' F Do' - .lrea( E E' F)
= 1/2{kPo + (nF + 1 )icPolQl - 1/2kPo(Ql - Qo) np
nF + 1 = 1/2kPo(1 + )Qo(l + eZ) - l/:::kPo(QoeZ) nF
2np + J =- 1/2kPoQo{( )!1 + eZ) - eZI
nF
= 1/2kPoQo[( 2n - 2eZ) + ( 1 + eZ )I( 1 + eZ )(1 + eZ) - (eZ) 1 + eZ 1 + e Z n - eZ
= 1/2kPoQo[( 1 + 2n - eZ )( 1 -J. eZ )( 1 + eZ) - (eZ») 1 + eZ n - eZ
, 1 + 2n - eZ = 1/2I£PoQo{( Z)(1 + eZ) - eZ) n - e
CPS -= Area(P1E' EPo) = 1/2PoQo(2Z + eZ2
)
23