reuters european fund market 2015...
TRANSCRIPT

REUTERS
EUROPEAN FUND MARKET2015 EDITION

sfds
fdsf
ds
© Thomson Reuters 2015. All Rights Reserved. This report is for informational purposes only, and does not constitute investment advice or an offer to sell or the solicitation of an offer to buy any security of any entity in any jurisdiction. No guarantee is made that the information in this report is accurate or complete and no warranties are made with regard to the results to be obtained from its use. In addition, Lipper will not be liable for any loss or damage resulting from information obtained from Lipper or any of its affiliates. For more information about Lipper, please visit our website at www.lipperfmi.com or www.lipperweb.com.

EUROPEAN FUND MARKET REVIEW
2015 EDITION
OVERVIEW
KEY DATA:
TOTAL # OF MASTER GROUPS
1,946
TOTAL # OF COMPANIES2,850
TOTAL # OF FUNDS36,715
FUND LAUNCHES2,273
FUND CLOSURES3,061
TOTAL NET ASSETS (DECEMBER 2014)
€7,389BN
ASSET GROWTH (2013-2014)€958.4BN
ESTIMATED NET SALES (2014)
€366.8BN
ESTIMATED NET SALES (H1 2014)
€262.3BN
ESTIMATED NET SALES (H2 2014)
€104.4BN
The following report is based on the unique fund flowsinformation delivered through Lipper FundFile, ourleading global fund flows database. The charts andtables in this report reflect only the tip of the iceberg interms of the depth and breadth available from LipperFundFile. The report offers a high-level overview ofEuropean fund flow activity for 2014.
Lipper FundFile enables deep fund flows analysis ofall key geographical markets, covering Asia Pacific,Latin America, the Middle East and Africa, and theU.S., and delivers a truly global fund flows solution. Bygradually building the international reach of its globalsales data and maintaining its high quality and easeof use over the past ten years, FundFile has becomethe unparalleled source of data and analysis, withinformation on more than 100,000 funds.
The cross-border dimension of the European fundsindustry–the “international” fund market–can trulybe assessed only with Lipper SalesWatch, a uniquecooperative and confidential benchmarking servicethat allows leading fund groups to track their cross-border sales and assets against their competitors’ bycountry, distribution channel, institutional versus retailactivity, and both gross and net sales. This service nowcounts 54 of the leading asset managers among itsmembers. (Some sample data taken from the tool canbe seen on pages 21 and 22 of the current report.)
In 2013 investors and fund managers alike became preoccupied with an environment where interest rate rises were likely imminent. A year on and monetary tightening that was expected on the back of the tapering expectations of the U.S. quantitative-easing programme failed to materialise. In early 2014 many bond fund managers were busy reducing their duration in expectation of the rate rises and were subsequently hit by the “pain trade” of anticipating these increases too early as yields fell further. A high-yield “wobble” on the back of comments made by U.S. Federal Reserve Chairperson Janet Yellen in August also spooked the markets as political events in Europe—Greece and Russian involvement in the Ukraine—began to make a material return to investors’ concerns.
Even allowing for some outflows in equities late in the summer, a total of €367bn in European estimated net sales for 2014 represented an increase of 95% from 2013 and fell just shy of the best ever total of €372bn taken in 2006. Cross-border fund flows were strong, with some €179bn net being collected for the year (not including the net flows of money market funds). Country wise, Italy—with a total of €47bn for the year—dominated the European flows. Spain, which came in second for most of the year, was finally pipped to the post by Germany in a very close result (+€20.3bn and +€20.9bn, respectively), and the United Kingdom came in sixth with €13bn of net flows; an anaemic last quarter pushed the U.K. down in the rankings.
Despite the constant threat of increasing interest rates, bond funds had their seventh consecutive year of growth, with a total of €164bn of estimated net sales for 2014; they were dominant over equities, which could only muster €60bn by comparison. The success of mixed-asset funds was a continuing theme throughout Europe, with €125bn net being collected during the year. However, the number of new mixed-asset fund launches was down for the first time since 2010, suggesting the trend may now possibly have hit its peak. Commodity funds remained a loser in a difficult macro environment, with some €2.2bn of net outflows during the year.
On a sector basis there was still a strong income & yield theme, which was reflected in net flows. Broad-based European corporate bond funds proved very popular, collecting some €58bn across various iterations. This was also interspersed with preferences for larger-cap “safe-haven” equities in the U.S. and Europe. The mixed-asset trend, which includes flows into fund-of-funds portfolios of varying risk, also reflected Europe’s preference for broad-based diversification in an increasingly fraught geopolitical environment. Higher-risk equities and emerging market regions (other than EM bonds) were barely represented in the 25 top sectors.
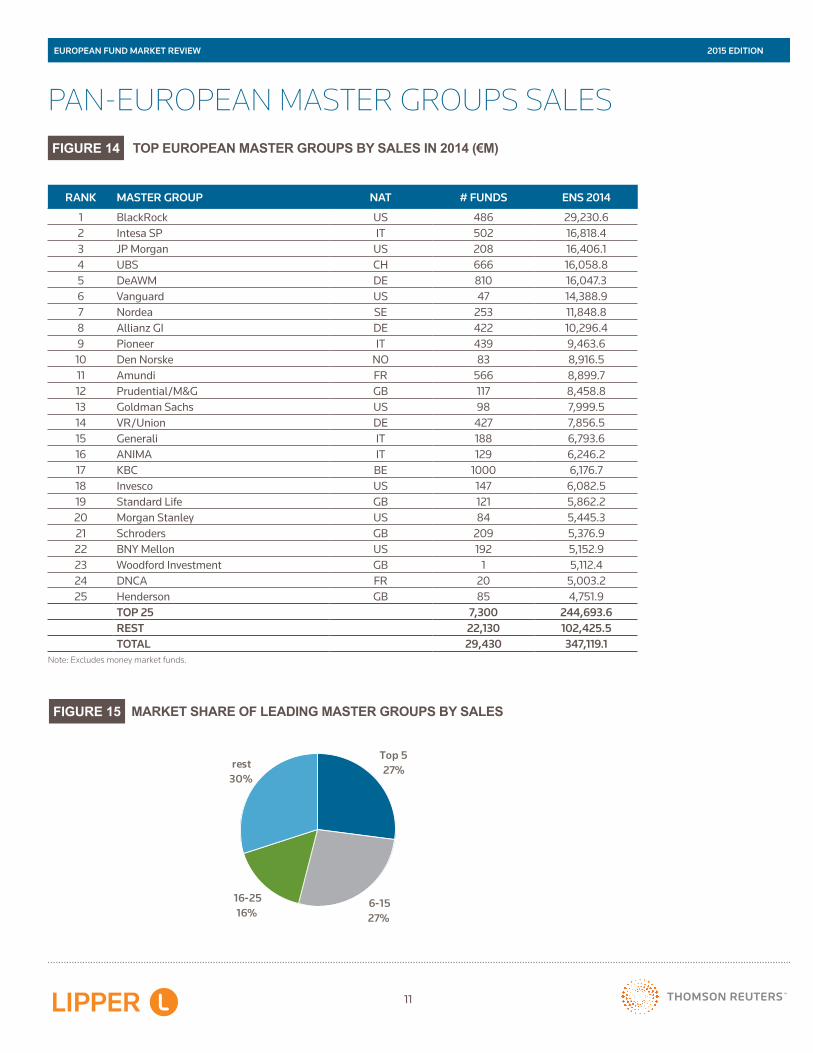
The top groups by sales contained a number of regulars. BlackRock, with €29bn of estimated net sales for 2014, easily headed up the table. There were a number of groups around the €16bn ENS mark for 2014, but JPM—with the lowest number of funds of this total (just over 200 funds) had the best concentration average.

EUROPEAN FUND MARKET REVIEW 2015 EDITION
4
OVERVIEW
FIGURE 2 GLOBAL NET SALES 2014 (€M)
-50,000
0
50,000
100,000
150,000
200,000
250,000
300,000
350,000
400,000
USA Europe Asia Pacific Latin America MEA
Bond Equity Mixed Assets Money Market Other
FIGURE 1 EUROPEAN NET SALES 2014 (€M)
-40,000
-30,000
-20,000
-10,000
0
10,000
20,000
30,000
40,000
50,000
60,000
70,000
Jan Feb Mar Apr May Jun Jul Aug Sep Oct Nov Dec
Bond Equity Mixed Assets Money Market Other

EUROPEAN FUND MARKET REVIEW 2015 EDITION
5
FIGURE 4 NUMBER OF FUND LAUNCHES BY ASSET CLASS
0
100
200
300
400
500
600
700
800
2007 2008 2009 2010 2011 2012 2013 2014
Bond Equity Mixed Assets
FIGURE 3 EUROPEAN ASSETS: BOND, EQUITY & MIXED ASSETS (€M)
Fund Investment TypeMixed AssetsEquityBond
0
500,000
1,000,000
1,500,000
2,000,000
2,500,000
3,000,000
2007 2008 2009 2010 2011 2012 2013 2014
Bond Equity Mixed Assets

EUROPEAN FUND MARKET REVIEW 2015 EDITION
6
6,848
1,158 21
85
1,504
19,811
Number of funds with assets between 0-100mil
Number of funds with assets between 100-500mil
Number of funds with assets between 500mil & 1bn
Number of funds with assets between 1 & 5bn
Number of funds with assets between 5 & 10bn
Number of funds with assets greater than 10bn
FIGURE 6 NET SALES BY SIZE OF FUNDS IN 2014 (€M)
FIGURE 5 EUROPEAN ASSETS AND NUMBER OF FUNDS IN DECEMBER 2014
Note: Excludes money market funds.
Note: Excludes money market funds.
-50,000 0 50,000 100,000 150,000 200,000 250,000
Funds with assets greater than 10bn
Funds with assets between 5 & 10bn
Funds with assets between 1 & 5bn
Funds with assets between 500mil & 1bn
Funds with assets between 100-500mil
Funds with assets between 0-100mil

EUROPEAN FUND MARKET REVIEW 2015 EDITION
7
BEST-SELLING EQUITY FUNDS IN 2014
FUND EQUITY CLASSIFICATION NET SALES (€M)
Vanguard S&P 500 UCITS ETF North America 5,155.0
CF Woodford Equity Income UK Income 5,112.4
iShares Core S&P 500 UCITS ETF (USD) North America 4,795.0
JPMorgan Funds - Europe Equity Plus Fund Speciality 3,058.1
Eastspring Investments Developed Asia Equity Pacific ex Japan 2,338.4
FIGURE 8
BEST SELLERS
FIGURE 7
FIGURE 9
BEST-SELLING BOND FUNDS IN 2014
FUND BOND CLASSIFICATION NET SALES (€M)
M&G Optimal Income Fund Flexible 7,285.9
Scottish Widows Gilt UK Gilt 3,890.2
GS Global Strategic Income Bond Portfolio Flexible 3,686.1
Scottish Widows Corporate Bond Tracker Fund GBP Corporate Investment Grade 3,064.0
PIMCO GIS Income Fund Global Currencies 3,032.3
BEST-SELLING MIXED FUNDS IN 2014
FUND MIXED CLASSIFICATION NET SALES (€M)
Allianz Income and Growth Asset Allocation 6,475.1
JPMorgan Investment Funds - Global Income Balanced 4,869.9
Morgan Stanley-Diversified Alpha Plus Fund Asset Allocation 3,875.9
BlackRock Global Funds - Global Allocation Fund Balanced 3,250.8
Invesco Pan European High Income Fund Conservative 3,191.3

EUROPEAN FUND MARKET REVIEW 2015 EDITION
8
EUROPEAN SALESFIGURE 10 EUROPEAN MARKET RANKING BY ESTIMATED NET SALES IN 2014 (€M)
RANK FUND MARKET BOND COMMODITY EQUITY MIXED MM PROPERTY OTHER TOTAL
1 International 77,160.8 -1,361.2 53,127.9 44,893.4 52,021.6 366.6 5,223.3 231,432.4 2 Italy 14,720.9 -24.3 3,218.3 28,379.7 -1,604.7 - 1,981.3 46,671.1 3 Germany 12,176.7 383.1 -5,168.6 14,640.4 -744.6 -1,297.5 926.8 20,916.2 4 Spain 17,481.4 4.0 3,149.2 11,208.3 -1,630.2 -364.4 -9,490.9 20,357.4 5 Sweden 8,081.7 -2.3 1,195.8 2,038.5 2,027.1 - 886.6 14,227.4 6 United Kingdom 4,601.9 -1.7 1,008.1 10,841.9 -7,671.2 4,777.4 -510.0 13,046.2 7 Switzerland 6,228.6 -1,643.5 5,872.3 1,244.1 -2,108.0 191.2 1,345.6 11,130.3 8 Norway 9,710.5 -2.7 -370.2 95.6 -140.5 - -11.9 9,280.8 9 Finland 3,942.4 - 1,135.5 399.1 0.1 172.0 -109.7 5,539.4 10 Belgium -1,077.4 48.9 100.6 5,316.6 80.9 - -2,030.1 2,439.4 11 Denmark 383.2 - 1,331.9 447.9 -43.0 - 196.1 2,316.2 12 Poland 933.1 10.1 -373.8 -542.0 1,314.3 - 76.4 1,418.0 13 Romania 678.5 - 23.5 88.9 255.5 - 44.3 1,090.8 14 Hungary 919.6 -0.4 70.6 348.8 -532.0 58.8 -5.4 860.0 15 Turkey 383.9 -66.9 -19.0 -20.4 394.3 -0.0 11.5 683.6 16 Czech Republic 180.1 12.0 71.3 293.3 -100.4 20.1 66.6 543.0 17 Malta 44.3 0.6 4.1 191.1 19.9 13.6 166.5 440.1 18 Slovakia 111.4 - -15.1 141.4 -1.7 84.7 -7.4 313.3 19 Croatia 229.2 - -22.6 -6.6 -93.9 - 5.7 111.9 20 Luxembourg 33.6 - -4.1 6.4 9.9 - - 45.8 21 Austria 203.8 17.6 -865.2 194.6 101.0 496.4 -115.7 32.4 22 Slovenia 17.7 - -3.8 11.3 2.1 1.8 - 29.0 23 Bulgaria 7.4 -0.1 14.2 8.7 -8.9 - 0.0 21.3 24 Lithuania 0.7 - -2.1 -0.4 -3.0 - 5.0 0.2 25 Ukraine - - -0.2 -2.3 -0.0 - - -2.5 26 Liechtenstein 35.3 - -40.6 -0.7 2.4 - -0.0 -3.7 27 Latvia -3.0 - -2.2 -5.6 -21.6 - - -32.3 28 Estonia 1.7 - -47.1 - - - - -45.5 29 Greece -60.4 - -57.4 37.9 61.5 - -34.9 -53.3 30 Russia -581.5 -4.0 -127.7 11.2 2.4 - -2.5 -702.1 31 Portugal -113.5 - 5.7 111.1 -822.6 -377.5 -25.3 -1,222.1 32 Netherlands 474.0 27.4 -2,014.7 -363.6 39.6 - -141.8 -1,979.0 33 France 7,123.7 415.6 -769.3 4,523.5 -21,182.6 - -2,241.3 -12,130.3
TOTAL EUROPE 164,030.3 -2,187.8 60,425.3 124,531.9 19,623.7 4,143.0 -3,791.0 366,775.5

EUROPEAN FUND MARKET REVIEW 2015 EDITION
9
FIGURE 11 TOP 25 SECTORS IN EUROPE (€M)
FIGURE 12 TOP AND BOTTOM FIVE SECTORS BY SALES IN 2014 (€M)
ALL SECTOR RANKING
RANK FUND SECTOR ENS 2014
1 Asset Allocation 70,853.5 2 Bonds EUR 31,634.2 3 Mixed Assets Conservative 29,583.7 4 Bonds EUR Corp. Inv. Grade 25,968.5 5 Equities North America 25,144.7 6 Money Market GBP 24,841.8 7 Bonds Flexible 24,162.2 8 Fund of Funds Conservative 21,237.3 9 Mixed Assets Balanced 18,858.8 10 Equities Speciality 14,769.0 11 Fund of Funds Balanced 14,569.3 12 Bonds Global Currencies 12,492.7 13 Bonds EUR Short-Term 12,038.0 14 Fund of Funds Asset Allocation 11,099.7 15 Bonds Emerging Markets 10,160.7 16 Bonds USD Corp. Inv. Grade 9,908.1 17 Equities Europe 7,926.1 18 Equities Japan 7,344.3 19 Bonds NOK 7,246.1 20 Bonds Speciality 6,797.0 21 Bonds EUR Corp. High Yield 6,768.6 22 Equities Europe Income 6,666.2 23 Fund of Funds Bonds 6,599.5 24 Bonds SEK 6,594.9 25 Equities Global 6,076.3
REST 10,607.3 TOTAL 429,948.5
Note: Includes funds of funds.
-20,000
-10,000
0
10,000
20,000
30,000
40,000
50,000
60,000
70,000
80,000
Asset Alloc Bnd Eur Mix Cons Bnd EurCIG
Eq Nth Am Bnd USD Eq DE MM Euro Guarant'd Bnd USDCorp HY

EUROPEAN FUND MARKET REVIEW 2015 EDITION
10
FIGURE 13 SECTOR POSITIONING BY SALES AND PERFORMANCE CONTRIBUTION TO ASSET GROWTH IN 2014 (€M)
Guarant'dBnd SEK ST
Eq DEEq Speciality
Bnd Eur Sh-T
Bnd USD CIG
Bnd Eur CIG
Bnd Em MktEq Europe
Mix Cons
Bnd USD Corp HY
Bnd FlexEq UK Inc
Eq UK Bnd EurBnd GBP CIG
Eq Pac ex Jpn
Eq Em Mkt Mix Bal
Asset Alloc
Bnd Gl Curr
Eq Nth Am
Eq Global
-10,000
0
10,000
20,000
30,000
40,000
50,000
60,000
70,000
80,000
-20,000 -10,000 0 10,000 20,000 30,000 40,000 50,000 60,000 70,000 80,000
Sales contribution (€m)
Per
form
ance
con
trib
utio
n (€
m)
Note: Excludes money market funds.
EUROPEAN FUND MARKET REVIEW 2015 EDITION
11
Top 527%
6-1527%
16-2516%
rest30%
FIGURE 14
FIGURE 15
TOP EUROPEAN MASTER GROUPS BY SALES IN 2014 (€M)
MARKET SHARE OF LEADING MASTER GROUPS BY SALES
PAN-EUROPEAN MASTER GROUPS SALES
RANK MASTER GROUP NAT # FUNDS ENS 2014
1 BlackRock US 486 29,230.6 2 Intesa SP IT 502 16,818.4 3 JP Morgan US 208 16,406.1 4 UBS CH 666 16,058.8 5 DeAWM DE 810 16,047.3 6 Vanguard US 47 14,388.9 7 Nordea SE 253 11,848.8 8 Allianz GI DE 422 10,296.4 9 Pioneer IT 439 9,463.6 10 Den Norske NO 83 8,916.5 11 Amundi FR 566 8,899.7 12 Prudential/M&G GB 117 8,458.8 13 Goldman Sachs US 98 7,999.5 14 VR/Union DE 427 7,856.5 15 Generali IT 188 6,793.6 16 ANIMA IT 129 6,246.2 17 KBC BE 1000 6,176.7 18 Invesco US 147 6,082.5 19 Standard Life GB 121 5,862.2 20 Morgan Stanley US 84 5,445.3 21 Schroders GB 209 5,376.9 22 BNY Mellon US 192 5,152.9 23 Woodford Investment GB 1 5,112.4 24 DNCA FR 20 5,003.2 25 Henderson GB 85 4,751.9
TOP 25 7,300 244,693.6 REST 22,130 102,425.5 TOTAL 29,430 347,119.1
Note: Excludes money market funds.
EUROPEAN FUND MARKET REVIEW 2015 EDITION
12
Top 2526%
Rest74%
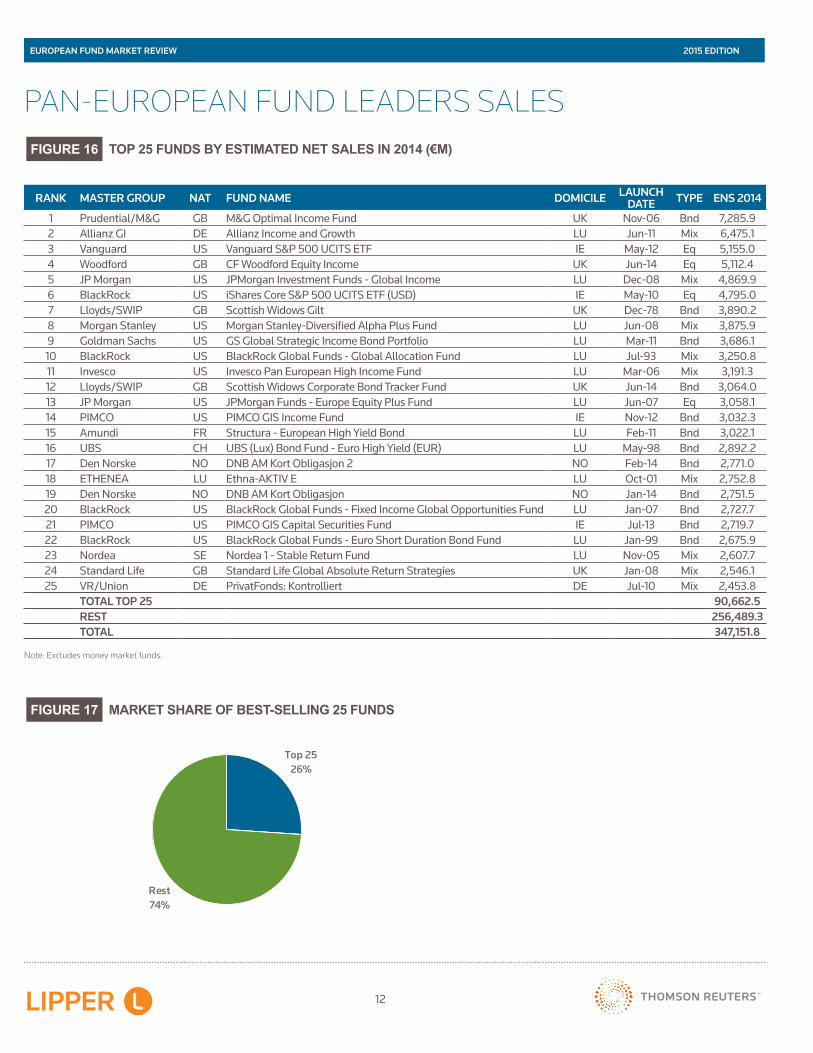
FIGURE 16
FIGURE 17
TOP 25 FUNDS BY ESTIMATED NET SALES IN 2014 (€M)
MARKET SHARE OF BEST-SELLING 25 FUNDS
PAN-EUROPEAN FUND LEADERS SALES
RANK MASTER GROUP NAT FUND NAME DOMICILE LAUNCH DATE TYPE ENS 2014
1 Prudential/M&G GB M&G Optimal Income Fund UK Nov-06 Bnd 7,285.9 2 Allianz GI DE Allianz Income and Growth LU Jun-11 Mix 6,475.1 3 Vanguard US Vanguard S&P 500 UCITS ETF IE May-12 Eq 5,155.0 4 Woodford GB CF Woodford Equity Income UK Jun-14 Eq 5,112.4 5 JP Morgan US JPMorgan Investment Funds - Global Income LU Dec-08 Mix 4,869.9 6 BlackRock US iShares Core S&P 500 UCITS ETF (USD) IE May-10 Eq 4,795.0 7 Lloyds/SWIP GB Scottish Widows Gilt UK Dec-78 Bnd 3,890.2 8 Morgan Stanley US Morgan Stanley-Diversified Alpha Plus Fund LU Jun-08 Mix 3,875.9 9 Goldman Sachs US GS Global Strategic Income Bond Portfolio LU Mar-11 Bnd 3,686.1 10 BlackRock US BlackRock Global Funds - Global Allocation Fund LU Jul-93 Mix 3,250.8 11 Invesco US Invesco Pan European High Income Fund LU Mar-06 Mix 3,191.3 12 Lloyds/SWIP GB Scottish Widows Corporate Bond Tracker Fund UK Jun-14 Bnd 3,064.0 13 JP Morgan US JPMorgan Funds - Europe Equity Plus Fund LU Jun-07 Eq 3,058.1 14 PIMCO US PIMCO GIS Income Fund IE Nov-12 Bnd 3,032.3 15 Amundi FR Structura - European High Yield Bond LU Feb-11 Bnd 3,022.1 16 UBS CH UBS (Lux) Bond Fund - Euro High Yield (EUR) LU May-98 Bnd 2,892.2 17 Den Norske NO DNB AM Kort Obligasjon 2 NO Feb-14 Bnd 2,771.0 18 ETHENEA LU Ethna-AKTIV E LU Oct-01 Mix 2,752.8 19 Den Norske NO DNB AM Kort Obligasjon NO Jan-14 Bnd 2,751.5 20 BlackRock US BlackRock Global Funds - Fixed Income Global Opportunities Fund LU Jan-07 Bnd 2,727.7 21 PIMCO US PIMCO GIS Capital Securities Fund IE Jul-13 Bnd 2,719.7 22 BlackRock US BlackRock Global Funds - Euro Short Duration Bond Fund LU Jan-99 Bnd 2,675.9 23 Nordea SE Nordea 1 - Stable Return Fund LU Nov-05 Mix 2,607.7 24 Standard Life GB Standard Life Global Absolute Return Strategies UK Jan-08 Mix 2,546.1 25 VR/Union DE PrivatFonds: Kontrolliert DE Jul-10 Mix 2,453.8
TOTAL TOP 25 90,662.5 REST 256,489.3 TOTAL 347,151.8
Note: Excludes money market funds.

EUROPEAN FUND MARKET REVIEW 2015 EDITION
13
PRODUCT THEMESEXCHANGE TRADED FUNDS
FIGURE 18
FIGURE 19
TOP 10 MASTER GROUPS BY SALES IN 2014 (€M)
TOP 10 FUNDS BY SALES IN 2014 (€M)
RANK MASTER GROUPS NAT ASSETS DEC 2014 ENS 2014
1 BlackRock US 175,011.6 11,765.7 2 Vanguard US 12,474.4 7,802.3 3 DeAWM DE 43,929.4 4,135.5 4 UBS CH 16,952.9 4,077.3 5 Soc Gen/Lyxor FR 37,391.0 3,641.3 6 Amundi FR 15,165.9 2,664.0 7 State Street US 11,560.8 1,753.9 8 BNP Paribas FR 3,971.5 1,115.9 9 HSBC GB 4,263.1 1,115.2 10 Source US 12,308.8 975.9
TOTAL TOP 10 333,029.3 39,047.0 TOTAL 361,767.6 38,583.1
RANK MASTER GROUPS FUND NAME ENS 2014
1 Vanguard Vanguard S&P 500 UCITS ETF 5,155.0 2 BlackRock iShares Core S&P 500 UCITS ETF (USD) 4,795.0 3 BlackRock iShares Euro Corporate Bond UCITS ETF 1,932.6 4 BlackRock iShares Euro Corporate Bond Large Cap UCITS ETF 1,801.5 5 BlackRock iShares MSCI Europe UCITS ETF (Inc) 1,266.5 6 Vanguard Vanguard FTSE 100 UCITS ETF 1,249.7 7 BlackRock iShares Core MSCI World UCITS ETF 1,136.1 8 Soc Gen/Lyxor Lyxor UCITS ETF EURO STOXX 50 1,107.2 9 DeAWM db x-trackers MSCI USA Index UCITS ETF (DR) 892.3 10 Source PIMCO Euro Short Maturity Source UCITS ETF 833.8
TOTAL TOP 10 20,169.7 TOTAL 38,583.1

EUROPEAN FUND MARKET REVIEW 2015 EDITION
14
PRODUCT THEMESINDEX TRACKING FUNDS
FIGURE 20
FIGURE 21
TOP 10 MASTER GROUPS BY SALES 2014 (€M)
TOP 10 FUNDS BY SALES 2014 (€M)
RANK MASTER GROUPS NAT ASSETS DEC 2014 ENS 2014
1 Vanguard US 52,559.7 6,710.7 2 Cr Suisse CH 46,980.2 5,556.1 3 BlackRock US 72,647.3 5,032.5 4 UBS CH 47,973.6 3,979.0 5 Swisscanto CH 19,481.2 3,339.6 6 MMC/Mercer US 2,560.2 2,217.7 7 HSBC GB 8,563.4 1,972.6 8 Lloyds/SWIP GB 21,852.0 1,670.7 9 Fidelity US 3,143.8 873.8 10 Sv Handelsbanken SE 5,974.7 866.0
TOTAL TOP 10 281,736.3 32,218.7 TOTAL 454,705.9 37,997.1
RANK MASTER GROUPS FUND NAME ENS 2014
1 Lloyds/SWIP Scottish Widows Corporate Bond Tracker Fund 3,064.0 2 HSBC HSBC FTSE All-World Index 1,313.9 3 MMC/Mercer Mercer QIF CCF - Passive Global Equity CCF 1,272.0 4 Pictet Pictet (CH) Institutional - World ex Swiss Equity Tracker US TE ex SL 1,173.9 5 BlackRock BlackRock UK Gilts All Stocks Tracker 1,163.1 6 BlackRock BlackRock Continental European Equity Tracker 1,041.6 7 Vanguard Vanguard Euro Government Bond Index Fund 1,039.8 8 Vanguard Vanguard European Stock Index Fund 956.3 9 MMC/Mercer Mercer Fundamental Indexation Global Equity CCF 945.7 10 Cr Suisse CSIF Switzerland Total Market Index Blue 882.5
TOTAL TOP 10 12,852.9 TOTAL 37,997.1

EUROPEAN FUND MARKET REVIEW 2015 EDITION
15
PRODUCT THEMESBONDS EUR CORP. INV. GRADE
FIGURE 22
FIGURE 23
TOP 10 MASTER GROUPS BY SALES IN 2014 (€M)
TOP 10 FUNDS BY SALES IN 2014 (€M)
RANK MASTER GROUPS NAT ASSETS DEC 2014 ENS 2014
1 BlackRock US 21,249.5 6,148.3 2 Intesa SP IT 6,007.2 1,951.8 3 Invesco US 6,040.0 1,842.7 4 BBVA ES 1,963.2 1,604.7 5 Schroders GB 5,290.0 1,450.2 6 Henderson GB 2,888.1 1,115.1 7 Nordea SE 4,205.2 732.4 8 VR/Union DE 4,188.2 701.6 9 Pohjola FI 3,256.5 677.5 10 ORIX / Robeco JP 2,667.8 659.7
TOTAL TOP 1O 57,755.8 16,884.0 TOTAL 141,403.7 25,968.5
RANK MASTER GROUPS FUND NAME ENS 2014
1 BlackRock iShares Core Euro Corporate Bond UCITS ETF 1,932.6 2 Invesco Invesco Euro Corporate Bond Fund 1,842.7 3 BlackRock iShares Euro Corporate Bond Large Cap UCITS ETF 1,801.5 4 BBVA BBVA Bonos Corporativos Duración Cubierta FI 1,510.6 5 Schroders Schroder ISF-Euro Corporate Bond 1,241.1 6 Henderson Henderson Horizon - Euro Corporate Bond 1,115.1 7 Intesa SP Interfund Euro Corporate Bond 970.4 8 DeAWM Deutsche Invest I Euro Corporate Bonds 704.1 9 Pohjola OP-Yrityslaina 701.4 10 Nordea Nordea Corporate Bond 663.3
TOTAL TOP 1O 12,482.8 TOTAL 25,968.5

EUROPEAN FUND MARKET REVIEW 2015 EDITION
16
PRODUCT THEMESEQUITIES EUROPE INCOME
FIGURE 24
FIGURE 25
RANK MASTER GROUPS NAT ASSETS DEC 2014 ENS 2014
1 BlackRock US 2,737.4 1,743.3 2 Allianz GI DE 2,267.4 1,254.8 3 JP Morgan US 2,722.9 1,168.1 4 Pioneer IT 1,579.5 845.5 5 Schroders GB 1,530.4 819.4 6 Fidelity US 497.4 291.8 7 Amundi FR 352.4 152.1 8 BBVA Group ES 167.5 121.3 9 Santander ES 640.4 117.0 10 UBS CH 497.2 114.6
TOTAL TOP 1O 12,992.5 6,627.8 TOTAL 20,844.6 6,666.2
RANK MASTER GROUPS FUND NAME ENS YTD 2014
1 Allianz GI Allianz European Equity Dividend 1,257.7 2 JP Morgan JPMorgan Europe Strategic Dividend 1,168.1 3 BlackRock BlackRock Global Funds - European Equity Income 1,123.3 4 Pioneer Pioneer Funds - European Equity Target Income 845.5 5 Schroders Schroder ISF-European Dividend Maximiser 548.9 6 BlackRock BlackRock Continental European Income 530.0 7 Fidelity Fidelity Funds Sicav - European Dividend Fund 291.8 8 Schroders Schroder ISF-European Equity Yield 270.6 9 BNP Paribas THEAM Quant - Equity Europe Income 155.7 10 BBVA Group BBVA Bolsa Plan Dividendo Europa, FI 121.3
TOTAL TOP 1O 6,312.8 TOTAL 6,666.2
TOP 10 MASTER GROUPS BY SALES IN 2014 (€M)
TOP 10 FUNDS BY SALES IN 2014 (€M)

EUROPEAN FUND MARKET REVIEW 2015 EDITION
17
Next 10 sectors
27%
16-25 sectors
14%
Top 5 sectors
37%
Rest22%
RANK FUND SECTOR # FUNDS ENS 2014
1 Asset Allocation 264 29,867.72 Target Maturity Euroland 95 13,532.33 Equities Global 164 10,731.64 Target Maturity Other 47 8,462.55 Bonds Global Currencies 80 8,243.16 Protected Fund 92 7,791.07 Bonds NOK 6 7,393.48 Fund of Funds Guaranteed 47 5,662.79 Equities UK Income 5 5,327.810 Equities North America 56 5,324.011 Bonds EUR 49 5,218.812 Fund of Funds Asset Allocation 142 4,973.713 Bonds CHF 26 4,027.714 Fund of Funds Conservative 30 3,785.115 Bonds GBP Corporate Investment Grade 5 3,298.316 Equities Switzerland 26 3,177.117 Mixed Assets Balanced 73 3,161.518 Equities Pacific ex Japan 29 3,009.219 Equities Speciality 65 2,862.420 Bonds USD Corp. Inv. Grade 11 2,841.621 Equities Europe 54 2,597.822 Bonds EUR Short-Term 23 2,562.423 Bonds Flexible 23 2,551.424 Bonds Global Corporates 24 2,502.725 Bonds Global High Yield 33 2,258.3
TOP 25 1,735 151,164.1TOTAL 2,553 194,908.7
PRODUCT DEVELOPMENTNEW FUNDS BY SECTOR
FIGURE 26
FIGURE 27
TOP 25 SECTORS OF NEW FUNDS IN 2014 (€M)
MARKET SHARE OF LEADING SECTORS OF NEW FUNDS
EUROPEAN FUND MARKET REVIEW 2015 EDITION
18
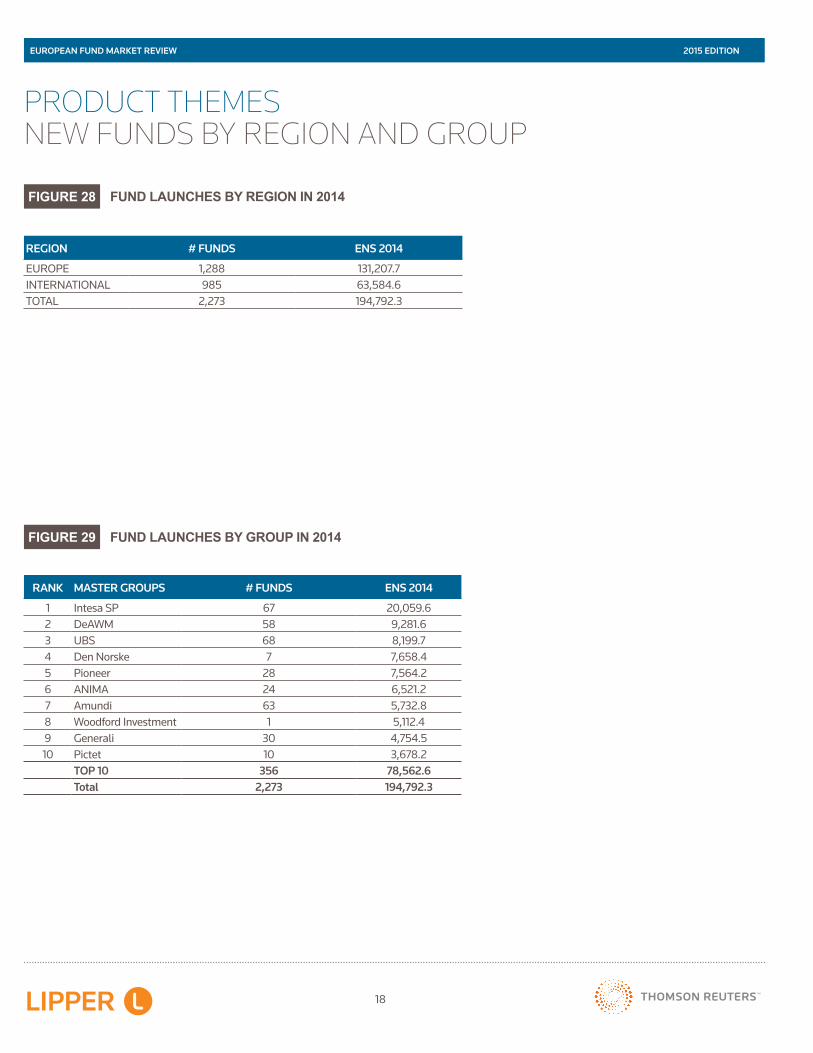
PRODUCT THEMESNEW FUNDS BY REGION AND GROUP
FIGURE 28
FIGURE 29
REGION # FUNDS ENS 2014
EUROPE 1,288 131,207.7INTERNATIONAL 985 63,584.6TOTAL 2,273 194,792.3
RANK MASTER GROUPS # FUNDS ENS 2014
1 Intesa SP 67 20,059.62 DeAWM 58 9,281.63 UBS 68 8,199.74 Den Norske 7 7,658.45 Pioneer 28 7,564.26 ANIMA 24 6,521.27 Amundi 63 5,732.88 Woodford Investment 1 5,112.49 Generali 30 4,754.510 Pictet 10 3,678.2
TOP 10 356 78,562.6Total 2,273 194,792.3
FUND LAUNCHES BY REGION IN 2014
FUND LAUNCHES BY GROUP IN 2014

EUROPEAN FUND MARKET REVIEW 2015 EDITION
19
CROSS-BORDER PROGRESSGROUP WINNERS
FIGURE 30 TOP 25 INTERNATIONAL GROUPS BY ESTIMATED NET SALES 2014 (€M)
Note: Excludes money market funds.
RANK MASTER GROUP NAT # FUNDS ASSETS DEC 2014 ENS 2014
1 BlackRock US 414 336,040.3 26,434.72 JP Morgan US 168 112,298.0 16,719.93 Vanguard US 39 56,372.0 11,940.24 Prudential/M&G GB 74 86,712.3 11,719.65 Invesco US 96 47,100.5 11,664.06 DeAWM DE 395 84,067.9 11,321.77 Schroders GB 132 82,980.2 10,789.78 UBS CH 394 91,851.1 9,994.69 Amundi FR 210 50,917.1 8,704.410 Allianz GI DE 52 32,500.7 8,323.811 Goldman Sachs US 98 43,654.7 7,999.512 Nordea SE 89 39,424.9 6,275.513 Morgan Stanley US 77 38,475.9 5,482.914 Soc Gen/Lyxor FR 239 40,271.8 4,689.715 BNY Mellon US 62 24,143.2 4,492.916 State Street US 96 24,021.5 4,277.817 KBC BE 72 19,911.3 3,963.118 MMC/Mercer US 40 16,711.8 3,686.619 RBC CA 48 32,750.6 3,665.720 Henderson GB 35 19,950.7 3,654.421 Legg Mason US 83 19,360.6 3,130.122 DNCA FR 11 7,038.8 3,112.523 NN Group NL 96 32,334.6 2,955.824 Cr Agricole FR 68 4,111.0 2,787.625 GMO US 6 4,050.4 2,399.8
TOP 25 3,094 1,347,051.8 190,186.3REST 6,448 1,553,893.9 -10,775.5TOTAL 9,542 2,900,945.7 179,410.8
FIGURE 31 MARKET SHARE OF LEADING MASTER GROUPS BY SALES IN 2014 (€M)
Top 543%
6-1544%
Rest13%

EUROPEAN FUND MARKET REVIEW 2015 EDITION
20
BlackRock
JP Morgan
Prudential/M&G
FidelitySchrodersUBS
DeAWMVanguard
PictetAmundi
Goldman SachsNordea
Invesco
Allianz GI
BNY Mellon
-5,000
0
5,000
10,000
15,000
20,000
25,000
30,000
35,000
40,000
-30,000 -20,000 -10,000 0 10,000 20,000 30,000
Sales contribution (€m)
Per
form
ance
con
trib
utio
n (€
m)
FIGURE 32 GROUP POSITIONING BY SALES AND PERFORMANCE CONTRIBUTION TO ASSET GROWTH IN 2014 (€M)
Note: Excludes money market funds.
CROSS-BORDER PROGRESSGROUP WINNERS

EUROPEAN FUND MARKET REVIEW 2015 EDITION
21
CROSS-BORDER PROGRESSFOREIGN SHARE OF SALES IN EUROPE
-10,000
0
10,000
20,000
30,000
40,000
50,000
60,000
70,000
80,000
IT SP DEU FR BE CH NL AU SWE UK
Domestic Foreign
FIGURE 33 NET SALES OF FOREIGN GROUPS BY MARKET IN 2014 - ALL FUNDS (€M)
-10,000
-8,000
-6,000 -4,000
-2,000
0
2,000
4,0006,000
8,000
10,000
SP IT NL BE FR AU UK SWE CH DEU
Domestic Foreign
FIGURE 34 NET SALES OF FOREIGN GROUPS BY MARKET IN 2014 - EQUITY ONLY (€M)
-5,000
0
5,000
10,000
15,000
20,000
25,000
30,000
IT SP DEU UK FR CH BE AU SWE NL
Domestic Foreign
FIGURE 35 NET SALES OF FOREIGN GROUPS BY MARKET IN 2014 - BOND ONLY (€M)
Note: Excludes money market funds & ETFs1. Foreign activity is actual sales as measured by the Lipper SalesWatch Confidential Service.2. The 54 members are estimated to account for 75-80% of the total crossborder sales activity

EUROPEAN FUND MARKET REVIEW 2015 EDITION
22
CROSS-BORDER PROGRESSDOMESTIC VS. FOREIGN SECTORS
FIGURE 36 TOP 5 DOMESTIC AND FOREIGN SECTORS IN THE MAJOR MARKETS
Note: Excludes money market funds & ETFs
FRANCE
DOMESTIC ENS 2014 FOREIGN REAL SALES 20141 Bonds EUR Short-Term 3,089.0 Bonds Emerging Markets Confidential2 Mixed Assets Conservative 2,345.8 Bonds EUR Corp. Inv. Grade3 Asset Allocation 2,033.8 Bonds Flexible4 Bonds EUR 1,812.4 Bonds EUR5 Convertible Bonds & Options 813.0 Equities Europe
GERMANY
DOMESTIC ENS 2014 FOREIGN REAL SALES 20141 Mixed Assets Conservative 7,505.1 Bonds EUR Confidential2 Asset Allocation 4,868.9 Asset Allocation3 Bonds EUR 4,369.9 Bonds EUR Short-Term4 Bonds EUR Global 2,400.3 Bonds EUR Corp. Inv. Grade5 Mixed Assets Balanced 1,804.5 Mixed Assets Balanced
ITALY
DOMESTIC ENS 2014 FOREIGN REAL SALES 20141 Asset Allocation 23,326.7 Asset Allocation Confidential2 Bonds USD Corp. Inv. Grade 3,596.0 Bonds Flexible3 Bonds EUR 3,525.4 Bonds EUR4 Bonds EUR Corp. Inv. Grade 2,759.4 Mixed Assets Conservative5 Target Maturity Other 2,674.7 Bonds EUR Corp. Inv. Grade
SWITZERLAND
DOMESTIC ENS 2014 FOREIGN REAL SALES 20141 Bonds Global Currencies 3,315.3 Equities Speciality Confidential2 Equities Emerging Markets 2,040.0 Asset Allocation3 Equities Real Estate 2,028.9 Bonds Global Currencies4 Asset Allocation 1,573.6 Bonds EUR Corp. Inv. Grade5 Convertible Bonds & Options 1,300.3 Bonds Speciality
UNITED KINGDOM
DOMESTIC ENS 2014 FOREIGN REAL SALES 20141 Asset Allocation 7,513.0 Bonds Global Currencies Confidential2 Real Estate 4,777.4 Bonds Emerging Markets3 Bonds UK Gilt 3,374.1 Bonds Flexible4 Mixed Assets Balanced 2,873.9 Bonds EUR5 Equities Global Income 1,648.0 Bonds USD Short-Term

EUROPEAN FUND MARKET REVIEW 2015 EDITION
23
FOOTNOTES1. All data as at 31 Dec 2014 unless otherwise stated.
2. ‘International’ fund market. Lipper defines an International fund as a fund that sources less than 80% of its assets from any single country. Some fund groups have domestic and international funds.
3. ‘Domestic’ fund market. If a fund sources more than 80% of its assets from a single country then the fund is allocated to that market regardless of its domicile.
4. Funds of funds have been excluded from all charts and tables (to avoid double-counting) unless otherwise stated. Therefore a market total is the sum of all the investment categories excluding the three funds of funds categories (in-house, ex-house and hedge).
5. The investment category ‘other’ includes a variety of different product categories. For most markets, especially Belgium, Spain and France, the figure comprises guaranteed funds, but there are also derivatives and other speciality funds in the ‘other’ category.
6. Property funds are open-ended property funds only.
7. Master group. Analysis that aggregates the European mutual fund assets under the umbrella of their parent company name.
8. ENS stands for estimated net sales.
9. ETFs are included in Lipper’s database on mutual funds, but this excludes exchange-traded commodity products that are not mutual funds.
10. References to foreign activity relate to actual sales as measured by Lipper’s SalesWatch confidential service. The 54 SalesWatch members are estimated to account for 75-80% of total cross-border sales activity.
REUTERS

EUROPEAN FUND MARKET REVIEW 2015 EDITION
24
REUTERS
PRODUCT MANAGER, LIPPER FUNDFILE:JÉRÔME COUTEUR [email protected]
PRODUCT MANAGER, LIPPER SALESWATCH:BARBARA FERRARESI [email protected]
EDITORIALJAKE MOELLER [email protected]: @JakeMoeller1http://lipperinsight.thomsonreuters.com
CONTACT USLIPPER DATABASES FEATURED:FUNDFILE - http://bit.ly/LipperFundFile SALESWATCH - http://bit.ly/LipperSalesWatch
DESIGNED BY:KALIE [email protected]