revathi shanmugasundaram and ramesh k. selvaraj journal of immunology regulatory t cell properties...
TRANSCRIPT

of July 10, 2018.This information is current as
Cells+CD25+Regulatory T Cell Properties of Chicken CD4
Revathi Shanmugasundaram and Ramesh K. Selvaraj
http://www.jimmunol.org/content/186/4/1997doi: 10.4049/jimmunol.1002040January 2011;
2011; 186:1997-2002; Prepublished online 17J Immunol
Referenceshttp://www.jimmunol.org/content/186/4/1997.full#ref-list-1
, 9 of which you can access for free at: cites 34 articlesThis article
average*
4 weeks from acceptance to publicationFast Publication! •
Every submission reviewed by practicing scientistsNo Triage! •
from submission to initial decisionRapid Reviews! 30 days* •
Submit online. ?The JIWhy
Subscriptionhttp://jimmunol.org/subscription
is online at: The Journal of ImmunologyInformation about subscribing to
Permissionshttp://www.aai.org/About/Publications/JI/copyright.htmlSubmit copyright permission requests at:
Email Alertshttp://jimmunol.org/alertsReceive free email-alerts when new articles cite this article. Sign up at:
Print ISSN: 0022-1767 Online ISSN: 1550-6606. Immunologists, Inc. All rights reserved.Copyright © 2011 by The American Association of1451 Rockville Pike, Suite 650, Rockville, MD 20852The American Association of Immunologists, Inc.,
is published twice each month byThe Journal of Immunology
by guest on July 10, 2018http://w
ww
.jimm
unol.org/D
ownloaded from
by guest on July 10, 2018
http://ww
w.jim
munol.org/
Dow
nloaded from

The Journal of Immunology
Regulatory T Cell Properties of Chicken CD4+CD25+ Cells
Revathi Shanmugasundaram and Ramesh K. Selvaraj
Chicken CD4+CD25+ cells were characterized for mammalian regulatory T cells’ suppressive and cytokine production properties.
Anti-chicken CD25 mAb was produced in mice and conjugated with a fluorescent tag. The specificity of the Ab against chicken
CD25 was confirmed by evaluating Con A-induced CD25 upregulation in thymocytes and by quantifying the CD25 mRNA content
of positive and negative cells identified by anti-chicken CD25 Ab. The percentage of CD4+CD25+ cells, expressed as a percentage of
CD4+ cells, in thymus and blood was ∼3–7%, in spleen was 10%, and in cecal tonsil, lung, and bone marrow was ∼15%. Bursa
had no detectable CD4+CD25+ cells. CD25+ cells were mostly CD4+ in the thymus, whereas in every other organ studied, CD25+
cells were distributed between CD4+ and CD42 cells. Chicken thymic CD4+CD25+ cells did not proliferate in vitro in the absence
of recombinant chicken IL-2 (rCIL-2). In the presence of rCIL-2, PMA plus ionomycin or Con A stimulated CD4+CD25+ cell
proliferation, whereas anti-CD3 plus CD28 did not stimulate CD4+CD25+ cell proliferation. Naive CD4+CD25+ cells had 29-fold
more IL-10 mRNA and 15-fold more TGF-b mRNA than the naive CD4+CD252 cells. Naive CD4+CD25+ had no detectable IL-2
mRNA. Both naive and PMA plus ionomycin-stimulated thymic CD4+CD25+ cells suppressed naive T cell proliferation. The
suppressive properties were partially contact dependent. Supplementing CD4+CD25+ cell coculture with rCIL-2 reversed the
suppressive properties of CD4+CD25+ cells. Chicken CD4+CD25+ cells have suppressive properties similar to that of mammalian
regulatory T cells. The Journal of Immunology, 2011, 186: 1997–2002.
The immune system protects the host from foreign patho-gens while avoiding damage toward self-Ags. RegulatoryT cells (Tregs), a subset of T cells, specialize in immune
suppression. Disruption in function of Tregs is a primary cause ofautoimmune and inflammatory diseases (1). Among markers thathave been defined for Tregs, the closest that can be termed uniqueto Tregs is Foxp3 (2). Foxp3, a transcription factor, is essential forTreg development and function (3, 4). Foxp3 transcriptionallyrepresses IL-2 and maintains the suppressor functions of Tregs (5).Mutations in the Foxp3 gene cause autoimmune disease in scurfymice (6), and such mice succumb to an overwhelming autoim-mune pathology (7). CD4+CD25+Foxp3+ cells are extensivelystudied in mammals and have been established as natural Tregs.There are several different categories of suppressive cells,
namely T regulatory-1 cells (8), Th3 cells (9), CD8+Foxp3+ cells(10), gd T cells (11), NKT cells (12), and CD42CD82TCRab+
cells (13). CD4+CD25+Foxp3+ Tregs have the following uniquecharacteristics that differentiate them from other suppressivepopulations. CD4+CD25+Foxp3+ Tregs originate as a separatelineage of cells in the thymus (14) and produce high amounts ofIL-10 (15) and low amounts of IL-2 (16, 17). CD4+CD25+Foxp3+
Tregs suppress T cell proliferation in both contact-dependent and-independent pathways (18). CD4+CD25+Foxp3+ Tregs are aner-
gic in vitro (19), and their in vitro anergy and suppressive prop-erties are reversed by exogenous IL-2 (19).A Foxp3 ortholog is yet to be identified in chickens, and no
expressed sequence tags with high-enough sequence identity toFoxp3 could be identified in chicken expressed sequence tagdatabases (20). In addition to in silico analysis, several degenerateprimers were designed based on mouse, human, cattle, and fishFoxp3 sequences. The degenerate primers did not amplify anyspecific bands, thus the presence of Foxp3 or Tregs are questionedin chickens (21).Because Foxp3 is not expressed on the cell surface, but rather
expressed in the nucleus, CD25 expression is often used toidentify Tregs (22). CD25, an IL-2R, is expressed in chickenmonocytes, macrophages, thrombocytes, CD4+ cells, and CD8+
cells (23) and is a marker of T cell activation in chickens (24).Though CD25+ cells have been identified in chicken, the CD4+
CD25+ subpopulation has not been isolated and characterizedfor classical mammalian Treg properties such as proliferationof T cell suppression assay or suppressive cytokine production.Because no commercial anti-chicken CD25 is available, an anti-chicken CD25 mAb was generated. It was hypothesized thatchicken CD4+CD25+ cells exhibit suppressive and functionalproperties similar to that of mammalian CD4+CD25+Foxp3+
Tregs. Chicken CD4+CD25+ cells were isolated by flow cyto-metry and characterized for cytokine production profile andsuppression of T cell proliferation properties and in vitro pro-liferation characteristics.
Materials and MethodsBirds and recombinant chicken IL-2
Tissues for experiments were collected from UCD 003, a white leghorninbred (99.9%) chicken of a defined MHC haplotype (B17/B17) maintainedin specific pathogen-free conditions. All animal protocols were approvedby the Ohio Agricultural Research and Development Center animal careand use committee. Recombinant chicken IL-2 (rCIL-2) vector (gift fromDr. Kaiser, Institute for Animal Health, Compton, U.K.) was transfectedinto COS-7 cells (25). COS-7 cell supernatant was used at a 1:500 dilutionas a source of rCIL-2.
Department of Animal Sciences, Ohio Agricultural Research and Development Cen-ter, Wooster, OH 44691
Received for publication June 18, 2010. Accepted for publication December 8, 2010.
This work was supported by an Ohio Agricultural Research and Development CenterSEEDS grant and George and Edna Jaap funding (to R.K.S.). Salaries and researchsupport provided by state and federal funds appropriated to the Ohio AgriculturalResearch and Development Center.
Address correspondence and reprint requests to Dr. Ramesh K. Selvaraj, AssistantProfessor, Department of Animal Sciences, Ohio Agricultural Research and Devel-opment Center, The Ohio State University, 1680 Madison Avenue, Wooster, OH44691. E-mail address: [email protected]
Abbreviations used in this article: rCIL-2, recombinant chicken IL-2; Treg, regula-tory T cell.
Copyright� 2011 by The American Association of Immunologists, Inc. 0022-1767/11/$16.00
www.jimmunol.org/cgi/doi/10.4049/jimmunol.1002040
by guest on July 10, 2018http://w
ww
.jimm
unol.org/D
ownloaded from

Mouse anti-chicken CD25 mAb
The nucleotide sequence encoding the extracellular domain (aa 22–190) ofchicken CD25 (23) was amplified using high-fidelity PCR from chickensplenic cDNA using the following primers: forward, 59-ATCGCGGATCC-GATAAATGCCCACGTCTTTC-39 containing a BamHI site and reverse, 59-CCGGAATTCGGATAGCTGCTTGTTTATAG-39 containing an EcoRI site.The PCR product was inserted into the pCR2.1-TOPO vector (Invitrogen,Carlsbad, CA) using the manufacturer’s instructions. The resultant TOPOcloning reaction was transformed into One Shot Mach1-T1R chemicallycompetent Escherichia coli. Colonies were picked and sequenced using theM13 forward primers. One colony with right sequence and orientation wasselected and grown. Plasmid DNAwas extracted using the QIAprepMiniprepkit (Qiagen, Valencia, CA) and digested with BamHI (Invitrogen) and EcoRI(Invitrogen). The digested PCR product was then inserted into the corre-sponding sites of the PET15b expression vector (Novagen, Darmstadt, Ger-many). pET15b-CD25 vector was transformed into BL21 DE3 pLysS cells(Novagen) to express the extracellular domain of chicken CD25 protein (aa22–190) as a fusion protein carrying His tags. CD25-His tag fusion proteinwas purified using a nickel column under denaturing conditions following themanufacturer’s instructions (Qiagen). CD25-His tag fusion protein was an-alyzed by SDS-PAGE and Western blot using anti-His tag mAb (Qiagen)(23). Mouse anti-chicken CD25 was produced by Promab Biotechnologies(Richmond, CA). The primary monoclonal anti-chicken CD25 Ab wasconjugated to PE using the R-PE conjugation kit (Prozyme, Hayward, CA)following the manufacturer’s instructions. The specificity of the Ab againstchicken CD25 was studied by evaluating Con A-induced CD25 upregulation
in thymocytes and quantifying the CD25 mRNA content of positive andnegative cells identified by anti-chicken CD25 Ab.
CD25 staining in Con A-stimulated thymocytes
Single-cell suspensions of thymus were concentrated for lymphocytesby density centrifugation over Histopaque (1.077 g/ml; Sigma-Aldrich).Thymocytes (1 3 106) were cultured in RPMI 1640 supplemented with5% FBS, 1% penicillin plus streptomycin, 10 mg/ml Con A, and 1:500rCIL-2 for 0 or 48 h. Cells were incubated with 10 mg/ml PE-linked mouseanti-chicken CD25 and 1:200 dilution of unlabeled mouse IgG (Abcam,Cambridge, MA) for 45 min. The unbound Abs were removed by centri-fugation. The percentages of CD25+ cells in different organs were ana-lyzed in a flow cytometer (Guava Eascyte; Millipore).
CD4+CD25+ cell analysis and isolation
Single-cell suspensions of immune organs from 1-wk-old birds (n = 7) wereconcentrated for lymphocytes by density centrifugation over Histopaque(1.077 g/ml; Sigma-Aldrich). Cells (1 3 106) were incubated with 10 mg/ml primary fluorescent linked mouse anti-chicken CD25, 1:200fluorescent-conjugated mouse anti-chicken CD4 (Southern BiotechnologyAssociates, Birmingham, AL), and 1:200 dilution of unlabeled mouse IgGfor 45 min. The unbound primary Abs were removed by centrifugation.The percentage of CD4+CD25+ cells in different organs were analyzed ina flow cytometer (Guava Eascyte; Millipore) and expressed as percentageof CD4+ cells. Flow sorting of cells for different studies was done using aniCyt reflection cell sorter (iCyt, Champaign, IL) (∼99% pure).
Proliferation kinetics and cytokine production profile of CD4+
CD25+ cells
Thymic CD4+CD25+ or CD4+CD252 cells were flow sorted as describedabove. Cells were pooled from at least three different birds to collectenough cells for the experiment. Cell-culture media used for this experi-ment was RPMI 1640 media supplemented with 1% penicillin plusstreptomycin and 5% FBS. Approximately 25,625 CD4+CD25+ or CD4+
CD252 cells were stimulated in vitro with either anti-chicken CD3 plusCD28 (Southern Biotechnology Associates) (1:750 dilution) or Con A (10mg/ml) or PMA (1 mg/ml) plus ionomycin (50 mg/ml) or no treatment in250 ml media in three replications (n = 3). The above treatment groupswere supplemented with 0 or 1:500 dilution of rCIL-2. Medium wasreplaced every 3 d. Replacement media was not supplemented with anti-CD3 plus CD28 or Con A or PMA plus ionomycin for any of the treat-ments. Replacement media was supplemented with rCIL-2 for groups thatwere earlier treated with rCIL-2. mRNAwas extracted from cells at 0 h and5 d and analyzed for mRNA profile by RT-PCR. Cells from 5 d culturewere analyzed for suppressive properties by a suppression of T cell pro-liferation assay.
mRNA analyses
The RT-PCR analysis has been described for b-actin, IL-2, IL-10, and TGF-b previously (21). mRNAwas extracted from different cell populations andanalyzed for the relative expression of CD25 (59-CGAAGCAAGCAAA-CAATTCA-39 and 59-ATGGTGCCAGTGGTAGGAAG-39), CTLA-4 (59-AAATGGGACGCAACTCTACG-39 and 59-CGACAATGGCTGAGATG-ATG-39), LAG-3 (59-CCACTTTGCAGGAGGACACT-39 and 59-GTGA-CAGCACAGCAATACCG-39), IL-2, IL-10, and TGF-b by RT-PCR(iCycler; Bio-Rad) using SyBr green after normalizing for b-actin mRNA.The annealing temperature for analyzing CD25 was 56˚C, CTLA-4 was55˚C, and LAG-3 was 57˚C. Fold change from the reference was calcu-lated (26) as ES (Ct sample)/ER (Ct reference), in which ES and ER are
FIGURE 1. A, Staining of Con A-stimulated thymocytes with anti-
chicken CD25. Thymocytes were stimulated with Con A and IL-2 for 0 or
48 h. CD25+ cells were identified using a fluorescent-linked anti-chicken
CD25 primary mAb. B, Relative amounts of CD25 mRNA in CD42CD252,
CD4+CD252, and CD4+CD25+ cells. Mean 6 SD. n = 4. CD25 mRNA
content was analyzed by RT-PCR after adjusting for b-actin mRNA content.
The CD25 mRNA content was normalized to the mRNA content of the
CD42CD252 group so that all bars represent fold increase or decrease
compared with the CD42CD252 group.
Table I. Distribution of CD4+CD25+ cells in different organs
Organ Percentage
Thymus 3.0 6 0.8Blood 6.9 6 3.3Spleen 11.6 6 3.7Cecal tonsils 15.5 6 10.4Lung 13.4 6 6.9Bone marrow 17.6 6 9.4Bursa ND
CD4+CD25+ cells are expressed as a percentage of CD4+ cells. Values are means6 SD. n = 7.
ND, not detectable.
FIGURE 2. Staining of chicken spleen (A) and thymus (B) with anti-
chicken CD4 and CD25. CD4+CD25+ cells were identified using fluores-
cent-linked anti-chicken CD4 and CD25.
1998 SUPPRESSIVE PROPERTIES OF CHICKEN CD4+CD25+ CELLS
by guest on July 10, 2018http://w
ww
.jimm
unol.org/D
ownloaded from

the sample and reference PCR amplification efficiencies as determinedby LinRegPCR program (27) and Ct is the threshold cycle. The referencegroup was the CD42CD252 group for CD25 mRNA analysis and theCD4+CD252 group for IL-2, IL-10, and TGF-b analyses.
Suppression assay
Suppression of T cell proliferation assay was employed to assess the sup-pressive properties of CD4+CD25+ cells. The suppression of T cell pro-liferation assay is a coculture assay between Tregs (effector cells) and CFSE-labeled naive T cells (responder cells). The suppression of T cell proliferationassay has been described in detail previously (21). Briefly, a coculture assaywas performed by coincubating 5 3 104 CFSE-labeled CD4+CD252 re-sponder cells with either effector (CD4+CD25+) or control (CD4+CD252)cells at an effector/responder cell ratio of either 1:1 or 0:1 in three replications(n = 3). Cells were pooled from at least three different birds to collect enougheffector and responder cells for different assays. The CFSE dilution of CFSE-labeled responder cells was measured at 72 h of coculture after gating onCFSE-stained cells (Guava Eascyte; Millipore) (21). The effect of IL-2supplementation on suppression of proliferation assay was studied by sup-plementing the assay with either 0 or 1:500 dilution of rCIL-2. For thetranswell experiment, the suppression of T cell proliferation assay wasconducted similar to the above procedure except that the effector and re-sponder cells were separated using a transwell (Millicell; Millipore) of 0.4mM size (28). The unproliferated cell percentage in the coculture group wasdetermined after gating on the CFSE-positive responder cells.
Suppressive properties of non-Tregs with transient CD25upregulation
Thymic lymphocytes (1 3 107) were labeled with 10 mg/ml mouse anti-chicken CD25 and 1:200 dilution of unlabeled mouse IgG for 45 min.Thymic CD252 cells were collected by MACS (Miltenyi Biotec, Auburn,CA) negative selection using anti-mouse IgG microbeads following themanufacturer’s instructions. CD252 cells were cultured in RPMI 1640medium supplemented with 5% FBS, 1% penicillin plus streptomycin, 10mg/ml Con A, and 1:500 rCIL-2 in three replications (n = 3). At 5 d ofculture, cells were analyzed for CD25 expression and selected for CD4+
CD25+ cells. CD4+CD25+ cells were analyzed for naive T cell suppressionand mRNA profile as described above.
ResultsCD25 upregulation in proliferating thymocytes and CD25mRNA content of CD25+ cells isolated with anti-chicken CD25
The anti-chicken CD25 mAb produced in the laboratory recog-nized 2% of cells in naive thymocytes and 30% of the cells in ConA-treated groups (Fig. 1A). CD4+CD25+ cells, isolated after stainingwith the anti-chicken CD25, had 21-fold higher CD25 mRNA com-pared with the CD4+CD252 cell population and 84-fold higher CD25mRNA compared with the CD42CD252 cell population (Fig. 1B).
CD4+CD25+ cell numbers in immune organs
The percentage of CD4+CD25+ cells, expressed as a percentage ofCD4+ cells, in thymus and blood was ∼3–7%, in spleen was 10%,and in caecal tonsil, lung, and bone marrow was ∼15% (Table I).No CD4+CD25+ cells were detected in the bursa. Approximately80% of CD25+ cells in the thymus were CD4+CD25+ in the thy-mus (Fig. 2), whereas in every other organ studied, ∼25% ofCD25+ cells were CD4+CD25+ cells.
Proliferation of chicken CD4+CD25+ cells
Chicken thymic CD4+CD25+ cells did not proliferate in vitro inthe absence of rCIL-2 with any of the proliferation stimulationtreatments applied in vitro (Fig. 3). On the contrary, CD4+CD252
cell numbers increased at least until 5 d in the absence of rCIL-2with all of the proliferation stimulation treatments applied in vitro.In the presence of rCIL-2, PMA plus ionomycin- or Con A-stimulated CD4+CD25+ cells proliferated, whereas anti-CD3plus CD28-stimulated CD4+CD25+ cells did not proliferate.There were no significant differences in the viable cell popula-tion among any of the treatment groups until 5 d. The controlgroup with no treatments had negligent live cells in both the CD4+
FIGURE 3. Proliferation of CD4+CD25+ and CD4+CD252 cells in the absence (A) and presence (B) of rCIL-2. Means6 SD. n = 3. All treatment groups
had 25,625 cells on day 0 in 250 ml media. Cells were stimulated with either anti-chicken CD3 plus CD28 at 1:750 dilution or Con A at 10 mg/ml or PMA
(1 mg/ml) plus ionomycin (50 mg/ml) (PI).
Table II. Relative amounts of mRNA in naive and in vitro proliferated CD4+CD25+ cells
Cells IL-10 TGF-b IL-2 CTLA-4 LAG-3
Naive CD4+CD25+ 29.1 6 8.4 15.8 6 5.9 ND 7.8 6 3.5 11.5 6 3.7Naive CD4+CD252 1.0 6 0.1 1.0 6 0.9 1.0 6 0.3 1.0 6 0.2 1.0 6 0.1In vitro proliferated CD4+CD25+ 66.2 6 15.8 8.6 6 5.8 ND 3.6 6 1.4 5.2 6 1.4In vitro proliferated CD4+CD252 2.2 6 1.6 0.1 6 0.1 3.4 6 1.3 0.7 6 0.2 0.7 6 0.3
Values are mean 6 SD. n = 4. mRNA content was analyzed by RT-PCR after adjusting for b-actin mRNA content. AllmRNA contents were normalized to the mRNA content of the CD4+CD252 group so that all bars represent fold increase ordecrease compared with the CD4+CD252 group.
ND, not detectable.
The Journal of Immunology 1999
by guest on July 10, 2018http://w
ww
.jimm
unol.org/D
ownloaded from

CD25+ and CD4+CD252 group at 7d with or without rCIL-2 sup-plementation (data not shown).
mRNA profile of naive and in vitro proliferated chicken CD4+
CD25+ cells
PMA plus ionomycin treatment, in the presence of rCIL-2, in-creased both CD4+CD25+ and CD4+CD252 cell numbers at 5 d ofin vitro stimulation (Fig. 2). Therefore, CD4+CD25+ and CD4+
CD252 cells that were either naive (cells collected at d 0) orstimulated in vitro with PMA–ionomyicin–rCIL-2 for 5 d werecharacterized for IL-10, TGF-b, and IL-2 production (Table II).Naive CD4+CD25+ cells had 29-fold more IL-10 mRNA and 15-fold more TGF-b mRNA than the naive CD4+CD252 cells. Onthe contrary, naive CD4+CD25+ had no detectable IL-2 mRNA,whereas naive CD4+CD252 cells had IL-2 mRNA. Similar to thenaive CD4+CD25+ cells, PMA plus ionomycin-stimulated CD4+
CD25+ cells had higher IL-10 and TGF-b mRNA than the naiveCD4+CD252 cells, which shows that in vitro proliferation doesnot alter the cytokine production profile of CD4+CD25+ cells.Both naive and in vitro proliferated CD4+CD25+ cells had 3–5-fold higher CTLA-4 mRNA and 5–11-fold higher LAG-3 mRNAthan the naive CD4+CD252 cells.
Both naive and in vitro proliferated CD4+CD25+ cellssuppress naive cell proliferation
Both naive and PMA plus ionomycin-stimulated thymic CD4+
CD25+ cells suppressed T cell proliferation, whereas CD4+CD252
cells did not suppress T cell proliferation (Fig. 4). The mean (6SD) total unproliferated cell percentage was 85 6 1% in the naiveCD4+CD25+ group, 73 6 2% in the PMA plus ionomycin-stimulated CD4+CD25+ group, and 21 6 1% in the CD4+
CD252 group. The control group with no effector cells (effector/responder cell ratio of 0:1) had 14 6 3% unproliferated cells. Thetotal numbers (6 SD) of viable responder cells (measured aftergating on CFSE-stained effector cells with flow cytometry) were
16,755 6 1,799 in the naive CD4+CD25+ group, 10,685 6 2,106in the PMA plus ionomycin-stimulated CD4+CD25+ group, and92,3046 8,810 in the CD4+CD252 group. The control group withno effector cells (effector/responder cell ratio of 0:1) had 123,3336 11,273 viable cells.
Naive CD4+CD25+ cell suppressive property is partiallycontact dependent
Naive CD4+CD25+ cells separated from the effector cells usinga transwell did not completely suppress responder cell pro-liferation. The mean unproliferated cells in the responder cellsseparated from the effector cells was 28 6 2% (Fig. 4F).
Naive CD4+CD25+ cell suppressive property is reversed bysupplemental rCIL-2
Supplementing CD4+CD25+ cell coculture with rCIL-2 reversedthe suppressive properties of CD4+CD25+ cells (Fig. 5). TherCIL-2 supplemented group had 21 6 4% unproliferated cells. Onthe contrary, suppressive properties of PMA–ionomycin–rCIL-2grown CD4+CD25+ cells were not completely reversed by sup-plementary rCIL-2. PMA-ionomycin–grown CD4+CD25+ cellshad 46 6 2% unproliferated cells.
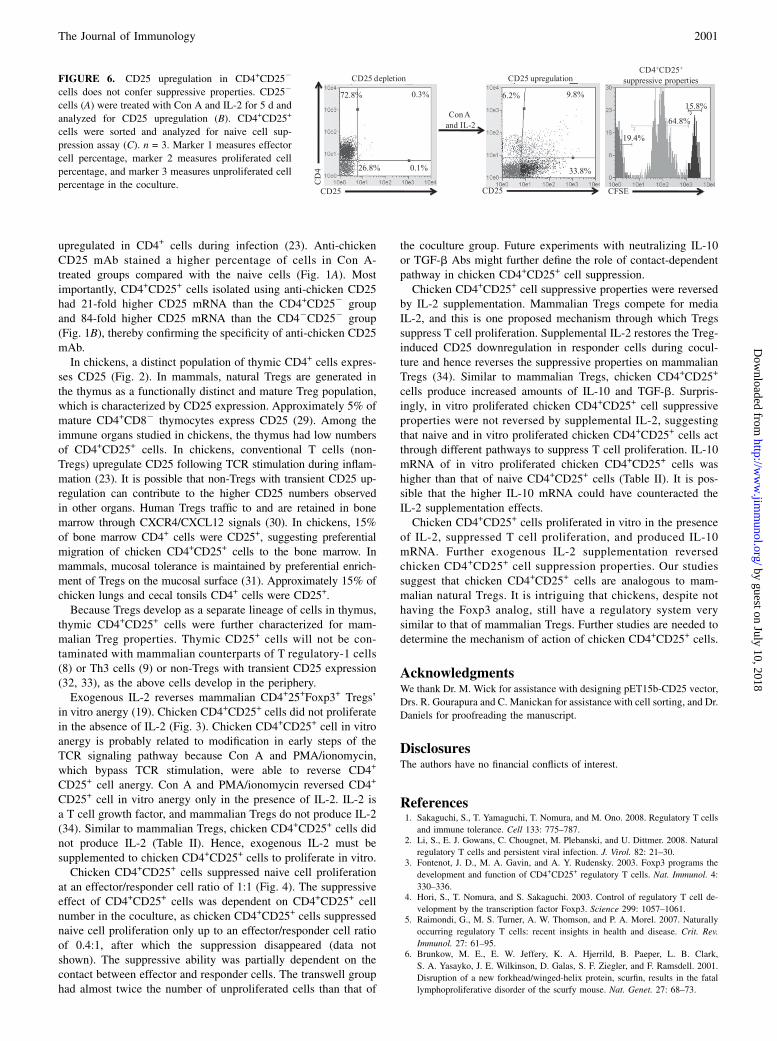
CD25 upregulation in CD4+CD252 cells does not confersuppressive properties
In mammals, T cells (non-Tregs) upregulate CD25 transientlyduring inflammation. The suppressive role of non-Tregs, with tran-sient CD25 gene expression, is debated. The suppressive ability ofCD4+CD252 cells that upregulate CD25 during in vitro TCRstimulation was studied. At 5 d of cell culture, 47% of CD4+ cellswere CD25+ (Fig. 6B). Flow-sorted CD4+CD25+ cells, collectedafter in vitro Con A stimulation, did not show suppressive prop-erties. The group with CD4+ cells with transient CD25 expressionhad 18 6 4% unproliferated cells (Fig. 6C), whereas the naiveCD4+CD25+ group had 85 6 1% unproliferated cells (Fig. 4B).
DiscussionThis article characterizes chicken CD4+CD25+ cells for Treg-suppressive properties. An anti-chicken CD25 mAb was pro-duced in mice and conjugated to a fluorescent tag. In mammals,TCR-stimulated T cells upregulate CD25 in the presence of IL-2.In chicken, CD25 is an activation marker (24), and CD25 are
FIGURE 4. CD4+CD25+ cells suppress naive T cell proliferation. CD4+
CD252 responder cells were labeled with CFSE (A). Suppression of T cell
proliferation assay was conducted by coculturing CD4+CD252 responder
cells with naive CD4+CD25+ cells (B) or PMA plus ionomycin-stimulated
CD4+CD25+ cells (C) or naive CD4+CD252 (D) at an effector/responder
cell ratio of either 1:1 or 0:1 (E). Transwell experiment was conducted by
physical separation of effector and responder cells using a 0.4 mM trans-
well (F). CFSE dilution of CFSE-labeled responder cells was measured at
72 h of coculture after gating on CFSE-stained cells. n = 3. Marker 1
measures effector cell percentage, marker 2 measures proliferated cell
percentage, and marker 3 measures unproliferated cell percentage in the
coculture.
FIGURE 5. rCIL-2 supplementation reverses the suppressive properties
of naive CD4+CD25+ cells but not the PMA plus ionomycin-stimulated
CD4+CD25+ cells. CD4+CD252 responder cells were isolated by flow
sorting and labeled with CFSE. Suppression of T cell proliferation assay
was conducted by coculturing CD4+ responder cells with naive CD4+
CD25+ cells (A) or PMA plus ionomycin-stimulated CD4+CD25+ cells (B)
at an effector/responder cell ratio of 1:1. The coculture was supplemented
with 1:500 dilution of rCIL-2. CFSE dilution of CFSE-labeled responder
cells was measured at 72 h of coculture after gating on CFSE-stained cells.
n = 3. Marker 1 measures effector cell percentage, marker 2 measures
proliferated cell percentage, and marker 3 measures unproliferated cell
percentage in the coculture.
2000 SUPPRESSIVE PROPERTIES OF CHICKEN CD4+CD25+ CELLS
by guest on July 10, 2018http://w
ww
.jimm
unol.org/D
ownloaded from
upregulated in CD4+ cells during infection (23). Anti-chickenCD25 mAb stained a higher percentage of cells in Con A-treated groups compared with the naive cells (Fig. 1A). Mostimportantly, CD4+CD25+ cells isolated using anti-chicken CD25had 21-fold higher CD25 mRNA than the CD4+CD252 groupand 84-fold higher CD25 mRNA than the CD42CD252 group(Fig. 1B), thereby confirming the specificity of anti-chicken CD25mAb.In chickens, a distinct population of thymic CD4+ cells expres-
ses CD25 (Fig. 2). In mammals, natural Tregs are generated inthe thymus as a functionally distinct and mature Treg population,which is characterized by CD25 expression. Approximately 5% ofmature CD4+CD82 thymocytes express CD25 (29). Among theimmune organs studied in chickens, the thymus had low numbersof CD4+CD25+ cells. In chickens, conventional T cells (non-Tregs) upregulate CD25 following TCR stimulation during inflam-mation (23). It is possible that non-Tregs with transient CD25 up-regulation can contribute to the higher CD25 numbers observedin other organs. Human Tregs traffic to and are retained in bonemarrow through CXCR4/CXCL12 signals (30). In chickens, 15%of bone marrow CD4+ cells were CD25+, suggesting preferentialmigration of chicken CD4+CD25+ cells to the bone marrow. Inmammals, mucosal tolerance is maintained by preferential enrich-ment of Tregs on the mucosal surface (31). Approximately 15% ofchicken lungs and cecal tonsils CD4+ cells were CD25+.Because Tregs develop as a separate lineage of cells in thymus,
thymic CD4+CD25+ cells were further characterized for mam-malian Treg properties. Thymic CD25+ cells will not be con-taminated with mammalian counterparts of T regulatory-1 cells(8) or Th3 cells (9) or non-Tregs with transient CD25 expression(32, 33), as the above cells develop in the periphery.Exogenous IL-2 reverses mammalian CD4+25+Foxp3+ Tregs’
in vitro anergy (19). Chicken CD4+CD25+ cells did not proliferatein the absence of IL-2 (Fig. 3). Chicken CD4+CD25+ cell in vitroanergy is probably related to modification in early steps of theTCR signaling pathway because Con A and PMA/ionomycin,which bypass TCR stimulation, were able to reverse CD4+
CD25+ cell anergy. Con A and PMA/ionomycin reversed CD4+
CD25+ cell in vitro anergy only in the presence of IL-2. IL-2 isa T cell growth factor, and mammalian Tregs do not produce IL-2(34). Similar to mammalian Tregs, chicken CD4+CD25+ cells didnot produce IL-2 (Table II). Hence, exogenous IL-2 must besupplemented to chicken CD4+CD25+ cells to proliferate in vitro.Chicken CD4+CD25+ cells suppressed naive cell proliferation
at an effector/responder cell ratio of 1:1 (Fig. 4). The suppressiveeffect of CD4+CD25+ cells was dependent on CD4+CD25+ cellnumber in the coculture, as chicken CD4+CD25+ cells suppressednaive cell proliferation only up to an effector/responder cell ratioof 0.4:1, after which the suppression disappeared (data notshown). The suppressive ability was partially dependent on thecontact between effector and responder cells. The transwell grouphad almost twice the number of unproliferated cells than that of
the coculture group. Future experiments with neutralizing IL-10or TGF-b Abs might further define the role of contact-dependentpathway in chicken CD4+CD25+ cell suppression.Chicken CD4+CD25+ cell suppressive properties were reversed
by IL-2 supplementation. Mammalian Tregs compete for mediaIL-2, and this is one proposed mechanism through which Tregssuppress T cell proliferation. Supplemental IL-2 restores the Treg-induced CD25 downregulation in responder cells during cocul-ture and hence reverses the suppressive properties on mammalianTregs (34). Similar to mammalian Tregs, chicken CD4+CD25+
cells produce increased amounts of IL-10 and TGF-b. Surpris-ingly, in vitro proliferated chicken CD4+CD25+ cell suppressiveproperties were not reversed by supplemental IL-2, suggestingthat naive and in vitro proliferated chicken CD4+CD25+ cells actthrough different pathways to suppress T cell proliferation. IL-10mRNA of in vitro proliferated chicken CD4+CD25+ cells washigher than that of naive CD4+CD25+ cells (Table II). It is pos-sible that the higher IL-10 mRNA could have counteracted theIL-2 supplementation effects.Chicken CD4+CD25+ cells proliferated in vitro in the presence
of IL-2, suppressed T cell proliferation, and produced IL-10mRNA. Further exogenous IL-2 supplementation reversedchicken CD4+CD25+ cell suppression properties. Our studiessuggest that chicken CD4+CD25+ cells are analogous to mam-malian natural Tregs. It is intriguing that chickens, despite nothaving the Foxp3 analog, still have a regulatory system verysimilar to that of mammalian Tregs. Further studies are needed todetermine the mechanism of action of chicken CD4+CD25+ cells.
AcknowledgmentsWe thank Dr. M. Wick for assistance with designing pET15b-CD25 vector,
Drs. R. Gourapura and C. Manickan for assistance with cell sorting, and Dr.
Daniels for proofreading the manuscript.
DisclosuresThe authors have no financial conflicts of interest.
References1. Sakaguchi, S., T. Yamaguchi, T. Nomura, and M. Ono. 2008. Regulatory T cells
and immune tolerance. Cell 133: 775–787.2. Li, S., E. J. Gowans, C. Chougnet, M. Plebanski, and U. Dittmer. 2008. Natural
regulatory T cells and persistent viral infection. J. Virol. 82: 21–30.3. Fontenot, J. D., M. A. Gavin, and A. Y. Rudensky. 2003. Foxp3 programs the
development and function of CD4+CD25+ regulatory T cells. Nat. Immunol. 4:
330–336.4. Hori, S., T. Nomura, and S. Sakaguchi. 2003. Control of regulatory T cell de-
velopment by the transcription factor Foxp3. Science 299: 1057–1061.5. Raimondi, G., M. S. Turner, A. W. Thomson, and P. A. Morel. 2007. Naturally
occurring regulatory T cells: recent insights in health and disease. Crit. Rev.
Immunol. 27: 61–95.6. Brunkow, M. E., E. W. Jeffery, K. A. Hjerrild, B. Paeper, L. B. Clark,
S. A. Yasayko, J. E. Wilkinson, D. Galas, S. F. Ziegler, and F. Ramsdell. 2001.
Disruption of a new forkhead/winged-helix protein, scurfin, results in the fatal
lymphoproliferative disorder of the scurfy mouse. Nat. Genet. 27: 68–73.
FIGURE 6. CD25 upregulation in CD4+CD252
cells does not confer suppressive properties. CD252
cells (A) were treated with Con A and IL-2 for 5 d and
analyzed for CD25 upregulation (B). CD4+CD25+
cells were sorted and analyzed for naive cell sup-
pression assay (C). n = 3. Marker 1 measures effector
cell percentage, marker 2 measures proliferated cell
percentage, and marker 3 measures unproliferated cell
percentage in the coculture.
The Journal of Immunology 2001
by guest on July 10, 2018http://w
ww
.jimm
unol.org/D
ownloaded from

7. Huter, E. N., G. A. Punkosdy, D. D. Glass, L. I. Cheng, J. M. Ward, andE. M. Shevach. 2008. TGF-beta-induced FoxP3+ regulatory T cells rescue scurfymice. Eur. J. Immunol. 38: 1814–1821.
8. Roncarolo, M. G., S. Gregori, M. Battaglia, R. Bacchetta, K. Fleischhauer, andM. K. Levings. 2006. Interleukin-10-secreting type 1 regulatory T cells inrodents and humans. Immunol. Rev. 212: 28–50.
9. Carrier, Y., J. Yuan, V. K. Kuchroo, and H. L. Weiner. 2007. Th3 cells in pe-ripheral tolerance. I. Induction of Foxp3-positive regulatory T cells by Th3 cellsderived from TGF-beta T cell-transgenic mice. J. Immunol. 178: 179–185.
10. Lu, L., and H. Cantor. 2008. Generation and regulation of CD8+ regulatoryT cells. Cell. Mol. Immunol. 5: 401–406.
11. Hoffmann, J. C., N. N. Pawlowski, K. Grollich, C. Loddenkemper, M. Zeitz, andA. A. Kuhl. 2008. Gammadelta T lymphocytes: a new type of regulatory T cellssuppressing murine 2,4,6-trinitrobenzene sulphonic acid (TNBS)-induced colitis.Int. J. Colorectal Dis. 23: 909–920.
12. Smyth, M. J., and D. I. Godfrey. 2000. NKT cells and tumor immunity—a double-edged sword. Nat. Immunol. 1: 459–460.
13. Zhang, Z. X., L. Yang, K. J. Young, B. DuTemple, and L. Zhang. 2000. Iden-tification of a previously unknown antigen-specific regulatory T cell and itsmechanism of suppression. Nat. Med. 6: 782–789.
14. Apostolou, I., A. Sarukhan, L. Klein, and H. von Boehmer. 2002. Origin ofregulatory T cells with known specificity for antigen. Nat. Immunol. 3: 756–763.
15. Dieckmann, D., H. Plottner, S. Berchtold, T. Berger, and G. Schuler. 2001. Exvivo isolation and characterization of CD4+CD25+ T cells with regulatoryproperties from human blood. J. Exp. Med. 193: 1303–1310.
16. Jonuleit, H., E. Schmitt, M. Stassen, A. Tuettenberg, J. Knop, and A. H. Enk.2001. Identification and functional characterization of human CD4+CD25+
T cells with regulatory properties isolated from peripheral blood. J. Exp. Med.193: 1285–1294.
17. Takahashi, T., Y. Kuniyasu, M. Toda, N. Sakaguchi, M. Itoh, M. Iwata,J. Shimizu, and S. Sakaguchi. 1998. Immunologic self-tolerance maintained byCD4+CD25+ naturally anergic and suppressive T cells: induction of autoimmunedisease by breaking their anergic/suppressive state. Int. Immunol. 10: 1969–1980.
18. Thornton, A. M., and E. M. Shevach. 2000. Suppressor effector function ofCD4+CD25+ immunoregulatory T cells is antigen nonspecific. J. Immunol. 164:183–190.
19. Thornton, A. M., and E. M. Shevach. 1998. CD4+CD25+ immunoregulatoryT cells suppress polyclonal T cell activation in vitro by inhibiting interleukin 2production. J. Exp. Med. 188: 287–296.
20. Shack, L. A., J. J. Buza, and S. C. Burgess. 2008. The neoplastically transformed(CD30hi) Marek’s disease lymphoma cell phenotype most closely resembles T-regulatory cells. Cancer Immunol. Immunother. 57: 1253–1262.
21. Shanmugasundaram, R., and R. K. Selvaraj. 2010. In vitro human TGF-betatreatment converts CD4+CD252 T cells into induced T regulatory like cells.Vet. Immunol. Immunopathol. 137: 161–165.
22. Workman, C. J., A. L. Szymczak-Workman, L. W. Collison, M. R. Pillai, andD. A. Vignali. 2009. The development and function of regulatory T cells. Cell.Mol. Life Sci. 66: 2603–2622.
23. Teng, Q.-Y., J.-Y. Zhou, J.-J. Wu, J.-Q. Guo, and H.-G. Shen. 2006. Character-ization of chicken interleukin 2 receptor alpha chain, a homolog to mammalianCD25. FEBS Lett. 580: 4274–4281.
24. Hala, K., K. Schauenstein, N. Neu, G. Kromer, H. Wolf, G. Bock, and G. Wick.1986. A monoclonal antibody reacting with a membrane determinant expressedon activated chicken T lymphocytes. Eur. J. Immunol. 16: 1331–1336.
25. Kogut, M., L. Rothwell, and P. Kaiser. 2002. Differential effects of age onchicken heterophil functional activation by recombinant chicken interleukin-2.Dev. Comp. Immunol. 26: 817–830.
26. Humphrey, B. D., C. B. Stephensen, C. C. Calvert, and K. C. Klasing. 2004.Glucose and cationic amino acid transporter expression in growing chickens(Gallus gallus domesticus). Comp. Biochem. Physiol. A Mol. Integr. Physiol.138: 515–525.
27. Ramakers, C., J. M. Ruijter, R. H. Deprez, and A. F. Moorman. 2003.Assumption-free analysis of quantitative real-time polymerase chain reaction(PCR) data. Neurosci. Lett. 339: 62–66.
28. Jonuleit, H., E. Schmitt, H. Kakirman, M. Stassen, J. Knop, and A. H. Enk. 2002.Infectious tolerance: human CD25(+) regulatory T cells convey suppressor ac-tivity to conventional CD4+ T helper cells. J. Exp. Med. 196: 255–260.
29. Sakaguchi, S. 2005. Naturally arising Foxp3-expressing CD25+ CD4+ regulatoryT cells in immunological tolerance to self and non-self. Nat. Immunol. 6: 345–352.
30. Zou, L., B. Barnett, H. Safah, V. F. Larussa, M. Evdemon-Hogan, P. Mottram,S. Wei, O. David, T. J. Curiel, and W. Zou. 2004. Bone marrow is a reservoir forCD4+CD25+ regulatory T cells that traffic through CXCL12/CXCR4 signals.Cancer Res. 64: 8451–8455.
31. Izcue, A., J. L. Coombes, and F. Powrie. 2006. Regulatory T cells suppresssystemic and mucosal immune activation to control intestinal inflammation.Immunol. Rev. 212: 256–271.
32. Liu, Z., Y. Fang, X. Wang, P. Wang, P. Yun, and H. Xu. 2008. Upregulation ofmolecules associated with T-regulatory function by thymoglobulin pretreatmentof human CD4+ cells. Transplantation 86: 1419–1426.
33. Pillai, V., S. B. Ortega, C. K. Wang, and N. J. Karandikar. 2007. Transientregulatory T-cells: a state attained by all activated human T-cells. Clin. Immunol.123: 18–29.
34. Scheffold, A., J. Huhn, and T. Hofer. 2005. Regulation of CD4+ regulatory T cellactivity: it takes (IL-)two to tango. Eur. J. Immunol. 35: 1336–1341.
2002 SUPPRESSIVE PROPERTIES OF CHICKEN CD4+CD25+ CELLS
by guest on July 10, 2018http://w
ww
.jimm
unol.org/D
ownloaded from