revealing the challenges in sustaining payment card … · revealing the challenges in . sustaining...
TRANSCRIPT
2017 Payment Security ReportRevealing the challenges in sustaining payment card security

2017 Payment Security Report
ii
In 2016, for the first time, more than half (55.4%) of organizations were fully PCI DSS (see below) compliant at interim validation—compared with 48.4% in 2015. Full compliance has increased almost five-fold compared to our analysis of 2012 assessments.
Despite this general improvement, the control gap of companies failing their interim assessment has actually grown worse. In 2015, companies failing their interim assessment had an average of 12.4% of controls not in place (6.8% across all companies). In 2016, this increased to 13.0% (5.8%).
Many of the security controls that were not in place cover fundamental security principles that have broad applicability. Their absence could be material to the likelihood of an organization suffering a data breach. Indeed, no organization affected by payment card data breaches was found to be in full compliance with the PCI DSS during a subsequent Verizon PCI forensic investigator (PFI) inquiry.
This report delves into the detail of payment security and PCI DSS compliance and analyzes compliance patterns and control failures from global, regional, and industry perspectives. It’s the only major industry publication based on data from real compliance validation assessments.
The inclusion of insights from our Data Breach Investigations Report (DBIR) specific to companies that have suffered from payment card data breaches makes this report a unique resource for compliance professionals.
2017 Payment Security Report
What is PCI DSS?
The Payment Card Industry Data Security Standard (PCI DSS) was set up by the leading card brands to help businesses that take card payments reduce fraud. While it’s focused on protecting card data, it’s built on solid security principles that apply to all kinds of data. It covers vital topics like retention policies, encryption, physical security, authentication and access control.
Find out more: PCISecurityStandards.org

Contents
1
ContentsCommentary
Payment security innovation ............................................... 2
Mobile payments ........................................................................................... 2
EMV .....................................................................................................................4
P2PE .................................................................................................................... 5
Compliance effectiveness .................................................... 6
Break the chain and prevent the breach ........................... 8
The lifecycle of PCI DSS controls ..................................... 10
How to improve effectiveness ............................................12
Analysis
The state of PCI DSS compliance .................................... 14
Compliance trends ............................................................... 16
Trends by industry sector ................................................... 19
Trends in financial services .................................................................... 19
Trends in hospitality ..................................................................................20
Trends in IT services ................................................................................. 21
Trends in retail ............................................................................................. 22
Breakdown by key requirement ........................................23
1. Install and maintain a firewall configuration .............................. 24
2. Do not use vendor-supplied defaults .......................................... 26
3. Protect stored cardholder data ..................................................... 28
4. Protect data in transit .........................................................................30
5. Protect against malicious software .............................................. 32
6. Develop and maintain secure systems ....................................... 34
7. Restrict access ....................................................................................... 36
8. Authenticate access ............................................................................ 38
9. Control physical access.....................................................................40
10. Track and monitor access .............................................................. 42
11. Test security systems and processes ....................................... 44
12. Maintain information security policy ..........................................46
Bottom 20 lists ..................................................................... 48
Appendices
A: Data breach comparison ............................................... 50
B: Security of mobile payments ........................................53
C: Compliance calendar ......................................................54
D: Methodology ......................................................................56
Verizon Security professional services ..........................57
Definitions used throughout this report
Full compliance: The share of companies achieving 100% PCI DSS compliance at interim validation. All companies studied had passed a previous validation assessment, so this indicates how well they managed to sustain compliance.
Better >< Worse
Control gap: The number of failed controls divided by the total number of controls expected. This is an average figure that gives a measure of how far the assessed companies were from full compliance. This is shown right-to-left for clarity.
Better >< Worse
Compensating control: This percentage indicates how many companies used one or more compensating controls for the specified section of the DSS. It’s not how many compensating controls were used.
More >< Less
Full compliance (post-breach): The percentage of companies found to be fully compliant by a PCI forensic investigator (PFI) during a post-breach inquiry.
Better >< Worse

Payment security innovation
2
Payment security innovationMobile payments
The uptake of mobile as a payment device by both merchants and consumers has been steadily rising. As consumers, we can choose to turn our phone into a payment token—so that it operates just the same as a debit or credit card—and we can ping money to whomever we want using an email address or a telephone number.
From a payments perspective, mobile has the potential to revolutionize the way payments are authenticated. The capabilities of the devices themselves can be used to provide multi-factor authentication, including biometrics, soft-token-generating applications (like Google Authenticator), and token receipt via SMS. Further, meta data about the device (IMEI—International Mobile Equipment Identity) and the location (via geolocation) can also be harnessed to provide greater assurance that the transaction is legitimate. Other benefits that can be achieved through mobile payment technology include:
• Better device authentication (cards registered to devices use identifiers unique to each device).
• More variables for context-specific access control (e.g. geofencing, beacons, cell-tower triangulation).
• Rapid reissuance of cards following a breach, minimizing user inconvenience.
Adoption
Charity donations and service charges can be made via carrier networks, and we can NFC (near-field communication) our way across major cities without touching a payment card. In emerging markets, mobile is offering banking opportunities to communities that previously had no access to bank facilities. M-PESA—a banking and payment service based on SMS messaging—is revolutionizing life in India and Africa, and BBM Money is offering a similar service across Indonesia.
Mobile commerce (m-commerce) has been a huge growth area, with mobile devices being used for a growing number of transactions. Mobile is penetrating face-to-face transactions too. With shipments forecast to hit 10.6 million in 2021, mobile point of sale (mPOS) devices are set to make up 28% of all POS terminals in circulation1.
mPOS has been a boon for small merchants and emerging markets, where it has lowered the barriers to entry for small merchants that want to accept payment cards.
Mobile devices are notoriously vulnerable to common coding weaknesses and have become an increasing target for malware attacks. They are also subject to theft, with many estimates putting the number stolen each year in the millions.
Multi-factor authentication (MFA) is perhaps one of the best personal security measures we can adopt as individuals for our own security, just as much as the payments industry would benefit from the potential it offers in identification and authorization for transactions. Sadly, many users find MFA cumbersome and inconvenient to use. As long as they do not have to accept responsibility for any fraud conducted against their bank accounts, this situation is unlikely to change.
Convenience is the single most significant benefit our beloved mobile devices give us. Mobile has become such an embedded part of our lives that many public facilities—from shopping malls to theme parks—offer free wireless access. Public Wi-Fi—for all its lovely slick internet-ness—can be a poisoned chalice. A huge proportion of public Wi-Fi networks are insecure, allowing anyone with even the smallest bit of know-how to intercept our transmissions.
Perhaps one of the biggest challenges presented by mobile is that despite all the concerns from within the security industry, these qualms are not shared by the general public. Many mobile device users regularly connect to public Wi-Fi networks, and often only use simple PIN protection to lock their phones—if anything at all.
Even if patches exist, many devices are never updated by the operators, or are too old to be updated but are used nonetheless. Stagefright, a remote code execution vulnerability in Android that exploited the multimedia playback engine, didn’t need any user interaction with the device to be exploited; all an attacker needed was a phone number2. Man-in-the-middle attacks are still possible, despite multi-factor authentication (e.g. if an attacker impersonates a website and forwards user-submitted credentials (user ID, password and multi-factor token) to the user’s intended website).
Mobile devices as payment terminals
Within the US retail space, Verizon’s qualified security assessors (QSAs) have found more merchants are looking to their existing mobile devices to provide additional payment services using “sleds” from payment device manufacturers that slide over the mobile device. Ideally, those sleds offer point-to-point encryption (P2PE) and their own Wi-Fi connections, EMV (made up of the name of its founders: Europay, MasterCard and Visa) and NFC options, and keypads (for connections to acquirers and for manual card entry that is distinct from the mobile platform). When the payment sleds are not P2PE-validated, do not offer Wi-Fi, EMV, NFC or keypad capabilities, and the mobile device platform and its utilities are used to receive and transmit payments, the scope of a PCI DSS assessment increases significantly.

Payment security innovation
3
Improving security and compliance
For merchants seeking to deploy mobile payment solutions, Verizon encourages:
• Using multi-factor authentication and strong passphrases, to prevent unauthorized access to mobile devices. (This element becomes more important when NFC payment credentials are registered on the device.)
• Authenticating, authorizing and logging activity for each entity involved in the transaction pathway.
• Maintaining the Confidentiality-Integrity-Availability triad for payment messages (payloads) and transmission pathways.
• Verifying the encryption status—including algorithm, key strength and rotation—of transmissions.
• Using chain of custody and geofencing to prevent or resolve physical theft of devices.
• From a merchant application perspective, combining multi-factor authentication with geolocation and transactional velocity to detect fraudulent transactions before they are accepted.
Undoubtedly, the best way to protect payment card data on mobile devices is by first encrypting it with a P2PE solution (wherein the decryption keys are not accessible by the mobile device). A number of solutions cater to this security measure, but not all of them are validated as P2PE devices by the PCI SSC (and are therefore not automatically permitted for scope reduction), but many of them have wide adoption, nonetheless.
In a scenario in which a PCI-validated P2PE solution is not used, and scope reduction is not agreed by the QSA and the acquirer, all PCI DSS Requirements will apply. Of the 12 controls in the DSS, the following Requirements tend to be the most difficult for mobile, non-Windows platforms to meet (thus resulting in rather creative compensating controls):
• Requirement 5—Anti-virus (due to the difficulty in administering signature updates and regular device scans).
• Requirement 10—Logging and time synchronization.
• Requirement 11—Internal vulnerability scanning, penetration testing and file integrity (or change-detection) monitoring.
See Appendix B (page 53) on the security of mobile payments for more detail.
Undoubtedly, the best way to protect payment card data on mobile devices is by first encrypting it with a P2PE solution.
It’s only a matter of time
While the general consensus is that mobile presents an attractive target to attackers, so far there’s little evidence of significant mobile-based attacks. Over the last four years the Verizon Data Breach Investigations Report (DBIR) team has analyzed thousands of data breaches, and mobile was not identified as a root cause in a single one3. Mobile devices are affected by malware, but the vast majority of that is adware and relatively innocuous. Of the tens of millions of devices on the Verizon network, the 2015 DBIR reported that only 0.03% of these were infected with truly malicious exploits3. But there is no room for complacency. In ISACA’s Mobile Payments Security Survey, 87% of security professionals said they anticipated an increase in mobile payment data breaches during 20164.

Payment security innovation
4
EMV
The introduction of EMV has significantly reduced the success rate of counterfeit fraud. It’s a deterrent control, making it best suited to maintain the integrity of cardholder data outside of, and before it enters, a merchant’s environment. Alone, it cannot secure or prevent the theft of cardholder data within an organization. Because it has no impact on its security, EMV cannot, for instance, offer any level of scope reduction to merchants. For this level of preventative control, technologies such as P2PE and tokenization are better suited.
3D SecureEMV
Increases payment security
Makes it harder to
use stolen cards
Protects online
transactions
Protects in-person
transactions
Additional verification step
increases security of transaction
Increases the security of
cardholder data
Improves cardholder verification
Makes it harder to
clone EMV chip cards
PCI DSS
Fig 1. How PCI DSS, EMV and 3D Secure improve payment security
Adoption
Most major European nations moved to EMV during the early 2000s. They actually went a step further in their implementation and replaced signatures with PINs, whereas the US went with chip and signature as a more familiar approach to minimize consumer disruption. However, the use of PINs is arguably more secure, as signatures can be easily copied.
Many large retailers—including Walmart, Target and Costco—have upgraded their terminals and are activating them for chip payments, but lots of smaller retailers have not. Even in locations where chip payments are accepted, only 40% of consumers use this method, with 60% unsure about the new technology5.
When weighing the costs and benefits of EMV, many US merchants found the increased chargeback liability insufficient incentive to migrate—especially when it could introduce delays at the checkout, threatening sales. Faster protocols are emerging, but not universally adopted yet.
Effectiveness
EMV is not a panacea for all card fraud. In the countries where it’s been introduced, it has shifted fraud onto card-not-present (CNP) transactions—such as telephone, mail order and online.
To combat e-commerce fraud, 3D Secure was created as an additional layer of authentication for CNP transactions. There are varying iterations of 3D Secure, from basic to more enhanced versions. The enhanced 3D Secure offerings provide multi-layered protection. Cardholders are enrolled in the service automatically, making it an invisible and seamless experience. Looking at Europe’s experience, the UK Cards Association reported a one-third drop in CNP fraud between 2007 and 2015 due to increased use of fraud screening tools and 3D Secure6.
The costs of implementing EMV in a modern, technology-driven environment eventually have to result in benefits sufficient to cover the fraud costs that migrate to CNP channels, as well as the costs of migration. If this equation doesn’t net positive results, little incentive exists for the adoption of EMV.
The cost of EMV terminals has decreased as manufacturers have ramped up production volumes and are competing for market share, but is still a significant expense. But as cards and terminals go through their normal replacement cycle, EMV-ready versions are becoming the most prevalent.
Why the US is finally moving to EMV
Sharply rising counterfeit card fraud was a key reason why the business case finally began to work for US issuers. Following early EMV adoption, fraud began to fall.
Other contributing factors include the increasing difficulty of using magnetic stripe cards overseas, the desire to accelerate the upgrading of the US terminal infrastructure to NFC-based mobile payments technology, and the decreasing cost of chips and terminals.

Payment security innovation
5
P2PE
P2PE involves the encryption of card data within the payment terminal. It remains encrypted until it reaches the payment processor, or other designated endpoint. This means that any data intercepted within the merchant’s environment is useless. Decryption only happens within a controlled environment.
EMV does not remove the need for P2PE or tokenization.
Implemented correctly, P2PE can enable merchants to remove some payment card data from the scope of their own PCI DSS compliance. The primary determinants are:
• Keys must be protected in hardened payment terminals.
• Decryption keys must be protected in systems not accessible by the environment that performs the encryption: third-party payment processors, third-party P2PE providers, or even managed by the merchant itself.
Tokenization is another approach that can remove card data from a payment transaction. Payment tokens are presented and used instead of the true card data to complete a transaction.
These solutions take over where EMV leaves off. EMV protects the card data while it’s in possession of the cardholder; PCI DSS, PCI PA-DSS, PCI P2PE and tokenization protect it throughout the payment lifecycle.
P2PE and tokenization benefit many parties:
• Merchants profit from a reduction in PCI compliance costs (in most implementations) and the reduced likelihood of reputation- and revenue-damaging data breaches.
• Issuing banks and card brands benefit from reduced cardholder data fraud.
• Acquirers benefit from new P2PE and tokenization-service revenue streams, as well as reduced risk portfolios, in their mandated reporting to the card brands.
Adoption
More merchants are turning to P2PE vendors and either acquirer-issued tokens or third-party tokenization vendors. But, until recently, the number of PCI-validated P2PE vendors has not kept pace. At the time of writing, 37 such solutions are listed on the PCI SSC website; notably absent from them are some of the most popular—and often bank-endorsed—offerings.
While for years it was uncertain whether the major players in the P2PE market would yield to the rigors of P2PE validation assessments, or the P2PE standard would be revised to make attaining compliance more achievable, today accommodation appears to coming from both sides: Over the past year, the number of P2PE solutions listed on the PCI SSC website has increased 54%. At the same time the PCI SSC has promoted validating components of a P2PE solution, should complete validation not be possible.
The reason for the discrepancy is the perceived difficulty in meeting the P2PE standard issued by the PCI SSC. The fact that the retail industry needed a solution like P2PE before the PCI SSC caught up with how to make the market offerings adhere to a sanctioned level of compliance is an interesting case of security leading compliance.
Among the players wrestling with some of the resulting tension are:
• Acquirers, which often sold the non-PCI-validated P2PE/tokenization solution.
• Merchants, which bought the solution thinking it guaranteed a reduction in PCI compliance scope.
• The PCI SSC, which officially only permits scope reduction using solutions validated against its standards.
• QSAs, who are trying to verify the scope and compliance of merchant environments.
In November 2016, the PCI SSC issued guidance to assist security assessors in evaluating non-listed account data encryption solutions and their impact on merchants’ PCI DSS compliance7.
To ease the impasse and facilitate dialogue, the PCI SSC has created the non-listed encryption solution assessment (NESA), informal documentation that a non-validated solution provider may engage a P2PE QSA to complete. The results of these unofficial assessments can be used to inform scope reduction recommendations. A QSA might make such a recommendation to an acquirer, and that acquirer might use the results of the NESA to evaluate risk across its entire base of merchants.
Encryption versus tokenization
Both encryption and tokenization transform cardholder data. Encryption does it with an algorithm, and it’s the encryption and decryption keys that must be protected. In tokenization, the transformation is carried out using a database table and randomization, and it’s the database table that must be protected.
Compliance effectiveness
6
Compliance effectivenessDebating effectiveness
How effective PCI security standards are in protecting businesses and consumers against data compromises is an ongoing debate. This is especially true after the disclosure of data breaches involving the large-scale compromise of payment card data, where it is typical for organizations to claim that they did what they believed was required to protect sensitive data.
According to the Verizon Threat Research Advisory Center (VTRAC)—the team that compiles the DBIR—none of the organizations that experienced a data breach had all applicable PCI DSS controls in place at the time of the breach. Every organization had multiple PCI DSS Key Requirements not in place—including controls that were material to the breach.
Without an explicit need to test the resilience and effectiveness of their PCI DSS controls, many organizations are taking a “fire and forget” approach to control implementation. Control effectiveness is not a primary concern in their standard compliance operations and data protection programs.
Hence, some organizations question whether the PCI DSS is adequate to protect cardholder data. It’s not just the controls in the PCI DSS themselves, but the approach taken to implement them, that determines their effectiveness. Perhaps this needs a more explicit clarification in future versions of the standard—particularly since many organizations do not have the skills to problem-solve that on their own.
Security can only be achieved through designing controls well, monitoring them to verify they are operating effectively at all times, and modifying them if they are not. The most successful organizations rely on intelligent control systems that are actively measuring and managing the effectiveness of implemented controls. These organizations continue to add controls (beyond the PCI DSS) to achieve a resilient and sustainable control environment that can also address future risk.
Version 3.2 of the PCI DSS was released in April 2016. This focused on helping organizations keep critical data security controls in place throughout the year and testing them effectively as part of the ongoing security monitoring process8. But it didn’t include explicit recommendations on how organizations should achieve control effectiveness. Since PCI DSS 3.0, the standard has included a section on “Best Practices for Implementing PCI DSS into Business-as-Usual Processes” with recommendations for monitoring the effectiveness of security controls and the cause of control failure.
A slow evolution
In November 2012, the PCI SSC released the “Information Supplement: PCI DSS Risk Assessment Guidelines” that provides guidance for executing risk assessments. While a good start—it included cursory recommendations on risks and control effectiveness—it did not explicitly cover control risk.
Our research shows that nearly half (44.6%) of companies fall out of PCI DSS compliance within nine months of validation.
In August 2014, the PCI SSC released an “Information Supplement: Best Practices for Maintaining PCI DSS Compliance”. It provides best practices for maintaining compliance with PCI DSS after an organization has already undergone an initial PCI DSS assessment and successfully achieved compliance. It includes detailed recommendations on a range of measures that can be used to monitor whether program-level and system-level security controls are implemented correctly, operating as intended, and meeting the desired outcome9.
Over the last three years, the DSS has been updated more frequently than ever before.
Early PCI DSS versions did not define an integrated “risk-based approach” for control evaluation—at least in part because there is a lack of consistency in the application of risk management across the industry.
A discussion about control systems is critical to the future evolution of the PCI DSS and giving the standard even more credibility among security practitioners. That’s why we’re spotlighting control effectiveness.
Without continuous monitoring, maintenance and improvement, the effectiveness of the control will eventually shrink.
For a control system to be effective, controls must be resource-efficient and budget-friendly, and should be reviewed periodically. They should also be able to react to changing business priorities and threats. In a PCI DSS context, this requires procedures to promote understanding of risk exposure, putting controls in place to address those risks, and effectively pursuing the cardholder data protection objectives. These include effective and efficient processes, reliable data protection and compliance reporting, and compliance with policies, regulations and applicable laws.

Compliance effectiveness
7
The likelihood of control failure (control risk) can be determined by frequently monitoring the inherent risk x residual risk x detection risk of each control.
Considering the global reach of the standard across various industries, and the range of businesses to which it applies—from small to very large—introducing an organization-led risk-based approach would be a challenge. It would need to be carefully managed to avoid being susceptible to the following failings:
• Many organizations wouldn’t know how to objectively perform risk management; it may require skills beyond their capabilities.
• Organizations may fail to define an appropriate risk level (the amount of risk they find acceptable), have too high a risk tolerance (the maximum amount of risk they accept) or may be inconsistent with how they apply their acceptable risk level to risk decisions.
• Organizations might decide, based on their risk assessment (which often is more perception than the result of actual measurements), that some PCI DSS controls are not needed.
Industry awareness that risk management is integral to data protection and compliance has increased. While other international standards provide firm guidance on suitable risk management methodologies, the PCI DSS does not explicitly integrate such requirements into the standard. The PCI DSS would benefit from introducing stronger requirements for the deployment and operation of controls, to include the need to actively measure control effectiveness, constraints and efficiency. At present, the evaluation of control risk is only partially addressed within the compensating control worksheets.
For an organization to be compliant, PCI DSS controls (and additional controls) must be implemented, regardless of any perceived lack of risk.
Control failures and data breaches
Version 1.0 PCI DSS was released by Visa US in December 2004. Between then and 2014, the number of large-scale data breaches grew significantly. This led many, including the media, to ask why compliant organizations were still being breached.
The answer lies in the failure to understand the nature of control effectiveness and a tendency to underestimate the importance of control resilience across industry verticals—which we exposed in the 2014 and 2015 Verizon PCI Compliance reports.
For any PCI DSS “compliant” organization to suffer a payment card data breach, some controls must have failed allowing the security perimeter to be breached, and other controls failed permitting the data to be exfiltrated.
Not all control failures result in data breaches. Data breaches can happen either because controls aren’t in place (missing) or because the controls weren’t used or maintained. Sometimes other controls may prevent unauthorized disclosure; or you might just be lucky.
When a breach occurs, organizations often focus on investigating the failure of entry-point controls. They rarely dig into underlying failures in risk management, control lifecycle and effective control management—and if they do, they rarely share their findings.
Practitioners would benefit from additional guidance on how to assess control effectiveness and implement intelligent control management.
Any framework to assess control effectiveness must be dynamic. It must explain control concepts, methods for defining controls, control lifecycles, control systems and control environments. It must also require risk-to-control mapping and deliberate cause-and-effect evaluation as part of a control lifecycle process.
The PCI SSC published the “Designated Entities Supplemental Validation” (DESV) in June 2015, and later included it in PCI DSS 3.2 as Appendix A3. It includes requirements specifically intended to monitor effectiveness of security controls and minimize risk of control failure; e.g. Requirement A3.3 Validate PCI DSS is incorporated into business-as-usual (BAU) activities. PCI DSS 3.2 also includes requirements for service providers based on DESV, including control 10.8 (Implement a process for the timely detection and reporting of failures of critical security control systems).
Controls should address measured risk by design, not be implemented just to meet compliance requirements.
Break the chain and prevent the breach
8
Break the chain and prevent the breachThe need for active control effectiveness monitoring
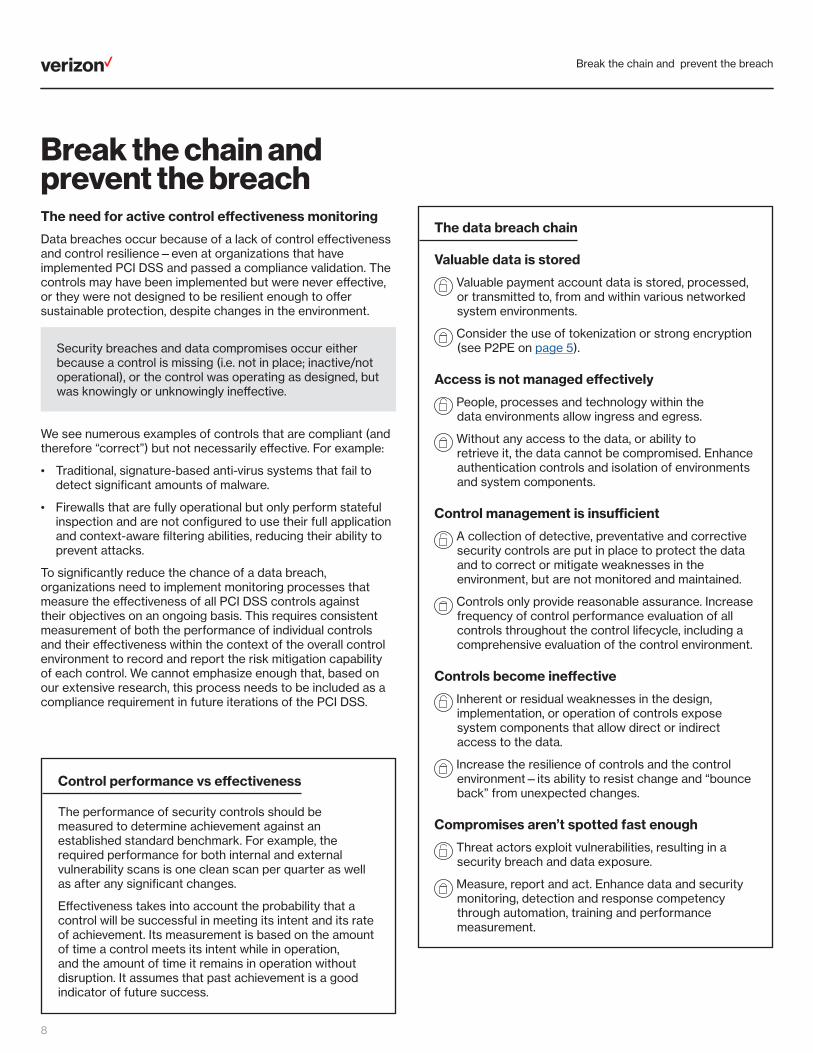
Data breaches occur because of a lack of control effectiveness and control resilience—even at organizations that have implemented PCI DSS and passed a compliance validation. The controls may have been implemented but were never effective, or they were not designed to be resilient enough to offer sustainable protection, despite changes in the environment.
We see numerous examples of controls that are compliant (and therefore “correct”) but not necessarily effective. For example:
• Traditional, signature-based anti-virus systems that fail to detect significant amounts of malware.
• Firewalls that are fully operational but only perform stateful inspection and are not configured to use their full application and context-aware filtering abilities, reducing their ability to prevent attacks.
To significantly reduce the chance of a data breach, organizations need to implement monitoring processes that measure the effectiveness of all PCI DSS controls against their objectives on an ongoing basis. This requires consistent measurement of both the performance of individual controls and their effectiveness within the context of the overall control environment to record and report the risk mitigation capability of each control. We cannot emphasize enough that, based on our extensive research, this process needs to be included as a compliance requirement in future iterations of the PCI DSS.
The data breach chain
Valuable data is stored
Valuable payment account data is stored, processed, or transmitted to, from and within various networked system environments.
Consider the use of tokenization or strong encryption (see P2PE on page 5).
Access is not managed effectively
People, processes and technology within the data environments allow ingress and egress.
Without any access to the data, or ability to retrieve it, the data cannot be compromised. Enhance authentication controls and isolation of environments and system components.
Control management is insufficient
A collection of detective, preventative and corrective security controls are put in place to protect the data and to correct or mitigate weaknesses in the environment, but are not monitored and maintained.
Controls only provide reasonable assurance. Increase frequency of control performance evaluation of all controls throughout the control lifecycle, including a comprehensive evaluation of the control environment.
Controls become ineffective
Inherent or residual weaknesses in the design, implementation, or operation of controls expose system components that allow direct or indirect access to the data.
Increase the resilience of controls and the control environment—its ability to resist change and “bounce back” from unexpected changes.
Compromises aren’t spotted fast enough
Threat actors exploit vulnerabilities, resulting in a security breach and data exposure.
Measure, report and act. Enhance data and security monitoring, detection and response competency through automation, training and performance measurement.
Security breaches and data compromises occur either because a control is missing (i.e. not in place; inactive/not operational), or the control was operating as designed, but was knowingly or unknowingly ineffective.
Control performance vs effectiveness
The performance of security controls should be measured to determine achievement against an established standard benchmark. For example, the required performance for both internal and external vulnerability scans is one clean scan per quarter as well as after any significant changes.
Effectiveness takes into account the probability that a control will be successful in meeting its intent and its rate of achievement. Its measurement is based on the amount of time a control meets its intent while in operation, and the amount of time it remains in operation without disruption. It assumes that past achievement is a good indicator of future success.
Break the chain and prevent the breach
9
Control correctness and effectiveness
PCI DSS controls should be designed and implemented to mitigate risk to account data as well as risks to the supporting system components in, and connected to, the cardholder data environment (CDE). The PCI DSS is made up predominantly of preventative controls and a number of detective and directive controls. However, it’s inevitable that the risk environment will change, and controls will eventually fail. The detective controls currently included in the PCI DSS, such as running vulnerability scans, can be strengthened with additional corrective controls and comprehensive mechanisms that can identify where corrective controls are required.
Independent compliance validations (which are different from security validations) follow a set of prescribed testing procedures conducted in a limited time. They offer a limited and non-exhaustive verification of security controls, mainly determining whether controls are “correctly” implemented.
Effective controls, however, need to meet a resilience standard when carrying out their intended functions. They need to withstand environmental changes in system operations as well as attacks. Thus, many controls may satisfy correctness criteria (compliance), but fail to meet effectiveness criteria (actual security), particularly under unanticipated conditions.
In addition, while conducting their own internal compliance validations, organizations will often deem controls to be effective merely by their presence but fail to determine whether they are performing as expected, and at all times. Ultimately, an evaluation of the correctness and effectiveness of a control should be done through direct measurement and reasoning, which will involve an assessment of control design, installation, operation and performance, as well as evaluation of residual risk and control risk.
Control systems
Requirements for control-lifecycle management and performance monitoring don’t get the attention we believe they deserve in PCI SSC program documentation. Several characteristics of “control systems” are recommended or strongly implied within the “Best Practices for Maintaining PCI DSS Compliance” information supplement, but the concept is not explicitly defined in the PCI DSS.
During PCI DSS compliance assessments, we often see familiar weaknesses, including (relevant DSS controls):
• Lack of formalization of the management control system: not assigning resources with defined roles and responsibilities, or implementing and maintaining processes backed by policies and procedures and technology (Control 12.4).
• Lack of security awareness training/frequent reinforcement of data protection and compliance goals (Controls 12.5, 12.6).
• Failure to verify that managers and employees understand their responsibilities and have been provided with the means and support they need to fulfill them (Controls 1.5, 2.5, 3.7 etc.).
• Control system designs that cannot adjust to changes in the business and/or data protection environment.
• Absence of mechanisms for measuring and reporting performance that cover all critical data protection and compliance performance metrics, leading to a failure to communicate the results of data protection and compliance actions across the organization.
Any of these behaviors can weaken the compliance environment and increase the risk of data being compromised.
Data protection cannot be achieved solely by making small, incremental improvements based on the PCI DSS, which is just a general-purpose set of baseline controls. Controls operate within a structure (framework) managed by a system of policies and procedures (a control system). A control system must be designed; it will not create itself. It has success factors, such as:
• Acceptance: Employee involvement in the design and maintenance of controls has been found to increase acceptance and adherence.
• Accuracy: Metrics from control systems must be accurate and should be useful, reliable, repeatable and consistent.
• Comprehensibility: Controls must be simple and easy to understand, operate and maintain.
• Integration: Controls must work in accordance with procedures without creating unnecessary effort, operational delays or bottlenecks.
The effectiveness with which security controls are managed at each step of their lifecycle determines the likelihood of control risk creating exposure and potential data breach.
Understanding the various key processes, stakeholders and relationships is important in the development of a successful and sustainable compliance program.
Data should always be protected by layers of security. Breaches occur due to the absence or failure of multiple security controls. Controls fail due to weaknesses in design, operation or maintenance. In many cases, this is the result of an ineffective control environment.
Implementation of PCI DSS requirements involves two interdependent aspects: effectiveness and correctness.
The lifecycle of PCI DSS controls
10
1. Conception
During the first stage of the control lifecycle, the need for, or applicability of, a control is identified, followed by systematic exploration of the control criteria, its functional specifications and the available options. This is essential to determine its suitability as a safeguard to avoid, detect, minimize and counteract risks.
2. Design and build
This stage determines, defines and documents the exact purpose and functional parameters of each control. Since each control environment is unique to an organization, it’s important to determine the applicability and suitability of each PCI DSS Requirement. This control profile should include the relationship between the control and the risks it’s intended to mitigate.
3. Testing
The control testing stage determines the extent to which a control follows prescribed specifications in actual practice. It’s the best opportunity to determine how the control may impact people, systems, procedures and third parties prior to deployment, and what the supporting requirements are for the control to operate in a sustainable manner.
4. Introduction and deployment
This stage marks the initial introduction or broader deployment of the control after benchmarking performance within a test environment. This is one of the most critical stages in the lifecycle. The manner in which new security controls are introduced can have immediate and long-term consequences for success or failure—particularly affecting the way controls are perceived and accepted by people and systems within the organization. New controls seldom perform flawlessly from the start and, depending on the amount of testing before deployment, may require an amount of tailoring during and after deployment to iron out shortcomings in their operation, maintenance and support performance.
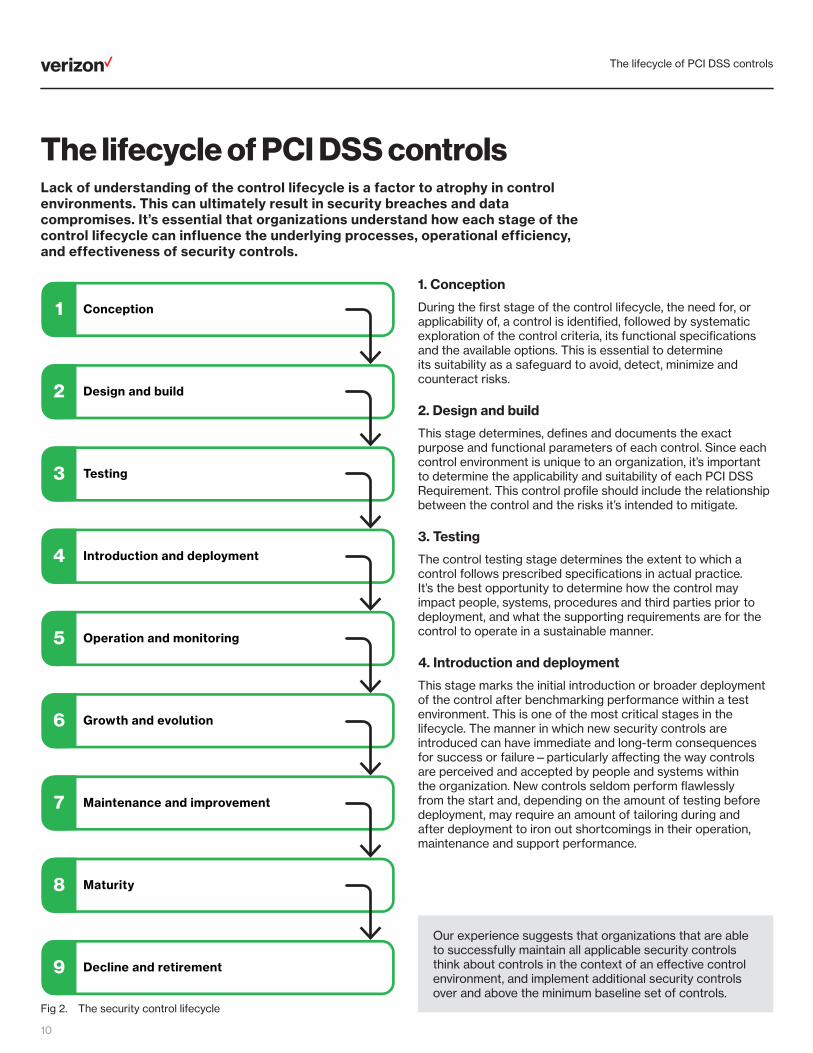
The lifecycle of PCI DSS controlsLack of understanding of the control lifecycle is a factor to atrophy in control environments. This can ultimately result in security breaches and data compromises. It’s essential that organizations understand how each stage of the control lifecycle can influence the underlying processes, operational efficiency, and effectiveness of security controls.
Conception1
Design and build2
Testing3
Introduction and deployment4
Operation and monitoring5
Growth and evolution6
Maintenance and improvement7
Maturity8
Decline and retirement9
Fig 2. The security control lifecycle
Our experience suggests that organizations that are able to successfully maintain all applicable security controls think about controls in the context of an effective control environment, and implement additional security controls over and above the minimum baseline set of controls.
The lifecycle of PCI DSS controls
11
Control is when the outcome can be predicted; when the actions you are taking can be expected to achieve a specific intended outcome that is predictable. The predictability of the outcome depends on the quality and timely input of data, information, knowledge and insight.
Definitions
Compliance environment: The cardholder data environment, connected systems and third parties.
Control: The means by which the use of limited resources is directed, monitored and measured. It regulates organizational activities so that a targeted element of performance remains within acceptable limits, and to ensure that risks, which may inhibit the achievement of objectives, are kept to a minimum.
Control assessment: The systematic review of processes to check that controls are still appropriate and effective.
Internal control: Procedures that create business value and mitigate risk. These should provide reasonable assurance of:
• Effectiveness and efficiency of operations.
• Reliability of reporting.
• Compliance with applicable laws and regulations.
Control correctness: A level of assurance that the security mechanisms of a requirement have been rightly implemented.
Control effectiveness: A level of assurance that the requirement of the system meets the security objectives.
Control environment: The actions, policies, values and management styles that influence and set the tone of the day-to-day activities of an organization; a reflection of its values; the atmosphere in which people conduct their activities and carry out their control responsibilities.
Control framework: A structure that organizes and categorizes an organization’s internal controls to help it develop good internal control systems. A number of frameworks have been created, including Control Objectives for Information and Related Technologies (COBIT) and the Committee of Sponsoring Organizations of the Treadway Commission’s (COSO) internal control framework and Enterprise Risk Management framework.
Control resilience: The ability of a control to resist and recover from unwanted change.
Control risk: The risk caused by controls losing effectiveness over time and exposing assets they were intended to protect, or failing to prevent such exposure.
Control system: Management activity to maintain a collection of procedures designed to record, verify, supervise, authenticate, and, where necessary, restrict access to assets, resources and systems.
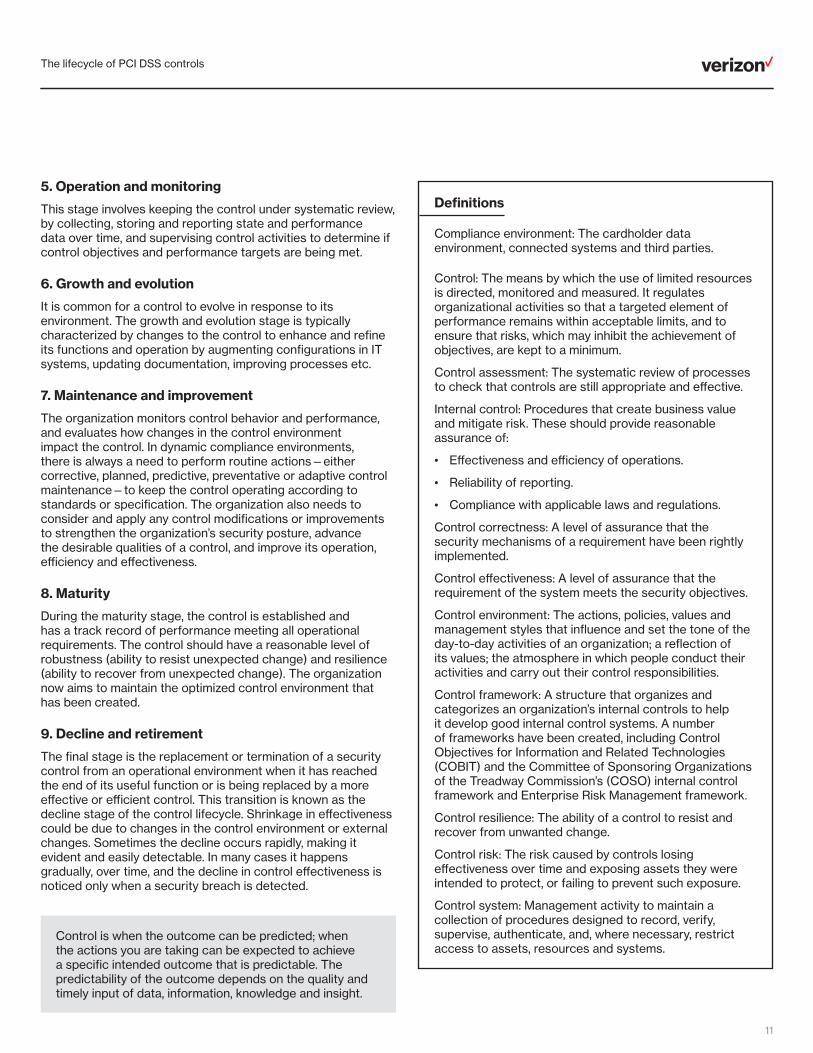
5. Operation and monitoring
This stage involves keeping the control under systematic review, by collecting, storing and reporting state and performance data over time, and supervising control activities to determine if control objectives and performance targets are being met.
6. Growth and evolution
It is common for a control to evolve in response to its environment. The growth and evolution stage is typically characterized by changes to the control to enhance and refine its functions and operation by augmenting configurations in IT systems, updating documentation, improving processes etc.
7. Maintenance and improvement
The organization monitors control behavior and performance, and evaluates how changes in the control environment impact the control. In dynamic compliance environments, there is always a need to perform routine actions—either corrective, planned, predictive, preventative or adaptive control maintenance—to keep the control operating according to standards or specification. The organization also needs to consider and apply any control modifications or improvements to strengthen the organization’s security posture, advance the desirable qualities of a control, and improve its operation, efficiency and effectiveness.
8. Maturity
During the maturity stage, the control is established and has a track record of performance meeting all operational requirements. The control should have a reasonable level of robustness (ability to resist unexpected change) and resilience (ability to recover from unexpected change). The organization now aims to maintain the optimized control environment that has been created.
9. Decline and retirement
The final stage is the replacement or termination of a security control from an operational environment when it has reached the end of its useful function or is being replaced by a more effective or efficient control. This transition is known as the decline stage of the control lifecycle. Shrinkage in effectiveness could be due to changes in the control environment or external changes. Sometimes the decline occurs rapidly, making it evident and easily detectable. In many cases it happens gradually, over time, and the decline in control effectiveness is noticed only when a security breach is detected.

How to improve effectiveness
12
How to improve effectivenessMost companies initiated their PCI Security compliance programs many years ago. By now, they certainly should have processes in place to support their program; making daily management and ongoing control maintenance relatively effortless. Sadly, that’s not always the case.
The PCI DSS is not a risk management standard. It does not provide prescriptive recommendations that specify how to identify, treat or manage risk—which is fine. Its goal is to provide a minimum set of general controls that, when implemented correctly and consistently maintained, provide reasonable assurance that payment card data is secure.
Monitoring control effectiveness against exposure to risk is key to achieving security through compliance. Yet the requirement for this kind of control monitoring is starkly missing from the PCI DSS. The PCI DSS does not assess methods used by organizations to evaluate the effectiveness of controls in operation. The lack of ongoing control evaluation contributes to the ‘check box’ mentality that some organizations have toward PCI DSS compliance.
Controls can satisfy compliance validation criteria without explicit evidence that control effectiveness was also evaluated. The assumption is that controls will be effective by presence alone. This is why it has become so essential that control effectiveness guidelines be included in the PCI DSS.
You cannot evaluate overall control effectiveness without also measuring its contribution toward risk mitigation. Controls should only be considered effective when their contribution to the control system and control environment mitigates risk to an acceptable level.
The PCI DSS continues to evolve, making it easier for organizations to understand what “doing the right things” means, how to go about doing it and when to do it. But in its current form, it may benefit from including guidance on aspects such as:
• How organizational involvement in control design impacts control effectiveness, resilience and sustainability.
• How a control operates within a control system where controls have interrelated dependencies.
• How control performance is directly influenced by the environment in which it operates.
Without conscious consideration of these aspects during their implementation, the ability of a control to successfully mitigate risk on a continuous basis will be compromised; it will be sustainable merely by luck—certainly not by design.
The answer is to go back to basics and:
• Refocus the discussion around control effectiveness and risk mitigation.
• Acknowledge the necessity of an industry-defined/guided risk-based approach to understand effective control management.
• Broaden guidance on control design and implementation, and encourage development of intelligent control systems.
This is no easy task, but it is critical to developing a robust, sustainable and secure payment industry.
Protecting information, no matter where it is located, requires a fundamental shift in focus. Information security professionals who are accustomed to concentrating on technology need to switch gears and focus on business processes and data.
An effective control environment is “an environment in which competent people understand their responsibilities, the limits of their authority, and are knowledgeable, mindful and committed to doing what is right and doing it the right way. Employees in this environment are committed to following an organization’s policies and procedures, and its ethical and behavioral standards10.”
Organizations that make sustainability and resilience part of their operating procedure have a significant head start over those that focus solely on achieving compliance.
Control concepts
Security controls can be classified into one of four categories:
• Preventative controls: deter problems before they arise—e.g. physical controls and passwords.
• Detective controls: discover problems when they happen—e.g. log reviews, inventories, penetration tests and vulnerability scans.
• Corrective controls: resolve problems after they arise and return the system to a “normal” state.
• Directive controls: cause or encourage desirable events to occur—e.g. policies and training.

Analysis
13
Analysis
Analysis
13

The state of PCI DSS compliance
14
The state of PCI DSS compliance
Fig 3. Overview of full compliance at interim assessment, 2012–2016
This report is the only major industry publication that is based on data from real compliance assessments, conducted worldwide. Insights from our post-data breach investigations make it an invaluable resource.
It has been eleven years since the Payment Card Industry Security Standards Council (PCI SSC) released the Payment Card Industry Data Security Standard (PCI DSS) version 1.1, and seven years since the publication of our first PCI report. Large-scale data breach disclosures are increasingly common, with millions of sensitive records compromised each year. Many organizations, including the US government, are discussing what can be done to protect customers and organizations against the onslaught of attacks.
Verizon has been on the frontline of cardholder data security since 2003. This report, now on its fifth edition, has become the go-to resource for industry experts because of its critical evaluations on the performance of the PCI DSS, its insights on the evolution of payment security, and debate on the ability of organizations to meet sustained compliance.
Full compliance continues its upward trend
Organizations are required to not only achieve 100.0% compliance with the PCI DSS, but also to maintain it. This means having all applicable security controls continuously in place. We measured organizations during interim assessment to determine the percentage that achieved full compliance for each Key Requirement.
An interim assessment—or initial Report on Compliance (iRoC)—provides a valuable opportunity for organizations to validate the effectiveness of PCI DSS control management within their organizations.
37.1%
62.9%
20.0%
80.0%88.9%
11.1%
201420132012
48.4%55.4%
51.6%44.6%
2015 2016
20%
40%
60%
80%
100%
100%
0%
80%
60%
40%
20%
Pas
sed
Fai
led
It’s good news; based on our assessments, compliance is going up. But there’s still cause for concern, for both merchants and consumers.

The state of PCI DSS compliance
15
But the control gap of organizations that failed has widened
As well as compliance by organization, we also looked at the control gap—the number of failed controls as a percentage of all those assessed. Comparing this data with the compliance by organization (full compliance) provides some interesting insights. It allows us to identify which PCI DSS controls organizations are struggling to comply with.
We have been tracking the control gap since PCI DSS 1.1. In our previous reports, we explained how each update to the PCI DSS impacted organizations’ abilities to meet the requirements.
Average control gap (all, including fully compliant)
92.6%
7.4%
93.6%
6.4%14.4%
201420132012
20%
40%
60%
80%
100%
100%
0%
80%
60%
40%
20%
93.2% 94.2%
6.8% 5.8%
2015 2016
Average control gap (non-compliant companies)
85.6% 83.2%
16.8%
88.2%92.0% 87.6% 87.0%
13.0%12.4%11.8%8.0%
Pas
sed
Fai
led Average compliance (all, including fully compliant)
Average compliance (non-compliant companies)
Worldwide, the top performing industry remains IT services where almost two-thirds of organizations (61.3%) achieved full compliance.
It is followed by financial services (59.1%), hospitality (50.0%) and retail (42.9%).
Based on full compliance, retail organizations demonstrated the lowest compliance sustainability across all key industries.
Fig 4. Overview of control gap at interim assessment, 2012–2016
Compliance trends
16
Compliance trendsFull compliance
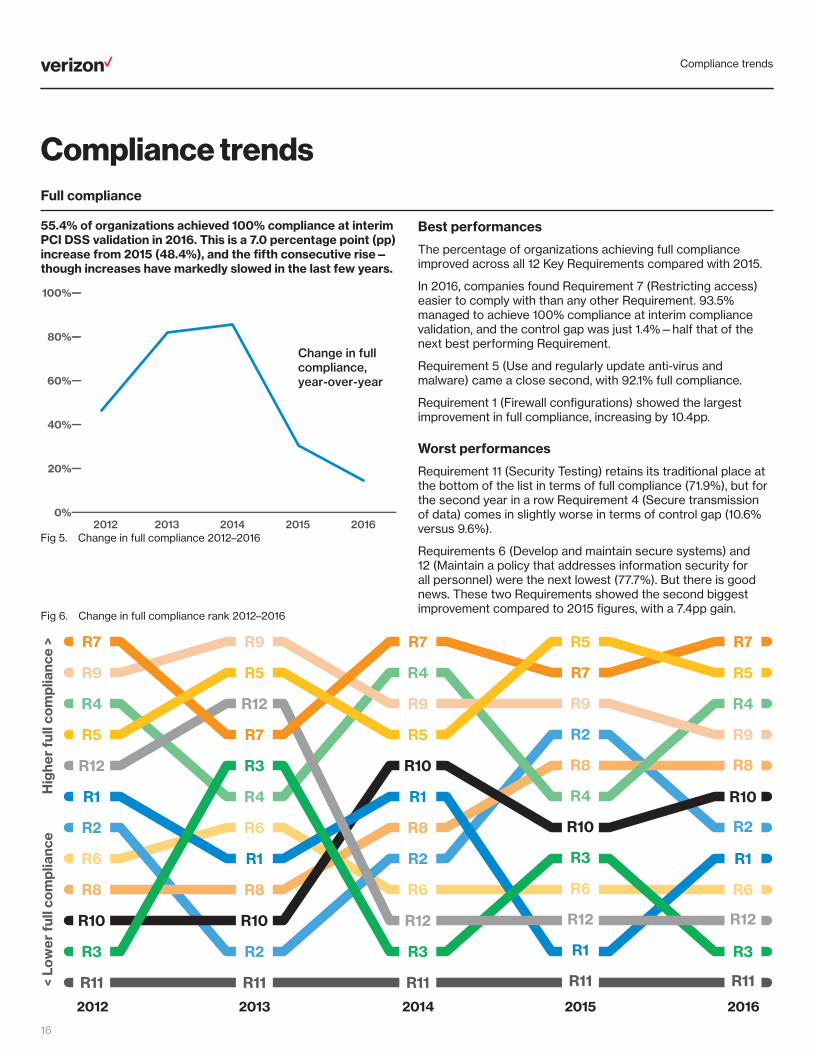
55.4% of organizations achieved 100% compliance at interim PCI DSS validation in 2016. This is a 7.0 percentage point (pp) increase from 2015 (48.4%), and the fifth consecutive rise—though increases have markedly slowed in the last few years.
Best performances
The percentage of organizations achieving full compliance improved across all 12 Key Requirements compared with 2015.
In 2016, companies found Requirement 7 (Restricting access) easier to comply with than any other Requirement. 93.5% managed to achieve 100% compliance at interim compliance validation, and the control gap was just 1.4%—half that of the next best performing Requirement.
Requirement 5 (Use and regularly update anti-virus and malware) came a close second, with 92.1% full compliance.
Requirement 1 (Firewall configurations) showed the largest improvement in full compliance, increasing by 10.4pp.
Worst performances
Requirement 11 (Security Testing) retains its traditional place at the bottom of the list in terms of full compliance (71.9%), but for the second year in a row Requirement 4 (Secure transmission of data) comes in slightly worse in terms of control gap (10.6% versus 9.6%).
Requirements 6 (Develop and maintain secure systems) and 12 (Maintain a policy that addresses information security for all personnel) were the next lowest (77.7%). But there is good news. These two Requirements showed the second biggest improvement compared to 2015 figures, with a 7.4pp gain.
0%
80%
60%
40%
20%
201420132012 2015 2016
100%
Change in full compliance, year-over-year
Fig 5. Change in full compliance 2012–2016
R12
R1
R8
R9
R7
R3
R11
R10
R6
R2
R4
R5
R12
R1
R8
R9
R7
R3
R11
R10
R6
R2
R4
R5
R12
R1
R8
R9
R7
R3
R11
R10
R6
R2
R4
R5
R12
R1
R8
R9
R7
R3
R11
R10
R6
R2
R4
R5
R12
R1
R8
R9
R7
R3
R11
R10
R6
R2
R4
R5
2012 20162013 2014 2015
Hig
her
full
com
plia
nce
><
Low
er f
ull c
ompl
ianc
e
Fig 6. Change in full compliance rank 2012–2016
Compliance trends
17
20%
0%
-20%
-40%
-60%
-70%
201420132012 2015 2016
40%
Change in control gap, year-over-year
Change in control gap, year-over-year (non-compliant companies only)
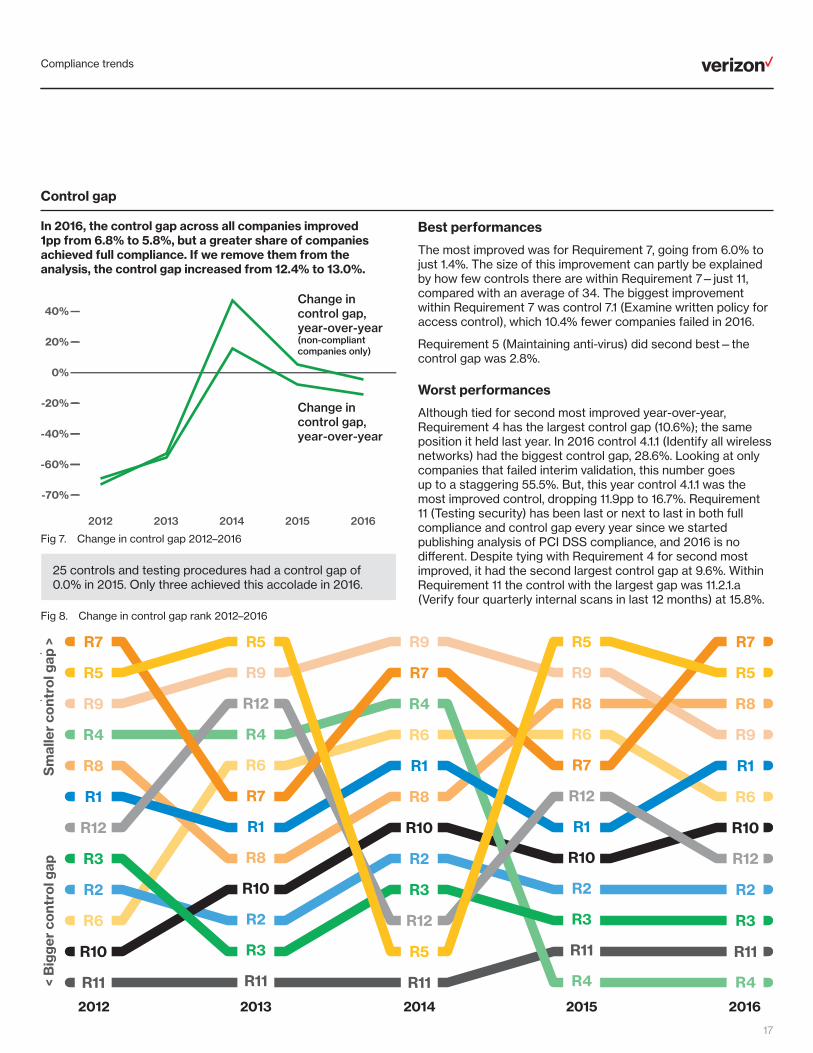
Fig 7. Change in control gap 2012–2016
Control gap
In 2016, the control gap across all companies improved 1pp from 6.8% to 5.8%, but a greater share of companies achieved full compliance. If we remove them from the analysis, the control gap increased from 12.4% to 13.0%.
Best performances
The most improved was for Requirement 7, going from 6.0% to just 1.4%. The size of this improvement can partly be explained by how few controls there are within Requirement 7—just 11, compared with an average of 34. The biggest improvement within Requirement 7 was control 7.1 (Examine written policy for access control), which 10.4% fewer companies failed in 2016.
Requirement 5 (Maintaining anti-virus) did second best—the control gap was 2.8%.
Worst performances
Although tied for second most improved year-over-year, Requirement 4 has the largest control gap (10.6%); the same position it held last year. In 2016 control 4.1.1 (Identify all wireless networks) had the biggest control gap, 28.6%. Looking at only companies that failed interim validation, this number goes up to a staggering 55.5%. But, this year control 4.1.1 was the most improved control, dropping 11.9pp to 16.7%. Requirement 11 (Testing security) has been last or next to last in both full compliance and control gap every year since we started publishing analysis of PCI DSS compliance, and 2016 is no different. Despite tying with Requirement 4 for second most improved, it had the second largest control gap at 9.6%. Within Requirement 11 the control with the largest gap was 11.2.1.a (Verify four quarterly internal scans in last 12 months) at 15.8%.
R12
R1
R8
R9
R7
R3
R11
R10
R6
R2
R4
R5
R12
R1
R8
R9
R7
R3
R11
R10
R6
R2
R4
R5
R12
R1
R8
R9
R7
R3
R11
R10
R6
R2
R4
R5
R12
R1
R8
R9
R7
R3
R11
R10
R6
R2
R4
R5
R12
R1
R8
R9
R7
R3
R11
R10
R6
R2
R4
R5
2012 20162013 2014 2015
Sm
alle
r co
ntro
l gap
><
Big
ger
cont
rol g
ap
Fig 8. Change in control gap rank 2012–2016
25 controls and testing procedures had a control gap of 0.0% in 2015. Only three achieved this accolade in 2016.

Compliance trends
18
Compensating Controls
About one-third of organizations (33.8%) found to be fully PCI DSS compliant at interim validation in 2016 would not have reached that goal without the use of a compensating control. Overall, 30.2% applied one or more compensating controls in 2016. This is significantly lower than 2015, when the corresponding figures were 40.0% and 37.5%.
Best performances
The use of compensating controls was lowest in Europe, where only 17.9% of companies used a compensating control. In comparison, this figure was 33.9% in the Americas and 36.6% in Asia Pacific.
There were only two DSS Requirements for which no company applied a compensating control in 2016: 7 (Restricting access) and 12 (Maintaining security policies). That’s an improvement from last year, when this was only true of Requirement 7.
At Key Requirement level, the biggest drop in the use of compensating controls was with Requirement 1 (Firewall configurations). This fell 6.6pp from its 2015 level, reaching just 4.3%. The next biggest fall was Requirement 2 (Vendor supplied defaults), which fell 3.9pp, from 12.5% to 8.6%.
Overall, the biggest drop in the use of compensating controls was with 2.2.3.b (Confirm the entity has documentation that verifies the devices are not susceptible to any known exploits for SSL/early TLS). This fell from 7.8% to 0.7%.
The next largest decline was in 2.2.3.c (For all other environments using SSL and/or early TLS: Review the documented risk mitigation and migration) which fell 6.4pp to 1.4%. Hopefully, this indicates that companies are moving away from older, less-secure forms of SSL and TLS.
Worst performances
The Requirement where the most organizations applied a compensating control was Requirement 8 (Secure authentication). This has been the case for many years. In 2016, 17.3% of the organizations that we assessed applied one or more compensating controls to meet the demands of this Key Requirement.
Requirement 8 also appears twice in the top five controls with the biggest increase in the use of compensating controls.
At the top of this list is 8.2.4.a (Inspect system configuration settings to verify user password parameters), which increased 2.5pp to 7.2%.
In fourth position was 8.7.c (Examine database access control settings and database application configuration settings), which went up from 4.7% to 6.5%.
Despite these increases, neither of these controls had the greatest use of compensating controls. That “prize” goes to 8.5.a (For a sample of system components, examine user ID lists to verify that neither generic nor shared IDs are being used). 7.2% of companies used a compensating control here, down from 7.8% in 2016. Last year, 8.5.c tied with 8.5.a, but this year use of compensating controls (Do not use group, shared, or generic IDs) for this control plummeted to 2.9%.
The next most prevalent use of compensating controls was in Requirement 3, where 10.8% of organizations applied one or more in 2016. This was up 3.0pp from 2015, when it was in fourth place behind Requirement 2 (Vendor supplied defaults) and Requirement 1 (Firewall configurations).
Trends in financial services
19
Trends in financial services Insurance, investment, lending, and money/asset managers, including payment processors and service providers.
Full compliance
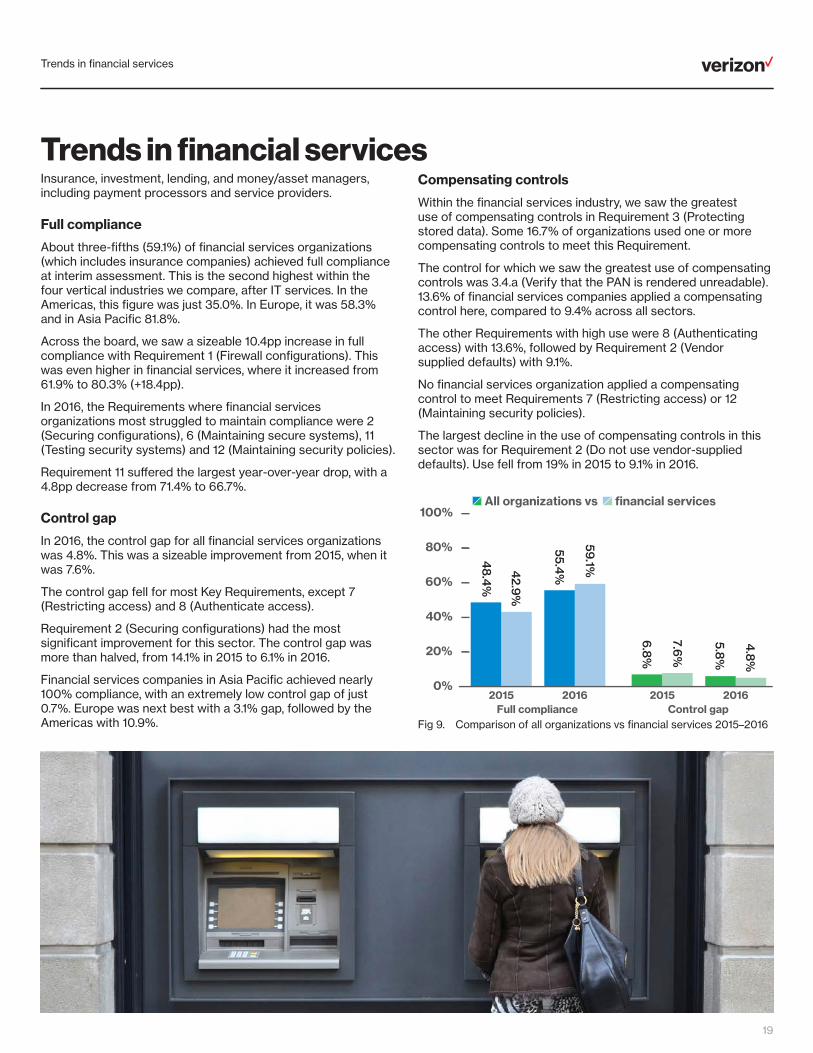
About three-fifths (59.1%) of financial services organizations (which includes insurance companies) achieved full compliance at interim assessment. This is the second highest within the four vertical industries we compare, after IT services. In the Americas, this figure was just 35.0%. In Europe, it was 58.3% and in Asia Pacific 81.8%.
Across the board, we saw a sizeable 10.4pp increase in full compliance with Requirement 1 (Firewall configurations). This was even higher in financial services, where it increased from 61.9% to 80.3% (+18.4pp).
In 2016, the Requirements where financial services organizations most struggled to maintain compliance were 2 (Securing configurations), 6 (Maintaining secure systems), 11 (Testing security systems) and 12 (Maintaining security policies).
Requirement 11 suffered the largest year-over-year drop, with a 4.8pp decrease from 71.4% to 66.7%.
Control gap
In 2016, the control gap for all financial services organizations was 4.8%. This was a sizeable improvement from 2015, when it was 7.6%.
The control gap fell for most Key Requirements, except 7 (Restricting access) and 8 (Authenticate access).
Requirement 2 (Securing configurations) had the most significant improvement for this sector. The control gap was more than halved, from 14.1% in 2015 to 6.1% in 2016.
Financial services companies in Asia Pacific achieved nearly 100% compliance, with an extremely low control gap of just 0.7%. Europe was next best with a 3.1% gap, followed by the Americas with 10.9%.
Compensating controls
Within the financial services industry, we saw the greatest use of compensating controls in Requirement 3 (Protecting stored data). Some 16.7% of organizations used one or more compensating controls to meet this Requirement.
The control for which we saw the greatest use of compensating controls was 3.4.a (Verify that the PAN is rendered unreadable). 13.6% of financial services companies applied a compensating control here, compared to 9.4% across all sectors.
The other Requirements with high use were 8 (Authenticating access) with 13.6%, followed by Requirement 2 (Vendor supplied defaults) with 9.1%.
No financial services organization applied a compensating control to meet Requirements 7 (Restricting access) or 12 (Maintaining security policies).
The largest decline in the use of compensating controls in this sector was for Requirement 2 (Do not use vendor-supplied defaults). Use fell from 19% in 2015 to 9.1% in 2016.
100%
0%
80%
60%
40%
20%
48
.4%
55.4%42.9
%
59.1%
Full compliance2015 2016
Control gap2015 2016
6.8
%
5.8%
7.6%
4.8
%
All organizations vs financial services
Fig 9. Comparison of all organizations vs financial services 2015–2016
Trends in hospitality
20
Trends in hospitality Typically hotels, restaurants and travel and tourism companies.
Full compliance
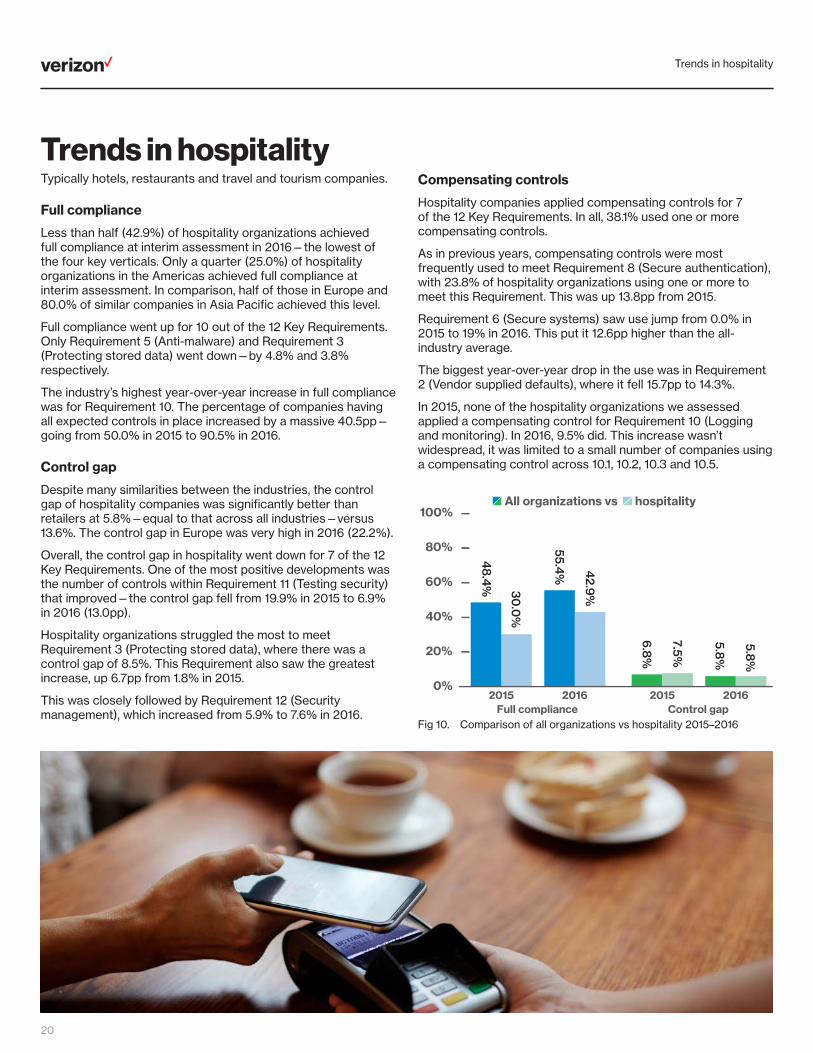
Less than half (42.9%) of hospitality organizations achieved full compliance at interim assessment in 2016—the lowest of the four key verticals. Only a quarter (25.0%) of hospitality organizations in the Americas achieved full compliance at interim assessment. In comparison, half of those in Europe and 80.0% of similar companies in Asia Pacific achieved this level.
Full compliance went up for 10 out of the 12 Key Requirements. Only Requirement 5 (Anti-malware) and Requirement 3 (Protecting stored data) went down—by 4.8% and 3.8% respectively.
The industry’s highest year-over-year increase in full compliance was for Requirement 10. The percentage of companies having all expected controls in place increased by a massive 40.5pp—going from 50.0% in 2015 to 90.5% in 2016.
Control gap
Despite many similarities between the industries, the control gap of hospitality companies was significantly better than retailers at 5.8%—equal to that across all industries—versus 13.6%. The control gap in Europe was very high in 2016 (22.2%).
Overall, the control gap in hospitality went down for 7 of the 12 Key Requirements. One of the most positive developments was the number of controls within Requirement 11 (Testing security) that improved—the control gap fell from 19.9% in 2015 to 6.9% in 2016 (13.0pp).
Hospitality organizations struggled the most to meet Requirement 3 (Protecting stored data), where there was a control gap of 8.5%. This Requirement also saw the greatest increase, up 6.7pp from 1.8% in 2015.
This was closely followed by Requirement 12 (Security management), which increased from 5.9% to 7.6% in 2016.
Compensating controls
Hospitality companies applied compensating controls for 7 of the 12 Key Requirements. In all, 38.1% used one or more compensating controls.
As in previous years, compensating controls were most frequently used to meet Requirement 8 (Secure authentication), with 23.8% of hospitality organizations using one or more to meet this Requirement. This was up 13.8pp from 2015.
Requirement 6 (Secure systems) saw use jump from 0.0% in 2015 to 19% in 2016. This put it 12.6pp higher than the all-industry average.
The biggest year-over-year drop in the use was in Requirement 2 (Vendor supplied defaults), where it fell 15.7pp to 14.3%.
In 2015, none of the hospitality organizations we assessed applied a compensating control for Requirement 10 (Logging and monitoring). In 2016, 9.5% did. This increase wasn’t widespread, it was limited to a small number of companies using a compensating control across 10.1, 10.2, 10.3 and 10.5.
100%
0%
80%
60%
40%
20%
48
.4%
55.4%
30.0
%
42.9
%
Full compliance2015 2016
Control gap2015 2016
6.8
%
5.8%
7.5%
5.8%
All organizations vs hospitality
Fig 10. Comparison of all organizations vs hospitality 2015–2016

Trends in IT services
21
Trends in IT services Full compliance
The IT services industry achieved the highest full compliance of all key industry groups studied. Globally, about three-fifths (61.3%) of IT services organizations achieved full compliance during interim assessment in 2016. Despite retaining the top slot, compliance fell 11.4pp from 2015.
Requirement 4 (Secure transmission of data) showed the largest improvement in full compliance, with an increase of 8.5pp—going from 81.8% in 2015 to 90.3% in 2016.
The biggest decline in full compliance was for Requirement 2 (Vendor supplied defaults). This showed a significant 12.6pp decrease, from 100% in 2015 to 87.1% in 2016.
Asia Pacific maintained its lead over other regions, with 84.6% of IT service organizations in the region demonstrating that they met all PCI DSS controls during interim assessment. Asia Pacific was followed by the Americas, where nearly two-thirds (63.6%) of IT services organizations achieved full compliance. Europe lagged behind at just 14.3%.
Control gap
The control gap within IT services increased for nine of the 12 Key Requirements in 2016—only Requirements 1, 4 and 6 showed an improvement. Despite this, the control gap was still a very low 2.9%—the lowest among all key industries studied.
Requirement 4 was the weakest of the Key Requirements for IT services, with a control gap of 9.7%. But this was a 17.7pp improvement from the previous year.
The highest increase in control gap was seen in Requirement 11 (Testing security) which went up from 0.7% in 2015 to 5.5% in 2016 (4.8pp).
Requirement 10 (Logging and monitoring) had the third highest control gap at 4.2%.
Three controls tied for the widest control gap: 3.4.e (Hashed and truncated versions cannot be correlated to reconstruct the original PAN), 4.1.a (If disk encryption is used, inspect the configuration) and 9.5.1.b (Verify that backup media storage is secure at least annually). Four-fifths of companies failed to show that they were in compliance, a 20.0% control gap.
Compensating controls
IT services companies applied compensating controls across 5 of the 12 Key Requirements: 2, 3, 5, 8, and 10.
Requirement 8 (Secure authentication) remained the Key Requirement where compensating controls were most likely to be used. The percentage of companies using one increased from 9.1% in 2015 to 22.6% in 2016 (+13.5pp).
Requirement 3 (Protecting stored data) showed the next highest use of compensating controls (6.5%).
The largest decline in the use of compensating controls was for Requirement 1 (Firewall configurations), where use plunged from 18.2% in 2015 to 0.0% in 2016.
100%
0%
80%
60%
40%
20%
48
.4%
55.4%
72.7% 61.3%
Full compliance2015 2016
Control gap2015 2016
6.8
%
5.8%
1.9%
2.9%
All organizations vs IT services
Fig 11. Comparison of all organizations vs IT services 2015–2016

Trends in retail
22
Trends in retail Merchant organizations that sell to consumers. This covers both bricks and mortar stores and e-commerce businesses.
Full compliance
In 2016, half of retail organizations achieved 100% compliance at interim assessment, compared with 57.1% in 2015. This fall was mirrored across all 12 Key Requirements. The largest fall was with Requirement 7 (Restricting access), which dropped a massive 32.9pp, from 92.9% to just 60.0%.
Within the retail industry, just 46.7% of organizations in the Americas achieved full compliance at interim assessment. Those in Europe did only slightly better (50.0%).
Control gap
The control gap within the retail industry worldwide was 13.6%, the highest of all four key industries. This percentage was skewed by retail organizations in the Americas, where the control gap was 17.6%.
Judged by control gap, retailers struggled most with Requirement 4 (Protecting data in transit) (23.0%) and Requirement 11 (Testing security systems) (16.2%).
Between 2015 and 2016, the control gap increased for 11 of the 12 Key Requirements. Only Requirement 7 (Restricting access) improved—and that was by just 0.6pp, which is insignificant.
The highest control gap within retail was for Requirement 4 (Secure transmission of data) at 23.0%. Eliminating companies that were fully compliant with all controls, this control gap rises to an alarming 46.0%. Using the same measure, the individual control with the biggest gap was 4.1.1. (Identify all wireless networks transmitting cardholder data or connected to the cardholder data environment), with 80.0% of companies failing to have sufficient measures in place.
Requirement 3 (Protecting stored data) saw the greatest increase from the previous year. The control gap widened by a huge 17.1pp, going from 4.3% in 2015 to 21.5% in 2016.
Compensating controls
The retail industry only used compensating controls for 6 of the 12 Key Requirements: 2, 3, 6, 8, 9 and 11.
Requirement 8 (Secure authentication) saw the highest use of compensating controls at 15.0%. Requirements 2 (Securing configurations) and 9 (Controlling physical access) tied for next highest use at 10.0%.
There was a significant decrease in the use of compensating controls to meet Requirement 11 (Testing security), down from 14.3% in 2015 to just 5.0% in 2016. This was the largest decrease in compensating control use within this industry across all Key Requirements.
100%
0%
80%
60%
40%
20%
48
.4%
55.4%
57.1%
50.0
%
Full compliance2015 2016
Control gap2015 2016
6.8
%
5.8%
6.1%
13.6%
All organizations vs retail
Fig 12. Comparison of all organizations vs retail 2015–2016

Breakdown by Key Requirement
23
Full compliance
Requirement 7 (Restrict access) was the requirement with which the most companies were 100.0% compliant. 93.5% of all organizations managed to maintain compliance with this Requirement between 2015 and 2016. Requirement 11 (Security testing) was the least well-sustained, with only 71.9% of organizations achieving full compliance.
Fig 13. Full compliance at interim assessment, by Key Requirement, 2016
Compensating controls
Companies applied compensating controls most often to comply with Requirements 2, 3, 6, and 8. No organizations applied a compensating control for Key Requirements 7 or 12.
Fig 15. Use of compensating controls at interim assessment, by Key Requirement, 2016
Control gap
While five Key Requirements (5, 8, 9, 11 and 12) improved between 2015 and 2016, 58.4% of controls declined in compliance. Requirements 4 and 11 had the largest control gap.
Fig 14. Control gap at interim assessment, by Key Requirement, 2016
77.7%71.9%
83.5%84.9%83.5%
93.5%
77.7%
92.1%86.3%
77.0%81.3%79.1%
55.4%
Percentage of companies fully compliant with all controlsPercentage of companies fully compliant with all controls
0%
100%
Per
cent
age
of c
ompa
nies
tha
t pa
ssed
121110987654321All
PCI DSS Requirement
Percentage of controls failed
5.3%5.1%2.8%
10.6%9.2%7.0%4.9%5.8%
1.4%4.4% 4.5%
9.6%5.4%
100%
0%
Per
cent
age
of c
ontr
ols
faile
d
121110987654321All
PCI DSS Requirement
0.0%3.6%3.6%1.4%
17.3%
0.0%2.9%1.4%
10.8%8.6%4.3%
30.2%
Percentage of companies using one or more compensating controls
0%
100%
Per
cent
age
of c
ompa
nies
usi
ng
121110987654321All
PCI DSS Requirement
6.5%
Breakdown by Key Requirement

Install and maintain a firewall configuration
24
Full compliance (2016) Year-over-year change (2015-16)
Breakdown by region and industry
Control gap (2016) Year-over-year change (2015-16)
Breakdown by region and industry
Year-over-year change (2015-16)
Breakdown by region and industry
All
Use of compensating controls (’16)
Install and maintain a firewall configuration
24
Financial servicesHospitality
Retail
Asia PacificAmericas
Europe
Financial services
Retail
Hospitality
AmericasAsia PacificEurope
Financial servicesHospitality
Retail
AmericasAsia Pacific
Europe
IT services
IT services
IT services
All
All
7 (93.5%) 5 (92.1%) 4 (86.3%) 9 (84.9%)
2 (81.3%)
6 (77.7%) 12 (77.7%) 3 (77.0%)
8 (83.5%) 10 (83.5%)
11 (71.9%)
4 (10.6%)11 (9.6%)3 (9.2%)2 (7.0%)
12 (5.4%)10 (5.3%)
1 (4.9%)9 (4.5%)8 (4.4%)5 (2.8%)7 (1.4%)
6 (5.1%)
8 (17.3%)
3 (10.8%)2 (8.6%)
6 (6.5%)1 (4.3%)10 (3.6%)11 (3.6%)5 (2.9%)4 (1.4%)9 (1.4%)
7 (0.0%)12 (0.0%)
1 (79.1%)
Key RequirementInstall and maintain a firewall configuration 1
79.1%
1 (79.1%)
10.4pp improvement (’15–’16)
80.3%61.9%76.2%60.0%
70.0% 78.6%
76.9% to 97.6%67.4%66.1%
62.5% 79.5%
1.6pp decrease (’15–’16)
8.6% to 3.7%
13.6% 8.5%
8.6% to 3.6%
4.9%
8.3%8.3%1.3% to 0.2%
4.5% to 4.2%
6.6pp reduction (’15–’16)
14.3% to 4.5%10.0% 14.3%
7.1% to 0.0%
4.3%
9.3%6.8%15.4% to 2.4%
12.5% to 2.6%
87.1%81.8%
3.8% to 2.4%
18.2% to 0.0%

Install and maintain a firewall configuration
25
Retail
• In 2016, the retail industry had the lowest average compliance with Requirement 1, at 86.4%, down from 91.5% in 2015—with a control gap of 13.6% and 8.5% respectively. All other key industries had averages of over 95%.
• The weakest controls within this sector were 1.1.6.b (Identify insecure services, protocols, and ports allowed; and document security features) and 1.1.6.c (Examine firewall and router configurations to verify that the documented security features are implemented for each insecure service, protocol, and port), which both had a control gap of 23.5%.
• Retail companies often have large workforces—spread across national networks of sites—making managing personal devices challenging without the use of enterprise device management tools.
Hospitality
• Within the hospitality industry, full compliance with Requirement 1 dropped 2.9pp in 2016, falling to 76.2%. However, the control gap narrowed 1.2pp to just 3.6%.
• Control 1.4.a (Install personal firewall software on any portable computing devices) improved significantly, with the control gap dropping to 6.7% in 2016.
• Control 1.3 (Prohibit direct public access between Internet and cardholder data environment) maintained a control gap of 0.0% in 2016.
• The hospitality industry was the only one in which the use of compensating controls for Requirement 1 went up in 2016. It rose to 14.3%, a 4.3pp increase on 2015.
Financial services
• Full compliance with Requirement 1 improved significantly within the financial services industry, increasing from 61.9% in 2015 to 80.3% in 2016.
• As in previous years, the financial services industry was outperformed by most other sectors on Requirement 1. But on a positive note, the control gap of 3.7% was a 5.0pp improvement on 2015.
• Financial services organizations are complex and often have stretched resources and firmly established ways of working. Documenting and maintaining policies and procedures for existing processes are often overlooked.
• The use of compensating controls for Requirement 1 decreased by 9.7pp, to 4.5% in 2016.
IT services
• Year after year, the IT services industry has retained the top spot for compliance with Requirement 1. In 2016, full compliance increased 5.3pp to 87.1%—6.8pp clear of its nearest rival.
• In 2015, the control gap was just 3.8%. In 2016, this narrowed to 2.4%.
• Overall, IT services organizations performed very well, achieving 100% compliance on 244 of the 405 DSS controls.
• Within IT services, the use of compensating controls for Requirement 1 fell to 0.0% in 2016 – a massive 18.2pp drop from 2015.
Worst control gaps
1.1.2.a (11.3%)1.1.6.c (11.1%)
1.1.6.b (10.4%)1.1 (8.1%)
1.1.6.a (7.6%)1.1.7.b (7.5%)
1.2.2.b (7.0%)1.1.3 (6.8%)
1.2.1.b (6.8%)1.4.b (6.5%)
Most often compensated controls
1.1.6.b (3.6%)1.1.6.a (1.4%)1.1.6.c (1.4%)1.1.1.b (0.7%)
The use of compensating controls to meet Requirement 1 decreased across all regions and most industries. Hospitality companies were most likely to use one by a substantial margin (14.3%).
This Requirement covers the correct use of a firewall to filter traffic as it passes between internal and external networks, as well as traffic to and from more sensitive areas within the company’s internal networks.
77.2%of companies assessed after a data breach were not in compliance with Requirement 1*
* Breached organizations investigated between 2010 and 2016.
Keep system and configuration documentation up to date and improve its consistency, by fully integrating documentation maintenance and management into your change control process.

Do not use vendor-supplied defaults
26
Full compliance (2016) Year-over-year change (2015-16)
Breakdown by region and industry
Control gap (2016) Year-over-year change (2015-16)
Breakdown by region and industry
Year-over-year change (2015-16)
Breakdown by region and industry
All
Use of compensating controls (’16)
Do not use vendor-supplied defaults
26
Financial servicesHospitality
Retail
Asia PacificAmericas
Europe
Financial services
Retail
Hospitality
AmericasAsia PacificEurope
Financial servicesHospitality
Retail
AmericasAsia Pacific
Europe
IT services
IT services
IT services
All
All
7 (93.5%) 5 (92.1%) 4 (86.3%) 9 (84.9%)
2 (81.3%)
6 (77.7%) 12 (77.7%) 3 (77.0%)
8 (83.5%) 10 (83.5%)
11 (71.9%)
4 (10.6%)11 (9.6%)3 (9.2%)2 (7.0%)
12 (5.4%)10 (5.3%)
1 (4.9%)9 (4.5%)8 (4.4%)5 (2.8%)7 (1.4%)
6 (5.1%)
8 (17.3%)
3 (10.8%)2 (8.6%)
6 (6.5%)1 (4.3%)10 (3.6%)11 (3.6%)5 (2.9%)4 (1.4%)9 (1.4%)
7 (0.0%)12 (0.0%)
1 (79.1%)
81.3%
Key RequirementDo not use vendor-supplied defaults 2
2 (81.3%)
1.6pp improvement (’15–’16)
7.0%1.6pp decrease (’15–’16)
3.9pp reduction (’15–’16)
8.6%
14.1% to 6.1%
78.8%71.4%90.5%70.0%
75.0% 85.7%
84.6% to 100.0%79.1%74.6%
75.0%71.8%
5.5% to 15.2%
8.1% to 4.9%
9.6%10.9%3.2% to 0.0%
8.1%12.4%
19.0%9.1%14.3% 30.0%
10.0% to 14.3%
15.3%14.0%15.4% to 2.4%
0.0% to 5.1%
100.0% to 87.1%
0.0% to 4.1%
0.0% to 3.2%
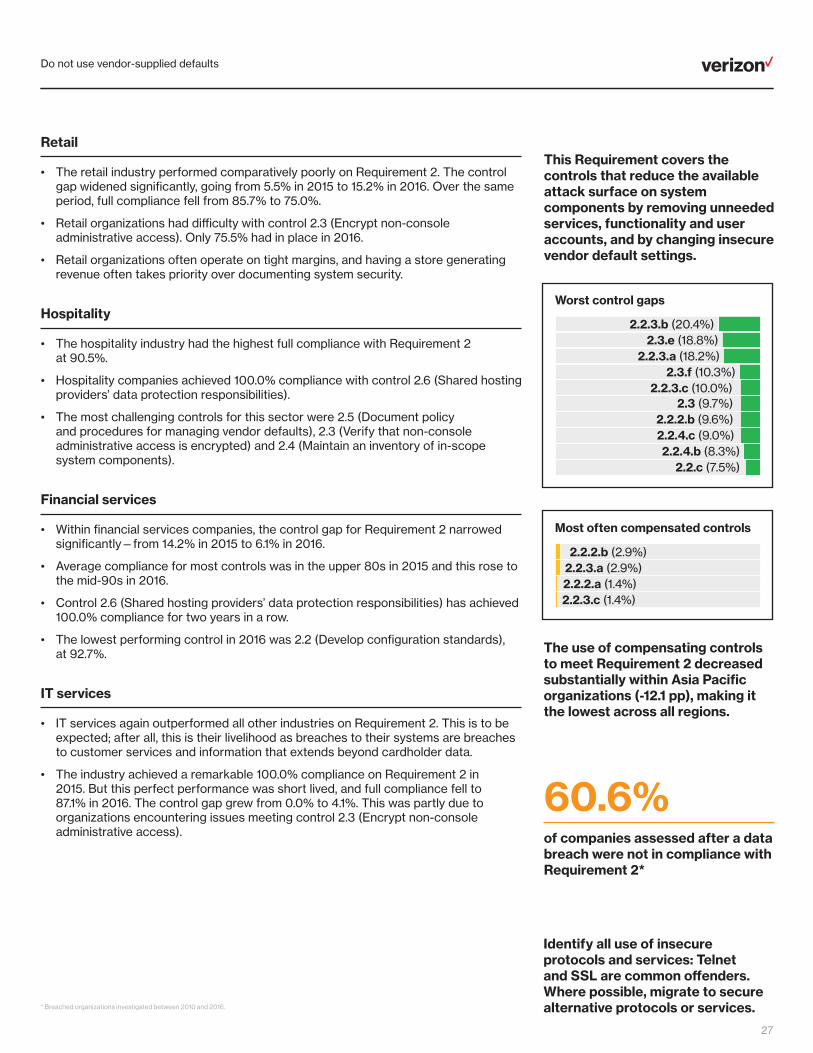
Do not use vendor-supplied defaults
27
Worst control gaps
2.2.3.b (20.4%)2.3.e (18.8%)
2.2.3.a (18.2%)2.3.f (10.3%)
2.2.3.c (10.0%)2.3 (9.7%)
2.2.2.b (9.6%)2.2.4.c (9.0%)2.2.4.b (8.3%)
2.2.c (7.5%)
Retail
• The retail industry performed comparatively poorly on Requirement 2. The control gap widened significantly, going from 5.5% in 2015 to 15.2% in 2016. Over the same period, full compliance fell from 85.7% to 75.0%.
• Retail organizations had difficulty with control 2.3 (Encrypt non-console administrative access). Only 75.5% had in place in 2016.
• Retail organizations often operate on tight margins, and having a store generating revenue often takes priority over documenting system security.
Hospitality
• The hospitality industry had the highest full compliance with Requirement 2 at 90.5%.
• Hospitality companies achieved 100.0% compliance with control 2.6 (Shared hosting providers’ data protection responsibilities).
• The most challenging controls for this sector were 2.5 (Document policy and procedures for managing vendor defaults), 2.3 (Verify that non-console administrative access is encrypted) and 2.4 (Maintain an inventory of in-scope system components).
Financial services
• Within financial services companies, the control gap for Requirement 2 narrowed significantly—from 14.2% in 2015 to 6.1% in 2016.
• Average compliance for most controls was in the upper 80s in 2015 and this rose to the mid-90s in 2016.
• Control 2.6 (Shared hosting providers’ data protection responsibilities) has achieved 100.0% compliance for two years in a row.
• The lowest performing control in 2016 was 2.2 (Develop configuration standards), at 92.7%.
IT services
• IT services again outperformed all other industries on Requirement 2. This is to be expected; after all, this is their livelihood as breaches to their systems are breaches to customer services and information that extends beyond cardholder data.
• The industry achieved a remarkable 100.0% compliance on Requirement 2 in 2015. But this perfect performance was short lived, and full compliance fell to 87.1% in 2016. The control gap grew from 0.0% to 4.1%. This was partly due to organizations encountering issues meeting control 2.3 (Encrypt non-console administrative access).
Most often compensated controls
2.2.2.b (2.9%)2.2.3.a (2.9%)2.2.2.a (1.4%)2.2.3.c (1.4%)
The use of compensating controls to meet Requirement 2 decreased substantially within Asia Pacific organizations (-12.1 pp), making it the lowest across all regions.
This Requirement covers the controls that reduce the available attack surface on system components by removing unneeded services, functionality and user accounts, and by changing insecure vendor default settings.
60.6%of companies assessed after a data breach were not in compliance with Requirement 2*
* Breached organizations investigated between 2010 and 2016.
Identify all use of insecure protocols and services: Telnet and SSL are common offenders. Where possible, migrate to secure alternative protocols or services.

Protect stored cardholder data
28
Full compliance (2016) Year-over-year change (2015-16)
Breakdown by region and industry
Control gap (2016) Year-over-year change (2015-16)
Breakdown by region and industry
Year-over-year change (2015-16)
Breakdown by region and industry
All
Use of compensating controls (’16)
Protect stored cardholder data
28
Financial servicesHospitality
Retail
Asia PacificAmericas
Europe
Financial services
Retail
Hospitality
AmericasAsia PacificEurope
Financial servicesHospitality
Retail
AmericasAsia Pacific
Europe
IT services
IT services
IT services
All
All
7 (93.5%) 5 (92.1%) 4 (86.3%) 9 (84.9%)
2 (81.3%)
6 (77.7%) 12 (77.7%) 3 (77.0%)
8 (83.5%) 10 (83.5%)
11 (71.9%)
4 (10.6%)11 (9.6%)3 (9.2%)2 (7.0%)
12 (5.4%)10 (5.3%)
1 (4.9%)9 (4.5%)8 (4.4%)5 (2.8%)7 (1.4%)
6 (5.1%)
8 (17.3%)
3 (10.8%)2 (8.6%)
6 (6.5%)1 (4.3%)10 (3.6%)11 (3.6%)5 (2.9%)4 (1.4%)9 (1.4%)
7 (0.0%)12 (0.0%)
1 (79.1%)
377.0%
3 (77.0%)
2.0pp improvement (’15–’16)
9.2%0.6pp increase (’15–’16)
3.0pp increase (’15–’16)
10.8%
12.5% to 7.7%
81.8%80.6%
80.3%71.4%80.0%76.2%
65.0% 85.7%
69.2% to 100.0%79.1%62.7%
62.5% 74.4%
7.8%10.6%
4.3% to 21.5%
1.8% to 8.5%
10.5%15.1%6.0% to 0.0%
2.5% to 8.2%
16.7%9.5%0.0% to 5.0%
10.0% to 0.0%
4.7% to 11.9%15.4%12.2%
18.2% to 6.5%
2.4% to 3.9%
Key RequirementProtect stored cardholder data
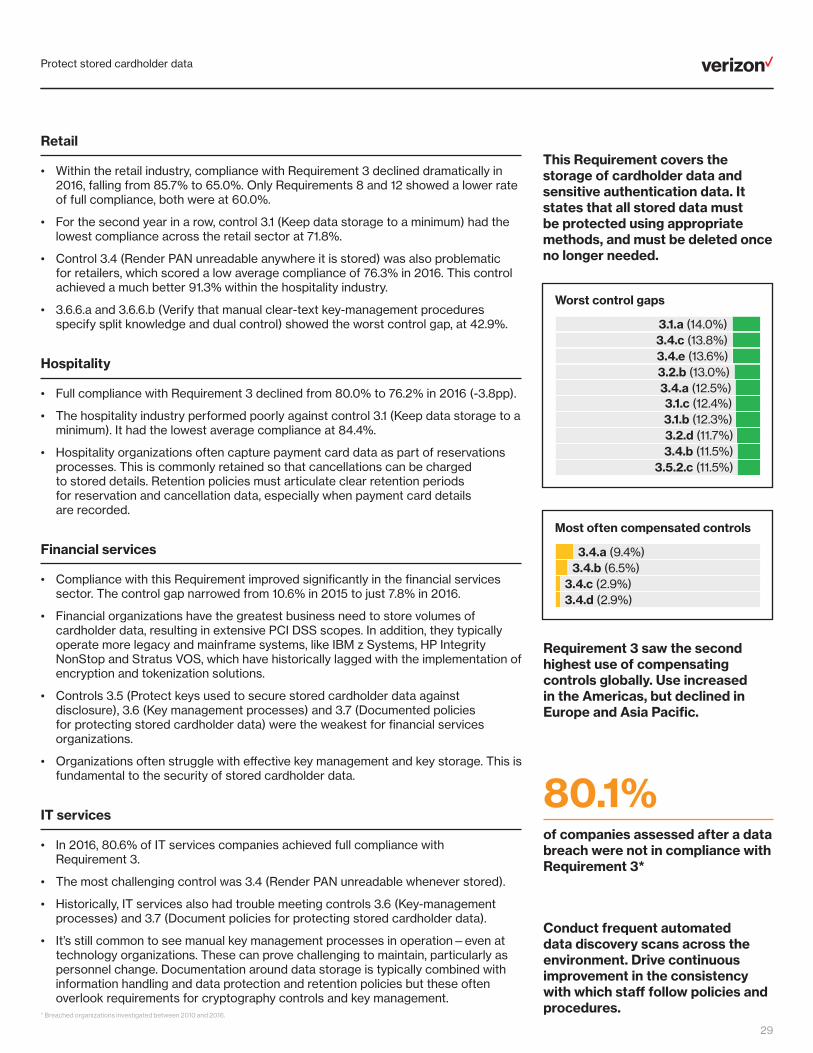
Protect stored cardholder data
29
Worst control gaps
3.1.a (14.0%)3.4.c (13.8%)3.4.e (13.6%)3.2.b (13.0%)3.4.a (12.5%)3.1.c (12.4%)3.1.b (12.3%)3.2.d (11.7%)3.4.b (11.5%)
3.5.2.c (11.5%)
Retail
• Within the retail industry, compliance with Requirement 3 declined dramatically in 2016, falling from 85.7% to 65.0%. Only Requirements 8 and 12 showed a lower rate of full compliance, both were at 60.0%.
• For the second year in a row, control 3.1 (Keep data storage to a minimum) had the lowest compliance across the retail sector at 71.8%.
• Control 3.4 (Render PAN unreadable anywhere it is stored) was also problematic for retailers, which scored a low average compliance of 76.3% in 2016. This control achieved a much better 91.3% within the hospitality industry.
• 3.6.6.a and 3.6.6.b (Verify that manual clear-text key-management procedures specify split knowledge and dual control) showed the worst control gap, at 42.9%.
Hospitality
• Full compliance with Requirement 3 declined from 80.0% to 76.2% in 2016 (-3.8pp).
• The hospitality industry performed poorly against control 3.1 (Keep data storage to a minimum). It had the lowest average compliance at 84.4%.
• Hospitality organizations often capture payment card data as part of reservations processes. This is commonly retained so that cancellations can be charged to stored details. Retention policies must articulate clear retention periods for reservation and cancellation data, especially when payment card details are recorded.
Financial services
• Compliance with this Requirement improved significantly in the financial services sector. The control gap narrowed from 10.6% in 2015 to just 7.8% in 2016.
• Financial organizations have the greatest business need to store volumes of cardholder data, resulting in extensive PCI DSS scopes. In addition, they typically operate more legacy and mainframe systems, like IBM z Systems, HP Integrity NonStop and Stratus VOS, which have historically lagged with the implementation of encryption and tokenization solutions.
• Controls 3.5 (Protect keys used to secure stored cardholder data against disclosure), 3.6 (Key management processes) and 3.7 (Documented policies for protecting stored cardholder data) were the weakest for financial services organizations.
• Organizations often struggle with effective key management and key storage. This is fundamental to the security of stored cardholder data.
IT services
• In 2016, 80.6% of IT services companies achieved full compliance with Requirement 3.
• The most challenging control was 3.4 (Render PAN unreadable whenever stored).
• Historically, IT services also had trouble meeting controls 3.6 (Key-management processes) and 3.7 (Document policies for protecting stored cardholder data).
• It’s still common to see manual key management processes in operation—even at technology organizations. These can prove challenging to maintain, particularly as personnel change. Documentation around data storage is typically combined with information handling and data protection and retention policies but these often overlook requirements for cryptography controls and key management.
Most often compensated controls
3.4.a (9.4%)3.4.b (6.5%)
3.4.c (2.9%)3.4.d (2.9%)
Requirement 3 saw the second highest use of compensating controls globally. Use increased in the Americas, but declined in Europe and Asia Pacific.
Conduct frequent automated data discovery scans across the environment. Drive continuous improvement in the consistency with which staff follow policies and procedures.
This Requirement covers the storage of cardholder data and sensitive authentication data. It states that all stored data must be protected using appropriate methods, and must be deleted once no longer needed.
80.1%of companies assessed after a data breach were not in compliance with Requirement 3*
* Breached organizations investigated between 2010 and 2016.

Protect data in transit
30
Full compliance (2016) Year-over-year change (2015-16)
Breakdown by region and industry
Control gap (2016) Year-over-year change (2015-16)
Breakdown by region and industry
Year-over-year change (2015-16)
Breakdown by region and industry
All
Use of compensating controls (’16)
Protect data in transit
30
Financial servicesHospitality
Retail
Asia PacificAmericas
Europe
Financial services
Retail
Hospitality
AmericasAsia PacificEurope
Financial servicesHospitality
Retail
AmericasAsia Pacific
Europe
IT services
IT services
IT services
All
All
7 (93.5%) 5 (92.1%) 4 (86.3%) 9 (84.9%)
2 (81.3%)
6 (77.7%) 12 (77.7%) 3 (77.0%)
8 (83.5%) 10 (83.5%)
11 (71.9%)
4 (10.6%)11 (9.6%)3 (9.2%)2 (7.0%)
12 (5.4%)10 (5.3%)
1 (4.9%)9 (4.5%)8 (4.4%)5 (2.8%)7 (1.4%)
6 (5.1%)
8 (17.3%)
3 (10.8%)2 (8.6%)
6 (6.5%)1 (4.3%)10 (3.6%)11 (3.6%)5 (2.9%)4 (1.4%)9 (1.4%)
7 (0.0%)12 (0.0%)
1 (79.1%)
Key RequirementProtect data in transit 4
4 (86.3%) 6.6pp improvement (’15–’16)
10.6%2.4pp decrease (’15–’16)
1.4pp increase (’15–’16)
1.4%
86.4%75.0%
15.9%16.9%0.0% to 0.0%
0.0% to 1.7%
0.0% to 2.6%
17.3%
7.4%12.4%13.3%
10.7%
7.8%
0.0% to 0.0%
0.0% to 3.0%
0.0% to 0.0%
86.3%
0.0% to 0.0%
71.4% 86.4%80.0% 90.5%
80.0% 85.7%
100.0% to 100.0%78.0%74.4%
23.0% 10.2%
0.0% to 0.0%
90.3%81.8%
9.7%27.4%

Protect data in transit
31
Worst control gaps
4.1.1 (16.7%)4.1.h (15.4%)4.1.a (14.7%)4.1.f (13.5%)4.1.c (12.5%)4.1.b (12.4%)4.1.d (11.5%)4.1.e (11.5%)4.1.g (10.2%)
4.1.i (9.2%)
Retail
• Requirement 4 had an abysmal performance in the retail industry. It was the least compliant key requirement, with just 80.0% of companies assessed found to be fully compliant. This was the lowest score for any of the key industries.
• Between 2015 and 2016, the control gap widened by 12.8pp to 23.0%. This made it the largest gap for any Requirement across the four key industries.
• While control 4.3 (Procedures for encrypting transmissions of cardholder data) retained a good 95.0% industry average compliance, controls 4.1 (Use strong cryptography and protocols) and 4.2 (Never send unprotected PANs by end-user messaging) saw a decline of about 20pp from 2015, reaching a low 66.7% in 2016.
Hospitality
• The hospitality sector outperformed all other key industries achieving 90.5% full compliance with Requirement 4. This was a significant 10.5pp improvement from 2015.
• The hospitality industry achieved 92.7% full compliance with controls 4.1 (Use strong cryptography and protocols) and 4.2 (Never send unprotected PANs by end-user messaging), but a poor 85.7% with control 4.3 (Procedures for encrypting transmissions of cardholder data).
• None of the hospitality organizations we assessed applied a compensating control to meet Requirement 4.
Financial services
• The financial services industry achieved the lowest control gap of all key industries for Requirement 4 in 2016, just 7.8%. This was a significant improvement from 2015, when less than three-quarters of financial services organizations (71.4%) were fully compliant with Requirement 4, and the control gap was 12.4%.
• In 2016, the worst performance was with control 4.1.a (Identify all locations where cardholder data is transmitted or received over open/public networks and verify the use of strong cryptography), which 11.5% of companies failed.
• It’s important to remember that you are responsible for customer data while it is in your possession, and properly configuring systems that directly handle cardholder data is paramount.
IT services
• While improved, Requirement 4 remains the worst within the IT services industry, with a control gap of 9.7%. But this was a massive improvement on 2015, when the gap was 27.4%.
• Controls 4.1 (Use strong cryptography and protocols) and 4.2 (Never send unprotected PANs by end-user messaging) were the least compliant controls within the IT services industry. Many organizations did not go past the initial configuration of servers that oversee, or directly interact with, cardholder data.
Most often compensated controls
4.1.i (1.4%)
A greater proportion of organizations in Europe (2.6%) applied compensating controls to meet Requirement 4 than in the Americas (1.7%) or Asia Pacific (0.0%).
This Requirement is designed to protect cardholder data and sensitive authentication data transmitted over unprotected networks, such as the internet, where attackers could intercept it.
20.8%of companies assessed after a data breach were not in compliance with Requirement 4*
* Breached organizations investigated between 2010 and 2016.
WEP and SSL are no longer considered to be secure and must be removed from all existing wireless network configurations.

Protect against malicious software
32
Full compliance (2016) Year-over-year change (2015-16)
Breakdown by region and industry
Control gap (2016) Year-over-year change (2015-16)
Breakdown by region and industry
Year-over-year change (2015-16)
Breakdown by region and industry
All
Use of compensating controls (’16)
Protect against malicious software
32
Financial servicesHospitality
Retail
Asia PacificAmericas
Europe
Financial services
Retail
Hospitality
AmericasAsia PacificEurope
Financial servicesHospitality
Retail
AmericasAsia Pacific
Europe
IT services
IT services
IT services
All
All
7 (93.5%) 5 (92.1%) 4 (86.3%) 9 (84.9%)
2 (81.3%)
6 (77.7%) 12 (77.7%) 3 (77.0%)
8 (83.5%) 10 (83.5%)
11 (71.9%)
4 (10.6%)11 (9.6%)3 (9.2%)2 (7.0%)
12 (5.4%)10 (5.3%)
1 (4.9%)9 (4.5%)8 (4.4%)5 (2.8%)7 (1.4%)
6 (5.1%)
8 (17.3%)
3 (10.8%)2 (8.6%)
6 (6.5%)1 (4.3%)10 (3.6%)11 (3.6%)5 (2.9%)4 (1.4%)9 (1.4%)
7 (0.0%)12 (0.0%)
1 (79.1%)
0.1pp increase (’15–’16)
Key RequirementProtect against malicious software 5
5 (92.1%)1.5pp improvement (’15–’16)
85.7% to 93.9%100.0% to 95.2%
92.9% to 85.0%
2.8%
0.8% to 9.8%
1.3pp increase (’15–’16)
2.9%
92.3%87.5%92.3% to 100.0%
90.7%86.4%
2.3% to 5.1%
0.0% to 0.0%
3.6% to 2.2%
0.0% to 2.4%
4.8% to 3.0%
0.0% to 4.8%
0.0% to 0.0%
92.1%
100.0% to 90.3%
0.0% to 1.9%
0.0% to 3.2%
0.0% to 0.4%
1.8% to 5.5%3.7% to 0.0%
6.0% to 1.6%

Protect against malicious software
33
Worst control gaps
5.2.a (4.6%)5.2.c (4.6%)5.2.d (4.6%)5.2.b (3.8%)
5.1 (3.1%)5.4 (3.0%)
5.3.a (2.3%)5.1.1 (1.5%)
5.3.b (1.5%)5.1.2 (0.8%)
Retail
• The retail industry achieved only 85.0% full compliance for Requirement 5 in 2016, a drop of 7.9pp from 2015.
• This sector struggled with very low performance (81.3%) for controls 5.2 (Maintain all anti-virus mechanisms) and 5.4 (Document policies for malware protection).
• Retail organizations often have hundreds of workstations and servers, and this can be constantly changing. Managing and maintaining malware protection mechanisms on a widely distributed estate can be a challenge, especially when systems may be offline for periods of time. This can make it hard for even the best teams to sustain compliance.
Hospitality
• 95.2% of hospitality companies achieved full compliance with Requirement 5 in 2016.
• The industry had a control gap of just 0.4%—though this was up on its perfect score in 2015.
• Hospitality organizations achieved 100.0% compliance for controls 5.1 through 5.3, but fell short against control 5.4 (Document policies for malware protection) with a 4.8% control gap.
Financial services
• The financial services industry kept an average of 97.8% of controls in place under Requirement 5, making it the second most compliant for this sector.
• There were a small number of failures noted across controls 5.1 through 5.3, but the companies we assessed achieved 100.0% compliance with control 5.4 (Document policies for malware protection).
• Financial services organizations often have more legacy components in their environment than other industries, and so may need to deploy more than one anti-virus solution or a mixture of versions. This makes it harder to maintain than a single centrally managed solution.
IT services
• The IT services industry had all Requirement 5 controls in place in 2015, but 2016 figures show a compliance gap of 1.9%.
• A significant contributor to this was a drop in compliance with control 5.2 (Maintain all anti-virus mechanisms) from 100.0% in 2015 to 95.7% in 2016.
• It was a surprise to see this drop in compliance, since the deployment of malware protection systems is considered to be a core component of a secure managed IT service.
Most often compensated controls
5.1 (2.9%)
5.1% of organizations in the Americas applied one or more compensating controls to meet Requirement 5. In comparison to 0.0% in Europe, and 3.3% in Asia Pacific. Only service providers applied compensating controls to meet this Requirement.
This Requirement concerns protecting all systems commonly affected by malicious software (malware) against viruses, worms and trojans.
64.4%of companies assessed after a data breach were not in compliance with Requirement 5*
* Breached organizations investigated between 2010 and 2016.
Automate virus definition updates using centralized anti-virus management technologies and restrict the operation of systems running outdated definitions.

Develop and maintain secure systems
34
Full compliance (2016) Year-over-year change (2015-16)
Breakdown by region and industry
Control gap (2016) Year-over-year change (2015-16)
Breakdown by region and industry
Year-over-year change (2015-16)
Breakdown by region and industry
All
Use of compensating controls (’16)
Develop and maintain secure systems
34
Financial servicesHospitality
Retail
Asia PacificAmericas
Europe
Financial services
Retail
Hospitality
AmericasAsia PacificEurope
Financial servicesHospitality
Retail
AmericasAsia Pacific
Europe
IT services
IT services
IT services
All
All
7 (93.5%) 5 (92.1%) 4 (86.3%) 9 (84.9%)
2 (81.3%)
6 (77.7%) 12 (77.7%) 3 (77.0%)
8 (83.5%) 10 (83.5%)
11 (71.9%)
4 (10.6%)11 (9.6%)3 (9.2%)2 (7.0%)
12 (5.4%)10 (5.3%)
1 (4.9%)9 (4.5%)8 (4.4%)5 (2.8%)7 (1.4%)
6 (5.1%)
8 (17.3%)
3 (10.8%)2 (8.6%)
6 (6.5%)1 (4.3%)10 (3.6%)11 (3.6%)5 (2.9%)4 (1.4%)9 (1.4%)
7 (0.0%)12 (0.0%)
1 (79.1%)
Key RequirementDevelop and maintain secure systems 6
6 (77.7%)
7.4pp improvement (’15–’16)
75.0% 78.6%
5.1%0.5pp decrease (’15–’16)
4.4% to 16.3%
0.2pp increase (’15–’16)
6.5%
82.1%
78.8%
25.0% to 5.1%
61.9%
62.5%
61.9%60.0%
84.6% to 97.6%67.4%61.0%
8.2%1.1% to 0.2%
0.0% to 10.2%
4.8% to 5.2%
3.7% to 5.9%8.6% to 6.6%
15.4% to 2.4%
14.3% to 6.1%
0.0% to 19.0%
0.0% to 5.0%
77.7%
6.9%
87.1%
1.2% to 0.6%
9.1% to 0.0%
90.9%

Develop and maintain secure systems
35
Worst control gaps
6.6 (14.1%)6.5.c (10.5%)6.2.b (10.0%)
6.3.2.b (9.5%)6.5.a (8.6%)
6.4.5.b (6.8%)6.3.2.a (6.7%)
6.5.d (6.7%)6.2.a (6.1%)
6.5.6 (5.8%)
Retail
• 75.0% of retail organizations achieved full compliance with Requirement 6, a drop of 3.6pp from 2015.
• Retailers failed to comply with about one in six expected controls (gap 16.3%).
• Control 6.6 (Protect public-facing web applications against known attacks) was the one that retailers struggled with the most.
• Pressure to maintain customer-facing systems can lead to proper change control procedures not being followed. Retailers must ensure that all changes are approved by authorized personnel and managed using a formal change control process.
Hospitality
• Requirement 6 was the weakest key requirements for the hospitality industry. Just 61.9% of organizations achieved full compliance at interim assessment in 2016—14.3pp behind the next lowest. This was a small improvement over 2015 (+1.9pp).
• Hospitality organizations failed to implement effective web app protection. Control 6.6 (Protect public-facing web apps against known attacks) was the weakest within this Requirement, followed by control 6.3 (Develop secure software applications).
• With online booking growing, it’s important that hospitality companies consider investing in web application firewalls and skilled application developers.
Financial services
• The control gap in financial services was 3.7%, an improvement from 5.9% in 2015.
• Financial services companies performed best on control 6.3 (Develop secure software applications), which had a control gap of just 2.2%.
• Control 6.6 mandates either the implementation of a web application firewall or independent vulnerability assessment of web apps after “any change”—not, as elsewhere in the PCI DSS, only after “any significant change.” It showed the lowest compliance within this Requirement, with a control gap of 11.8%.
• With public web apps such a target for malicious activity and given the sensitive nature of the data handled by financial services, it is important that organizations invest the time and money needed to implement and sustain effective defenses.
IT services
• The IT services industry did well on Requirement 6, with a control gap of just 2.9%.
• The sector achieved 100.0% compliance with a number of Requirement 6 controls: 6.1 (Use reputable outside sources used for vulnerability information), 6.4 (Follow change control processes), 6.6 (Protect public-facing web apps against known attacks), and 6.7 (Policies and procedures for secure systems and applications).
• The control that gave IT services companies the most problems was 6.2.b (Ensure all critical patches are installed within one month and all applicable patches within an appropriate timeframe). But even here, the control gap was only 6.9%.
• Despite strong development and change control procedures, control 6.2 (Protect components and software from known vulnerabilities) was in the “Bottom 20” list for IT services.
• Patching systems against known security vulnerabilities is a core part of maintaining a secure environment.
9.1% of services providers used one or more compensating controls to meet Requirement 6, compared with 0.0% of merchants. Regionally, organizations in the Americas were twice as likely to apply compensating controls as those in Europe (10.2% vs 5.1%).
This Requirement covers the security of applications, and particularly change management. It governs how systems and applications are developed and maintained, whether by the organization or a third party.
82.2%of companies assessed after a data breach were not in compliance with Requirement 6*
* Breached organizations investigated between 2010 and 2016.
Sign up to vendor security notifications; most support an email alert service or RSS feed and many offer tailored feeds based on specific solutions or technologies. Automate monitoring these alerts and ensure they are reviewed daily.
6.2.b (4.3%)6.2.a (2.9%)
6.3.b (0.7%)
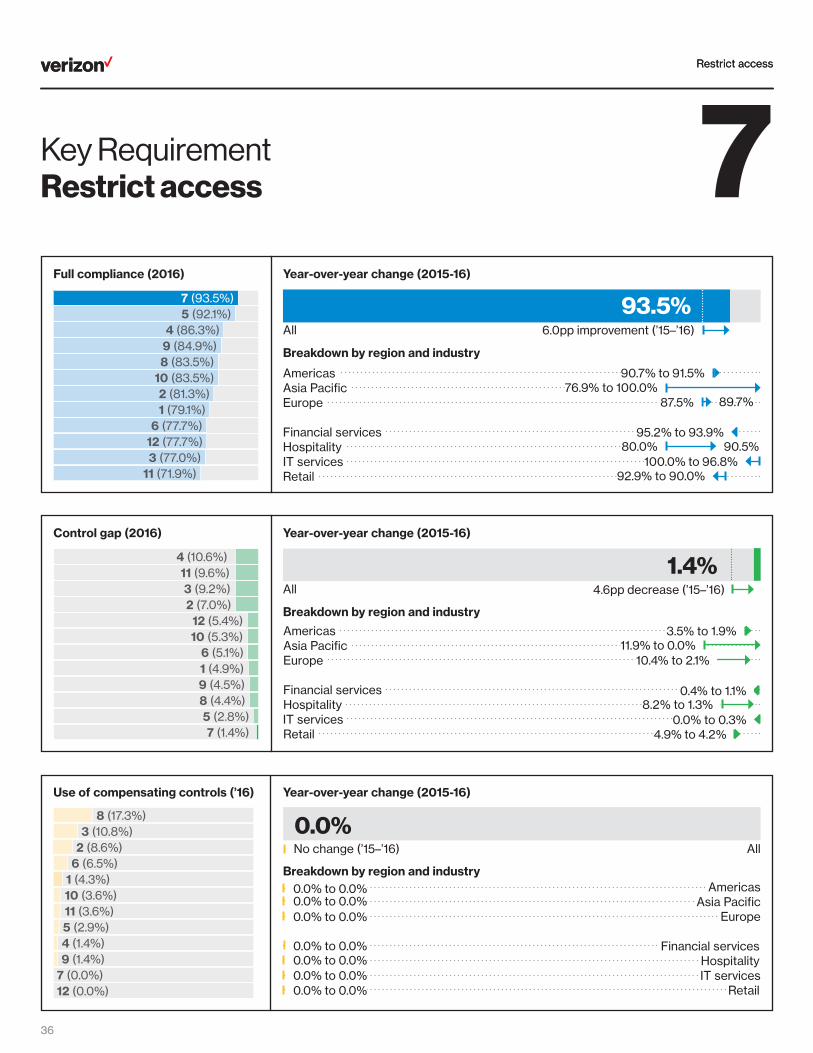
Restrict access
36
Full compliance (2016) Year-over-year change (2015-16)
Breakdown by region and industry
Control gap (2016) Year-over-year change (2015-16)
Breakdown by region and industry
Year-over-year change (2015-16)
Breakdown by region and industry
All
Use of compensating controls (’16)
Restrict access
36
Financial servicesHospitality
Retail
Asia PacificAmericas
Europe
Financial services
Retail
Hospitality
AmericasAsia PacificEurope
Financial servicesHospitality
Retail
AmericasAsia Pacific
Europe
IT services
IT services
IT services
All
All
7 (93.5%) 5 (92.1%) 4 (86.3%) 9 (84.9%)
2 (81.3%)
6 (77.7%) 12 (77.7%) 3 (77.0%)
8 (83.5%) 10 (83.5%)
11 (71.9%)
4 (10.6%)11 (9.6%)3 (9.2%)2 (7.0%)
12 (5.4%)10 (5.3%)
1 (4.9%)9 (4.5%)8 (4.4%)5 (2.8%)7 (1.4%)
6 (5.1%)
8 (17.3%)
3 (10.8%)2 (8.6%)
6 (6.5%)1 (4.3%)10 (3.6%)11 (3.6%)5 (2.9%)4 (1.4%)9 (1.4%)
7 (0.0%)12 (0.0%)
1 (79.1%)
Key RequirementRestrict access 7
7 (93.5%)
6.0pp improvement (’15–’16)
92.9% to 90.0%
1.4%4.6pp decrease (’15–’16)
4.9% to 4.2%
No change (’15–’16)
0.0%
89.7%
90.5%
87.5%
95.2% to 93.9%80.0%
76.9% to 100.0%90.7% to 91.5%
3.5% to 1.9%11.9% to 0.0%
10.4% to 2.1%
0.4% to 1.1%8.2% to 1.3%
93.5%
0.0% to 0.0%
0.0% to 0.0%0.0% to 0.0%
0.0% to 0.0%
0.0% to 0.0%
0.0% to 0.0%
100.0% to 96.8%
0.0% to 0.3%
0.0% to 0.0%

Restrict access
37
Worst control gaps
7.1.1 (3%)7.3 (3%)
7.1.2.b (1.5%)7.1.4 (1.5%)7.2.1 (1.5%)
7.2 (1.5%)7.1 (0.8%)
7.1.2.a (0.8%)7.2.2 (0.8%)7.2.3 (0.8%)
Retail
• The retail industry achieved its strongest performance with Requirement 7. 90.0% of the organizations that we assessed achieved full compliance at interim assessment. This was a 2.9pp drop from 2015.
• Retail organizations were least compliant with control 7.3 (Policies and procedures for restricting access to cardholder data), where the control gap was 11.1%.
• Most organizations have strong access control systems in place, but these can become weaker as they are stretched to more locations outside of the corporate headquarters.
Hospitality
• The hospitality industry performed strongly against Requirement 7. 90.5% of the companies we assessed achieved full compliance at interim assessment. This was a significant 10.5pp improvement from the previous year.
• Organizations in this sector achieved high average compliance against controls 7.1 (Limit access to system components) (97.9%) and 7.2 (Access control system based on need to know, set to deny all) (100.0%).
• As for retail organizations, hospitality companies struggled most with 7.3 (Policies and procedures for restricting access to CHD) where the control gap was 6.2%.
• Both sectors often have widely dispersed estates, and ensuring that satellite locations follow domain policies can sometimes prove difficult.
Financial services
• The control gap in financial services was just 0.4% in 2015. This rose to 1.1% in 2016.
• Financial services achieved 100.0% for 7.1 (Limit access to system components). Failures against 7.2 (Access control system based on need to know, set to deny all) and 7.3 (Policies and procedures for restricting access to CHD) were to blame for the increased control gap.
• Most financial services organizations have robust and secure access-control mechanisms in place. But often these are not configured specifically for PCI DSS compliance, and assessments often find that some tweaks are necessary.
IT services
• 96.8% of IT services companies achieved full compliance across Requirement 7. This was a small decrease from 2015, when 100.0% achieved full compliance. This drop was solely due to failures against 7.1.1 (Define access needs for each role).
• IT organizations are generally proficient at assigning and managing access permissions over time. That’s to be expected, as it’s a critical part of any IT service offering. They also are less likely to be burdened with legacy systems, making compliance with these controls easier.
• Because they typically have a smaller pool of employees with access to cardholder data, and are responsible for the security of the CDE, role-based access control (RBAC) is easier to manage.
Worldwide, no organization applied a compensating control to meet Requirement 7—likewise with Requirement 12.
This Requirement specifies the processes and controls that should restrict each user’s access rights to the minimum they need to perform their duties—a “need to know” basis.
67.6%of companies assessed after a data breach were not in compliance with Requirement 7*
* Breached organizations investigated between 2010 and 2016.
Most often compensated controls
All 0.0%
Establish access matrices mapping access requirements to job roles. These form the basis of effective role-based access control. Additional permissions should only be added with appropriate approvals.
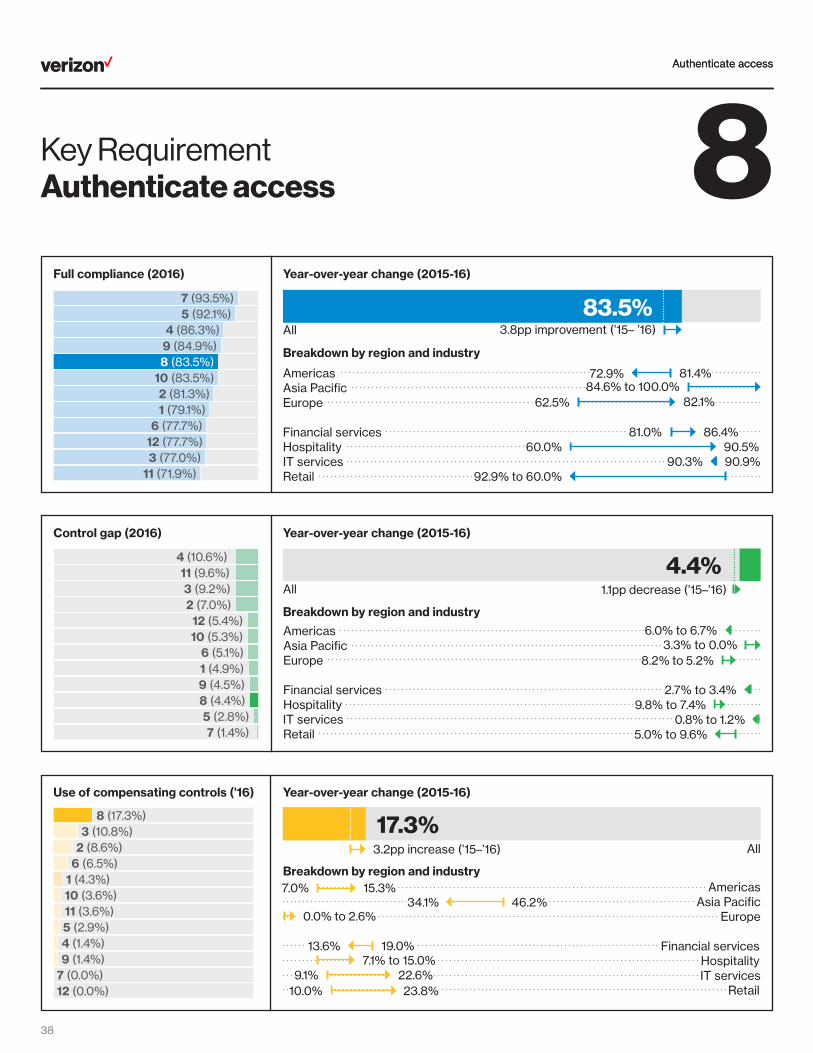
Authenticate access
38
Full compliance (2016) Year-over-year change (2015-16)
Breakdown by region and industry
Control gap (2016) Year-over-year change (2015-16)
Breakdown by region and industry
Year-over-year change (2015-16)
Breakdown by region and industry
All
Use of compensating controls (’16)
Authenticate access
38
Financial servicesHospitality
Retail
Asia PacificAmericas
Europe
Financial services
Retail
Hospitality
AmericasAsia PacificEurope
Financial servicesHospitality
Retail
AmericasAsia Pacific
Europe
IT services
IT services
IT services
All
All
7 (93.5%) 5 (92.1%) 4 (86.3%) 9 (84.9%)
2 (81.3%)
6 (77.7%) 12 (77.7%) 3 (77.0%)
8 (83.5%) 10 (83.5%)
11 (71.9%)
4 (10.6%)11 (9.6%)3 (9.2%)2 (7.0%)
12 (5.4%)10 (5.3%)
1 (4.9%)9 (4.5%)8 (4.4%)5 (2.8%)7 (1.4%)
6 (5.1%)
8 (17.3%)
3 (10.8%)2 (8.6%)
6 (6.5%)1 (4.3%)10 (3.6%)11 (3.6%)5 (2.9%)4 (1.4%)9 (1.4%)
7 (0.0%)12 (0.0%)
1 (79.1%)
8 8 (83.5%)
3.8pp improvement (’15– ’16)
92.9% to 60.0%
4.4%1.1pp decrease (’15–’16)
5.0% to 9.6%
82.1%
86.4%
81.4%
90.5%
62.5%
81.0%60.0%
84.6% to 100.0%72.9%
6.0% to 6.7%3.3% to 0.0%
8.2% to 5.2%
2.7% to 3.4%9.8% to 7.4%
83.5%
3.2pp increase (’15–’16)
17.3%
0.0% to 2.6%
15.3%46.2%
19.0%
23.8%
7.1% to 15.0%
7.0%34.1%
13.6%
90.9%90.3%
0.8% to 1.2%
22.6%9.1%10.0%
Key RequirementAuthenticate access
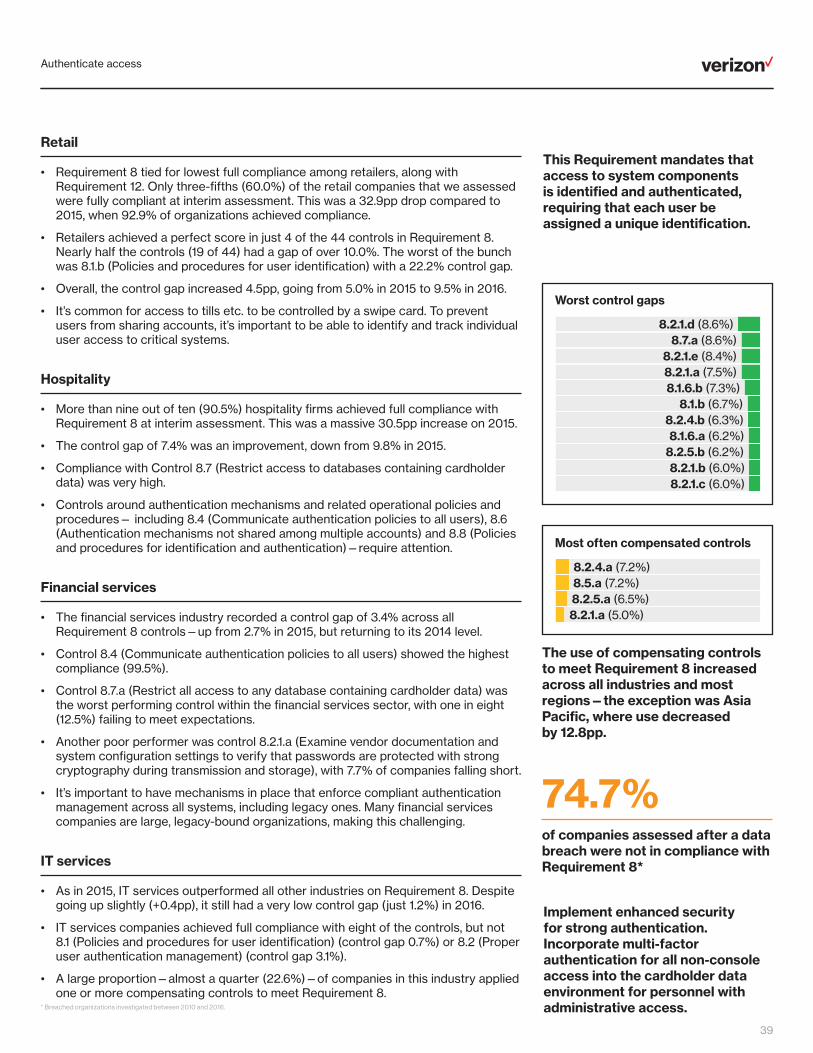
Authenticate access
39
Worst control gaps
8.2.1.d (8.6%)8.7.a (8.6%)
8.2.1.e (8.4%)8.2.1.a (7.5%)8.1.6.b (7.3%)
8.1.b (6.7%)8.2.4.b (6.3%)8.1.6.a (6.2%)
8.2.5.b (6.2%)8.2.1.b (6.0%)
Retail
• Requirement 8 tied for lowest full compliance among retailers, along with Requirement 12. Only three-fifths (60.0%) of the retail companies that we assessed were fully compliant at interim assessment. This was a 32.9pp drop compared to 2015, when 92.9% of organizations achieved compliance.
• Retailers achieved a perfect score in just 4 of the 44 controls in Requirement 8. Nearly half the controls (19 of 44) had a gap of over 10.0%. The worst of the bunch was 8.1.b (Policies and procedures for user identification) with a 22.2% control gap.
• Overall, the control gap increased 4.5pp, going from 5.0% in 2015 to 9.5% in 2016.
• It’s common for access to tills etc. to be controlled by a swipe card. To prevent users from sharing accounts, it’s important to be able to identify and track individual user access to critical systems.
Hospitality
• More than nine out of ten (90.5%) hospitality firms achieved full compliance with Requirement 8 at interim assessment. This was a massive 30.5pp increase on 2015.
• The control gap of 7.4% was an improvement, down from 9.8% in 2015.
• Compliance with Control 8.7 (Restrict access to databases containing cardholder data) was very high.
• Controls around authentication mechanisms and related operational policies and procedures— including 8.4 (Communicate authentication policies to all users), 8.6 (Authentication mechanisms not shared among multiple accounts) and 8.8 (Policies and procedures for identification and authentication)—require attention.
Financial services
• The financial services industry recorded a control gap of 3.4% across all Requirement 8 controls—up from 2.7% in 2015, but returning to its 2014 level.
• Control 8.4 (Communicate authentication policies to all users) showed the highest compliance (99.5%).
• Control 8.7.a (Restrict all access to any database containing cardholder data) was the worst performing control within the financial services sector, with one in eight (12.5%) failing to meet expectations.
• Another poor performer was control 8.2.1.a (Examine vendor documentation and system configuration settings to verify that passwords are protected with strong cryptography during transmission and storage), with 7.7% of companies falling short.
• It’s important to have mechanisms in place that enforce compliant authentication management across all systems, including legacy ones. Many financial services companies are large, legacy-bound organizations, making this challenging.
IT services
• As in 2015, IT services outperformed all other industries on Requirement 8. Despite going up slightly (+0.4pp), it still had a very low control gap (just 1.2%) in 2016.
• IT services companies achieved full compliance with eight of the controls, but not 8.1 (Policies and procedures for user identification) (control gap 0.7%) or 8.2 (Proper user authentication management) (control gap 3.1%).
• A large proportion—almost a quarter (22.6%)—of companies in this industry applied one or more compensating controls to meet Requirement 8.
The use of compensating controls to meet Requirement 8 increased across all industries and most regions—the exception was Asia Pacific, where use decreased by 12.8pp.
This Requirement mandates that access to system components is identified and authenticated, requiring that each user be assigned a unique identification.
74.7%of companies assessed after a data breach were not in compliance with Requirement 8*
* Breached organizations investigated between 2010 and 2016.
Most often compensated controls
8.2.4.a (7.2%)8.5.a (7.2%)8.2.5.a (6.5%)8.2.1.a (5.0%)
Implement enhanced security for strong authentication. Incorporate multi-factor authentication for all non-console access into the cardholder data environment for personnel with administrative access.
8.2.1.c (6.0%)

Control physical access
40
Full compliance (2016) Year-over-year change (2015-16)
Breakdown by region and industry
Control gap (2016) Year-over-year change (2015-16)
Breakdown by region and industry
Year-over-year change (2015-16)
Breakdown by region and industry
All
Use of compensating controls (’16)
Control physical access
40
Financial servicesHospitality
Retail
Asia PacificAmericas
Europe
Financial services
Retail
Hospitality
AmericasAsia PacificEurope
Financial servicesHospitality
Retail
AmericasAsia Pacific
Europe
IT services
IT services
IT services
All
All
7 (93.5%) 5 (92.1%) 4 (86.3%) 9 (84.9%)
2 (81.3%)
6 (77.7%) 12 (77.7%) 3 (77.0%)
8 (83.5%) 10 (83.5%)
11 (71.9%)
4 (10.6%)11 (9.6%)3 (9.2%)2 (7.0%)
12 (5.4%)10 (5.3%)
1 (4.9%)9 (4.5%)8 (4.4%)5 (2.8%)7 (1.4%)
6 (5.1%)
8 (17.3%)
3 (10.8%)2 (8.6%)
6 (6.5%)1 (4.3%)10 (3.6%)11 (3.6%)5 (2.9%)4 (1.4%)9 (1.4%)
7 (0.0%)12 (0.0%)
1 (79.1%)
Key RequirementControl physical access 9
9 (84.9%)2.1pp improvement (’15–’16)
4.5%1.5pp increase (’15–’16)
1.5% to 13.3%
87.2%
89.4%
79.1%
76.2%
85.7%
75.0%
81.0%60.0%
70.0%
97.6% to 100.0%74.6%
3.4% to 6.3%0.0% to 0.1%
5.2% to 5.6%
3.1% to 1.6%6.5% to 6.6%
84.9%
1.4%
2.3% to 3.4%
10.0% to 0.0%
0.0% to 10.0%
0.1pp reduction (’15–’16)
0.0% to 0.0%0.0% to 0.0%
0.0% to 0.0%
100.0% to 90.3%
0.0% to 2.8%
0.0% to 0.0%

Control physical access
41
Worst control gaps
9.9.3.a (23.5%)9.9.2.a (21.9%)
9.9 (21.2%)9.9.3.b (20.6%)
9.9.2.b (18.8%)9.9.1.a (15.2%)9.9.1.b (15.2%)9.9.1.c (15.2%)9.5.1.b (12.3%)9.5.1.a (10.6%)
Retail
• The retail industry suffered a 15.7pp decline in full compliance at interim assessment in 2016, with just 70.0% of organizations meeting the mark.
• The control gap in retail was 13.3%, an increase of 11.8pp from 2015.
• Controls 9.5 (Physically secure all media) and 9.9 (Protect devices that capture payment card data from tampering and substitution) presented the greatest challenges to companies for the retail sector.
• It comes as a surprise that retail organizations seemed to struggle in meeting control 9.5 (Provision of secure storage for physical media is critical where hardcopy card data is retained). As with all data captured, it’s important to verify that the data is genuinely needed. If not, don’t keep it and ensure it is properly destroyed.
Hospitality
• The hospitality sector improved on its 2015 performance (60.0%), with 76.2% of organizations achieving full compliance at interim assessment in 2016 (+16.2pp).
• The compliance gap for the sector was 6.6% in 2016, almost identical to 2015.
• The least compliant controls for this sector were 9.2 (Distinguish between on-site personnel and visitors) and 9.9 (Protect data capture devices; tampering/substitution) at 83.3% and 77.1% average compliance respectively.
• Control 9.9 (Protect devices that capture payment card data from tampering and substitution) is a relatively recent addition to the PCI DSS—it came into force in July 2015—and it has taken time for retail and hospitality companies to enforce due to the large number of card capture devices in use.
Financial services
• Financial services companies achieved close to 100.0% compliance with a number of controls, including: 9.1 (Use appropriate facility entry controls), 9.3 (Control physical access for on-site personnel) and 9.4 (Identify and authorize visitors).
• More than one in five (22.2%) companies failed control 9.9.3 (Provide training for personnel to be aware of attempted tampering or replacement of devices). Organizations need to have embedded sustainable processes to manage their terminals and ensure all personnel are appropriately trained.
• Financial services organizations also struggled with controls 9.7 (Control storage and accessibility of media) and 9.8 (Destroy media when no longer needed). It’s a concern that these fundamental controls are not in place as standard business practice as financial companies handle a lot of sensitive information.
IT services
• The companies we assessed achieved 100.0% compliance with a number of controls in Requirement 9, including: 9.6 (Control distribution of media), 9.7 (Control storage and accessibility of media), 9.8 (Destroy media when no longer needed) and 9.10 (Document policy restricting physical access to cardholder data).
• Control 9.9 (Protect data capture devices against tampering and substitution) was reported as not applicable by all the IT service organizations we assessed.
• IT service organizations performed least well against control 9.5 (Physically secure all media). IT service organizations typically operate in fairly secure premises, with strong physical access controls restricting entry and movement. But they sometimes fail to ensure that physical media is stored in a secure area.
Requirement 9 had the third lowest use of compensating controls. It is mainly merchant organizations within the retail industry in the Americas that applied compensating controls to meet Requirement 9.
This Requirement stipulates that organizations must restrict physical access to all systems in the DSS scope and all hard copies of cardholder data.
33.3%of companies assessed after a data breach were not in compliance with Requirement 9*
* Breached organizations investigated between 2010 and 2016.
Most often compensated controls
9.1 (0.7%)9.1.1.a (0.7%)9.1.1.b (0.7%)9.1.1.c (0.7%)
Use PCI SSC Skimming Prevention guidance11 to help develop effective training, and make checking for tampering part of existing start-of-day and/or end-of day processes.
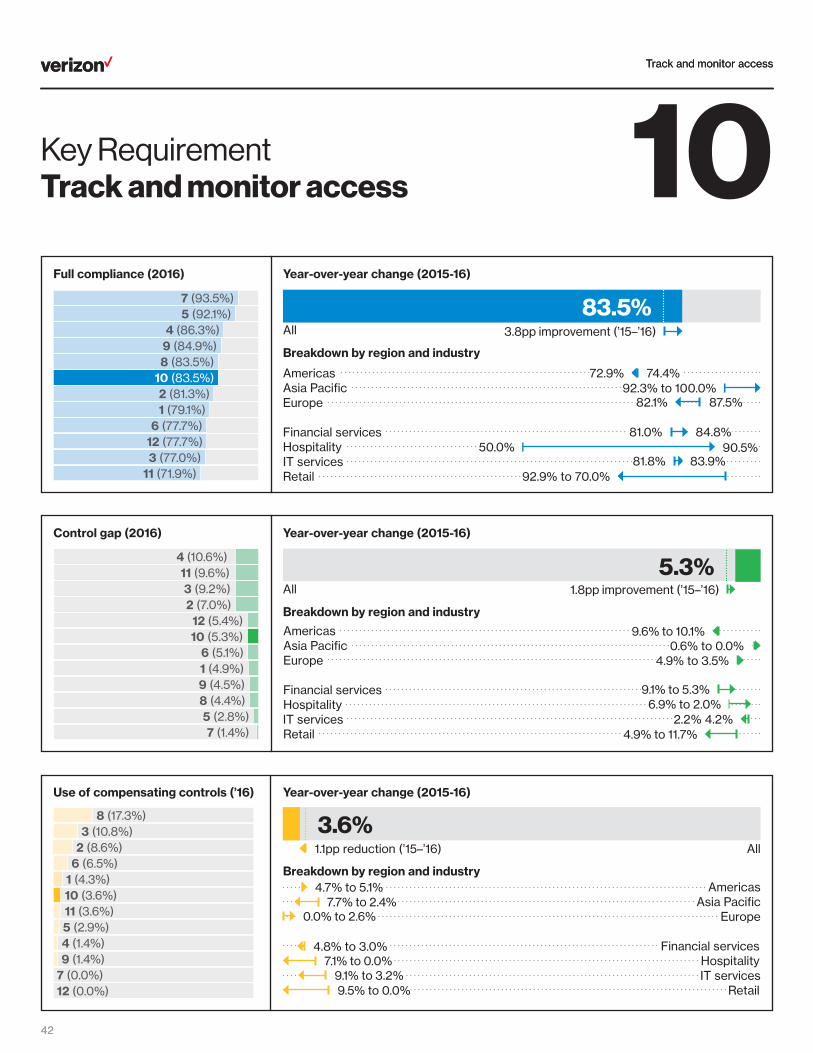
Track and monitor access
42
Full compliance (2016) Year-over-year change (2015-16)
Breakdown by region and industry
Control gap (2016) Year-over-year change (2015-16)
Breakdown by region and industry
Year-over-year change (2015-16)
Breakdown by region and industry
All
Use of compensating controls (’16)
Track and monitor access
42
Financial servicesHospitality
Retail
Asia PacificAmericas
Europe
Financial services
Retail
Hospitality
AmericasAsia PacificEurope
Financial servicesHospitality
Retail
AmericasAsia Pacific
Europe
IT services
IT services
IT services
All
All
7 (93.5%) 5 (92.1%) 4 (86.3%) 9 (84.9%)
2 (81.3%)
6 (77.7%) 12 (77.7%) 3 (77.0%)
8 (83.5%) 10 (83.5%)
11 (71.9%)
4 (10.6%)11 (9.6%)3 (9.2%)2 (7.0%)
12 (5.4%)10 (5.3%)
1 (4.9%)9 (4.5%)8 (4.4%)5 (2.8%)7 (1.4%)
6 (5.1%)
8 (17.3%)
3 (10.8%)2 (8.6%)
6 (6.5%)1 (4.3%)10 (3.6%)11 (3.6%)5 (2.9%)4 (1.4%)9 (1.4%)
7 (0.0%)12 (0.0%)
1 (79.1%)
1.8pp improvement (’15–’16)
Key RequirementTrack and monitor access 10
10 (83.5%)
3.8pp improvement (’15–’16)
5.3%
4.9% to 11.7%
87.5%
84.8%
74.4%
90.5%
82.1%
81.0%50.0%
92.9% to 70.0%
92.3% to 100.0%72.9%
9.6% to 10.1%0.6% to 0.0%
4.9% to 3.5%
9.1% to 5.3%6.9% to 2.0%
83.5%
4.7% to 5.1%
9.5% to 0.0%
7.1% to 0.0%
3.6%1.1pp reduction (’15–’16)
0.0% to 2.6%7.7% to 2.4%
4.8% to 3.0%
83.9%81.8%
2.2% 4.2%
9.1% to 3.2%

Track and monitor access
43
Worst control gaps
10.4.1.a (8.3%)10.2 (7.5%)10.4 (7.5%)
10.4.1.b (7.5%)10.6 (7.5%)
10.2.1 (7.0%)10.6.1.a (6.9%)10.6.1.b (6.9%)
10.6.2.b (6.9%)10.1 (6.8%)
Retail
• The other three key industries outperformed retail in this requirement. Just 70.0% of retailers achieved full compliance at interim assessment. This was 15.7pp lower than in 2015.
• Retailers managed to achieve strong compliance with control 10.5 (Secure audit trails so they cannot be altered).
• Controls 10.4 (Time synchronization technology) and 10.7 (Retain audit trail history for at least one year) proved the most difficult to meet, each having a control gap of 23.5%.
Hospitality
• The hospitality industry showed significant improvement in compliance with Requirement 10 in 2016, with 90.5% achieving full compliance at interim assessment. The control gap of just 2.0% was a 5.0pp improvement from 2015.
• Hospitality companies achieved 100.0% compliance with 10.2 (Automated audit trails to reconstruct events) and 10.3 (Record user id, date and time, events).
• The biggest control gap was in 10.8 (Policies and procedures for monitoring network access), at 5.6%.
• Hospitality organizations often struggle with Requirements 10 and 12 due to their large and dispersed workforces and network infrastructure. For example, time synchronization is generally solid when it comes to the corporate headquarters, but the corporate domain controller or other central timeserver sometimes has little oversight on satellite locations.
Financial services
• The financial services industry did not attain full compliance with any Requirement 10 control at interim assessment, but it did improve overall—going from 81.0% to 84.8%.
• The sector’s control gap fell from 9.1% in 2015 to 5.3% in 2016 (-3.8pp).
• Financial services organizations didn’t achieve a perfect score on any Requirement 10 control. They came closest on 10.8 (Policies and procedures for monitoring network access), where just 2.2% failed.
• They struggled most with 10.6 (Review logs at least daily). Just 90.9% of the companies we assessed were compliant with this control.
• The difficulty found in balancing performance issues with system auditing demands is common, and can be seen across all the industries assessed.
IT services
• IT services achieved 100.0% compliance with controls 10.5 (Secure audit trails so they cannot be altered), 10.7 (Retain audit trail history for at least one year) and 10.8 (Policies and procedures for monitoring network access).
• Overall, we found IT services companies did not have 4.2% of Requirement 10 controls in place. They fared worst with controls 10.1 (Implement audit trails linking access to individual users) and 10.2 (Automated audit trails to reconstruct events).
• Configuring audit systems to match PCI DSS requirements can be a constant struggle for some organizations. Solutions are not usually compliant “out of the box”, and require some adjustment to meet compliance requirements.
The use of compensating controls to meet Requirement 10 increased within the hospitality industry, but decreased slightly across all other key industries.
This Requirement covers the creation and protection of information that can be used for tracking and monitoring of access to all systems in the DSS scope, and the synchronization of all system clocks.
91.9%of companies assessed after a data breach were not in compliance with Requirement 10*
* Breached organizations investigated between 2010 and 2016.
Most often compensated controls
10.5.3 (2.9%)10.2.2 (1.4%)10.2.5.a (1.4%)10.2.5.b (1.4%)
Establish strict configuration standards for time servers, specifying designated servers permitted to receive time from authorized external sources.
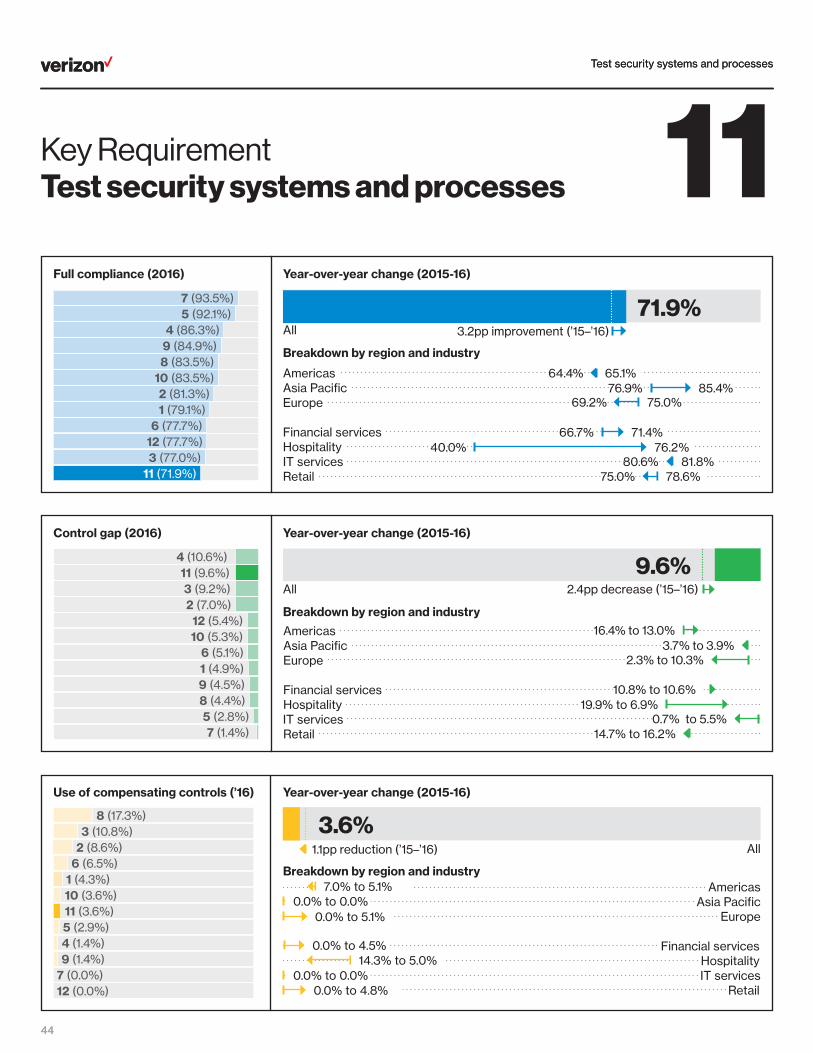
Test security systems and processes
44
Full compliance (2016) Year-over-year change (2015-16)
Breakdown by region and industry
Control gap (2016) Year-over-year change (2015-16)
Breakdown by region and industry
Year-over-year change (2015-16)
Breakdown by region and industry
All
Use of compensating controls (’16)
Test security systems and processes
44
Financial servicesHospitality
Retail
Asia PacificAmericas
Europe
Financial services
Retail
Hospitality
AmericasAsia PacificEurope
Financial servicesHospitality
Retail
AmericasAsia Pacific
Europe
IT services
IT services
IT services
All
All
7 (93.5%) 5 (92.1%) 4 (86.3%) 9 (84.9%)
2 (81.3%)
6 (77.7%) 12 (77.7%) 3 (77.0%)
8 (83.5%) 10 (83.5%)
11 (71.9%)
4 (10.6%)11 (9.6%)3 (9.2%)2 (7.0%)
12 (5.4%)10 (5.3%)
1 (4.9%)9 (4.5%)8 (4.4%)5 (2.8%)7 (1.4%)
6 (5.1%)
8 (17.3%)
3 (10.8%)2 (8.6%)
6 (6.5%)1 (4.3%)10 (3.6%)11 (3.6%)5 (2.9%)4 (1.4%)9 (1.4%)
7 (0.0%)12 (0.0%)
1 (79.1%)
71.9%
Key RequirementTest security systems and processes 11
11 (71.9%)
3.2pp improvement (’15–’16)
9.6%
14.7% to 16.2%
75.0%85.4%
71.4%
65.1%
76.2%
78.6%
69.2%
66.7%40.0%
75.0%
76.9%64.4%
16.4% to 13.0%3.7% to 3.9%
19.9% to 6.9%
2.3% to 10.3%
10.8% to 10.6%
3.6%
7.0% to 5.1%
0.0% to 4.8%
14.3% to 5.0%
1.1pp reduction (’15–’16)
0.0% to 5.1%
0.0% to 4.5%
2.4pp decrease (’15–’16)
0.0% to 0.0%
81.8%80.6%
0.7% to 5.5%
0.0% to 0.0%

Test security systems and processes
45
Worst control gaps
11.2.1.a (15.8%)11.2.3.b (15.2%)
11.3.3 (15.2%)11.2.3.a (15.1%)11.3.1.2 (14.8%)
11.3.4.b (14.8%)11.3.1.b (13.6%)11.2.2.a (13.4%)
11.2 (13.2%)11.3.2.a (12.1%)
Retail
• The retail industry experienced a slight decline in full compliance, going from 78.6% in 2015 to 75.0% in 2016.
• Improvements in compliance with controls 11.4 (Use intrusion-detection systems) and 11.5 (Deploy a change-detection mechanism) can be explained by the availability of more scalable and less expensive intrusion-detection system (IDS) offerings.
• We expect compliance with control 11.5 (Deploy file integrity monitoring software) to go down following the clarifications in version 3.2 of the DSS. This involved removing the caveat “within the cardholder data environment” from the testing procedure to expand the number of systems that require critical file monitoring to include critical systems located outside the cardholder data environment. Many organizations don’t have file-integrity monitoring (FIM) technologies on point-of-sale or administrative workstations, making complying with this difficult.
• Compliance with control 11.2 (Run network vulnerability scans) was at its lowest in the retail industry. 21.2% of retailers failed to make the grade.
Hospitality
• The most significant improvement in compliance with Requirement 11 was in the hospitality industry. Here it moved from the bottom spot to tie for eighth. Full compliance grew from just 40.0% in 2015 to 76.2% in 2016 (+36.2pp).
• This remarkable feat was a result of sizeable increases in compliance with controls 11.2 (Internal and external network vulnerability scans), 11.4 (Use intrusion-detection systems) and 11.5 (Deploy a change-detection mechanism).
• Despite the improvement, compliance with the penetration testing requirement still needs attention. It still scored a low 88.6%, mainly due to non-compliance with performing penetration tests after any significant infrastructure or application upgrade or modification (control 11.3.2).
Financial services
• Requirement 11 remains the most challenging key requirement for companies in this industry, but across financial services companies the control gap in 2016 was 4.8%—down 2.8pp from 2015.
• The industry’s worst performance was on controls 11.2 (Internal and external network vulnerability scans) and 11.3 (Implement penetration testing), which had control gaps of 13.6% and 13.8% respectively.
• Due to the sensitive nature of the data kept in financial institutions, companies in this industry tend to rely on in-house resources for internal vulnerability scans and penetration tests. Given the breadth and depth of system components to scan, test, upgrade, and patch, and the limited resources available to meet the demand for penetration testing, demonstrating clean vulnerability scans and remediated exploitable vulnerabilities in a timely fashion can prove difficult.
IT services
• It would have been difficult for IT services to improve on its performance in 2015 (control gap of just 0.7% and only one in six controls at less than 100.0%). And, so it was. Full compliance dropped to 80.6% and the control gap grew to 5.5%.
• The least compliant controls were 11.2.1.a (Verify that four quarterly internal scans occurred in the most recent 12-month period) and 11.5.a (Verify the use of a change-detection mechanism), each of which 13.8% of companies failed.
The financial services industry has the highest use of compensating controls to meet Requirement 11. Its use also increased within the hospitality sector, but decreased within the retail industry.
This Requirement covers the use of vulnerability scanning, penetration testing, file integrity monitoring, and intrusion detection to ensure that weaknesses are identified and addressed.
83.6%of companies assessed after a data breach were not in compliance with Requirement 11*
* Breached organizations investigated between 2010 and 2016.
Most often compensated controls
11.5.a (1.4%)11.5.b (1.4%)11.1.a (0.7%)11.1.b (0.7%)
Make monthly, or more, scanning a part of formal role responsibilities. This facilitates early identification of vulnerabilities requiring remediation. Measure actual vulnerability management performance and submit reports as part of operations meetings.

Maintain information security policies
46
Full compliance (2016) Year-over-year change (2015-16)
Breakdown by region and industry
Control gap (2016) Year-over-year change (2015-16)
Breakdown by region and industry
Year-over-year change (2015-16)
Breakdown by region and industry
All
Use of compensating controls (’16)
Maintain information security policies
46
Financial servicesHospitality
Retail
Asia PacificAmericas
Europe
Financial services
Retail
Hospitality
AmericasAsia PacificEurope
Financial servicesHospitality
Retail
AmericasAsia Pacific
Europe
IT services
IT services
IT services
All
All
7 (93.5%) 5 (92.1%) 4 (86.3%) 9 (84.9%)
2 (81.3%)
6 (77.7%) 12 (77.7%) 3 (77.0%)
8 (83.5%) 10 (83.5%)
11 (71.9%)
4 (10.6%)11 (9.6%)3 (9.2%)2 (7.0%)
12 (5.4%)10 (5.3%)
1 (4.9%)9 (4.5%)8 (4.4%)5 (2.8%)7 (1.4%)
6 (5.1%)
8 (17.3%)
3 (10.8%)2 (8.6%)
6 (6.5%)1 (4.3%)10 (3.6%)11 (3.6%)5 (2.9%)4 (1.4%)9 (1.4%)
7 (0.0%)12 (0.0%)
1 (79.1%)
Key RequirementMaintain information security policies 12
12 (77.7%)
7.4pp improvement (’15–’16)
5.4%
8.2% to 11.1%
74.4%
75.8%
67.4%
81.0%
71.4%
50.0%
57.1%60.0%
60.0%
92.3% to 97.6%66.1%
5.9% to 7.8%0.2% to 0.5%
5.9% to 7.6%
18.1% to 6.9%
8.0% to 4.4%
77.7%
0.0%1.6pp reduction (’15–’16)
4.8% to 0.0%
7.7% to 0.0%
0.9pp decrease (’15–’16)
0.0% to 0.0%
0.0% to 0.0%
0.0% to 0.0%
0.0% to 0.0%
90.9%90.3%
1.9% to 2.2%
0.0% to 0.0%

Maintain information security policies
47
Worst control gaps
12.8 (11.6%)12.6.2 (11.1%)
12.6.1.b (10.4%)12.8.5 (9.8%)12.8.2 (9.0%)
12.6.1.c (8.9%)12.10.6 (8.9%)12.8.3 (8.5%)
12.9 (8.3%)12.2.a (8.2%)
Retail
• Retailers still struggle with Requirement 12 more than the other key industries. And it’s getting worse. Only 60.0% of retailers achieved full compliance at interim assessment in 2016, compared with 71.4% in 2015.
• The worst performance within Requirement 12 was with 12.6.2 (Annual confirmation that employees have read and understood the security policy and procedures). 31.6% of companies failed in this regard.
• Faced with geographically dispersed locations, retailers often have difficulty providing lists of approved products and the standardized disconnection of remote-access connections needed to meet control 12.3.
Hospitality
• 81.0% of hospitality organizations achieved full compliance at interim assessment in 2016, an improvement of 21.0pp from 2015. The average control gap narrowed by 1.7pp to 7.6%.
• Control 12.1 (Publish and maintain a security policy) was met by all organizations in this sector in 2016.
• Control 12.8 (Manage service providers with whom cardholder data is shared) was the weakest of the Requirement 12 controls for this sector, with 17.6% failing to demonstrate compliance.
• Organizations across both retail and hospitality struggled with service providers that were not PCI DSS compliant and as a result were unprepared to undergo the rigors of a PCI DSS assessment.
Financial services
• In 2016, compliance with Requirement 12 (Security management) improved significantly, with the control gap below 10.0% for all but three controls.
• The least compliant control was 12.9, which 12.7% of organizations failed. This is only a requirement for service providers—applicable to just about all of the financial services organizations in our dataset. It was followed by control 12.8, which one in eight (12.5%) companies failed.
• Service provider agreements can get confusing, and many companies being assessed do not have adequate legal representation to confirm that the correct agreements are in place as needed for control 12.8.
• The core of control 12.9 is that a service provider acknowledges that while any cardholder data is in its environment or can be affected by it, the service provider is responsible for its security.
IT services
• In 2016, the control gap for IT services was just 2.2% and companies in the sector achieved full compliance with eight of the controls.
• Controls 12.6 (Implement a formal security awareness program) and 12.10 (Implement an incident response plan) require the most attention. These mostly involve improving the preparation and timing of the evidence for annual security awareness, sampling incident responses, and testing of the incident response plan.
The use of compensating controls to meet Requirement 12 fell to 0.0% across all regions—likewise with Requirement 7.
This Requirement demands that organizations actively manage their data protection responsibilities by establishing, updating and communicating security policies and procedures aligned with the results of regular risk assessments.
79.6%of companies assessed after a data breach were not in compliance with Requirement 12*
* Breached organizations investigated between 2010 and 2016.
Most often compensated controls
All 0.0%
When it comes to risk assessments, the issue is often a lack of training. Many companies will point to industry standards—such as the NIST SP 800—but don’t provide training or guidance on how to carry out an effective risk assessment.

Bottom 20 lists
48
10.5.4 +8.2pp
11.2.2.b +9.9pp
10.4.2.b +9.6pp
9.9.3.a +13.5pp
8.2.4.a +10.6pp
12.2.b +10.5pp
6.5.b +8.0pp
6.5d +7.5pp
12.8.2 +7.3pp
1.4.b +7.2pp
8.1.1 +6.9pp
1.3.8.b +6.8pp
3.6.1.a +6.8pp
2.2.3.a +6.8pp
3.6.2.a +6.6pp
2.2.d +6.4pp
1.1.7.b +5.1pp
6.5.b +6.2pp
12.3.8.a +6.0pp
2.2.4.a +5.5pp
Bottom 20 listsIn most previous reports, the biggest control gap has been one of the testing procedures that make up control 11.2. Several of these show up in this year’s list, but the “prize” for the absolute worst performance is from a new contender.
Changes introduced with version 3.2 of the PCI DSS have led to control 9.9 appearing eight times in our bottom 20 list.
Just four Requirements—2, 4, 9 and 11—appear in this list.
Requirement 9, and specifically control 9.9, comes up again when we look at the biggest increases in control gap between 2015 and 2016. In fact, 9.9.3 holds “top” spot in both our lists.
Requirements 4, 5 and 7 don’t appear at all in this list. All nine other Requirements appear at least once.
Fig 16. Bottom 20 base controls by full compliance (2016) Fig 17. Biggest increases in control gap (2016 vs 2015)
Training materials for personnel at POS locations
Defined processes for frequently inspecting devices
Protect devices that capture payment card data
POS personnel receive training on device security
Terminals not susceptible to SSL/early TLS exploits
Terminals not susceptible to SSL/early TLS exploits
Devices inspected for signs of tampering/substitution
Insecure services, daemons and protocols secured
Transmission of CHD over wireless networks secured
Four quarterly internal scans in last 12-month period
Terminals not susceptible to SSL/early TLS exploits
Rescans until “high-risk” vulnerabilities fixed
Repeated pentesting to confirm issues corrected
Up-to-date list of devices that capture payment card data
Devices list contains make, location, serial number etc.
List of devices is updated after and move/add/change
Verify systems scanned after significant changes
Most recent penetration test verifies segmentation
Pentests performed annually and after changes
Training materials for personnel at POS locations
Passwords changed at least every 90 days
Risk-assessments annually and after significant changes
ASV program requirements for a passing scan met
Changes to time settings are logged and monitored
Write logs to secure, central, internal log server or media
Developers knowledgeable in secure coding techniques
Protect applications from vulnerabilities
Service providers agree to CHD security duties
Network diagram meets firewall config standards
Users assigned unique ID for access to systems and CHD
Only authorized disclosure of private IP addresses
Key procedures to specify how to generate strong keys
Insecure services, daemons and protocols secured
Procedures specify how to securely distribute keys
Configuration standards cover all system components
Developers knowledgeable in secure coding techniques
Automatic disconnect for remote-access sessions
Admins know common security parameters
Firewall and router rules reviewed at least bi-annually
CHD not sent/received over open, public networks
9.9.3.a 23.5%
9.9.2.a 21.9%
9.9 21.2%
9.9.3.b 20.6%
2.2.3.b 20.4%
2.3.e 18.8%
9.9.2.b 18.8%
2.2.3.a 18.2%
4.1.1 16.7%
11.2.1.a 15.8%
4.1.h 15.4%
11.2.3.b 15.2%
11.3.3 15.2%
9.9.1.b 15.2%
9.9.1.a 15.2%
9.9.1.c 15.2%
11.2.3.a 15.1%
11.3.4.b 14.8%
11.3.1.a 14.8%
4.1.a 14.7%
20 biggest control gaps 20 biggest increases in control gap

Appendices
49
Appendices
Appendices
49

Appendix A: Data breach comparison
50
Appendix A: Data breach comparisonDespite advances in the state of global compliance, many companies are still struggling with achieving and maintaining data protection. Attackers can exploit systems in just minutes, while defenders often take weeks or more to discover breaches. With no slowdown in sight, the effectiveness of the PCI Security standards, and PCI DSS in particular, continues to be a hot topic.
Verizon has been playing a key role in the fight against cybercriminals since the 1990s. Each year, our security reports—including the Data Breach Investigations Report (DBIR), the Data Breach Digest, The Protected Health Information Report and the Payment Security Report—provide valuable information to help protect your organization.
Since 2010, we’ve compared the state of PCI DSS compliance in organizations undergoing interim validation versus those being assessed following a confirmed data breach. In the 2015 PCI Report, we emphasized that the effectiveness of payment card data protection is mostly determined by the approach taken in implementing and maintaining the set of PCI DSS controls.
Compliance correlation trends
Forensic investigators accredited by the PCI SSC to conduct the formal data breach investigations are often tasked with helping the victim organization contain the breach, confirm its extent and, if possible, identify the origin of the perpetrator. Sometimes some aspects of a control failure are made known, but the details and exact nature of the failure are seldom, if ever, disclosed externally. While understandable, this unfortunately limits the learning opportunity.
Our analysis compares the state of PCI DSS compliance at the time of a breach (as determined by Verizon’s PCI Forensic Investigators) with that of a control group (as assessed by Verizon QSAs during interim compliance validation). The data provided by Verizon’s Forensic Investigation practice is from cases that involved confirmed compromise of payment account data. None of Verizon’s PCI customers have reported a payment card compromise after being assessed by Verizon and thus are not included in the confirmed compromise dataset.
We see very clear indicators and correlations between these two datasets. Our analysis identifies common breach vectors and extrapolates the control(s) that would prevent similar breaches from being successful.
Each year, the Verizon DBIR12 provides insight into the global threat landscape based on analysis of thousands of confirmed data breaches. This includes who the threat actors are, the motivation behind the attacks and the methods used.
Each year, the Verizon DBIR provides insight into the global threat landscape based on analysis of thousands of confirmed data breaches. This includes who the threat actors are, the motivation behind the attacks and the methods used12.
There are significant differences between the scope and intent of a forensic investigation and PCI DSS compliance validation. Whereas a QSA would dive into the specifics of each control and testing procedure, a PCI Forensic Investigator’s (PFI) task is to make a high-level assessment as to whether the organization was compliant with each of the 12 PCI DSS Key Requirements at the time of the breach. The PFI doesn’t attempt to validate compliance (a positive), but rather looks for non-compliance (a negative). Given this, it’s likely that the PFI data will show a more optimistic picture of compliance.

Appendix A: Data breach comparison
51
Comparison between QSA and PFI
Figure 18 (above) shows that compliance with most PCI DSS Key Requirements is significantly lower in post-breach assessments by PFIs than in interim validation assessments by QSAs—this despite the fact that PFI investigations are less critical than a formal QSA assessment.
The difference is expressed as a negative percentage point. It indicates the average PCI DSS compliance difference between the two datasets, i.e., between breached organizations (mostly non-PCI DSS attested) and the “control group” from our set of interim PCI DSS attested organizations.
Note that the PFI dataset typically covers a different caseload of data breaches from one year to the next. That makes the ongoing similarities in compliance trends, with year-over-year comparison of this data correlation, even more striking. It strengthens our finding that breached organizations clearly demonstrate a predictable pattern of behavior.
Overall, breached organizations have significantly lower compliance—there’s a 42pp difference in total average PCI DSS compliance. For example, between 2014 and 2015, this gap in compliance increased for two Key Requirements: 1 by 20pp and 3 by 33pp.
The only Requirement where breached organizations actually did slightly better (by 1pp) was Requirement 4.
The 2014 report revealed that not a single breached organization had Requirement 6 or Requirement 10 in place at the time of being breached. In 2015 and 2016, at least some of the breached organizations were found to have these Requirements in place.
However, with an 86pp difference, Requirement 10 still has the largest difference between our two groups. Where organizations continue to exhibit poor logging and monitoring, breaches often go undetected for months or years.
Comparison with previous years
In our 2015 report we found that organizations experiencing data breaches in the previous year fell down in PCI DSS compliance in five main areas:
• Develop and maintain secure systems (Requirement 6)
• Restrict access (Requirement 7)
• Track and monitor access to networks and cardholder data (Requirement 10)
• Test security systems and processes (Requirement 11)
• Maintain an information security policy (Requirement 12)
Overall, organizations experiencing a data breach were less likely to be compliant with 10 out of the 12 PCI DSS Key Requirements.
Fig 18. QSA versus PFI. PFI data does not indicate the data breach cause. It includes “partial yes” responses (not indicative of full compliance).
6
-63pp
10
-86pp
7
-62pp
1
-62pp
3
-59pp
12
-50pp
8
-44pp
11
-30pp
5
-28pp
9
-16pp
4
1pp
2
-3pp10
-90
0
-10
-20
-30
-40
-50
-60
-70
Variation in compliance at interim validation vs post-breach forensic investigation (2016)
-80
PCI DSS Requirement
Per
cent
age
poin
ts (p
p) d
i�er
ence
(QS
A v
s P
FI)
Of all the payment card data breaches the VTRAC Team investigated over the past 12 years, not a single organization was fully PCI DSS compliant at the time of the breach.
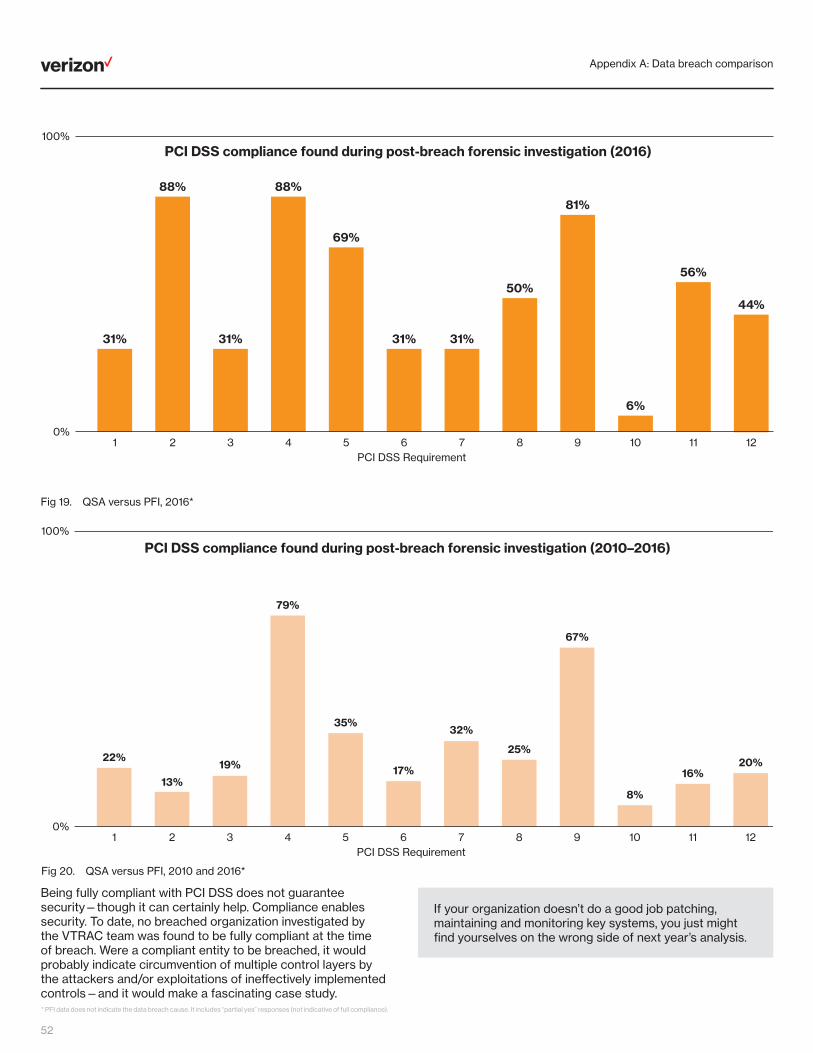
Appendix A: Data breach comparison
52
PCI DSS Requirement
PCI DSS compliance found during post-breach forensic investigation (2016)100%
0%
31%
88%
31%
88%
69%
31% 31%
50%
81%
6%
56%
44%
1 2 3 4 5 6 7 8 9 10 11 12
100%
0%
22%
13%
19%
79%
35%
17%
32%
25%
67%
8%
16%20%
1 2 3 4 5 6 7 8 9 10 11 12
PCI DSS Requirement
PCI DSS compliance found during post-breach forensic investigation (2010–2016)
Fig 19. QSA versus PFI, 2016*
Being fully compliant with PCI DSS does not guarantee security—though it can certainly help. Compliance enables security. To date, no breached organization investigated by the VTRAC team was found to be fully compliant at the time of breach. Were a compliant entity to be breached, it would probably indicate circumvention of multiple control layers by the attackers and/or exploitations of ineffectively implemented controls—and it would make a fascinating case study.
If your organization doesn’t do a good job patching, maintaining and monitoring key systems, you just might find yourselves on the wrong side of next year’s analysis.
Fig 20. QSA versus PFI, 2010 and 2016*
PCI DSS Requirement
PCI DSS compliance found during post-breach forensic investigation (2016)100%
0%
31%
88%
31%
88%
69%
31% 31%
50%
81%
6%
56%
44%
1 2 3 4 5 6 7 8 9 10 11 12
100%
0%
22%
13%
19%
79%
35%
17%
32%
25%
67%
8%
16%20%
1 2 3 4 5 6 7 8 9 10 11 12
PCI DSS Requirement
PCI DSS compliance found during post-breach forensic investigation (2010–2016)
* PFI data does not indicate the data breach cause. It includes “partial yes” responses (not indicative of full compliance).
Appendix B:
53
Appendix B:Security of mobile paymentsWhile both Apple iOS and Android mobile devices use Unix operating systems, the security architecture of the platforms differs significantly. Android applications are self-signed, and available from an open app store, whereas iOS applications must be signed by Apple (for commercial use) and are available in an Apple-controlled store for applications that Apple has vetted through manual and automated means. Android applications are also installed with varying degrees of permissions, dependent upon the manifest at the time of installation.
Because Android applications are not sandboxed and have the ability to send action requests to one another, applications can use calls to determine the permission levels of other applications and use those privileges, by re-delegating permissions. Android applications are written in managed Java code, and while malicious exploits are still a concern, buffer overflows are much less of one. iOS applications, by comparison, are written in native Objective-C, which is susceptible to buffer overflows.
iOS apps, however, are sandboxed (i.e. do not have access to each other’s data) and are all given the same privileges. iOS predefined APIs are the only means of communication between applications. iOS also provides built-in hardware encryption that applications can leverage, which the vast majority of Android devices do not.
Considering the foothold that Microsoft has in most enterprises, it’s easy to imagine that we will see increased prevalence of active directory services hosted in its Azure cloud services, with Windows tablets and phones authenticating through Azure to fully connect them to corporate resources. Since so many POS systems are Windows-based, extending payment terminal functionality to Windows tablets and phones may be a natural evolution.
NFC, which forms the basis of most mobile wallet solutions, is a functional technology for the transmission and receipt of data. In and of itself, it isn’t a complete security solution. In mobile device-as-card solutions, it is critical that payment card data that has been registered to the device is not accessible from it, either at rest or during the transmission of the data.
Technologies that secure payment card data have been improving and are a real success story for mobile commerce. Both iOS and Android have robust card emulation solutions, using an embedded Secure Element and cloud-based Host Card Emulation. Neither store card details within the device and both use tokenization to render those details worthless in isolation. Both major phone platforms are integrating their solutions with biometric authentication mechanisms that are becoming standard on most current mobile devices, further enhancing the credibility of the solutions.

Appendix C: Compliance calendar
54
Appendix C: Compliance calendar
Req. Area DSS 3.2 Activity
Service providers only (best practice until January 31 2018, requirement after that)
New requirement since DSS 3.x
Cardholder data environment
Cardholder data
Firewalls and routers 1.1.7 Review firewall and router rulesets.1 6
Review security of the backup location.9.5.1
9.7.1
Back-up site security
Media inventory
POS POI terminal inventory 9.9.1
Conduct media inventories and properly maintain accompanying logs.
Maintain an up-to-date list of devices, including make, model and serial number.
POS POI terminal security 9.9.2 Inspect device surfaces for tampering or substitution.
9
Review logs and security events of all CDE components.10.6.1
10.6.2
Log review
Log review
Security control failure reporting 10.8
Review logs of other system components—as set by annual risk assessment.
Implement process for detecting and reporting critical control failures.
10
Revoke access for terminated users.8.1.3
8.1.4
User access management
User access management
User account passwords 8.2.4
Remove/disable inactive user accounts.
Change user passwords/passphrases.
8 33
CDE
CHD
AllScope management
Identify and delete stored CHD that has exceeded defined data retention periods.3.1.bData retention
3.6.4Cryptographic keys Change cryptographic keys that have reached the end of their cryptoperiod.3
3
Install all critical security patches within one month of release. 6.2
6.2
Patch management
Patch management
Software development 6.5
Install all non-critical security patches (recommended).
Train developers in latest coding techniques.
Public-facing web applications 6.6 Assess vulnerability of public-facing web apps. N/A if you use a web app firewall.
631
Confirm locations and flows of CHD, and ensure inclusion in the PCI DSS scope.
After changes
Periodically
Annually
Weeks
MonthsDaily
Immediately
Point of interactionPOI
Point of salePOS
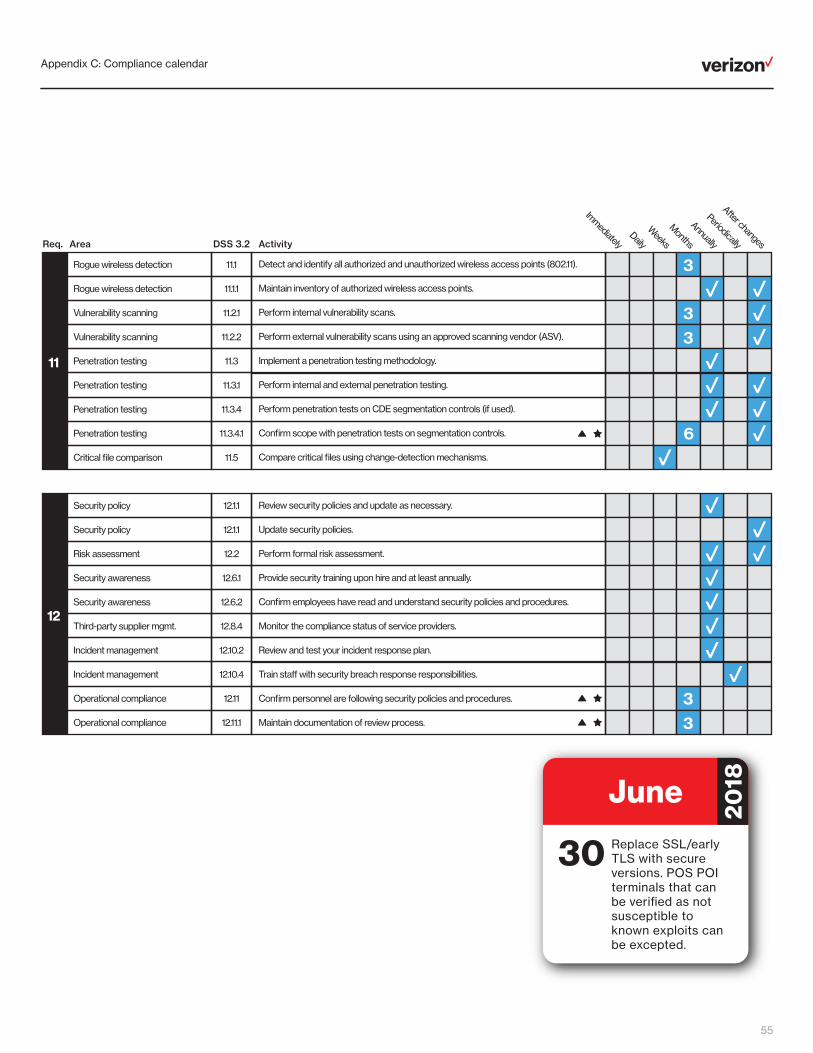
Appendix C: Compliance calendar
55
Key date
Req. Area DSS 3.2 Activity
11.1.1
Detect and identify all authorized and unauthorized wireless access points (802.11). 11.1Rogue wireless detection
Rogue wireless detection
Vulnerability scanning 11.2.1
Maintain inventory of authorized wireless access points.
Perform internal vulnerability scans.
Vulnerability scanning 11.2.2 Perform external vulnerability scans using an approved scanning vendor (ASV).
Implement a penetration testing methodology.11.3
11.3.1
Penetration testing
Penetration testing
Penetration testing 11.3.4
Perform internal and external penetration testing.
Perform penetration tests on CDE segmentation controls (if used).
Penetration testing 11.3.4.1 Confirm scope with penetration tests on segmentation controls.
Critical file comparison 11.5 Compare critical files using change-detection mechanisms.
11
3
33
6
Review security policies and update as necessary.12.1.1
12.1.1
Security policy
Security policy
Risk assessment 12.2
Update security policies.
Perform formal risk assessment.
Provide security training upon hire and at least annually.12.6.1
12.6.2
Security awareness
Security awareness
Third-party supplier mgmt. 12.8.4
Confirm employees have read and understand security policies and procedures.
Monitor the compliance status of service providers.
Incident management 12.10.2 Review and test your incident response plan.
Incident management 12.10.4 Train sta� with security breach response responsibilities.
Operational compliance 12.11 Confirm personnel are following security policies and procedures.
Operational compliance 12.11.1 Maintain documentation of review process.
12
33
Replace SSL/early TLS with secure versions. POS POI terminals that can be verified as not susceptible to known exploits can be excepted.
June
30
20
18
After changes
Periodically
Annually
Weeks
MonthsDaily
Immediately

Methodology
56
MethodologyThis research is based on analysis of quantitative data gathered by our qualified security assessors (QSAs) while performing assessments of PCI DSS compliance between 2015 and 2016.
The assessments carried out for this report covered both DSS 3.1 and 3.2. Unless explicitly stated otherwise, all the references to controls and test procedures refer to DSS 3.1.
The charts to the right show how the organizations from which we gathered interim PCI DSS assessment data to create this report break down by industry (Figure 21) and region (Figure 22).
Assessments by industry
Financialservices47.5%
Hospitality15.1%
Retail14.4%
IT services22.3%
Other (0.7%)
Fig 21. 2016 assessments by industry
Americas42.4%
Europe28.1%
Asia Pacific29.5%
Assessments by region
Fig 22. 2016 assessments by region
Fig 23. Post-breach investigations by company size
11 to 10042.6%
1,001 to10,00011.7%
101 to 1,00020.6%
Breaches by organization size
number of employees
Data for the Data Breach Comparison section (see page 50) is separate from our PCI DSS assessment dataset. It comes from investigations on organizations following a breach of payment card data. These investigations were carried out by the VTRAC team between 2010 and 2016.
Figure 23 (to the right) shows how the organizations in this dataset break down by size, based on number of employees.

Verizon Security professional services
57
Verizon Security professional servicesVerizon is a highly respected security consultancy and a trusted voice in the PCI Security community. We have one of the largest and most geographically distributed teams of QSAs, serving more than 30 countries. This gives us unrivaled insight into the state of compliance, and an exceptional understanding of what it takes to implement sustainable controls.
In the world of security, knowledge is power. The figures speak for themselves— since 2009 we’ve conducted more than 15,000 security assessments, many for Fortune 500 and large multinationals. Verizon has provided cardholder data security services since 2003, prior to and alongside the introduction and evolution of PCI DSS.
Verizon runs one of the largest global IP networks and manages over 4,000 customer networks giving us a unique perspective on managing the operational aspects of security. On top of all this experience, we have invested in extensive research programs, publish several of the industry’s preeminent ongoing research reports, and have made targeted acquisitions of leading security companies, such as Cybertrust.
The PCI Security practice is part of the Verizon security organization, a leading global provider of security services. We offer consulting, assessment and programs related to:
• Payment security and compliance (PCI-DSS, PA-DSS, P2PE, EI3PA, PIN and ECB).
• Healthcare security and compliance (HIPAA, ONC Health IT and ConCert by HIMSS).
• Security testing and certifications for security hardware, software, solutions and IoT (through Verizon ICSA Labs).
• Operational technologies and control systems (OTACS, SCADA, NIST-ICS and IoT).
• Threat and vulnerability (penetration testing for network, application, wireless and IoT; red, blue and purple teaming; social engineering and secure code review).
• Baseline security assessments (ISO 27000, CSC Top 20, FISMA, FedRamp and NIST-CSF).
• Security operation center (SOC) readiness and maturity assessments.
The Verizon Cyber Defense team is a world-class provider of infrastructure security services. We help customers with assessments and improvement of existing security solutions, up to full lifecycle management of security transformation projects. With our vendor-agnostic approach, we help customers— regardless of industry—achieve positive returns on future security investment.
The VTRAC team is among the world’s top providers of complex incident response and digital forensics consulting services. Having performed hundreds of data breach investigations each year, the VTRAC team is uniquely positioned to provide rapid response to organizations around the globe and across all industries.
As well as security certifications, many of Verizon’s QSAs have deep industry knowledge gained from years of experience working in the retail, hospitality, financial services, healthcare and other sectors. This experience helps them appreciate your unique security and compliance challenges, and to understand your needs in the context of industry-specific security standards and regulations.
Verizon’s PCI Security practice has been approved by the PCI SSC for QSA, PA-QSA, QSA (P2PE) and PA-QSA (P2PE) services. Verizon is also an approved PFI company.
Questions? Comments?
We’d love to hear them. Email us at:
For additional resources on this research and to find out more about Verizon’s PCI Security compliance services, please visit:
VerizonEnterprise.com/PaymentSecurity
Find out more
Security training
6%Control gap: the percentage of controls companies failed.
Proportion of companies achieving full compliance
Retail and hospitality
IT services
Financial services
Nearly half of companies are failing to protect payment card data on an ongoing basis.
45%
61%
55%
47%
59%
All industries
ITservices
Retail and hospitality
Financial services
Why payment security is importantSome areas of payment card security—like antivirus—are straightforward. But there are some compliance controls that everyone finds tough. Here are the top three most common failures in financial services, retail and hospitality, and IT services—and what you can do to overcome them.
Read the 2017 Payment Security Report
08/17 WBE16826
I
?
What’s happening in payment security?
PCI DSS (Payment Card Industry Data Security Standard) is a big topic. But you can get to the heart of the
matter with our overview below. And if you want to learn more, our 2017 Payment Security Report
gives you the full picture.
Control gap The control gap narrowed. In 2016, an
average of 5.8% of controls were not in
place across all companies—the figure
was 6.8% in 2015.
Full compliance (% of organizations
compliant at interim assessment)
Average control gap (% of companies
that failed controls)
How to use this infographic
Organizations are required to achieve and
maintain a 100% state of compliance, with
application security controls in place—
continuously. Click on a Key Requirement
below to discover how well companies do
at sustaining complaince.
Want to know more? Read the full story in the
Verizon 2017 Payment Security Report
Executive Summary.
2017 Payment
Security Report
Executive Summary
Our research shows that
nearly half of organizations
fall out of PCI DSS compliance within nine
months of validation.
Full compliance The good news is that full compliance is
going up. The bad news is that nearly half of
organizations are still failing to maintain it
from year to year.
11%
37%
2012
2013
2014 48%
100%
2015
20%
55%2016
08/17 WBE16827
Download
1 Install and maintain a firewall configuration
2 Do not use vendor-supplied defaults3 Protect stored cardholder data4 Protect data in transit5 Protect against malicious software
6 Develop and maintain secure systems7 Restrict access
8 Authenticate access9 Control physical access
11 Test security systems and processes12 Maintain an information security policy
10 Track and monitor access
Click on a requirement for more detail
2017 Payment
Security Report
Executive Summary
Verizon 2017 Payment Security Report
58
VerizonEnterprise.com © 2017 Verizon. All Rights Reserved. The Verizon name and logo and all other names, logos, and slogans identifying Verizon’s products and services are trademarks and service marks or registered trademarks and service marks of Verizon Trademark Services LLC or its affiliates in the United States and/or other countries. All other trademarks and service marks are the property of their respective owners. WP16824 08/17
Verizon 2017 Payment Security ReportLead author
Ciske van Oosten
Co-authors
Sky Hackett and Anne Turner
Contributors
Aaron Getchius, Charles Gatrelle, Estelle van Staden, Franklin Tallah, Ian White, Jaime Villegas, Jeffrey Cornelius, John Galt, Jyri Ryhänen, Kelly Clark, Kevin Eaton, Kevine Zerbib, Loic Breat, Marc Spitler, Paisit Thamsakorn, Pritam Bankar, Priyanka Bhattacharya and Ronald Tosto
Contributing editors
Cynthia B. Hanson and Rein van Koten
This report would not have been possible without contributions of data and insight from across Verizon’s security practice, particularly the PCI Security and VTRAC teams.
Date of publication
August, 2017
PCI Security practice management team
Eric Jolent, Franklin Tallah, Gabriel Leperlier, Ian White, Jaime Villegas, Luc Didier, Rein van Koten, Ron Tosto and Sebastien Mazas
Intelligence manager
Ciske van Oosten
Security practice managing director
Rodolphe Simonetti
1. ABI Research, Payment & Banking Card Technologies Market Data June, 20162. Dark Reading, Stagefright Android Bug: ‘Heartbleed for mobile’ but harder to patch, Sara Peters, July 20153. 2015 Data Breach Investigations Report, Verizon, 2015 (http://www.verizonenterprise.com/resources/reports/rp_data-breach-investigation-report_2015_en_xg.pdf)4. ISACA, 2015 Mobile Payment Security Study Global Results, September 20155. TSYS, 2015 U.S. Consumer Payment Choice Study, August 20156. Smart Card Alliance, Technologies for payment fraud prevention: EMV, encryption and tokenization, October 20147. https://www.pcisecuritystandards.org/documents/Assessment_Guidance_Non-Listed_Encryption_Solutions.pdf8. PCI SSC, Preparing for PCI DSS 3.2, February 20169. PCI SSC, Information Supplement: Best practices for Maintaining PCI DSS Compliance, August 201410. UCLA, How to establish effective controls, 200611. https://www.pcisecuritystandards.org/documents/Skimming%20Prevention%20BP%20for%20Merchants%20Sept2014.pdf12. http://www.verizonenterprise.com/verizon-insights-lab/dbir/