revenue collection equipment: tracking maintenance data · revenue collection equipment: tracking...
TRANSCRIPT

By Nicholas Eull Metro Transit Minneapolis, MN
APTA Fare Collection 101 Dallas/Ft. Worth, Texas March 22nd – 24th, 2012
Revenue Collection Equipment: Tracking Maintenance Data
Presentation Objectives
• Information on Metro Transit
• Understanding of Metro Transit’s measurements process and growth
• Look at identifying which data to collect
• Look at how to interpret the data
• Translate data into performance metrics/KPI
• Use measurements to drive actions
• Communicate data

• General Manager/CEO – How often are our ticket vending machines failing?
• Garage Operations Manager – How does the reliability of fareboxes compare to the other garages? Why the difference?
• Finance Manager – How many on-road farebox failures did we have in 2011?
• Revenue Equipment Technician – What was eventually done to fix the farebox on bus 23?
Could you answers these questions?
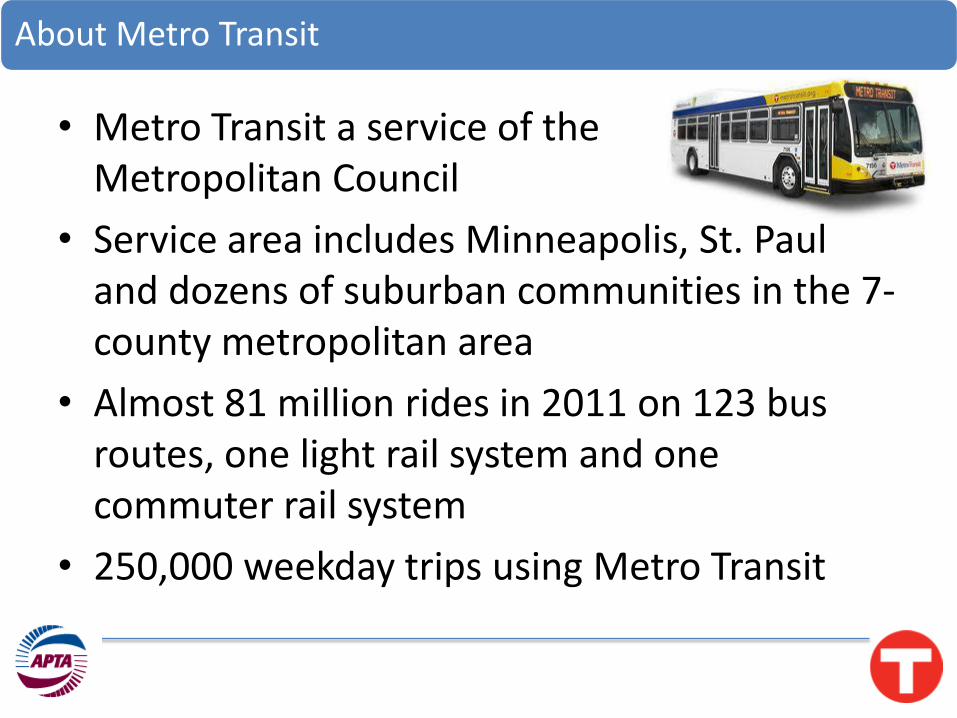
About Metro Transit
• Metro Transit a service of the Metropolitan Council
• Service area includes Minneapolis, St. Paul and dozens of suburban communities in the 7-county metropolitan area
• Almost 81 million rides in 2011 on 123 bus routes, one light rail system and one commuter rail system
• 250,000 weekday trips using Metro Transit

Metro Transit Revenue Collection Equipment
Bus
• GFI Cents-A-Bill w/TRiM (1,500)
– 1992 (Farebox)
– 1996 (TRiM)
• Cubic Smartcard Readers
– 2004
Rail
• Cubic TVMs (90)
– 2004
• Cubic Smartcard Validators (90)
– 2004
Department Operations
Farebox Repair • 13 Farebox Maintainers
• Six different locations
• Seven day support
– 5 a.m. – 9 p.m. M-F
– One 10 hr shift on weekend days
• Weekday road call support
TVM Repair • Nine Electronic Techs
• Centralized location
• Perform all TVM and other advanced repairs
• 5 a.m. to 9 p.m. seven day support
• Two-year degrees
Our Challenges
• Fareboxes were failing - often
– Limited data
• No easy access to any TVM maintenance information
• Difficult to organize data for determining KPIs
• Limited ability to communicate information to front line personnel to address

Maintenance Data: Where We Started
• TVM: Photocopied sheets – TVMs not tracked electronically/centrally
• FB: Electronic but lacking sufficient detail
• Maintenance forms not well organized – Data entry boxes not clear
– Inconsistent data entry between techs
– Failures not consistent/organized
– Required too much “writing”
• Difficult to report off data – No TVM data to report against

Identifying Critical Data
• Identifying the critical components to track individually – Some thought must go into this step to keep the
data relevant
• One size doesn’t necessarily fit all – Separate forms for fareboxes and TVMs
• How will information be organized on maintenance form
• What other information is required or would be useful
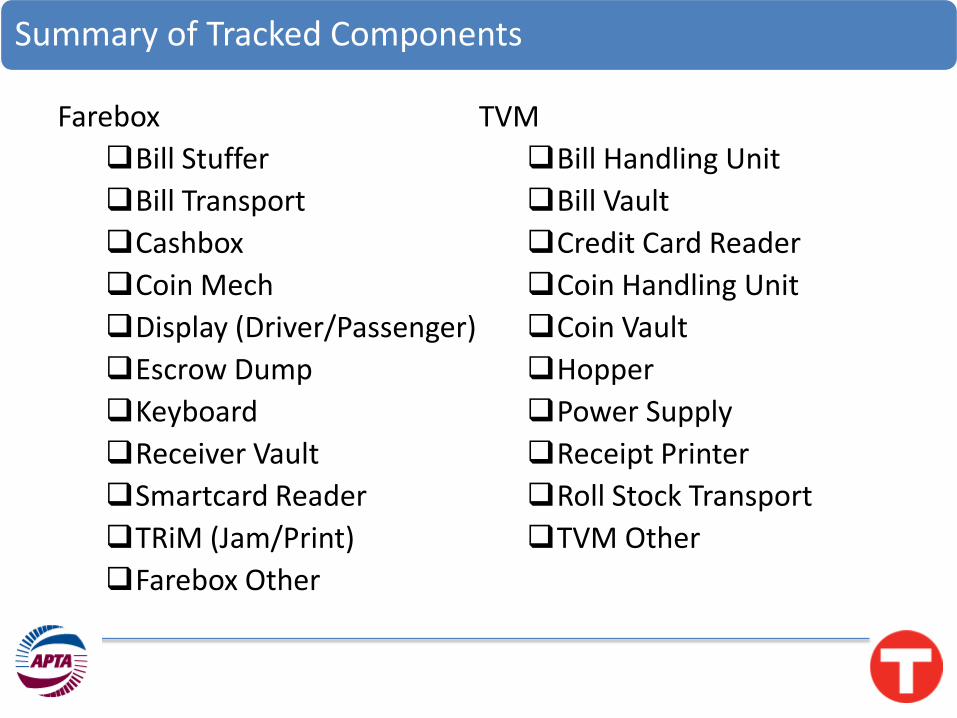
Summary of Tracked Components
Farebox
Bill Stuffer
Bill Transport
Cashbox
Coin Mech
Display (Driver/Passenger)
Escrow Dump
Keyboard
Receiver Vault
Smartcard Reader
TRiM (Jam/Print)
Farebox Other
TVM
Bill Handling Unit
Bill Vault
Credit Card Reader
Coin Handling Unit
Coin Vault
Hopper
Power Supply
Receipt Printer
Roll Stock Transport
TVM Other

Failure Types
Abuse
Customer Error
Malfunction
Operator Error
Vandalism
Other
No Problem Found

Critical Information
• Equipment identification number – As a whole or individual module numbers
• Garage Location
• Time/date
• Failure description
• Action taken
• Hours to repair
• Employee number/initials
• Comments/notes
Collecting the Data
• Centralized or decentralized data entry
– Metro Transit moved to a centralized entry point
• Leveraging current systems
– Metro Transit uses TxBase system to accommodate data collection and reporting
– Modified bus maintenance process to fit fare collection repair needs
• Building a new system
– Would a simple Access database meet needs?

Key Performance Indicators (KPI)
• Develop first, and then follow the process – What is a failure?
– How do you measure? • Time
• Between transactions
• By rides
• Most value is comparing one period to another period – System wide
– By garage
– By module
– By technician
• No universal standards
Metro Transit’s Process
• Failure: Incident that prevents full function utilization of equipment
• Doesn’t always mean machine is “unusable”
– Failure ≠ “preventable”
– Be careful about asking employees to provide input to “Preventable”, “Failure”, etc.
Metro Transit’s Process
• Use “Mean Transactions Between Failures” (MTBF) as metric/KPI
Fareboxes:
Rough measurement derived independent of technicians assessment
Ticket Vending Machines: Information from technicians maintenance reports used to calculate

Calculating the Measurements/KPI
Nicollet Heywood Ruter South
East
Metro
System
Rides
FBX Only
Rides
Go-To
Rides
Trouble
Calls
Jan 2011 FB Rides
(1,000s) 753 705 354 395 724 5,393 2,931 2,462
Jan 2011 Go-To
Rides (1,000s) 568 648 322 358 566 Go-To %: 46%
Jan 2011 FB
Failures 102 156 46 62 113 479
Jan 2011 Go-To
Failures 26 33 6 10 16 91
Total 128 189 52 72 129 570
Jan 2011 FB MTBF 7,382 4,519 7,696 6,371 6,407
Jan 2011 Go-To
MTBF 21,846 19,636 53,667 35,800 35,375
• Farebox and Smartcard rides identified separately • Total number of incidents for each garage location
identified • Aggregate totals used to generate measurements

Individual and Collective Data Usage
3,000
4,000
5,000
6,000
7,000
8,000
9,000
10,000
NIC FTH
MJR SOU
EM System Average

Individual Location Performance
0
1,000
2,000
3,000
4,000
5,000
6,000
7,000
8,000
9,000
10,000
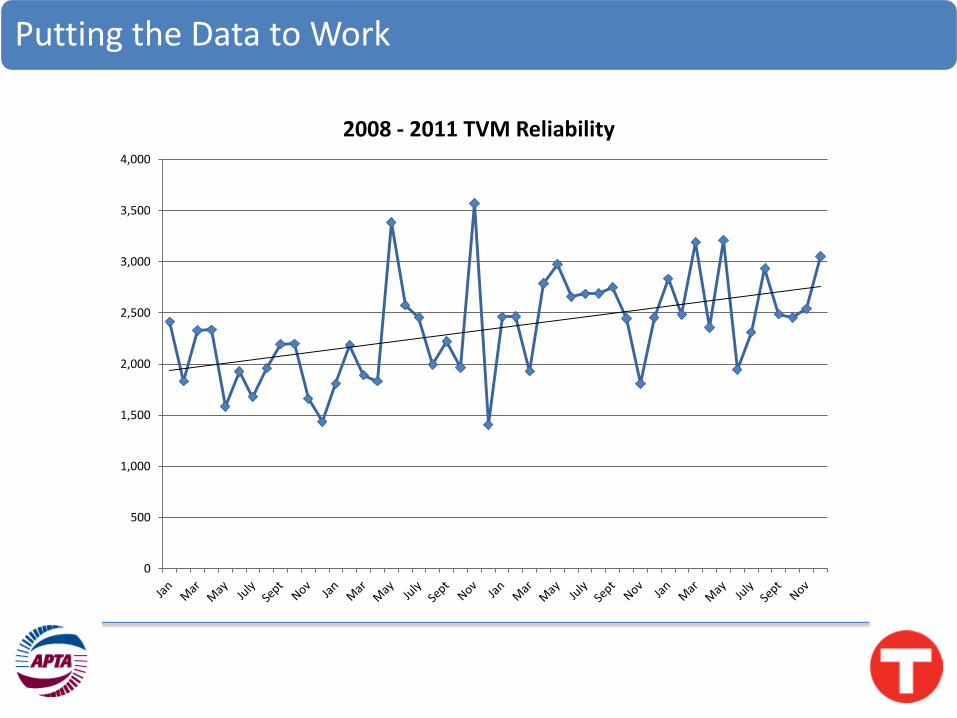
Putting the Data to Work
0
500
1,000
1,500
2,000
2,500
3,000
3,500
4,000
2008 - 2011 TVM Reliability

Putting the Data to Work
0.00
1000.00
2000.00
3000.00
4000.00
5000.00
6000.00
7000.00
8000.00
9000.00 2008 - 2011 Farebox Reliability

Reviewing the Data - Farebox
Date Bus
Number Procedure Tech Comments Garage
1/21/12 0722 SC Jensen Replaced out of service Go-To card reader 3356
1/24/12 0822 SC Jensen Go-To card reader indicated failed target – Power cycled bus 3356
1/24/12 1200 TJ Jensen Jammed TRiM unit - Replaced 3356
1/24/12 1220 CM Jensen Coin mech jam - Cleared 3356
1/26/12 3331 TO Jensen TRiM won’t read - Replaced 3356
1/26/12 0520 SC Allen Go-To not displaying ----------------- Removed Go-To reader
50997/9555, installed 51262/17749 3351
1/24/12 1005 CM Allen Coin mech jam reported – Tested, NPF 3351
1/24/12 1068 TJ Allen TRiM jam – Adjusted cassette, tested, OK 3351
1/24/12 7164 CM Allen Coin mech reading wrong – adjusted and tested, OK 3351
1/24/12 7223 FB Allen Farebox not working – Looks like harness issue. Removed
farebox 3351
1/27/12 0866 TJ Allen TRiM jam – Adjusted cassette, tested, OK 3353
1/24/12 0868 TO Allen TRiM not working – Bearings appear seized. Replaced TRiM. 3353
1/24/12 1042 TO Allen TRiM double dips transfers – Replaced TRiM 3354
1/24/12 1213 CM Allen Coin mech reading wrong – adjusted and tested, OK 3353
1/27/12 3120 SC Allen Can’t log on to Go-To reader – MDT issue. Reported to Radio
shop. 3353

Drilling Down Further
• Look at location-specific failures for components or modules
• Figure out best way to measure – Specific component failures per 100 buses?
• Consider environmental variables in reviewing numbers
Farebox Bill Stuffer Bill Transport Cashbox Coin Mech Display (Driver/Passenger)
Escrow Dump Keyboard Receiver Vault Smartcard Reader TRiM (Jam/Print) Farebox Other
Providing Access to Data
• Managers/supervisors
– Monitor performance
– Track KPI
• Technicians
– Historical repair information
– Required preventive maintenance schedules
• Customer service
– Investigate/resolve customer issues
• Automate where possible!

Automated Reports - Fareboxes

Summary
• How are you recording information?
• Will your existing system work?
• User friendly information
• Data helps drive efforts
• Automate data distribution
• Change/modify data,
categories, reports, etc. as experience grows