revenue group berhad 2q fy2019 corporate presentation
TRANSCRIPT

CORPORATE PRESENTATION
Recognised by international and world renowned payment schemes Recognised by international and world renowned payment schemes
Revenue Group Berhad
2Q FY2019
Quarterly Results Presentation

2
DISCLAIMER
Information contained in our presentation is intended solely for your personal referenceand is strictly confidential. Such information is subject to change without notice, itsaccuracy is not guaranteed and it may not contain all material information about thecompany. Neither we nor our advisors make any representation regarding, and assumeno responsibility or liability for, the accuracy or completeness of, or any errors oromissions in, any information contained herein.
In addition, the information contains projections and forward looking statements thatreflect the company’s current views with respect to future events and financialperformance. These views are based on current assumptions which are subject tovarious risks and which may change over time. No assurance can be given that futureevents will occur, that projections will be achieved, or that the company’s assumptionsare correct. Actual results may differ materially from those projected.
This presentation is strictly not to be distributed without the explicit consent of theCompany’s management under any circumstances.

Brief Introduction of Our Core Business
3

4
REVENUE Group 3 Core Business Segments
Segments
(i) EDC Terminals
REVENUE is principally engaged in three (3) core business segments:
Distribution, deployment and maintenance of EDC terminals.
(a) Monthly rental income from renting our EDC terminalsto our customers;
(b) Monthly maintenance income from the maintenance ofEDC terminals; and
(c) Income from the sale of EDC terminals and spareparts.
(ii) Electronic TransactionProcessing
Principal Activities Revenue derived from:
Provision of electronic transactionprocessing services for creditcards, debit cards and electronicmoney payment scheme, wherethe Group acts as Acquirer, MasterMerchant (“MM”) or Third-PartyPayment Processor (“TPP ”).
(a) Net Merchant Discount Rate (“MDR”) earned from theprocessing of electronic transactions via the EDCterminal channel (card-present);
(b) Pre-determined commission earned from theprocessing of electronic transactions via e-commerce/mobile channel (card-not-present);
(c) A share of Net MDR earned as a TPP; and(d) A share of Net MDR earned as a MM.
(iii) Solutions & Services
Provision of solutions andservices in relation topayment gateway, paymentnetwork security and paymentinfrastructure.
(a) Sales, development and licensing of software, paymentnetwork security solutions, as well as its relatedhardware including its maintenance services.

5
revPAY - Single Platform, Multiple Channel and Multiple Roles Solutions…
Our Proprietary Platform – revPAY

Operational Highlights &Business Strategies
6

PURPOSEESTIMATED TIMEFRAME
AMOUNT (RM’000)
%
Capital expenditure 24 months 8,100 39.3
Enhancement of revPAY and expansion of IT Team
24 months 4,040 19.6
Repayment of bank borrowings
3 months 2,500 12.1
Business expansion 24 months 1,500 7.3
Working capital 24 months 1,773 8.6
Estimated listing expenses Immediate 2,700 13.1
Total 20,613 100.0
7
Utilisation of IPO Proceeds
39.30%
19.60%
12.10%
7.30%
8.6%
13.1%Capital Expenditure
Enhancement of revPAY andExpansion of IT TeamRapayment of Bank Borrowings
Business Expansion
Working Capital

8
1.0 Capital Expenditure
Purchase approximately 9,000 units of EDC terminals and will be deploying all
progressively to our partner banks
RM8.1 million
From Traditional to Smart
WE took the lead to roll out Smart EDC Terminals in Malaysia despite the market being predominantly occupied by “conventional” EDC Terminals currently
Provide value-add to our clients by increasing theircompetitiveness with more payment acceptanceoptions - lead to higher transaction volume
New Smart EDC Terminals are able to accept e-walletpayment i.e. payment is processed via QR codescanning mode
Leverage on high mobile phone penetration rate inMalaysia with rising number of mobile paymenttransactions
Gain first mover advantage by introducing Smart EDCTerminals more aggressively than others in order toacquire larger market shares in the e-paymentindustry

9
1.1 REVENUE To Focus On Expanding Market Share in Malaysia
Revenue to focus on expanding market share in Malaysia
10 December 2018 - ACE Market-listed Revenue Group Bhd, which has launched Malaysia’s first all-in-one digital payment terminal - also known as smart EDC (electronic data capture) or androidterminal — with Public Bank Bhd in November, expects the new terminals to flood the local market inthe next three to four years, as the payment market here transitions to the new innovation.
Source: The Edge
Source: The Edge

10
1.2 主打非主流付账市场 -多合一策略壮大规模
主打非主流付账市场 -多合一策略壮大规模
8 December 2018 – 推出多合一数码支付终端机,并不只是单纯的商业噱头。银丰集团的策略,向来就是从“多”着手,该公司是银联,MYDEBIT, 大来(Diners Club), 新加坡星网 (Nets),
JCB及另一家要求保密的“客户A” 的授权收单机构(acquirer),让该公司在付账验收行业的激烈竞争中,不仅生存下来,而且持续壮大。
Source: The Busy Weekly
Source: The Busy Weekly

11
1.3 Multiple E-Payment Options At All-In-One Digital Terminals
Public Bank, Revenue Group launch all-in-one digital payment platform
8 November 2018 - Public Bank Bhd has teamed up with Revenue Group Bhd to launch the all-in-onedigital payment terminals on 8 November 2018.
The payment terminals can handle mobile Quick Response (QR) code payment services includingAlipay, Boost, Touch ’n Go, UnionPay QR and WeChat Pay, as well as card payments such as Visa,MasterCard, MyDebit, JCB and UnionPay, making payment management simpler and more efficient forphysical retail merchants.
Source: The Star
Source: The Star

12
Hong Leong Bank Berhad introduces first all-in-one payment terminal
30 October 2018 - In another first-to-market achievement, Hong Leong Bank Berhad (‘HLB’ or ‘theBank’) today announced that it has introduced a new generation of integrated and innovative all-in-onesmart Point-of-Sales (POS) terminal for merchants that is able to integrate and accept all cards and e-payment transactions in a single device for the first time in Malaysia.
Merchants signing up to HLB’s all-in-one smart POS terminal will be able to accept all card schemesand mobile payments, including major e-wallet operators with optional on-the-spot reward pointredemption features, all integrated within the same terminal.
Source: Focus Malaysia
Source: Focus Malaysia
1.3 Multiple E-Payment Options At All-In-One Digital Terminals (Cont’d)

13
1.4 REVENUE Ties Up With Merchantrade Asia
Merchantrade ties up with Revenue for seamless payment option
7 November 2018 - Merchantrade said the two companies have inked an agreement which will allowshoppers to shop on Taobao and make payments using their Merchantrade Money on the revPAYplatform.
“With the additional payment options made available to consumers via the e-wallet application ofMerchantrade Money, consumers will have the flexibility to make payment according to their preferenceand choice,” it said in a statement.
Source: New Straits Times
Source: New Straits Times

14
1.5 REVENUE ties up with Big Loyalty
Revenue ties up with Big Loyalty offering BIG Points earning & redemption
10 November 2018 - Shopping on Taobao.com is now more rewarding as shoppers can earn BIG Pointswhile enjoying incredible discounts on fashion, furniture, household items, electronics and more items.
“Rewarding our BIG Members from flying alone isn’t enough. We want to push the boundaries of traditionalairline loyalty to reward them for what they love to do every day, such as online shopping. That’s why we’revery excited about extending our BIG Points reward to Taobao.com, which is very popular with our 20million-plus members. By extending our rewards pillar this way, we are making it easy for our members toearn BIG Points so they can redeem flights for free even faster,” said acting AirAsia BIG Loyalty chiefexecutive officer (CEO) Sereen Teoh.
Source: The Borneo Post
Source: The Borneo Post

2.0 Development of New Products
On-Going R&D development and projects
New Products
1 QR Payment System
2 E-Wallet Solutions
Our QR Payment system for UnionPay has been launched in 1H2018. Movingforward, we will continue with the development of QR Payment to supportother Card Schemes.
Our IT Team is also developing the e-wallet solutions for Issuers, which will beintegrating with revPAY.
The e-wallet solutions will enable Issuers to offer their Cardholders the abilityto store their debit cards and/or credit cards payment information onto theirmobile devices.

16
2.0 Development of New Products (Cont’d)
Retail Merchant
Consumer Scan Merchant’s QR Code
Merchant Scan Consumer’s QR Code
Consumer
Merchant Present Mode Consumer Present Mode
QR Payment System

17
3.0 Big Data Analysis
Big Data: A Game Changer in The Retail Sector
Today, retailers have a wide range of tools available to them in order to work out what will be thisseason’s “must have” items, whether that be children’s toys or designer dresses. Trend forecastingalgorithms comb social media posts and web browsing habits to work out what’s causing a buzz, andad-buying data is analysed to see what marketing departments will be pushing.
Big Data analytics is now being applied at every stage of the retail process – working out what thepopular products will be by predicting trends, forecasting where the demand will be for thoseproducts, optimizing pricing for a competitive edge, identifying the customers likely to beinterested in them and working out the best way to approach them, taking their moneyand finally working out what to sell them next.
Source: Forbes
Source: Forbes

18
3.0 Big Data Analysis (Cont’d)
REVENUE’s Big Data to Deliver High-Impact Targeting for Marketing and Sales
DATA SOURCES
▪ Raw Data
▪ Transaction Activity
▪ Time of Transaction
▪ Amount (RM) per ticket size
BIG DATA ANALYSIS & OPTIMIZATION
Filter and conduct data analysis via systematic scientific method and statistical analysis to turn data into useful and applicable information.
RECOGNIZING RESULTS & PATTERNS
▪ Sales Trends
▪ Seasonal Patterns
▪ Average ticket size
▪ Payment options used
▪ Abnormal transactions
VALUE CREATION
Customer Behavior
Analytics
Personalizing the In-Store
Experience with Big Data
Increasing conversion rates
through predictive analytics
and targeted promotions
Results to be viewed in the form of:-
1. Normal Report - Free & Complimentary2. Special Report/Full Report - With Charges/Terms & Conditions3. Fraud Protection Report - Free & Complimentary
19
4.0 Human Resource Strategy
REVENUE’s Human Resource Strategy - The Human Resource Programme
(i) Career Advancement Programs
REVENUE believes a company’s biggest and most precious investment is its employees. Weactively invest in the development of our employees. We help employees set achievable goals,offer in-house training sessions and external training & courses.
A career advancement program helps sustain employee engagement, as employees are giventhe opportunity to progress both personally and professionally. It helps nurture talent withinthe organization, reducing the time and costs associated with hiring outside employees.
(ii) Recruitment Strategy - Direct Hiring, Employment Fair & Internships
REVENUE collaborates with a number of universities including UTAR, UPM, New Era UniversityCollege, UiTM and etc. to seek for qualified and talented students to join REVENUE’s team asinterns or full-time candidates. We also actively engaged in Employment Fair in theseuniversities to seek for talents. One of the best ways to make our company visible to potentialyoung employees is to get engaged in academic circles.

20
4.0 Human Resource Strategy (Cont’d)
REVENUE’s Human Resource Strategy - The Human Resource Programme
Top 3 Objectives and Benefits of enrolling in Human Resource Programme
Human Resource
Programme
Employee training anddevelopment also increasescompany productivity, andthat drives business growth.
By enrolling in humanresource programs, we willincrease the chances of having ahigh employee retention rate inREVENUE. A reduced employeeturnover means that we will beable to save the time, effort andmoney incurred in developing anunskilled workforce.
It is important to enrol insuch a program becausehaving skilled andcompetent leaders are vitalfor any businessorganization. This willensure the continuity ofchain of command withinthe organization.

Financial Highlights & Segmental Breakdown
21

22
Reported Yearly Financial Performance
Financial Year (s) ended 30 JuneAudited Audited Audited Audited Unaudited
(RM million)FY2015
(12 months)FY2016
(12 months)FY2017
(12 months)FY2018
(12 months)FY2019
(6 months)
Revenue 14.386 25.726 26.526 35.363 28.424
Gross Profit 9.549 14.129 15.746 22.940 15.965
Gross Profit Margin 66.4% 54.9% 59.4% 64.9% 56.2%
(+) Add : Other Income 0.593 0.468 3.435 0.407 0.069
(-) Minus : Administrative Expenses (6.967) (8.129) (10.078) (13.613) (9.289)
(-) Minus : Finance Costs (0.450) (0.547) (0.532) (0.400) (0.200)
Profit Before Tax 2.725 5.921 8.571 9.334 6.545
Profit Before Tax Margin 18.9% 23.0% 32.3% 26.4% 23.0%
Profit After Tax 2.116 4.513 6.932 7.024 4.805
Profit After Tax Margin 14.7% 17.5% 26.1% 19.9% 16.9%
Net Profit Attributable to Owners of the Company
2.116 4.513 6.976 6.775 4.311
EPS (sen)(1) 0.95 2.03 3.13 3.04 1.93
Note:(1) All of the EPS were calculated based on net profit attributable to owners of the Company divided by the enlarged share
capital of 222,848,000 after our IPO.

23
Adjusted Pro Forma Yearly Financial Performance
Financial Year (s) ended 30 JuneAudited Audited Audited Audited Unaudited
(RM million)FY2015
(12 months)FY2016
(12 months)FY2017
(12 months)FY2018
(12 months)FY2019
(6 months)
Revenue 14.386 25.726 26.526 35.363 28.424
Gross Profit 9.549 14.129 15.746 22.940 15.965
Gross Profit Margin 66.4% 54.9% 59.4% 64.9% 56.2%
Profit Before Tax 2.725 5.921 8.571 9.334 6.545
Profit Before Tax Margin 18.9% 23.0% 32.3% 26.4% 23.0%
(+) Add : Listing expenses - - - 0.497 0.640
(-) Minus : Non-Operating Income(1) - - (1.961) - -
Pro forma Adjusted Profit Profit Before Tax 2.725 5.921 6.610 9.831 7.185
Pro forma Adjusted Profit Before Tax Margin 18.9% 23.0% 24.9% 27.8% 25.3%
(+) Add : Real Property Gains Tax - - 0.248 - -
Pro forma Adjusted Profit After Tax(2) 2.116 4.513 5.219 7.521 5.445
Pro forma Adjusted Profit After Tax Margin 14.7% 17.5% 19.7% 21.3% 19.2%
Pro forma Adjusted Net Profit Attributable to Owners of the Company
2.116 4.513 5.261 7.272 4.951
EPS (sen)(3) 0.95 2.03 2.36 3.26 2.22

24
Adjusted Pro Forma Yearly Financial Performance (Cont’d)
Notes:
(1) Non-Operating income includes gain on disposal of investment properties of RM2.063 million net off real propertygains tax of RM0.248 million and one-off real estate agency commission of RM0.102 million relating to disposal ofinvestment properties.
(2) The pro forma adjusted Profit After Tax of RM7.521 million and RM5.445 in FY2018 and FY 2019 have not takeninto account the tax effect for the listing expenses of RM0.497 million and RM0.64 million respectively.
(3) All of the EPS were calculated based on net profit attributable to owners of the Company divided by the enlargedshare capital of 222,848,000 after our IPO.
25
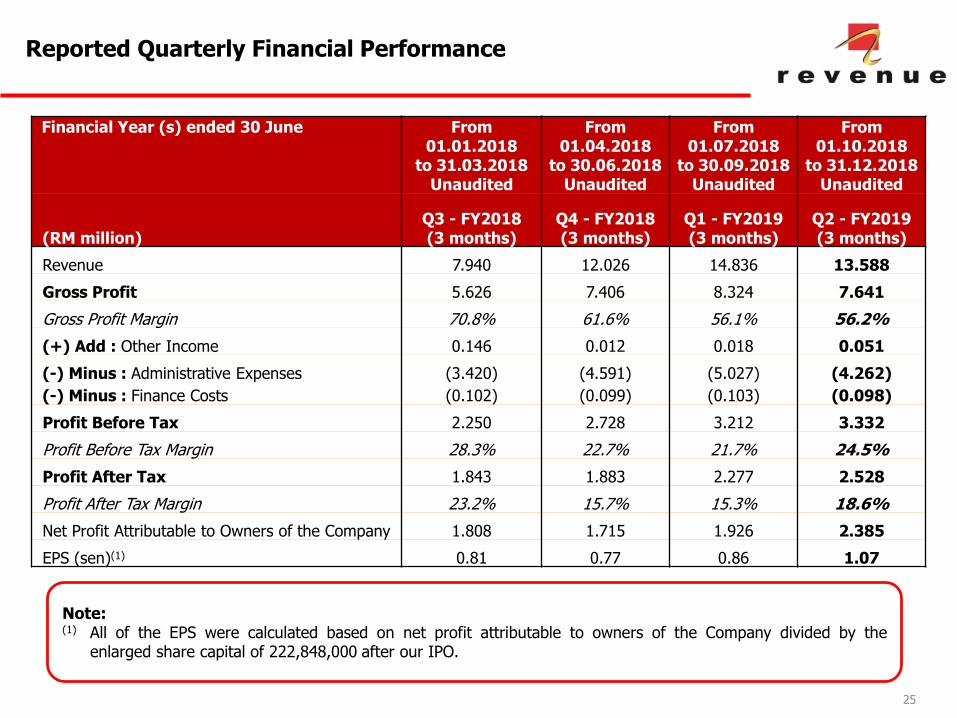
Reported Quarterly Financial Performance
Financial Year (s) ended 30 June From 01.01.2018
to 31.03.2018Unaudited
From 01.04.2018
to 30.06.2018Unaudited
From 01.07.2018
to 30.09.2018Unaudited
From 01.10.2018
to 31.12.2018Unaudited
(RM million)Q3 - FY2018(3 months)
Q4 - FY2018(3 months)
Q1 - FY2019(3 months)
Q2 - FY2019(3 months)
Revenue 7.940 12.026 14.836 13.588
Gross Profit 5.626 7.406 8.324 7.641
Gross Profit Margin 70.8% 61.6% 56.1% 56.2%
(+) Add : Other Income 0.146 0.012 0.018 0.051
(-) Minus : Administrative Expenses (3.420) (4.591) (5.027) (4.262)
(-) Minus : Finance Costs (0.102) (0.099) (0.103) (0.098)
Profit Before Tax 2.250 2.728 3.212 3.332
Profit Before Tax Margin 28.3% 22.7% 21.7% 24.5%
Profit After Tax 1.843 1.883 2.277 2.528
Profit After Tax Margin 23.2% 15.7% 15.3% 18.6%
Net Profit Attributable to Owners of the Company 1.808 1.715 1.926 2.385
EPS (sen)(1) 0.81 0.77 0.86 1.07
Note:(1) All of the EPS were calculated based on net profit attributable to owners of the Company divided by the
enlarged share capital of 222,848,000 after our IPO.

26
Adjusted Pro Forma Quarterly Performance
Financial Year (s) ended 30 June From 01.01.2018
to 31.03.2018Unaudited
From 01.04.2018
to 30.06.2018Unaudited
From 01.07.2018
to 30.09.2018Unaudited
From 01.10.2018
to 31.12.2018Unaudited
(RM million)Q3 - FY2018(3 months)
Q4 - FY2018(3 months)
Q1 - FY2019(3 months)
Q2 - FY2019(3 months)
Revenue 7.940 12.026 14.836 13.588
Gross Profit 5.626 7.406 8.324 7.641
Gross Profit Margin 70.8% 61.6% 56.1% 56.2%
Profit Before Tax 2.250 2.728 3.212 3.332
Profit Before Tax Margin 28.3% 22.7% 21.7% 24.5%
(+) Add : Listing Expenses - 0.497 0.640 -
Pro forma Adjusted Profit Before Tax 2.250 3.225 3.852 3.332
Pro forma Adjusted Profit Before Tax Margin 28.3% 26.8% 26.0% 24.5%
Pro forma Adjusted Profit After Tax(1) 1.843 2.380 2.917 2.528
Pro forma Adjusted Profit After Tax Margin 23.2% 19.8% 19.7% 18.6%Pro forma Adjusted Net Profit Attributable to Owners of the Company 1.808 2.212 2.566 2.385
EPS (sen)(2) 0.81 0.99 1.15 1.07
Notes:(1) The pro forma adjusted Profit After Tax of RM2.380 million and RM2.917 million in Q4 - FY2018 and Q1 - FY2019 have not
taken into account the tax effect for the listing expenses of RM0.497 million and RM0.640 million respectively.(2) All of the EPS were calculated based on net profit attributable to owners of the Company divided by the enlarged share
capital of 222,848,000 after our IPO.
27
Unaudited Condensed Consolidated Statements of Change in Equity
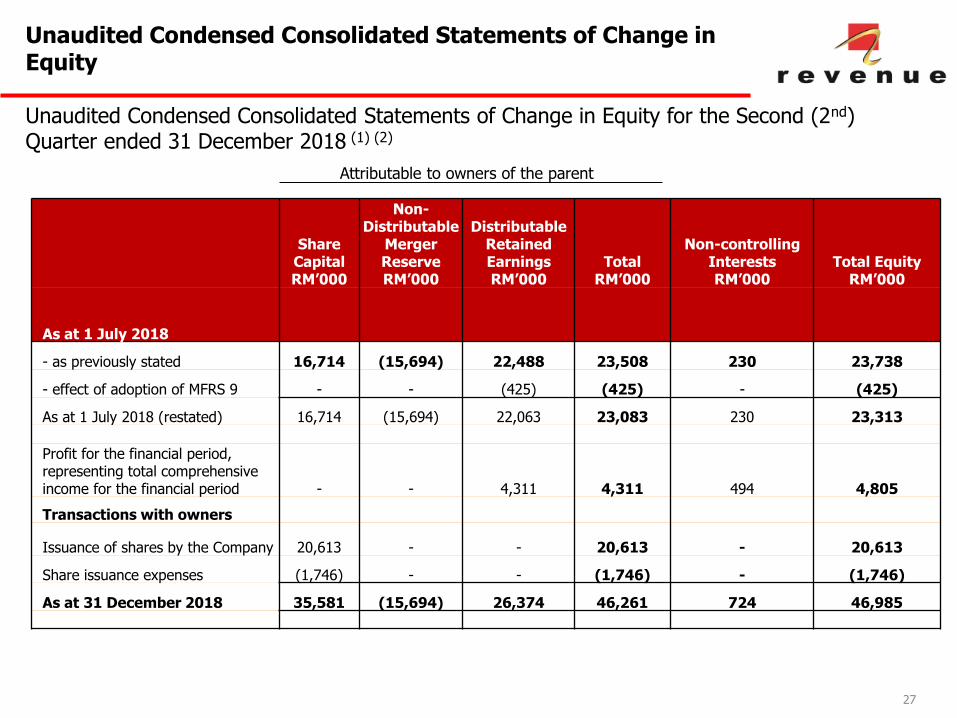
Unaudited Condensed Consolidated Statements of Change in Equity for the Second (2nd) Quarter ended 31 December 2018 (1) (2)
Share CapitalRM’000
Non-Distributable
Merger ReserveRM’000
Distributable Retained EarningsRM’000
TotalRM’000
Non-controlling InterestsRM’000
Total EquityRM’000
As at 1 July 2018
- as previously stated 16,714 (15,694) 22,488 23,508 230 23,738
- effect of adoption of MFRS 9 - - (425) (425) - (425)
As at 1 July 2018 (restated) 16,714 (15,694) 22,063 23,083 230 23,313
Profit for the financial period, representing total comprehensive income for the financial period - - 4,311 4,311 494 4,805
Transactions with owners
Issuance of shares by the Company 20,613 - - 20,613 - 20,613
Share issuance expenses (1,746) - - (1,746) - (1,746)
As at 31 December 2018 35,581 (15,694) 26,374 46,261 724 46,985
Attributable to owners of the parent

28
Unaudited Condensed Consolidated Statements of Change in Equity (Cont’d)
Notes:
(1) The basis of preparation of the Unaudited Condensed Consolidated Statement of Changes in Equityare disclosed in Note A1 and the accompanying explanatory notes attached to Revenue Group Berhad’sQuarterly rpt on consolidated results for the financial period ended 31 December 2018.
(2) This interim financial report for the second (2nd) quarter ended 31 December 2018 is announced incompliance with the Listing Requirements of Bursa Securities. As the Company was only listed on theACE Market of Bursa Securities on 18 July 2018, there are no comparative figures for the precedingquarter available as no interim financial report was prepared for the comparative financial periodconcerned.
29
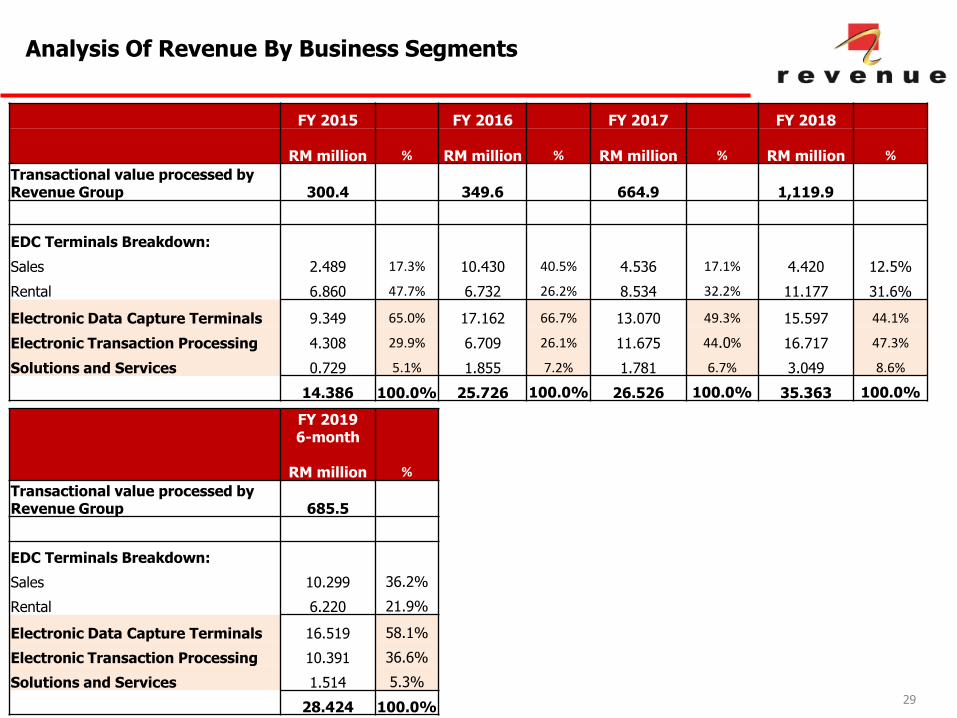
Analysis Of Revenue By Business Segments
FY 2015 FY 2016 FY 2017 FY 2018
RM million % RM million % RM million % RM million %
Transactional value processed by Revenue Group 300.4 349.6 664.9 1,119.9
EDC Terminals Breakdown:
Sales 2.489 17.3% 10.430 40.5% 4.536 17.1% 4.420 12.5%
Rental 6.860 47.7% 6.732 26.2% 8.534 32.2% 11.177 31.6%
Electronic Data Capture Terminals 9.349 65.0% 17.162 66.7% 13.070 49.3% 15.597 44.1%
Electronic Transaction Processing 4.308 29.9% 6.709 26.1% 11.675 44.0% 16.717 47.3%
Solutions and Services 0.729 5.1% 1.855 7.2% 1.781 6.7% 3.049 8.6%
14.386 100.0% 25.726 100.0% 26.526 100.0% 35.363 100.0%
FY 20196-month
RM million %
Transactional value processed by Revenue Group 685.5
EDC Terminals Breakdown:
Sales 10.299 36.2%
Rental 6.220 21.9%
Electronic Data Capture Terminals 16.519 58.1%
Electronic Transaction Processing 10.391 36.6%
Solutions and Services 1.514 5.3%
28.424 100.0%
30
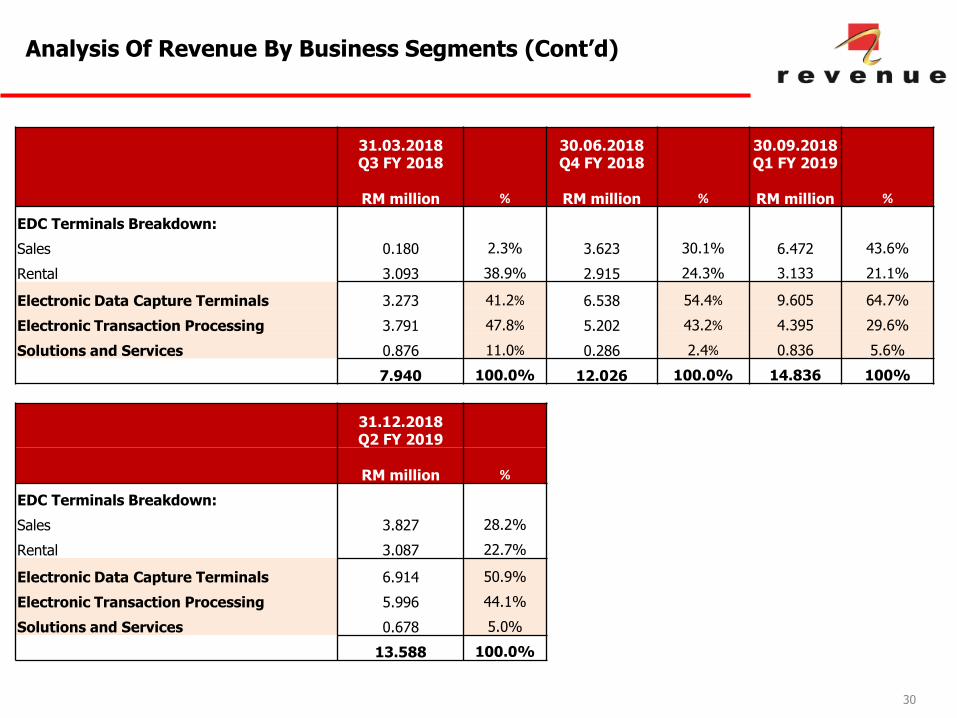
Analysis Of Revenue By Business Segments (Cont’d)
31.03.2018Q3 FY 2018
30.06.2018Q4 FY 2018
30.09.2018Q1 FY 2019
RM million % RM million % RM million %
EDC Terminals Breakdown:
Sales 0.180 2.3% 3.623 30.1% 6.472 43.6%
Rental 3.093 38.9% 2.915 24.3% 3.133 21.1%
Electronic Data Capture Terminals 3.273 41.2% 6.538 54.4% 9.605 64.7%
Electronic Transaction Processing 3.791 47.8% 5.202 43.2% 4.395 29.6%
Solutions and Services 0.876 11.0% 0.286 2.4% 0.836 5.6%
7.940 100.0% 12.026 100.0% 14.836 100%
31.12.2018Q2 FY 2019
RM million %
EDC Terminals Breakdown:
Sales 3.827 28.2%
Rental 3.087 22.7%
Electronic Data Capture Terminals 6.914 50.9%
Electronic Transaction Processing 5.996 44.1%
Solutions and Services 0.678 5.0%
13.588 100.0%
31
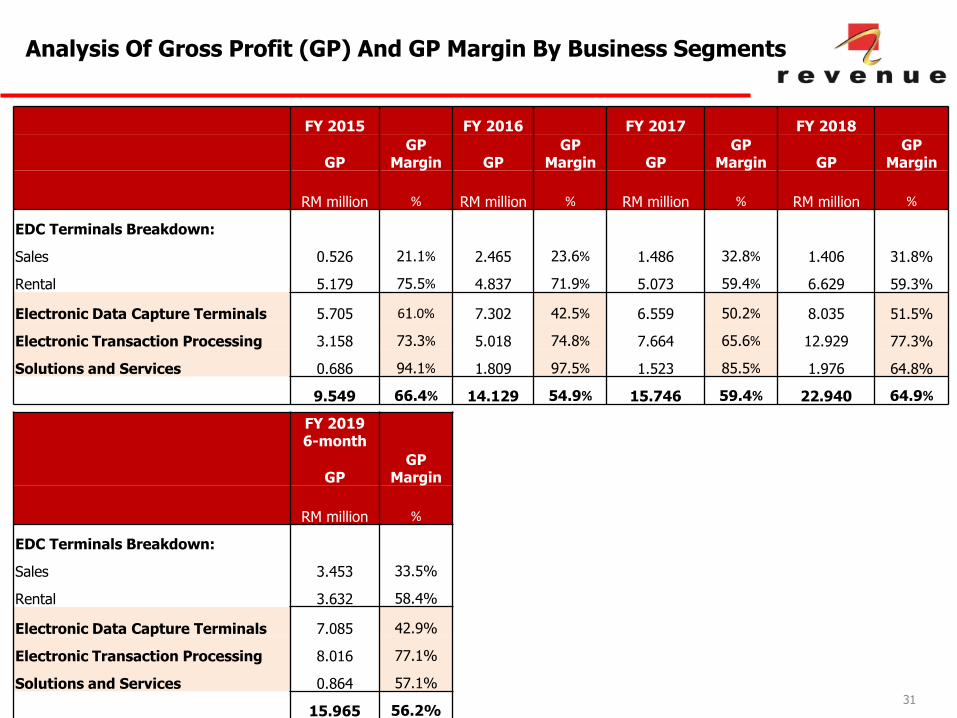
Analysis Of Gross Profit (GP) And GP Margin By Business Segments
FY 2015 FY 2016 FY 2017 FY 2018
GPGP
Margin GPGP
Margin GPGP
Margin GPGP
Margin
RM million % RM million % RM million % RM million %
EDC Terminals Breakdown:
Sales 0.526 21.1% 2.465 23.6% 1.486 32.8% 1.406 31.8%
Rental 5.179 75.5% 4.837 71.9% 5.073 59.4% 6.629 59.3%
Electronic Data Capture Terminals 5.705 61.0% 7.302 42.5% 6.559 50.2% 8.035 51.5%
Electronic Transaction Processing 3.158 73.3% 5.018 74.8% 7.664 65.6% 12.929 77.3%
Solutions and Services 0.686 94.1% 1.809 97.5% 1.523 85.5% 1.976 64.8%
9.549 66.4% 14.129 54.9% 15.746 59.4% 22.940 64.9%
FY 20196-month
GPGP
Margin
RM million %
EDC Terminals Breakdown:
Sales 3.453 33.5%
Rental 3.632 58.4%
Electronic Data Capture Terminals 7.085 42.9%
Electronic Transaction Processing 8.016 77.1%
Solutions and Services 0.864 57.1%
15.965 56.2%

32
31.03.2018Q3 FY 2018
30.06.2018Q4 FY 2018
30.09.2018Q1 FY 2019
GP GP Margin GP GP Margin GP GP Margin
RM million % RM million % RM million %
EDC Terminals Breakdown:
Sales 0.180 100% 0.888 24.5% 2.445 37.8%
Rental 1.890 61.1% 2.026 69.5% 1.985 63.3%
Electronic Data Capture Terminals 2.070 63.2% 2.914 44.6% 4.430 46.1%
Electronic Transaction Processing 2.792 73.6% 4.334 83.3% 3.487 79.3%
Solutions and Services 0.764 87.2% 0.158 55.5% 0.407 48.7%
5.626 70.9% 7.406 61.6% 8.324 56.1%
31.12.2018Q2 FY 2019
GP GP Margin
RM million %
EDC Terminals Breakdown:
Sales 1.007 26.3%
Rental 1.648 53.4%
Electronic Data Capture Terminals 2.655 38.4%
Electronic Transaction Processing 4.529 75.5%
Solutions and Services 0.457 67.4%
7.641 56.2%
Analysis Of Gross Profit (GP) And GP Margin By Business Segments(Cont’d)

33
Summary of Financial Position
(RM million)
Audited as at
30 June 2016
Audited as at
30 June 2017
Audited as at
30 June 2018
Unaudited as at
30 Sept 2018
Unaudited as at
31 Dec 2018
Current Assets 15.768 18.427 26.611 42.812 36.685
Current Liabilities 13.358 18.040 22.373 16.356 15.575
Current Ratio 1.18 times 1.02 times 1.19 times 2.62 times 2.36 times
Short Term Debt 0.453 1.209 1.224 1.116 0.205
Long Term Debt 11.553 7.378 7.146 7.128 5.578
Total Debt 12.006 8.587 8.369 8.244 5.783
Total Cash (Cash + FD)
9.862 9.787 15.260 26.821 25.691
Net Cash / (Net Debt)
(2.364) 1.200 6.891 18.577 19.908
Total Equity 11.987 16.694 23.738 44.457 46.985
Total Debt / Total Equity
100.2% 51.4% 35.3% 18.5% 12.3%
Net Debt / Total Equity
19.7% n/a n/a n/a n/a
Note: The gross gearing ratio of the Company has improved substantially over the years with reduction of bank borrowingsand improvement of total equity of the Company from 2015 to 2018. In fact, the Company financial status has turned into anet cash position since FY2017 and the Company has net cash of RM19.908 million as at 31 December 2018.
34
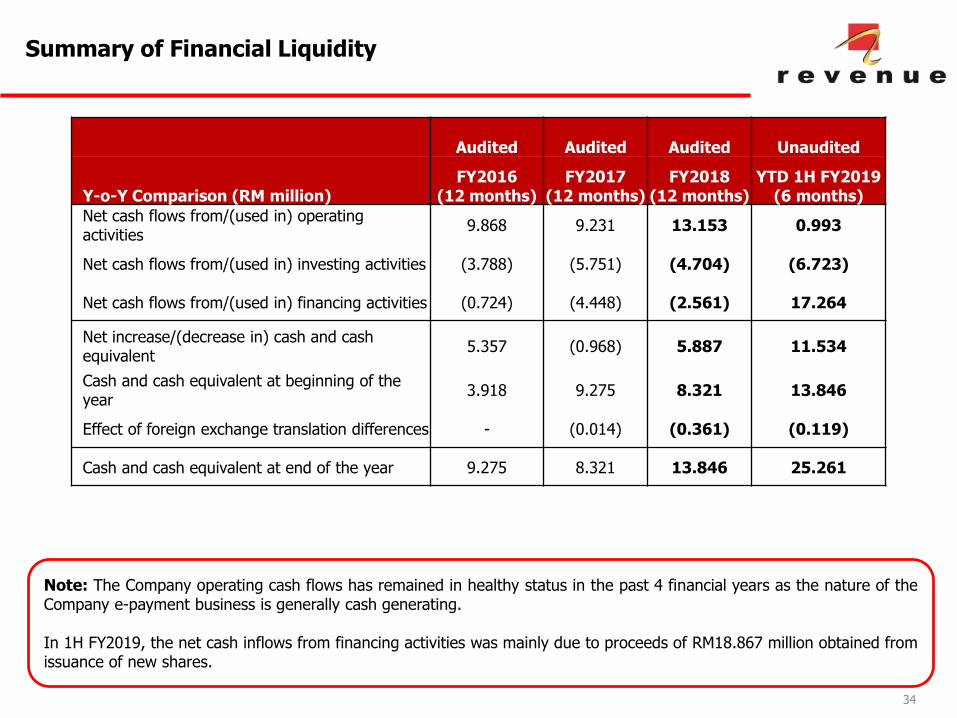
Summary of Financial Liquidity
Audited Audited Audited Unaudited
Y-o-Y Comparison (RM million)FY2016
(12 months)FY2017
(12 months)FY2018
(12 months)YTD 1H FY2019
(6 months)
Net cash flows from/(used in) operating activities
9.868 9.231 13.153 0.993
Net cash flows from/(used in) investing activities (3.788) (5.751) (4.704) (6.723)
Net cash flows from/(used in) financing activities (0.724) (4.448) (2.561) 17.264
Net increase/(decrease in) cash and cash equivalent
5.357 (0.968) 5.887 11.534
Cash and cash equivalent at beginning of the year
3.918 9.275 8.321 13.846
Effect of foreign exchange translation differences - (0.014) (0.361) (0.119)
Cash and cash equivalent at end of the year 9.275 8.321 13.846 25.261
Note: The Company operating cash flows has remained in healthy status in the past 4 financial years as the nature of theCompany e-payment business is generally cash generating.
In 1H FY2019, the net cash inflows from financing activities was mainly due to proceeds of RM18.867 million obtained fromissuance of new shares.

35
Breakdown of Cash Flows From Investing Activities
Audited Audited Audited Unaudited
Y-o-Y Comparison (RM million)FY2016
(12 months)FY2017
(12 months)FY2018
(12 months)FY2019
(6 months)
Cash flows from investing activities:
Net movement of amount due to Directors - (0.130) (0.230) -
Proceeds from disposal of property, plant and equipment
0.159 0.719 0.180 0.131
Proceeds from disposal of investment properties - 4.619 2.181 -
Purchase of property, plant and equipment (3.947) (10.959) (6.835) (6.854)
Net cash flows used in investing activities (3.788) (5.751) (4.704) (6.723)
Note: The net outflow from investing activities is anticipated to increase in FY2019 mainly due to a capital expenditure ofRM8.1 million which will be incurred by the Company to roll out about 9,000 units new EDC terminals in Malaysia over next24 months period. This amount forms part of the IPO proceeds which has been allocated by the Company in its listingexercise to expand its e-payment footprint further. There was net outflow from investing activities is mainly due to thecapital expenditure incurred where RM6.854 million was predominantly spent to purchase approximately 5,000 units of newEDC terminals.

36
Revenue Group BerhadIPO Price: RM0.37
Market Capitalisation: RM82,453,760(Enlarged Share Capital : 222,848,000)
Balloting
11,142,400(5.0%)
Eligible Directors and Employees
11,142,400(5.0%)
Private Placements
33,427,200(15.0%)
Offer for Sale
16,713,600(7.5%)
IPO Offering Structure
Note: With RM20.613 million gross proceeds was successfully raised from the Company listing exercise, the cash inflowsfrom financing activities is expected to increase substantially in 1Q FY2019 arising from IPO proceeds obtained fromissuance of new shares which was completed on the IPO shares listing date on 18 July 2018.

Details of UtilisationProposed Utilisation(RM’000)
Actual Utilisation(RM’000)
%
Estimated Timeframe
for Utilisation
Capital expenditure 8,100 1,350 39.3 24 months
Enhancement of revPAY and expansion of IT Team
4,040 - 19.6 24 months
Repayment of bank borrowings
2,500 2,500 12.1 3 months
Business expansion 1,500 - 7.3 24 months
Working capital 1,773 183 8.6 24 months
Listing expenses 2,700 2,700 13.1 Immediate
Total 20,613 6,733 100.0
37
Utilisation of IPO Proceeds
Note: With RM20.613 million gross proceeds was successfully raised from the Company listing exercise which wascompleted on the IPO shares listing date on 18 July 2018, the amount of unutilised IPO proceeds is RM13.880million as at 31 December 2018.

Shareholding Profile Analysis
38

39
Change Of Ordinary Shares Shareholding Profile
65.25%2.25%
5.00%
27.50%
Before 18 July 2018 Listing Date (Note)
Original 3 Founders
Chia Siea Chok
Directors & Employees
Public Free Float
64.58%
4.90%
30.52%
As at 31 January 2019
Original 3 Founders Local Funds
Public Free Float
Note: Both the 65.25% stake owned by 3 original founders, i.e. Ng Chee Siong (Group CEO cum MD), Ng Shih Chiow(Group COO cum ED) and Ng Shih Fang (Group CTO cum ED) and 2.25% stake owned by Chia Siea Chok are subject to6 months moratorium from the listing date of 17 July 2018. The actively traded free float in the open market is 32.5%out from the total enlarged share capital of 222,848,000 ordinary shares.

40
Change Of Revenue Warrant Holding Profile
65.25%34.75%
As at 15 January 2019 Allotment Date
Original 3 Founders
Public Free Float
46.40%
4.07%
49.53%
As at 31 January 2019
Original 3 Founders Local Funds
Public Free Float
Remarks :The Warrants may be exercised any time during the tenure of the Warrants of 5 years including and commencing from the issue date of the Warrants andending at 5.00 p,m, on the expiry date (provided that if such a day is not a market day, then it shall be the market day immediately preceding the saidnon-market day). Each Warrant carries the entitlement to subscribe for 1 new REVENUE Share at the exercise price of RM1.25 at any time during theexercise period (as indicated above) ("Exercise Period"), subject to the adjustments in accordance with the provisions of the deed poll dated 27 December2018, constituting the Warrants. Any Warrants not exercised during the Exercise Period will thereafter lapse and cease to be valid for any purpose.

Thank you
For more information, please refer to: http://www.revenue.com.my
For Investor Relations, please contact:
Mr Tan Yap Seng, Investor Relations Consultant, Elmo Management Services
Tel: +6016 336 4500
Email: [email protected]

Appendices
42

▪Overview
▪Revenue Group Berhad (REVENUE) is a cashless payment solutions provider in Malaysia offering a singleplatform that provides multi-channel payment solutions to different customers.
43
REVENUE Group 3 Core Business Segments And Corporate Milestones
Electronic Transaction Processing
EDC Terminals
Solutions and Services
▪Business Model
▪ Our Corporate Achievements & Milestones
2005 2007 2009 2011 2012
• EDC terminal vendor and MM for Visa and MasterCard of AmBank
• Acquirer for MyDebit of PayNet
• MyDebit’spartner of Affin Bank
• EDC terminal vendor and MM for Visa and MasterCard of OCBC
• Acquirer of UnionPay
• Acquirer for FPX and Direct Debit of PayNet
2013
• EDC terminal vendor and MM for Visa and MasterCard of First Data
• Acquirer by Company A to process outbound payments via internet banking
2014 2015 2016 2017
• EDC terminal vendor and MM for Visa MasterCard of UOB
• Acquirer of Diners Club
• EDC terminal vendor of Global Payments
• Acquirer for JCB Japan and NETS Singapore
• Acquirer of Company A for acceptance of QR payment
• EDC terminal vendor of AEON Credit Service (M) Berhad
2018
• Enroutefor IPO on the ACE Market of Bursa Securities

44
Material events subsequent to the end of current financial quarter (2Q FY2019)
Save as disclosed below, there were no other material events subsequent to the end ofthe current financial quarter that have not been reflected in this interim financial report.
Bonus issue of warrants
On 11 October 2018, the Company proposed to undertake a bonus issue of 111,424,000warrants on the basis of one warrant (“Warrant”) for every two existing REVENUE shares(“REVENUE Share”) held by the shareholders.
On 30 October 2018, Bursa Securities had, vide its letter dated 30 October 2018,resolved to approve the proposed bonus issue of warrants.
On 17 December 2018, the Board had resolved to fix the exercise price for the warrantsto be issued pursuant to the proposed bonus issue of warrants at RM1.25 per Warrant(“Exercise Price”), representing a discount of approximately 8.23% to the 5-day volumeweighted average market price of REVENUE Share up to and including 14 December2018 of approximately RM1.3621 per REVENUE Share.
Bonus issue of warrants was completed on 22 January 2019 upon the listing of andquotation for 111,424,000 warrants on the ACE Market of Bursa Securities.
45
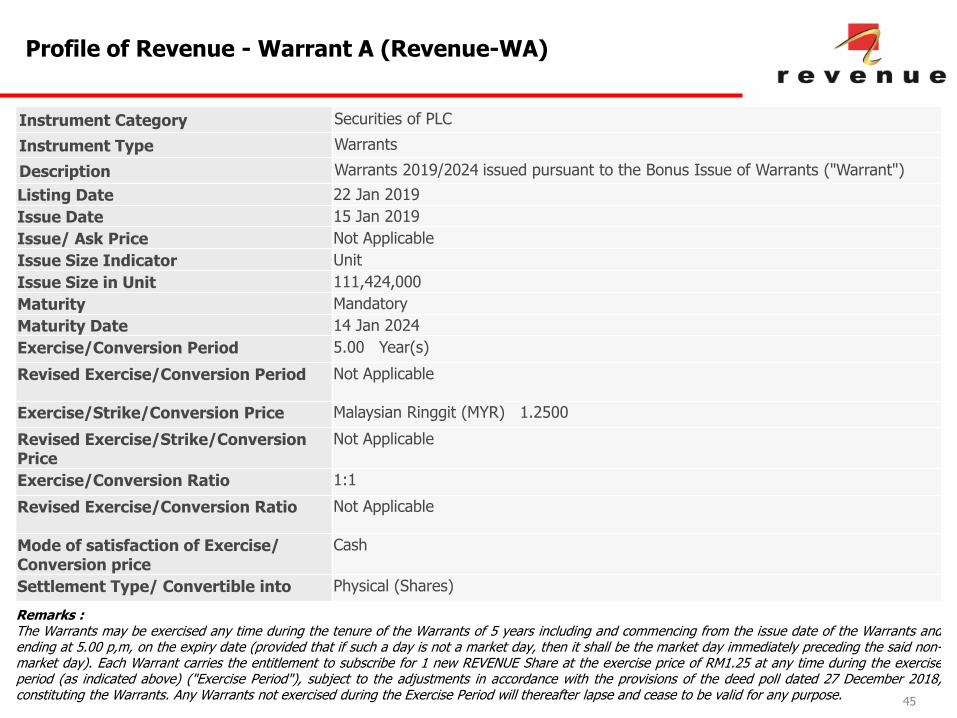
Profile of Revenue - Warrant A (Revenue-WA)
Instrument Category Securities of PLC
Instrument Type Warrants
Description Warrants 2019/2024 issued pursuant to the Bonus Issue of Warrants ("Warrant")
Listing Date 22 Jan 2019
Issue Date 15 Jan 2019
Issue/ Ask Price Not Applicable
Issue Size Indicator Unit
Issue Size in Unit 111,424,000
Maturity Mandatory
Maturity Date 14 Jan 2024
Exercise/Conversion Period 5.00 Year(s)
Revised Exercise/Conversion Period Not Applicable
Exercise/Strike/Conversion Price Malaysian Ringgit (MYR) 1.2500
Revised Exercise/Strike/Conversion Price
Not Applicable
Exercise/Conversion Ratio 1:1
Revised Exercise/Conversion Ratio Not Applicable
Mode of satisfaction of Exercise/ Conversion price
Cash
Settlement Type/ Convertible into Physical (Shares)
Remarks :The Warrants may be exercised any time during the tenure of the Warrants of 5 years including and commencing from the issue date of the Warrants andending at 5.00 p,m, on the expiry date (provided that if such a day is not a market day, then it shall be the market day immediately preceding the said non-market day). Each Warrant carries the entitlement to subscribe for 1 new REVENUE Share at the exercise price of RM1.25 at any time during the exerciseperiod (as indicated above) ("Exercise Period"), subject to the adjustments in accordance with the provisions of the deed poll dated 27 December 2018,constituting the Warrants. Any Warrants not exercised during the Exercise Period will thereafter lapse and cease to be valid for any purpose.
46
Recent Corporate Development No.1
REVENUE GROUP BERHAD ("REVENUE" or "the Company") Approval from theMinistry of Urban Wellbeing, Housing and Local Government ("KPKT") toRevenue Harvest Sdn Bhd, a wholly-owned subsidiary of Revenue, on theapplication for Money Lending License pursuant to Moneylenders Act, 1951(Pindaan 2011) (Act 400)
The Board of Directors of Revenue Group Berhad (“Revenue” or “the Company”) wishes toannounce that Revenue Harvest Sdn Bhd (“Revenue Harvest”), a wholly-owned subsidiary ofthe Company, had on 14 March 2019 received the approval letter dated 13 March 2019 fromthe Ministry of Urban Wellbeing, Housing and Local Government (“KPKT”) confirming thatRevenue Harvest had fulfilled the conditions for a money lending license to operate asmoney lender under the Moneylenders Act 1951 [Act 400]. The license will be issued uponpayment of the new license fee within 30 days from the date of the aforesaid letter.
The approval allows Revenue Harvest to undertake any business of those relating to themoney lending activities. The approval will not have any material effect on the earnings pershare and net assets per share of the Company and its subsidiaries for the financial yearending 30 June 2019. The approval will not have any effect on the share capital, gearing andsubstantial shareholders’ shareholdings of the Company. None of the Directors and/or majorshareholders of the Company and/or persons connected with Directors and/or majorshareholders has any interest, direct or indirect, in the approval.
This announcement is dated 14 March 2019.

47
Recent Corporate Development No.2
REVENUE GROUP BERHAD ("REVENUE" OR "COMPANY") PROPOSEDACQUISITION BY REVENUE HARVEST SDN BHD, A WHOLLY-OWNED SUBSIDIARYOF REVENUE, OF 25.0% EQUITY INTEREST IN REVENUE SAFE NETS SDN BHD("REVENUE SAFE NETS") FOR A TOTAL PURCHASE CONSIDERATION OFRM7,000,000 ("PROPOSED ACQUISITION")
On behalf of the Board of Directors of REVENUE, M&A Securities Sdn Bhd wishes toannounce that on 15 March 2019, Revenue Harvest Sdn Bhd (“Revenue Harvest”), awholly-owned subsidiary of REVENUE, has entered into a conditional share sale agreementwith Lai Wei Keat for the purchase of the remaining 25.0% equity interest in Revenue SafeNets by Revenue Harvest, for a purchase consideration of RM7,000,000.
Kindly refer to the attachment for further details on the Proposed Acquisition.
This announcement is dated 15 March 2019.
On behalf of the Board of Directors of REVENUE, M&A Securities Sdn Bhd is pleased toannounce that the Acquisition is completed following the listing of the 5,867,560Consideration Shares on the ACE Market of Bursa Malaysia Securities Berhad on 17 April2019.
This announcement is dated 17 April 2019.

48
Recent Corporate Development No.3
REVENUE GROUP BERHAD (REVENUE) (I) PROPOSED ACQUISITION BY REVENUE HARVESTSDN BHD (REVENUE HARVEST), A WHOLLY-OWNED SUBSIDIARY OF REVENUE, OF 51.0%EQUITY INTEREST IN BUYMALL SERVICES SDN BHD (BUYMALL) FOR A TOTAL PURCHASECONSIDERATION OF RM3,315,000 (PROPOSED ACQUISITION OF BUYMALL); AND (II)PROPOSED ACQUISITION BY REVENUE HARVEST OF 70.0% EQUITY INTEREST IN ANYPAYSDN BHD (ANYPAY) FOR A TOTAL PURCHASE CONSIDERATION OF RM4,900,000 (PROPOSEDACQUISITION OF ANYPAY
On behalf of the Board of Directors of REVENUE (“Board”), M&A Securities Sdn Bhd wishes to announcethat on 26 March 2019, Revenue Harvest has entered into the following:
(i) a conditional share sale agreement with Fabian Kong Yu Kiong, Gan Swan Kiat and Chung Wai Fong(collectively, “Buymall Vendors”) for the acquisition by Revenue Harvest of 51.0% equity interest inBuymall, for a purchase consideration of RM3,315,000;
(ii)a shareholders’ agreement between Buymall Vendors, Revenue Harvest and Buymall in conjunctionwith the Proposed Acquisition of Buymall;
(iii) a conditional share sale agreement with Tan Lip Han and Low Chung Ming (collectively, “AnypayVendors”) for the acquisition by Revenue Harvest of 70.0% equity interest in Anypay, for a purchaseconsideration of RM4,900,000; and
(iv) a shareholders’ agreement between Anypay Vendors, Revenue Harvest and Anypay in conjunctionwith the Proposed Acquisition of Anypay.
Kindly refer to the attachment for further details on the Proposed Acquisitions.
This announcement is dated 26 March 2019.