revenue report text 2005 02 10
TRANSCRIPT

NEWS
NEWS News media Information 202 / 418-0500 TTY: 202 / 418-2555 Fax-On-Demand 202 / 418-2830 Internet: http://www.fcc.gov ftp.fcc.gov Federal Communications Commission 445 12th Street, S.W. Washington, D. C. 20554 This is an unofficial announcement of Commission action. Release of the full text of a Commission order constitutes official action. See MCI v. FCC. 515 F 2d 385 (D.C. Circ 1974).
FOR IMMEDIATE RELEASE: NEWS MEDIA CONTACT: March 1, 2005 Mark Wigfield 202-418-0253
Email: [email protected]
FCC RELEASES ANNUAL TELECOMMUNICATIONS INDUSTRY REVENUE REPORT
Washington, D.C. – The Federal Communications Commission today released its annual report providing a general overview of revenues in the U.S. telecommunications industry, entitled Telecommunications Industry Revenues.
According to the report, the industry in 2003 reported $291 billion in revenues — a decrease of less than 1% from 2002’s $292 billion. The report also shows dramatic shifts in the way universal service support is funded, reflecting the changing level of revenues reported by various sectors of the industry.
Other findings include:
Wireless industry revenues grew 10% during 2003, from $82 billion to $90 billion.
Revenues of competitive local telephone companies increased 10% during 2003, from $15.3
billion to $16.9 billion. These revenues accounted for about 13% of the $126 billion of local telephone service provider revenues.
Total toll service revenues continued to decline during 2003 — from $84 billion to $77 billion.
Revenues for incumbent local exchange carriers decreased to $109 billion in 2003, down from
$115 billion, or 5% from the previous year. The report is available for reference in the FCC's Reference Information Center, Courtyard Level, 445 12th Street, SW, Washington, D.C. 20554. Copies may be purchased by calling Best Copy and Printing Inc. at 800-378-3160 or via e-mail at [email protected]. The report, including spreadsheets containing the statistical tables and figures, can also be downloaded from the FCC-State Link Internet site at www.fcc.gov/wcb/stats.
- FCC - Wireline Competition Bureau contacts: Jim Lande and Ken Lynch at (202) 418-0940; Users of TTY equipment, please call (202) 418-0484.
News about the Federal Communications Commission can also be found
on the Commission’s web site, www.fcc.gov.

TELECOMMUNICATIONS INDUSTRY REVENUES 2003
Jim Lande Kenneth Lynch
Industry Analysis & Technology Division Wireline Competition Bureau
March 2005
This report is available for reference in the FCC's Reference Information Center, Courtyard Level, 445 12th Street S.W., Washington, D.C. 20554. Copies may be purchased by calling Best Copy and Printing Inc., (BCPI), 445 12th Street S.W., Room CY-B402, Washington, D.C. 20554, telephone 800-378-3160, facsimile 202-488-5563, or via e-mail at [email protected]. The report can also be downloaded from the FCC-State Link Internet site www.fcc.gov/wcb/stats.

Telecommunications Industry Revenues
This report provides an overview of U.S. telecommunications industry revenues and contributions to the universal service support mechanisms. The last report was released March 17, 2004.1 Most of the data for 2003 are taken from April 1, 2004 filings of annual Telecommunications Reporting Worksheets (FCC Form 499-A). Revenue data collected on these worksheets are utilized in the Commission’s administration of the universal service fund (USF), Telecommunications Relay Service (TRS), North American Numbering Plan (NANP) and local number portability (LNP) programs. FCC Form 499-A data also are used to calculate common carrier regulatory fees. Preliminary 2004 totals presented in Table 1, and 2004 and 2005 shares of universal service contributions by principal type of contributor presented in Table 12, are based on filings of quarterly Telecommunications Reporting Worksheets (FCC Form 499-Q).
The industry reported $291 billion in telecommunications service revenues — a slight decrease from 2002’s $292 billion. Industry sector data include:
The pace of revenue growth for the wireless industry remained strong. Wireless industry
revenues grew 10% during 2003, from $82 billion to $90 billion. Revenues of competitive local telephone companies increased 10% during 2003, from $15.3
billion to $16.9 billion. These revenues accounted for about 13% of the $126 billion of local telephone service revenues.
Total toll service revenues continued to decline during 2003 — from $84 billion to $77
billion. Revenues for incumbent local exchange carriers decreased to $109 billion in 2003, down
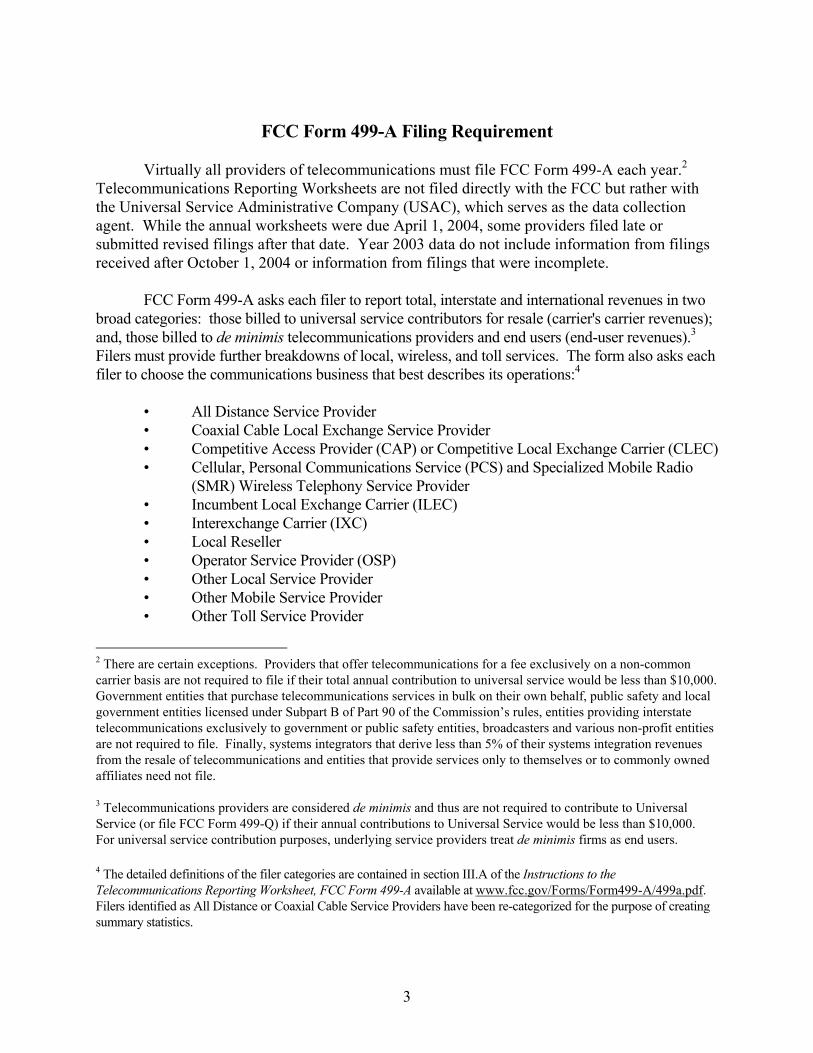
about 5% from $115 billion in 2002. Chart 1 illustrates changes in total end-user telecommunications revenues over time. The chart
shows how the wireless service share of the industry has grown while the toll service share has declined.
Chart 2 illustrates how the share of universal service contributions by principal type of service
provider has changed dramatically since 1997.
1 Industry Analysis and Technology Division, Wireline Competition Bureau, Federal Communications Commission, Telecommunications Industry Revenues: 2002 (rel. March 17, 2004).

Chart 1End-User Telecommunications Revenues
2
Chart 2Share of Universal Service Contributions
By Principal Type of Contributor
$0.0
$50.0
$100.0
$150.0
$200.0
$250.0
Mill
ions
of D
olla
rs
Toll Service $89.2 $91.6 $93.3 $87.8 $79.3 $67.2 $59.0
Wireless Service $30.2 $33.7 $43.8 $56.9 $68.5 $76.5 $85.3
Local Service $69.1 $75.2 $78.6 $84.5 $87.7 $88.7 $86.5
1997 1998 1999 2000 2001 2002 2003
1997RBOC Toll
Service Providers
1.7%
Payphone Providers
0.0%
RBOCs11.7%
Wireless Service
Providers3.3%
Other Toll Service
Providers79.9%
CLECs0.8%
Other ILECs2.6%
PreliminaryFirst Quarter 2005
RBOC Toll Service
Providers8.4%
Payphone Providers
0.0%
RBOCs22.7%
Wireless Service
Providers34.1%
Other Toll Service
Providers26.6%
CLECs4.3%
Other ILECs3.8%
3
FCC Form 499-A Filing Requirement
Virtually all providers of telecommunications must file FCC Form 499-A each year.2
Telecommunications Reporting Worksheets are not filed directly with the FCC but rather with the Universal Service Administrative Company (USAC), which serves as the data collection agent. While the annual worksheets were due April 1, 2004, some providers filed late or submitted revised filings after that date. Year 2003 data do not include information from filings received after October 1, 2004 or information from filings that were incomplete.
FCC Form 499-A asks each filer to report total, interstate and international revenues in two broad categories: those billed to universal service contributors for resale (carrier's carrier revenues); and, those billed to de minimis telecommunications providers and end users (end-user revenues).3 Filers must provide further breakdowns of local, wireless, and toll services. The form also asks each filer to choose the communications business that best describes its operations:4 • All Distance Service Provider • Coaxial Cable Local Exchange Service Provider • Competitive Access Provider (CAP) or Competitive Local Exchange Carrier (CLEC) • Cellular, Personal Communications Service (PCS) and Specialized Mobile Radio
(SMR) Wireless Telephony Service Provider • Incumbent Local Exchange Carrier (ILEC) • Interexchange Carrier (IXC) • Local Reseller • Operator Service Provider (OSP) • Other Local Service Provider • Other Mobile Service Provider • Other Toll Service Provider
2 There are certain exceptions. Providers that offer telecommunications for a fee exclusively on a non-common carrier basis are not required to file if their total annual contribution to universal service would be less than $10,000. Government entities that purchase telecommunications services in bulk on their own behalf, public safety and local government entities licensed under Subpart B of Part 90 of the Commission’s rules, entities providing interstate telecommunications exclusively to government or public safety entities, broadcasters and various non-profit entities are not required to file. Finally, systems integrators that derive less than 5% of their systems integration revenues from the resale of telecommunications and entities that provide services only to themselves or to commonly owned affiliates need not file. 3 Telecommunications providers are considered de minimis and thus are not required to contribute to Universal Service (or file FCC Form 499-Q) if their annual contributions to Universal Service would be less than $10,000. For universal service contribution purposes, underlying service providers treat de minimis firms as end users. 4 The detailed definitions of the filer categories are contained in section III.A of the Instructions to the Telecommunications Reporting Worksheet, FCC Form 499-A available at www.fcc.gov/Forms/Form499-A/499a.pdf. Filers identified as All Distance or Coaxial Cable Service Providers have been re-categorized for the purpose of creating summary statistics.

4
• Paging and Messaging Service Provider • Payphone Provider • Private Service Provider • Prepaid Calling Card Provider • Satellite Service Provider • Shared-Tenant Service Provider • Specialized Mobile Radio - Dispatch • Toll Reseller • Wireless Data Service Provider
FCC Form 499-A filers are instructed to report amounts actually billed to customers. This means that filers should report revenues net of discounts, but without making adjustments to reflect uncollectible revenues or international settlement payments or receipts.5 Most filers should be able to report revenues in this manner using information contained in their corporate books of account. Some service providers, however, have no business or regulatory requirements to record intrastate or international revenues separately from interstate revenues, or to use the detailed revenue categories contained in the worksheets. In addition, many wireless providers use the interim safe harbor percentages to estimate the interstate portion of their revenues.6
FCC Form 499-A filings sometimes contain mistakes. Initial examination of the data
occasionally reveals carrier types, revenue amounts and/or revenues reported in service categories inconsistent with the known operations of the filer. Some corrections have been made based on supplemental filer information. Nonetheless, disaggregated data are likely to be less accurate than industry totals.
Statistical Tables
Table 1 shows the major components of telecommunications revenues for 1993 through 2004. For 1997 through 2003, this table was created by aggregating the revenues in the major classifications designated on FCC Form 499-A. FCC Form 499-Q data was used to provide preliminary figures for 2004.
Tables 2 and 3 provide a more detailed look at annual industry revenues over time.
Generally, FCC Form 499-A revenue data can be tabulated in two distinct ways: by type of service provided and by type of business. Table 2 categorizes revenues by type of service and shows, for example, that carriers reported $89.7 billion in wireless service revenues for 2003. This total includes wireless service revenues from some carriers that are not identified as wireless carriers. In
5 Filers began to provide some information on uncollectible revenues starting with the February 1, 2003 FCC Form 499-Q filing. Beginning in the second quarter of 2003, contributions have been based on projected collected revenues, rather than billed revenues for a prior period. 6 See the Instructions to the Telecommunications Reporting Worksheet, FCC Form 499-A section III.C.3. available at www.fcc.gov/Forms/Form499-A/499a.pdf.

5
contrast, Table 3 shows that wireless service providers reported total revenues of $89.3 billion in 2003, including some revenues for fixed local and toll services.
Revenue data for 1993 through 1996 were summarized from information filed on TRS
worksheets. Revenue data for 1997 and 1998 were derived by combining TRS worksheet and universal service worksheet data. Starting with 1999, revenue data were summarized from FCC Form 499-A, which replaced both the TRS and universal service worksheets. Because of reporting changes, data for 1997 forward are not entirely consistent with data for prior years. For example, special access revenues were included with other access revenues prior to 1997 but have been included with local private line services since then. Similarly, through 1996, filers reported as other local and mobile revenues substantial amounts of customer premises equipment, billing and collection, and other types of revenues that are excluded from contributions to universal service. These revenues are now reported as non-telecommunications revenues. Both tables contain estimates of non-telecommunications revenues that had been reported in prior years. Based on staff estimates, the 1996 telecommunications revenues reported on TRS Worksheets would have been $10.5 billion lower if revenues had been reported using current instructions.
Some inconsistencies exist in the 1997 - 2003 period. For example, filers were required in 1997 to include inside wiring maintenance revenues as part of local exchange revenues. In 1998, filers were instructed to report these revenues as non-telecommunications service revenues. The local exchange service revenue data in Table 2 would show a greater increase from 1997 to 1998 if the same reporting instructions had been used for each year. Note also that each year, many filers erroneously report substantial amounts of switched toll revenues as other long distance revenues. The data are examined and some revenues are reclassified based on staff research. Even so, the other long distance category of Table 2 probably continues to contain some switched toll revenues, perhaps significant amounts in some years.
Changes in reporting procedures may have induced some of the large increase in non-
telecommunications revenues that occurred in 2002. Prior to 2002, each legal entity providing telecommunications was required to file separately. Starting in 2002, entities meeting specific conditions were allowed to file on a consolidated basis. For some companies, the books at the consolidated-entity level include substantial amounts of non-telecommunications revenues for legal entities that do not individually provide telecommunications and therefore would not be required to file on an individual basis. Their revenues, however, must be included when filings are made on a consolidated basis because the revenues are recorded on the consolidated books.
Table 4 illustrates how data from the FCC Form 499-A are used to develop funding
bases for USF, NANP, LNP and TRS contribution mechanisms. Each of the four programs is supported by a slightly different group of telecommunications providers under slightly different rules. As noted above, providers are considered de minimis for USF purposes if their annual contribution is expected to be less than $10,000. While such providers are thus not required to file FCC Form 499-Q, de minimis status does not exempt service providers from filing FCC Form 499-A because contributions to TRS, NANP and LNP are required regardless of the expected annual amount. Note also that NANP, LNP, and TRS each draw contributions from a

6
larger pool of providers than does USF. Specifically, all telecommunications carriers in the United States must contribute to meet the costs of NANP (47 C.F.R. § 52.17), and all telecommunications carriers that provide service in areas covered by the regional LNP database must contribute to meet the costs of LNP (47 C.F.R. § 52.32). Thus, only those providers that are not carriers are not required to contribute. Cost recovery for TRS is slightly different. Every carrier providing interstate services must contribute to the TRS Fund (47 C.F.R. §64.604 (c)(5)(iii)(A)). In this case, providers that are not carriers, and carriers that do not provide interstate services are not required to contribute. See Figure 3 of the Instructions to the Telecommunications Reporting Worksheet, FCC Form 499-A, which can be found on the FCC’s web site at www.fcc.gov/Forms/Form499-A/499a.pdf. Revenue data for individual filers are not available to the public. However, Tables 5 through 8 present detailed industry roll-ups by type of revenue and type of filer. Table 5 provides a detailed breakout of revenues for each of the FCC Form 499-A revenue categories used to report services provided to other filers for resale. Table 6 displays similar detail for each of the revenue categories used to report telecommunications service provided to end users. Table 7 combines data from Tables 5 and 6 with data on non-telecommunications revenues to develop total industry revenues. Table 8 provides more aggregated revenue information by type of filers. The revenue categories presented in Tables 5 through 7 are explained in the FCC Form 499-A filing instructions.
Table 9 presents an estimate of average revenue per conversation minute. Based on the methodology in Table 9, FCC staff estimated that end users were billed an average of 8 cents for each minute of interstate and international toll calling made during 2003. The average price for each interstate domestic conversation minute was estimated to be 7 cents during 2003. These estimates and year-over-year changes in these estimates should be treated with great caution for a number of reasons. For instance, terminating access minutes are used as a proxy for billed conversation minutes. In certain cases, the two measures track each other closely. Subscriber toll-free calls that terminate on dedicated access lines and some other classes of calls generate access minutes that are billed as terminating minutes only. Some calls, however, generate originating access minutes only or bypass ILEC switched facilities on both ends and therefore generate no access minutes. Some subscriber toll-free calls, on the other hand, do not terminate on dedicated access lines and therefore may generate two terminating access minutes per conversation minute.
Another problem is that since 1999, NECA filings report total access minutes without a
breakout for originating and terminating minutes. The totals are allocated based on carrier common line (CCL) minutes reported in access tariff filings by ILECs that are subject to price-cap regulation and in the NECA pool access tariff filings. Also, some toll calls handled over VoIP networks may terminate via local minutes rather than interstate access minutes. On balance, the preceding problems may result in an upward bias in the revenue per minute estimates. For 2003, the staff estimates that revenue per minute estimates may be overstated by as much as 20%.
The methodology presented in Table 9 mitigates some problems associated with using
terminating access minutes as a proxy for conversation minutes. For example, some

7
conversation minutes do not result in ILEC access minutes because they terminate on the facilities of CLECs. These carriers do not report access minutes. Table 9 presents estimates of these minutes based on CLEC shares of local service revenues. These amounts are used to adjust terminating access minutes. Moreover, the methodology presented in Table 9 adjusts terminating access minute totals to better reflect international traffic. International settlement minutes are reported based on the billing status of calls rather than where the calls actually originate. Thus, some U.S. billed calls actually originate in foreign points and vice versa. However, most U.S. billed calls originate in the United States and generate originating but not terminating access minutes. These minutes are added to the reported totals for terminating access minutes so that terminating access minutes better represent conversation minutes. Similarly, foreign billed minutes, which usually generate terminating access minutes, are removed from the terminating access minute total.
One category of U.S. billed international calls merits special treatment. Country-direct and country-beyond calls are placed from foreign points, directly with U.S. carriers. Country-direct calls generally originate overseas and terminate in the United States. Such calls are billed by U.S. carriers, generate settlement payments to foreign carriers, and are reported in section 43.61 traffic data reports as U.S. billed calls. Country-beyond calls are similar, but both originate and terminate at foreign points. Country-direct calls result in terminating access minutes. Country-beyond calls generally do not. Unfortunately, section 43.61 data do not separate country-direct from country-beyond calls. This is not a problem for allocating originating access minutes between interstate and international calls, because neither type of call results in appreciable originating access minutes. In estimating interstate terminating access minutes, however, staff chose to subtract country-direct and country-beyond minutes. This means that the number of total interstate terminating minutes, which is used to represent interstate conversation minutes, is biased downward. Staff did not include country-direct or country-beyond minutes with international conversation minutes because country-beyond revenues are reported separately as international-to-international service revenues on FCC Form 499-A and are therefore subtracted when calculating international revenue per minute. Country-direct revenues, however, remain in the revenue base but the corresponding minutes have been removed from the estimate of international conversation minutes. This bias may be offset by the fact that many international-to-international calls generate U.S. billed settlement minutes and are counted as conversation minutes.
An increasing share of switched traffic either originates or terminates on wireless
telephones. Some wireless minutes and some wireless revenues are included in the revenue per minute calculations. Terminating access minutes include calls that originate on a wireless telephone and terminate on a wireline telephone, but do not include any calls that terminate on wireless telephones. Switched revenues include all long distance charges that are itemized on wireless customers’ bills but do not include any portion of revenues reported as wireless monthly service or airtime charges. Many interstate wireless calls are billed under “bucket of minutes” plans and have no explicit toll charges associated with them. Staff does not have sufficient data to assess whether inclusion of some wireless toll minutes and some wireless carrier revenues results in an upward or downward bias in the revenue per minute calculations.

8
End-user switched toll revenue data also are problematic. Through 1996, the figures shown
are based on TRS gross revenue data. In order to translate reported gross revenues to end-user revenues, 80% of revenues reported by toll resellers were netted from the total. A second problem is that in some years, filers classified substantial amounts of switched service revenues as (non-switched) other toll. While significant effort has been devoted to identifying and reclassifying these amounts, the other toll category shows a $1.3 billion drop from 1997 to 1998, which suggests that the 1997 figure may still contain significant amounts of misreported switched service revenues. Starting in 1998, many toll carriers used fixed monthly charges to recover account maintenance, ILEC presubscribed interexchange carrier charges (PICCs), and both federal and state universal service contributions. Some toll carriers reported some of these surcharges as local service tariffed PICC charges. An attempt was made to identify these amounts and include them with switched toll revenues. Some filers bill customers percentage surcharges to recover universal service contributions. While filers must separately identify the universal service surcharges on their universal service worksheets, it is not possible to identify a precise amount that is attributable to interstate toll service. The Table 9 adjustments to reflect both PICC and universal service costs and end-user charges should be taken as approximate.
Table 9 also shows a number of assumptions that were made in order to separate international revenue data from interstate revenue data. Filers did not separately report end-user revenues for international services for years before 1999. For 1999 and 2000, it appears that many FCC Form 499-A filings understate international revenues and overstate interstate revenues. This could happen if, for example, a filer split revenues between interstate and international service based on a ratio of interstate to international minutes, rather than on actual billings. This would not reduce contribution requirements for the filer but does make the breakout shown in Tables 5, 6, and 7 less reliable. For 2001, carriers reported $1.5 billion more international revenues in FCC Form 499-A filings than they did in section 43.61 filings. The section 43.61 international traffic data appears to be more reliable, but lacks breakouts of carrier’s carrier and end-user revenues. Based on staff analysis of the FCC Form 499-A data, a simple methodology is used to convert section 43.61 international traffic revenue data into estimates of international end-user revenues for message telephone service. The same methodology is used in all years.
While the FCC does collect detailed international traffic data, there is no clean match between categories of minutes actually reported and the international service end-user revenue data presented in Table 9. The amounts of international-to-international revenues are estimated for 1996 and earlier. Also, an increasing amount of international traffic is being carried on resold private lines and via other new arrangements. It seems likely that much of this traffic is not being properly reported in traffic data reports. For these reasons, the breakout between interstate revenues per-minute and international revenues per-minute is likely to be significantly less accurate than the combined estimate.
Table 10 presents an estimate of average revenue per conversation minute, net of access
and universal service contribution costs. These estimates indicate that access and universal

9
service contribution costs have declined over time, and that revenues per minute net of access and universal service contribution costs have declined over time as well. The table uses the data on minutes developed in Table 9 and therefore has the attendant uncertainties. The analysis also uses international settlement payment data which, while relatively good, include settlements associated with international-to-international traffic. The analysis does not account for special access payments from toll carriers to local exchange carriers. In some cases, toll carriers recover the cost of these services through charges that are reported as switched toll revenues and that therefore are reflected in per-minute revenue estimates.
FCC Form 499-A asks filers to identify the share of their carrier’s carrier and end-user
telecommunications revenues attributable to different regions of the country. Table 11 shows total end-user telecommunications revenues by region for local, toll and wireless filers. Table 12 provides data about the relative magnitude of universal service contributions from different classes of telecommunications providers.
Since the second quarter of 2003, universal service contributions have been based on projected collected interstate and international end-user revenues rather than on actual billed revenues from a prior quarter. On the first day of the second month of each quarter, filers report preliminary data for billed revenues from the previous quarter, and project billed and collected universal service contribution base amounts for the upcoming quarter. For example, on November 1, 2004, filers reported data for the third quarter of 2004 and projected revenues for the first quarter of 2005. Far less detail is filed on the quarterly FCC Form 499-Q than on the annual FCC Form 499-A. Revenue detail for the historic quarter includes total, interstate and international U.S. telecommunications revenues, divided into carrier’s carrier and end-user categories. For the coming quarter, filers provide only billed and projected collected interstate and international end-user revenues. Rollups of the quarterly data are available on the FCC’s website at: http://www.fcc.gov/wcb/iatd/lec.html.
USF, TRS, NANPA and LNP rules prohibit the fund administrators from releasing
company-specific information contained in FCC Form 499-A and FCC Form 499-Q worksheets. Revenue data for individual filers are not available to the public.

Table 1Overview of Telecommunication Industry Revenues 1/
(Dollar Amounts Shown in Millions)
Preliminary 5/ 1997 1998 1999 2000 2001 2002 2003 2004
Carrier's Carrier Revenues 2/
Local Service 3/ $28,289 $29,374 $33,156 $36,621 $40,108 $38,412 $37,742 $38,794Wireless Service 2,752 3,060 4,652 5,144 6,180 5,020 4,465 5,305Toll Service 11,598 13,448 14,934 21,849 19,999 16,476 18,205 17,244
Intrastate 16,201 18,892 22,293 25,553 27,848 25,770 24,825 24,974Interstate and International 4/ 26,562 27,114 30,449 38,060 38,439 34,138 35,587 35,801
Total $42,639 $45,882 $52,742 $63,613 $66,287 $59,907 $60,412 $60,775
End User Revenues 2/
Local Service 3/ $69,137 $75,189 $78,608 $84,526 $87,704 $88,712 $86,474 $85,920Wireless Service 30,199 33,714 43,843 56,857 68,507 76,501 85,254 95,503Toll Service 89,193 91,607 93,311 87,767 79,302 67,222 58,983 50,557
Intrastate 117,454 123,216 134,919 147,465 155,347 154,815 150,889 151,550Interstate and International 4/ 70,952 77,170 80,844 81,685 80,165 77,619 79,822 76,727
Total $188,406 $200,386 $215,763 $229,149 $235,513 $232,434 $230,711 $228,277
Total Revenues
Local Service 3/ $97,426 $104,563 $111,764 $121,147 $127,812 $127,123 $124,216 $124,714Wireless Service 32,951 36,775 48,495 62,000 74,687 81,521 89,718 100,808Toll Service 100,791 105,055 108,246 109,615 99,301 83,697 77,188 67,801
Intrastate 133,655 142,108 157,212 173,018 183,195 180,585 175,714 176,524Interstate and International 4/ 97,514 104,284 111,293 119,745 118,605 111,756 115,409 112,528
Total $231,168 $246,392 $268,505 $292,762 $301,799 $292,341 $291,123 $289,052
Note: Detail may not add to totals due to rounding.
1/ Data include revenues for de minimis filers as well as for other carriers that are exempt from universal service contribution requirements.
2/ Carrier's carrier revenues are reported on the FCC Form 499-A as sales to other universal service contributors for resale. This includes, for example, access services that local exchange carriers provide to toll carriers. Sales to de minimis resellers, end-user customers, governments, non-profits, and any other non-contributors are treated as end-user revenues. Filers contribute to the universal service funding mechanisms based on their end-user revenues.
3/ Payphone revenues are included with local service revenues in this table.
4/ Revenues from calls that both originate and terminate in foreign points are reported as end-user revenues, and are included in this table through 2003, but are not included in the universal service contribution base.
5/ Preliminary 2004 data are based on FCC Form 499-Q quarterly filings. Companies that do not contribute to universal service are not required to makethese filings. The quarterly filings include preliminary data for the just closed quarter and projections for the coming quarter, and therefore are notas accurate as the subsequent annual filings. Also, FCC Form 499-Q filers do not separate revenue by type of service. Therefore, revenue totalsby service type for 2004 are based on type of filer rather than on data filed by service.
Source: Data for 1997 and 1998 primarily based on FCC Form 457 Universal Service Worksheets, with data from 1997 FCC Form 431 TRS Worksheets used for service providers not required to file a Universal Service Worksheet. Starting in 1999, data summarized from FCC Form 499-A Telecommunications Reporting Worksheets, which replaced both FCC Form 431 and FCC Form 457.
10

Table 2Telecommunications Industry Revenues by Service
(Dollar Amounts Shown in Millions)
TRS Worksheet Data Universal Service FCC Form 499-A Data& TRS Data
1993 1994 1995 1996 1997 1998 1999 2000 2001 2002 2003
Local Exchange $40,176 $42,245 $45,194 $48,717 $53,771 $59,245 $64,940 $69,947 $72,346 $71,320 $70,606Pay Telephone 1/ 2,182 2,536 2,218 1,932 1,585 1,192 1,063Local Private Line 2/ 1,088 1,138 1,226 1,616 8,282 10,403 12,914 16,864 21,966 23,070 22,415Other Local 3/ 1,508 1,407 3,233 2,674 2,847 2,179 2,501 3,249 3,391 3,418 3,242Subscriber Line Charges 2/ 6,884 7,310 7,597 7,829 8,327 11,052 10,826 11,563 12,127 12,758 12,136Access 2/ 23,948 25,449 26,314 27,812 21,423 18,449 18,105 17,017 15,096 13,955 12,972
Universal Service Surcharges onLocal Service Bills 4/ 103 260 575 1,301 1,410 1,783
Worksheets 595 595
Total Local Service 73,604 77,548 83,564 88,647 97,426 104,563 111,764 121,147 127,812 127,123 124,216
Wireless Service 9,213 12,863 16,883 23,444 32,760 36,240 48,117 61,505 74,006 80,678 88,023
Universal Service Surcharges onWireless Service Bills 4/ 345 379 495 681 842 1,696
Worksheets 189 189
Total Wireless Service 3/ 9,213 12,863 16,883 23,444 32,950 36,775 48,495 62,000 74,687 81,521 89,718
Operator 1/ 10,772 10,539 11,170 10,975 12,002 12,205 10,049 11,406 10,389 7,902 6,567Non-Operator Switched Toll 60,591 61,468 65,217 73,751 72,059 74,168 78,389 75,183 65,325 54,475 50,178Long Distance Private Line 8,067 9,043 9,719 10,665 10,504 11,952 13,169 16,189 16,402 15,108 15,316Other Long Distance 3,095 3,428 3,523 4,299 4,695 3,386 3,656 3,372 3,259 2,445 2,222
Universal Service Surcharges onToll Service Bills 4/ 1,810 2,983 3,467 3,927 3,767 2,905
Worksheets 1,532 1,532
Total Toll Service 82,525 84,478 89,629 99,691 100,793 105,055 108,246 109,615 99,301 83,697 77,188
Total Telecommunications 3/ 165,342 174,890 190,076 211,782 231,168 246,392 268,505 292,762 301,799 292,341 291,122
Non-Telecommunications 3/ 7,518 8,324 9,071 10,474 25,633 27,944 33,144 42,261 48,036 60,406 65,186
Total Reported Revenues 172,860 183,214 199,147 222,256 256,801 272,019 301,648 335,023 349,835 352,747 356,308
Service Reported as:Intrastate 3/ 96,927 102,603 112,923 127,849 133,654 142,108 157,212 173,018 183,195 180,585 175,714Interstate and International 75,933 80,611 86,224 94,407 97,514 104,284 111,293 119,745 118,605 111,756 115,409
Total Telecommunications 3/ $172,860 $183,214 $199,147 $222,256 $231,168 $246,392 $268,505 $292,762 $301,799 $292,341 $291,123
See notes on next page.
11

Notes for Table 2.
Note: Detail may not add to totals due to rounding. Some data for prior years have been revised.
1/ TRS filers generally reported pay telephone revenues as local service revenues, access revenues or operator toll revenues. The Universal Serviceand FCC Form 499-A worksheets contain a separate category for payphone coin revenues. Starting in 1997, payphone revenues include payphone compensation received from toll carriers.
2/ TRS Worksheet filers generally reported special access revenues as access revenues. Reporting changes implemented with the Universal Service Worksheet explain the increase in local private line revenues and the fall in access revenues shown for 1997. TRS Worksheet filers included subscriber line charges with other access charges. For the years 1992 - 1996, these revenues have been disaggregated by assuming that the end-user access revenues in Table 4.2 of Statistics of Communications Common Carriers represents 93% of industry total subscriber line charge revenues. Universal Service Worksheet filers report subscriber line charges in a separate category. The increase from 1997 to 1998 represents PICC charges levied by ILECs as well as $1.2 billion of PICC pass-through charges levied by toll carriers.
3/ Significant amounts of enhanced services, billing and collection, CPE and other non-telecommunications revenues were reported in the TRS mobile and other local service categories through 1996. Universal Service Worksheet filers report these revenues in the non-telecommunications category. For prior years, the amounts of non-telecommunications revenues reported as mobile and other local revenues were estimated as 70% of the amounts that Tier 1 ILECs reported in ARMIS as miscellaneous and nonregulated revenues (currently account 5200 + account 5280) and 10% of amounts reported as mobile service revenues. These amounts have been removed from Other Local and moved to the Non-Telecommunications.
4/ Charges on end-user bills identified as recovering state or federal universal service contributions are reported separately from local, wireless and toll revenues. Reported amounts are apportioned between local, wireless and toll service based on the proportions of local, wireless and toll intrastate and interstate revenues by type of carrier.
Source: Data for 1993 through 1996 summarized from FCC Form 431 TRS Worksheets. Data for 1997 and 1998 primarily based on FCC Form 457 Universal Service Worksheets, with data from 1997 TRS Worksheets used for service providers not required to file a Universal Service Worksheet. Starting in 1999, data summarized from FCC Form 499-A Telecommunications Reporting Worksheets, which replaced both FCC Form 431 and FCC Form 457.
12

Table 3Telecommunications Revenues Reported by Type of Carrier
(Dollar Amounts Shown in Millions)
TRS Worksheet Data Universal Service FCC Form 499-A Data & TRS Data
Service Provider Category 1/ 1993 1994 1995 1996 1997 1998 1999 2000 2001 2002 2003
Incumbent Local Exchange Carriers 2/ $88,728 $91,527 $95,612 $100,021 $105,154 $108,234 $112,216 $116,158 $117,885 $114,990 $109,480
Competitive Access Providers (CAPs) and Competitive Local Exchange Carriers (CLECs) 191 281 623 1,011 1,919 3,348 5,652 9,814 12,998 13,043 15,509Local Resellers 206 410 511 879 1,393 1,538 721Other Local Exchange Carriers 157 36 171 11 329 406 338Private Service Providers 112 147 87 39 15 281 267Shared-Tenant Service Providers 87 93 87 202 46 42 22
Competitors of ILECs 191 281 623 1,011 2,481 4,034 6,508 10,945 14,781 15,309 16,857
Fixed Local Service Providers 88,920 91,807 96,235 101,032 107,634 112,268 118,725 127,103 132,666 130,300 126,337
Payphone Providers 175 300 349 357 933 1,101 1,213 972 836 641 523
Wireless Telephony Including Cellular, 8,294 11,933 15,488 21,400 29,944 33,139 46,513 59,823 71,887 78,568 88,168 Personal Communications Service (PCS) and SMR Telephony Carriers 2/Paging & Messaging Service 2/ 2,861 3,161 3,232 3,102 2,197 1,473 1,007Specialized Mobile Radio (SMR) 186 191 214 206 33 Dispatch Wireless Data Service Providers and Other Mobile Service Providers 2/ 868 845 1,277 1,909 225 731 221 164 110 220 135
Wireless Service Providers 9,161 12,777 16,765 23,310 33,030 37,032 50,152 63,280 74,596 80,467 89,342
Interexchange Carriers (IXCs) 61,118 66,381 70,938 79,057 79,080 83,443 87,570 87,311 81,272 68,146 61,246Operator Service Providers (OSPs) 695 536 500 461 603 590 337 635 611 554 567Prepaid Calling Card Providers 16 238 519 888 866 727 133 460 812Satellite Service Providers 1,011 475 280 336 373 406 663Toll Resellers 1,869 2,840 4,220 6,564 8,010 9,885 9,211 10,641 8,797 9,279 9,294Other Toll Carriers 711 709 773 577 348 710 150 1,758 2,516 2,089 2,339
Toll Service Providers 64,393 70,466 76,447 86,896 89,570 95,992 98,414 101,407 93,702 80,934 74,920
Adjustments 3/ 2,693 (461) 280 187 0 0 0 0 0 0 0
Total Telecommunications Revenues $165,342 $174,890 $190,076 $211,782 $231,168 $246,392 $268,505 $292,762 $301,799 $292,341 $291,123
Note: Some data revised for 1993 through 1996. 1/ Filers are asked to select for themselves a service provider category that best describes their operations. The choices have changed over the years.
For example, most satellite service providers identified themselves as other toll carriers in their 1997 FCC Form 431 TRS worksheets because there was no separate category for satellite service providers. Similarly, paging carriers typically identified themselves as other mobile carriers.
2/ Significant amounts of enhanced service, billing and collection, CPE and other non-telecommunications revenues were reported on TRS worksheets by incumbent local exchange carriers (ILECs) and wireless carriers through 1996. Universal Service Worksheet filers report these revenues in the non-telecommunications category. For prior years, the amounts of non-telecommunications revenues reported as mobile and other local revenues were estimated as 70% of the amounts that Tier 1 ILECs reported in ARMIS as miscellaneous and nonregulated revenues (currently account 5200 + account 5280) and 10% of amounts reported as mobile service revenues. These amounts have been removed from incumbent local exchange carriertotals.
3/ Adjustments include some amounts withheld to preserve confidentiality and revisions made after the initial publication of the data.
Source: Data compiled from FCC Form 431, FCC Form 457 and FCC Form 499-A filings.
13

Table 4Contribution Base Revenues By Program 1/: 2003
(Dollar Amounts Shown in Millions)
2003
Revenues subject to universal service contributionInterstate and international end-user revenues $79,822
less revenues for international - to - international services 1,148
less international revenues of international-only filers and international revenues that were excluded because of 1,573the 12% rule 2/
less interstate and other international revenues for 1,903 filers who are de minimis or otherwise exempt 59from universal service support requirements
less uncollectible contribution base revenues 2,010
equals $75,032
Revenues subject to TRS contribution Interstate and international end-user revenues $79,822
less interstate and international revenues for 317 filers who claim to be exempt from interstate 320telecommunications relay service (TRS) contribution requirements
less interstate and international revenues for services provided for resale but reported as end user 186because it was provided to carriers that do not contribute to universal service support mechanisms
equals $79,316
Revenues subject to NANPA contribution Total telecommunications service end-user revenues (including intrastate, interstate and international) $230,711
less telecommunications revenues for 520 filers who claim to be exempt from North American Numbering 917Plan Administration (NANPA) contribution requirements
less telecommunications revenues for services provided for resale but reported as end user because it 230was provided to carriers that do not contribute to universal service support mechanisms
equals $229,564
Revenues subject to LNP contribution Total telecommunications service end-user revenues (including intrastate, interstate and international) $230,711
less telecommunications revenues for 506 filers who claim to be exempt from local number portability 958administration (LNP) contribution requirements
less telecommunications revenues for services provided for resale but reported as end user because it 230was provided to carriers that do not contribute to universal service support mechanisms
equals $229,523
1/ This table shows how contribution bases differ for different programs and provides relative magnitudes, but does not provide the actual amounts used for determining contribution amounts. Amounts shown represent the amounts contained in the FCC Form 499-A database as of October 1, 2003. The universal service administrator continues to receive additional and corrected filings. Exempt amounts were based on revenues and the filer certification statements contained in the FCC Form 499-A filings. The fund administrators use carrier type, revenue type and additional information requested from filers to review exemption claims (and in some instances, failure to make claims.) The universal service fund administrator bills delinquent filers based on estimated revenues and therefore can include estimated revenue amounts in contribution base amounts. As a result of these factors, actual contribution bases have been based on slightly different amounts than those shown. Note also that universal service contribution factors are set quarterly based on different amounts than those shown. Note also that universal service contribution factors are set quarterly based on FCC Form 499-Q filings. FCC Form 499-A data are used for true-up and auditing purposes. Also note that local number portability contribution amounts are determined by region of the country rather than on a nationwide basis.
2/ International revenues are excluded from the contribution base if the total of amount of interstate revenues for the filing entity consolidated with all affiliates is less than 12% of the total of interstate and international revenues for the filing entity consolidated with all affiliates. See 47 C.F.R. § 54.706(c). The threshold was increased from 8% to 12% in 2002. See Federal-State Joint Board on Universal Service,et al., CC Docket Nos. 96-45, 98-171, 90-571, 92-237, 99-200, 95-166, 98-170, Further Notice of Proposed Rulemaking and Report and Order, 17 FCC Rcd 3752, 3806, para. 125 (2002). In addition, filers that provide only international services are exempt regardless of services offeredby affiliates.
14

Table 5Revenues from Telecommunications Service Provided for Resale 1/: 2003
(Dollar Amounts Shown in Millions)
Data from FCC Form 499-A Regional Bell Operating Company Other Incumbent Local Incumbent Local Exchange Carriers Exchange Carriers
Line Intrastate Interstate International Total Intrastate Interstate International Total Fixed local service 303 Monthly service, local calling, connection charges,
vertical features, and other local exchange service including subscriber line and PICC charges to IXCs
a Provided as unbundled network elements $3,288 $470 $3,759 $116 $15 * $131
b Provided under other arrangements 919 226 1,145 112 90 * 202
Total Line 303 4,207 697 4,904 228 105 * 333
304 Per-minute charges for originating or terminating calls a Provided under state or federal access tariff 2,887 2,139 5,026 2,559 1,119 3 3,681
b Provided as unbundled network elements or other
contract arrangement 1,246 841 2,087 69 23 * 93
Total Line 304 4,133 2,980 7,113 2,628 1,142 3 3,773
305 Local private line & special access 686 9,480 10,166 275 1,117 * 1,392
306 Payphone compensation from toll carriers 68 71 139 7 10 * 17
307 Other local telecommunications service revenues 1,334 330 1,664 25 3 27
308 Universal service support revenue received from 621 886 1,507 592 1,733 * 2,325federal or state sources Total fixed local service provided for resale 11,048 14,444 25,492 3,753 4,111 4 7,867
Mobile service (including wireless telephony, paging & messaging, and other mobile services)
309 Monthly, activation, and message charges except toll 49 19 68 11 4 * 14
Total mobile service provided for resale 49 19 68 11 4 * 14 Toll service 310 Operator and toll calls with alternative billing * * 1 * 1
arrangements (credit card, collect, international call-back, etc.)
311 Ordinary long distance (MTS, customer toll-free 253 * 253 8 3 * 11
800/888/877/866 service, "10-10 calls", associated monthly account maintenance, PICC pass-through, and other switched services not reported above)
312 Long distance private line services 18 5 23 7 6 13
313 Satellite services
314 All other long distance services 1 1 2 7 2 9
Total toll service provided for resale 272 6 279 23 11 * 34
Total service provided for resale (carrier's carrier) $11,370 $14,469 $25,839 $3,787 $4,125 $4 $7,916
Note: Amounts may not add to totals due to rounding. * Denotes values greater than $0 but less than $500,000. 1/ Includes a proportionate share of amounts reported on Line 403 as surcharges or other amounts on bills identified as recovering state or federal universal service
contributions.
15

Table 5Revenues from Telecommunications Service Provided for Resale 1/: 2003
Continued(Dollar Amounts Shown in Millions)
Data from FCC Form 499-A CLECS and Other Payphone ProvidersFixed Local Competitors
Line Intrastate Interstate International Total Intrastate Interstate International Total Fixed local service 303 Monthly service, local calling, connection charges,
vertical features, and other local exchange service including subscriber line and PICC charges to IXCs
a Provided as unbundled network elements $115 $182 $3 $300 * *
b Provided under other arrangements 96 11 106
Total Line 303 211 192 3 406 * *
304 Per-minute charges for originating or terminating calls a Provided under state or federal access tariff 609 616 8 1,232
b Provided as unbundled network elements or other
contract arrangement 427 214 * 641
Total Line 304 1,036 830 8 1,874
305 Local private line & special access 579 375 1 954 1 * * 1
306 Payphone compensation from toll carriers 2 4 * 6 66 44 1 111
307 Other local telecommunications service revenues 112 217 329 1 * * 1
308 Universal service support revenue received from 11 5 15 * * * * federal or state sources Total fixed local service provided for resale 1,950 1,623 12 3,584 67 44 1 112
Mobile service (including wireless telephony, paging & messaging, and other mobile services)
309 Monthly, activation, and message charges except toll 1 * 1
Total mobile service provided for resale 1 * 1 Toll service 310 Operator and toll calls with alternative billing 27 * * 27 1 * * 1
arrangements (credit card, collect, international call-back, etc.)
311 Ordinary long distance (MTS, customer toll-free 104 102 72 278 * * * *
800/888/877/866 service, "10-10 calls", associated monthly account maintenance, PICC pass-through, and other switched services not reported above)
312 Long distance private line services 144 383 50 577
313 Satellite services
314 All other long distance services 14 17 2 33 * * *
Total toll service provided for resale 289 502 124 915 1 * * 1
Total service provided for resale (carrier's carrier) $2,239 $2,125 $136 $4,500 $69 $44 $1 $114
Note: Amounts may not add to totals due to rounding. * Denotes values greater than $0 but less than $500,000. 1/ Includes a proportionate share of amounts reported on Line 403 as surcharges or other amounts on bills identified as recovering state or federal universal service
contributions.
16

Table 5Revenues from Telecommunications Service Provided for Resale 1/: 2003
Continued(Dollar Amounts Shown in Millions)
Data from FCC Form 499-A Cellular, PCS and SMR Wireless Other WirelessTelephony
Line Intrastate Interstate International Total Intrastate Interstate International Total Fixed local service 303 Monthly service, local calling, connection charges,
vertical features, and other local exchange service including subscriber line and PICC charges to IXCs
a Provided as unbundled network elements $1 $1
b Provided under other arrangements 1.3 0.5 * 1.8
Total Line 303 2 1 * 3
304 Per-minute charges for originating or terminating calls a Provided under state or federal access tariff 1 1 * 2
b Provided as unbundled network elements or other
contract arrangement 40 5 * 45 1 * 1
Total Line 304 40 6 * 46 1 * 1
305 Local private line & special access 22 * 23
306 Payphone compensation from toll carriers * * * * * *
307 Other local telecommunications service revenues 1 * 1
308 Universal service support revenue received from 50 51 * 101 federal or state sources Total fixed local service provided for resale 115 59 * 173 1 * 1
Mobile service (including wireless telephony, paging & messaging, and other mobile services)
309 Monthly, activation, and message charges except toll 3,024 1,107 11 4,142 131 18 * 149
Total mobile service provided for resale 3,024 1,107 11 4,142 131 18 * 149 Toll service 310 Operator and toll calls with alternative billing 1 * 1
arrangements (credit card, collect, international call-back, etc.)
311 Ordinary long distance (MTS, customer toll-free 323 131 1 455 1 * 1
800/888/877/866 service, "10-10 calls", associated monthly account maintenance, PICC pass-through, and other switched services not reported above)
312 Long distance private line services * * * 1
313 Satellite services 1 1 2 2 2 6
314 All other long distance services 2 1 2
Total toll service provided for resale 325 133 2 459 3 2 2 7
Total service provided for resale (carrier's carrier) $3,463 $1,298 $13 $4,775 $135 $20 $2 $157
Note: Amounts may not add to totals due to rounding. * Denotes values greater than $0 but less than $500,000. 1/ Includes a proportionate share of amounts reported on Line 403 as surcharges or other amounts on bills identified as recovering state or federal universal service
contributions.
17

Table 5Revenues from Telecommunications Service Provided for Resale 1/: 2003
Continued(Dollar Amounts Shown in Millions)
Data from FCC Form 499-A Toll Carriers Total All Filers
Line Intrastate Interstate International Total Intrastate Interstate International Total Fixed local service 303 Monthly service, local calling, connection charges,
vertical features, and other local exchange service including subscriber line and PICC charges to IXCs
a Provided as unbundled network elements $43 $11 $1 $54 $3,563 $678 $4 $4,245
b Provided under other arrangements 23 8 32 1,151 336 * 1,487
Total Line 303 66 19 1 86 4,714 1,014 4 5,731
304 Per-minute charges for originating or terminating calls a Provided under state or federal access tariff 29 27 3 58 6,083 3,902 14 9,999
b Provided as unbundled network elements or other
contract arrangement 67 38 1 106 1,850 1,122 1 2,973
Total Line 304 96 65 4 165 7,933 5,024 15 12,972
305 Local private line & special access 123 68 1 192 1,685 11,040 2 12,726
306 Payphone compensation from toll carriers 6 14 1 20 148 144 2 293
307 Other local telecommunications service revenues 23 1 23 1,495 550 * 2,045
308 Universal service support revenue received from 25 1 * 26 1,298 2,676 * 3,974federal or state sources Total fixed local service provided for resale 339 167 6 512 17,273 20,446 22 37,742
Mobile service (including wireless telephony, paging & messaging, and other mobile services)
309 Monthly, activation, and message charges except toll 65 25 90 3,280 1,173 11 4,465
Total mobile service provided for resale 65 25 90 3,280 1,173 11 4,465 Toll service 310 Operator and toll calls with alternative billing 97 299 1,341 1,736 125 299 1,341 1,766
arrangements (credit card, collect, international call-back, etc.)
311 Ordinary long distance (MTS, customer toll-free 2,339 4,755 3,792 10,885 3,028 4,993 3,865 11,885
800/888/877/866 service, "10-10 calls", associated monthly account maintenance, PICC pass-through, and other switched services not reported above)
312 Long distance private line services 809 2,362 248 3,419 979 2,756 298 4,032
313 Satellite services * 73 120 193 2 75 122 199
314 All other long distance services 113 107 57 277 137 127 58 323
Total toll service provided for resale 3,358 7,595 5,557 16,510 4,271 8,249 5,685 18,205
Total service provided for resale (carrier's carrier) $3,762 $7,787 $5,563 $17,112 $24,825 $29,869 $5,718 $60,412
Note: Amounts may not add to totals due to rounding. * Denotes values greater than $0 but less than $500,000. 1/ Includes a proportionate share of amounts reported on Line 403 as surcharges or other amounts on bills identified as recovering state or federal universal service
contributions.
18

Table 6Revenues from Telecommunications Service Provided to End Users: 2003
(Amounts Shown in Millions)
Data from FCC Form 499-A Regional Bell Operating Company Other Incumbent Local Incumbent Local Exchange Carriers Exchange Carriers
Line Intrastate Interstate International Total Intrastate Interstate International Total Fixed local service 404 Monthly service, local calling, connection charges, $42,516 $406 $42,922 $7,338 $14 * $7,351
vertical features, and other local exchange service charges except for federally tariffed subscriber line charges and PICC charges
405 PICC charges levied by a local exchange carrier 230 8,873 9,103 62 1,890 1 1,954on a no-PIC customer and tariffed subscriber line charges Total local exchange (Line 404 + Line 405) 42,746 9,279 52,024 7,400 1,904 1 9,305
406 Local private line and special access service 2,651 3,504 6,155 345 346 * 691 407 Payphone coin revenues 341 15 355 24 * * 25 408 Other local telecommunications service revenues 771 6 777 81 3 * 85
Line 403 surcharges on fixed local service 1/ 178 1,070 1,248 25 185 210 Total fixed local service provided to end users 46,686 13,873 60,559 7,875 2,439 1 10,315
Mobile service (including wireless telephony, paging & messaging, and other mobile services) 409 Monthly and activation charges 172 1 173 47 8 55 410 Message charges including roaming, but excluding 89 8 97 16 4 20
toll charges Line 403 surcharges on mobile service 1/ 1 1 2 * 1 1 Total mobile service provided to end users 262 10 272 62 13 76
Toll service 411 Prepaid calling card (including card sales to 2 * 2 * * *
customers and non-carrier distributors) reported at face value of cards
412 International calls that both originate and terminate in foreign points
413 Operator and toll calls with alternative billing 129 2 130 7 1 * 8arrangements (credit card, collect, international call- back, etc.) other than revenues reported on Line 412
414 Ordinary long distance (MTS, customer toll-free 2,788 73 2,861 290 39 1 330800/888/877/866 service, "10-10" calls, associated monthly account maintenance, PICC pass-through, and other switched services not reported above)
415 Long distance private line services 1,022 1 1,022 76 5 * 81 416 Satellite services * * 417 All other long distance services 41 * 42 8 1 * 10
Line 403 surcharges on toll service 1/ 7 7 13 1 3 * 4 Total toll service provided to end users 3,988 82 4,070 383 49 1 433 Total telecommunications service provided to 50,936 13,965 64,901 8,320 2,502 2 10,824end users
422 Uncollectible revenue/bad debt expense associated 1,077 187 1,263 107 21 * 128with end user revenues other than Line 412
423 Net universal service contribution base revenues $49,859 $13,779 $63,638 $8,214 $2,481 $2 $10,697 Note: Amounts may not add to totals due to rounding. * Denotes values greater than $0 but less than $500,000. 1/ Includes a proportionate share of amounts reported on Line 403 as surcharges or other amounts on bills identified as recovering state or federal
contributions.
19

Table 6Revenues from Telecommunications Service Provided to End Users: 2003
Continued(Amounts Shown in Millions)
Data from FCC Form 499-A CLECS and Other Payphone ProvidersFixed Local Competitors
Line Intrastate Interstate International Total Intrastate Interstate International Total Fixed local service 404 Monthly service, local calling, connection charges, $5,842 $184 $12 $6,038 * *
vertical features, and other local exchange service charges except for federally tariffed subscriber line charges and PICC charges
405 PICC charges levied by a local exchange carrier 9 768 * 777 * * * on a no-PIC customer and tariffed subscriber line charges Total local exchange (Line 404 + Line 405) 5,851 952 12 6,815 * * *
406 Local private line and special access service 898 1,517 * 2,415 3 * * 3 407 Payphone coin revenues 18 13 * 31 307 14 * 322 408 Other local telecommunications service revenues 262 5 * 267 * * * *
Line 403 surcharges on fixed local service 1/ 30 173 1 205 * * * Total fixed local service provided to end users 7,058 2,660 14 9,732 310 14 * 325
Mobile service (including wireless telephony, paging & messaging, and other mobile services) 409 Monthly and activation charges 8 1 * 10 410 Message charges including roaming, but excluding 1 * * 2
toll charges Line 403 surcharges on mobile service 1/ * * * * Total mobile service provided to end users 10 2 * 11
Toll service 411 Prepaid calling card (including card sales to 1 2 21 24 * * * *
customers and non-carrier distributors) reported at face value of cards
412 International calls that both originate and terminate in * * foreign points
413 Operator and toll calls with alternative billing 40 25 2 67 69 14 * 83arrangements (credit card, collect, international call- back, etc.) other than revenues reported on Line 412
414 Ordinary long distance (MTS, customer toll-free 783 830 207 1,819 * * * * 800/888/877/866 service, "10-10" calls, associated monthly account maintenance, PICC pass-through, and other switched services not reported above)
415 Long distance private line services 184 305 23 512 416 Satellite services 14 11 * 25 417 All other long distance services 37 20 7 64
Line 403 surcharges on toll service 1/ 5 94 3 102 * * * Total toll service provided to end users 1,064 1,286 263 2,614 70 14 * 84 Total telecommunications service provided to 8,132 3,948 277 12,357 380 28 1 409end users
422 Uncollectible revenue/bad debt expense associated 226 95 10 330 4 1 * 5with end user revenues other than Line 412
423 Net universal service contribution base revenues $7,906 $3,854 $267 $12,027 $376 $27 $1 $404 Note: Amounts may not add to totals due to rounding. * Denotes values greater than $0 but less than $500,000. 1/ Includes a proportionate share of amounts reported on Line 403 as surcharges or other amounts on bills identified as recovering state or federal
contributions.
20

Table 6Revenues from Telecommunications Service Provided to End Users: 2003
Continued(Amounts Shown in Millions)
Data from FCC Form 499-A Cellular, PCS and SMR Wireless Other WirelessTelephony
Line Intrastate Interstate International Total Intrastate Interstate International Total Fixed local service 404 Monthly service, local calling, connection charges, $51 $1 * $52 $8 * * $8
vertical features, and other local exchange service charges except for federally tariffed subscriber line charges and PICC charges
405 PICC charges levied by a local exchange carrier 4 4 1 1on a no-PIC customer and tariffed subscriber line charges Total local exchange (Line 404 + Line 405) 51 5 * 57 8 1 * 9
406 Local private line and special access service 14 * 14 18 * 18 407 Payphone coin revenues * * * * * * 408 Other local telecommunications service revenues 3 3 10 1 11
Line 403 surcharges on fixed local service 1/ * * * 1 * * * Total fixed local service provided to end users 68 6 * 74 37 2 * 39
Mobile service (including wireless telephony, paging & messaging, and other mobile services) 409 Monthly and activation charges 39,067 10,314 160 49,541 750 94 * 844 410 Message charges including roaming, but excluding 24,133 7,067 43 31,242 54 34 1 89
toll charges Line 403 surcharges on mobile service 1/ 227 1,416 1 1,644 2 15 * 17 Total mobile service provided to end users 63,427 18,797 203 82,427 806 143 1 951
Toll service 411 Prepaid calling card (including card sales to 6 2 1 9 * * * *
customers and non-carrier distributors) reported at face value of cards
412 International calls that both originate and terminate in * * 1 1foreign points
413 Operator and toll calls with alternative billing 18 5 * 23 * * * arrangements (credit card, collect, international call- back, etc.) other than revenues reported on Line 412
414 Ordinary long distance (MTS, customer toll-free 599 201 13 813 10 6 * 16800/888/877/866 service, "10-10" calls, associated monthly account maintenance, PICC pass-through, and other switched services not reported above)
415 Long distance private line services 2 1 * 3 * 1 1 416 Satellite services * * * * 3 5 * 9 417 All other long distance services 3 17 2 22 * * * *
Line 403 surcharges on toll service 1/ 2 19 * 21 * 1 * 1 Total toll service provided to end users 631 244 17 892 14 14 2 29 Total telecommunications service provided to 64,125 19,047 220 83,393 856 159 3 1,018end users
422 Uncollectible revenue/bad debt expense associated 1,527 412 4 1,944 12 3 * 15with end user revenues other than Line 412
423 Net universal service contribution base revenues $62,598 $18,635 $216 $81,449 $844 $156 $2 $1,002 Note: Amounts may not add to totals due to rounding. * Denotes values greater than $0 but less than $500,000. 1/ Includes a proportionate share of amounts reported on Line 403 as surcharges or other amounts on bills identified as recovering state or federal
contributions.
21

Table 6Revenues from Telecommunications Service Provided to End Users: 2003
Continued(Amounts Shown in Millions)
Data from FCC Form 499-A Toll Carriers Total All Filers
Line Intrastate Interstate International Total Intrastate Interstate International Total Fixed local service 404 Monthly service, local calling, connection charges, $4,127 $389 $13 $4,528 $59,882 $994 $24 $60,900
vertical features, and other local exchange service charges except for federally tariffed subscriber line charges and PICC charges
405 PICC charges levied by a local exchange carrier 1 297 * 297 301 11,833 1 12,136on a no-PIC customer and tariffed subscriber line charges Total local exchange (Line 404 + Line 405) 4,127 686 13 4,826 60,183 12,827 26 73,036
406 Local private line and special access service 114 276 4 393 4,042 5,643 4 9,689 407 Payphone coin revenues 20 17 1 38 710 59 2 770 408 Other local telecommunications service revenues 25 28 * 54 1,153 44 * 1,197
Line 403 surcharges on fixed local service 1/ 14 105 1 119 248 1,533 2 1,783 Total fixed local service provided to end users 4,300 1,111 18 5,430 66,335 20,106 33 86,474
Mobile service (including wireless telephony, paging & messaging, and other mobile services) 409 Monthly and activation charges 858 268 39 1,164 40,902 10,687 199 51,787 410 Message charges including roaming, but excluding 239 82 1 322 24,532 7,195 44 31,771
toll charges Line 403 surcharges on mobile service 1/ 1 30 * 32 232 1,463 1 1,696 Total mobile service provided to end users 1,098 380 40 1,517 65,666 19,344 244 85,254
Toll service 411 Prepaid calling card (including card sales to 59 121 658 838 69 124 681 874
customers and non-carrier distributors) reported at face value of cards
412 International calls that both originate and terminate in 1,146 1,146 1,148 1,148foreign points
413 Operator and toll calls with alternative billing 813 1,046 608 2,467 1,076 1,093 610 2,779arrangements (credit card, collect, international call- back, etc.) other than revenues reported on Line 412
414 Ordinary long distance (MTS, customer toll-free 9,773 17,322 5,359 32,454 14,243 18,470 5,580 38,293800/888/877/866 service, "10-10" calls, associated monthly account maintenance, PICC pass-through, and other switched services not reported above)
415 Long distance private line services 1,512 6,766 1,387 9,664 2,796 7,078 1,410 11,284 416 Satellite services 7 98 135 240 25 115 135 274 417 All other long distance services 531 603 155 1,289 620 642 164 1,426
Line 403 surcharges on toll service 1/ 45 2,607 111 2,763 60 2,731 114 2,905 Total toll service provided to end users 12,740 28,563 9,559 50,861 18,889 30,252 9,842 58,983 Total telecommunications service provided to 18,139 30,053 9,617 57,809 150,889 69,702 10,120 230,711end users
422 Uncollectible revenue/bad debt expense associated 699 997 319 2,015 3,651 1,715 332 5,699with end user revenues other than Line 412
423 Net universal service contribution base revenues $17,440 $29,056 $8,152 $54,648 $147,238 $67,987 $8,639 $223,864 Note: Amounts may not add to totals due to rounding. * Denotes values greater than $0 but less than $500,000. 1/ Includes a proportionate share of amounts reported on Line 403 as surcharges or other amounts on bills identified as recovering state or federal
contributions.
22

Table 7Total Revenues: 2003(Amounts Shown in Millions)
Data from FCC Form 499-A Regional Bell Operating Company Other Incumbent Local Incumbent Local Exchange Carriers Exchange Carriers
Line Intrastate Interstate International Total Intrastate Interstate International Total
Fixed local service other than payphone $57,327 $28,231 $85,558 $11,598 $6,539 $5 $18,141[Lines 303, 304, 305, 307, 308, 404, 405, 406, 408, and a portion of 403 1/]
Payphone 408 86 494 31 11 * 42[Lines 306 and 407]
Mobile service 312 29 341 73 17 * 90[Lines 309, 409, 410, and a portion of 403 1/]
Toll service 4,260 88 4,348 406 61 1 467[Lines 310, 311, 312, 313, 314, 411, 412, 413, 414, 415, 416, 417, and a portion of 403 1/]
Total telecommunications service revenues 62,306 28,434 90,740 12,107 6,627 6 18,740
Total telecommunications service provided for resale 11,370 14,469 25,839 3,787 4,125 4 7,916(from Table 1.5)
Total telecommunications service provided to 50,936 13,965 64,901 8,320 2,502 2 10,824end users (from Table 1.6)
Total telecommunications service revenues 62,306 28,434 90,740 12,107 6,627 6 18,740
418 Enhanced services, inside wiring maintenance, billing - - - - - - - - - 11,012 - - - - - - - - - 2,741
and collection, customer premises equipment, published directory, dark fiber, Internet access, cable TV program transmission, and non-telecommunications service revenues
419 Gross billed revenues from all sources - - - - - - - - - 101,752 - - - - - - - - - 21,481
421 Uncollectible revenue/bad debt expense associated 1,593 207with gross billed revenues
Total collected revenuesfrom all sources $100,159 $21,274
Note: Amounts may not add to totals due to rounding. * Denotes values greater than $0 but less than $500,000. 1/ Includes a proportionate share of amounts reported on Line 403 as surcharges or other amounts on bills identified as recovering state or federal
universal service contributions.
23

Table 7Total Revenues: 2003
Continued(Amounts Shown in Millions)
Data from FCC Form 499-A CLECS and Other Payphone ProvidersFixed Local Competitors
Line Intrastate Interstate International Total Intrastate Interstate International Total
Fixed local service other than payphone $8,989 $4,265 $25 $13,279 $5 * * $5[Lines 303, 304, 305, 307, 308, 404, 405, 406, 408, and a portion of 403 1/]
Payphone 19 17 * 37 373 58 1 433[Lines 306 and 407]
Mobile service 11 2 * 12 [Lines 309, 409, 410, and a portion of 403 1/]
Toll service 1,353 1,788 388 3,529 71 14 * 85[Lines 310, 311, 312, 313, 314, 411, 412, 413, 414, 415, 416, 417, and a portion of 403 1/]
Total telecommunications service revenues 10,371 6,073 413 16,857 449 72 2 523
Total telecommunications service provided for resale 2,239 2,125 136 4,500 69 44 1 114(from Table 1.5)
Total telecommunications service provided to 8,132 3,948 277 12,357 380 28 1 409end users (from Table 1.6)
Total telecommunications service revenues 10,371 6,073 413 16,857 449 72 2 523
418 Enhanced services, inside wiring maintenance, billing - - - - - - - - - 10,095 - - - - - - - - - 31
and collection, customer premises equipment, published directory, dark fiber, Internet access, cable TV program transmission, and non-telecommunications service revenues
419 Gross billed revenues from all sources - - - - - - - - - 26,952 - - - - - - - - - 554
421 Uncollectible revenue/bad debt expense associated 594 5with gross billed revenues
Total collected revenuesfrom all sources $26,358 $548
Note: Amounts may not add to totals due to rounding. * Denotes values greater than $0 but less than $500,000. 1/ Includes a proportionate share of amounts reported on Line 403 as surcharges or other amounts on bills identified as recovering state or federal
universal service contributions.
24

Table 7Total Revenues: 2003
Continued(Amounts Shown in Millions)
Data from FCC Form 499-A Cellular, PCS and SMR Wireless Other WirelessTelephony
Line Intrastate Interstate International Total Intrastate Interstate International Total
Fixed local service other than payphone $182 $65 * $247 $37 $2 * $40[Lines 303, 304, 305, 307, 308, 404, 405, 406, 408, and a portion of 403 1/]
Payphone * * * * * * [Lines 306 and 407]
Mobile service 66,451 19,904 214 86,569 937 161 1 1,099[Lines 309, 409, 410, and a portion of 403 1/]
Toll service 956 377 19 1,351 17 16 4 36[Lines 310, 311, 312, 313, 314, 411, 412, 413, 414, 415, 416, 417, and a portion of 403 1/]
Total telecommunications service revenues 67,589 20,346 233 88,168 991 179 5 1,175
Total telecommunications service provided for resale 3,463 1,298 13 4,775 135 20 $2 157(from Table 1.5)
Total telecommunications service provided to 64,125 19,047 220 83,393 856 159 3 1,018end users (from Table 1.6)
Total telecommunications service revenues 67,589 20,346 233 88,168 991 179 5 1,175
418 Enhanced services, inside wiring maintenance, billing - - - - - - - - - 18,801 - - - - - - - - - 1,680
and collection, customer premises equipment, published directory, dark fiber, Internet access, cable TV program transmission, and non-telecommunications service revenues
419 Gross billed revenues from all sources - - - - - - - - - 106,969 - - - - - - - - - 2,854
421 Uncollectible revenue/bad debt expense associated 2,284 23with gross billed revenues
Total collected revenuesfrom all sources $104,685 $2,831
Note: Amounts may not add to totals due to rounding. * Denotes values greater than $0 but less than $500,000. 1/ Includes a proportionate share of amounts reported on Line 403 as surcharges or other amounts on bills identified as recovering state or federal
universal service contributions.
25

Table 7Total Revenues: 2003
Continued(Amounts Shown in Millions)
Data from FCC Form 499-A Toll Carriers Total All Filers
Line Intrastate Interstate International Total Intrastate Interstate International Total
Fixed local service other than payphone $4,613 $1,247 $23 $5,883 $82,751 $40,350 $52 $123,153[Lines 303, 304, 305, 307, 308, 404, 405, 406, 408, and a portion of 403 1/]
Payphone 26 31 2 59 857 203 3 1,063[Lines 306 and 407]
Mobile service 1,163 405 40 1,607 68,946 20,517 255 89,718[Lines 309, 409, 410, and a portion of 403 1/]
Toll service 16,099 36,157 15,116 67,372 23,160 38,501 15,527 77,188[Lines 310, 311, 312, 313, 314, 411, 412, 413, 414, 415, 416, 417, and a portion of 403 1/]
Total telecommunications service revenues 21,901 37,840 15,180 74,920 175,714 99,571 15,838 291,123
Total telecommunications service provided for resale 3,762 7,787 5,563 17,112 24,825 29,869 5,718 60,412(from Table 1.5)
Total telecommunications service provided to 18,139 30,053 9,617 57,809 150,889 69,702 10,120 230,711end users (from Table 1.6)
Total telecommunications service revenues 21,901 37,840 15,180 74,920 175,714 99,571 15,838 291,123
418 Enhanced services, inside wiring maintenance, billing - - - - - - - - - 20,827 - - - - - - - - - 65,186
and collection, customer premises equipment, published directory, dark fiber, Internet access, cable TV program transmission, and non-telecommunications service revenues
419 Gross billed revenues from all sources - - - - - - - - - 95,747 - - - - - - - - - 356,309
421 Uncollectible revenue/bad debt expense associated 2,808 7,514with gross billed revenues
Total collected revenuesfrom all sources $92,939 $348,794
Note: Amounts may not add to totals due to rounding. * Denotes values greater than $0 but less than $500,000. 1/ Includes a proportionate share of amounts reported on Line 403 as surcharges or other amounts on bills identified as recovering state or federal
universal service contributions.
26

Table 8Revenues by Type of Carrier 1/: 2003
(Dollar Amounts Shown in Millions)
Data from FCC Form 499-A Telecommunications Services Telecommunications ServicesProvided for Resale 2/ Provided to End Users 2/
Fixed Mobile Toll Total Fixed Mobile Toll TotalLocal Local
Regional Bell Operating Companies $25,492 $68 $279 $25,839 $60,559 $272 $4,070 $64,901
Other Incumbent Local Exchange Carriers (ILECs) 7,867 14 34 7,916 10,315 76 433 10,824
Total ILECs 33,360 83 312 33,755 70,875 348 4,503 75,726
Competitive Access Providers (CAPs) and Competitive 3,306 1 770 4,077 9,067 9 2,356 11,432 Local Exchange Carriers (CLECs)
Local Resellers 19 4 23 604 2 92 698
Private Service Providers 17 93 111 24 * 133 157
Shared-Tenant Service Providers 1 * 1 15 7 22
Other Local Service Providers 240 48 288 23 * 26 49
Total Local Competitors 3,584 1 915 4,500 9,732 11 2,614 12,357
Fixed Local Service Providers 36,944 84 1,228 38,255 80,606 359 7,117 88,082
Payphone Service Providers 112 1 114 325 84 409
Wireless Telephony Including Cellular, Personal 173 4,142 459 4,775 74 82,427 892 83,393 Communications Service (PCS) and SMR Telephony Carriers
Paging & Messaging Service Providers 1 144 7 152 1 833 21 855
Specialized Mobile Radio (SMR) Dispatch * 33 * 33
Wireless Data and Other Mobile Service Providers 5 5 38 84 9 130
Wireless Service Providers 174 4,291 466 4,931 113 83,377 921 84,411
Interexchange Carriers (IXCs) 383 1 12,754 13,138 4,853 333 42,922 48,107
Operator Service Providers (OSPs) 2 64 66 3 498 501
Prepaid Calling Card Providers 6 77 83 58 40 631 729
Satellite Service Providers 5 191 196 15 452 467
Toll Resellers 69 84 1,497 1,650 442 1,130 6,071 7,644
Other Toll Carriers 52 1,926 1,979 73 * 287 360
Toll Service Providers 512 90 16,510 17,112 5,430 1,517 50,861 57,808
All Filers $37,742 $4,465 $18,205 $60,412 $86,474 $85,254 $58,983 $230,711
Note: Amounts may not add to totals due to rounding. * Denotes values greater than $0 but less than $500,000. 1/ Revenues are classified by the primary carrier type of each reporting entity. For example, revenues reported by an RBOC affiliate that identifies itself
as an IXC are included in the table as IXC revenues. Many LECs provided both local and long distance services as part of package plans. Most of the revenues for the toll portion of these bundles were reported as toll revenues on FCC Form 499-A filings of LEC toll affiliates.
2/ Telecommunications service provided for resale consists of services provided to other contributors to federal universal service support mechanisms for resale. Revenues from services provided to firms that are de minimis under or exempt from federal universal service support mechanisms are reported as end-user service and are subject to contribution requirements.
27

Table 8Revenues by Type of Carrier 1/: 2003
Continued(Dollar Amounts Shown in Millions)
Data from FCC Form 499-A Universal Telecommunications Service Revenues Other TotalService Revenues
Contribution Intrastate Interstate International Other Total 4/Base Revenues to International
2/ 3/ International
Regional Bell Operating Companies $13,778 $62,306 $28,434 $90,740 $11,012 $101,752
Other Incumbent Local Exchange Carriers (ILECs) 2,483 12,107 6,627 6 18,740 2,741 21,481
Total ILECs 16,262 74,413 35,061 6 109,480 13,753 123,233
Competitive Access Providers (CAPs) and Competitive 3,827 9,631 5,492 * 385 15,509 5,819 21,328 Local Exchange Carriers (CLECs)
Local Resellers 136 574 141 6 721 132 853
Private Service Providers 114 58 192 * 17 267 3,812 4,079
Shared-Tenant Service Providers 6 16 4 3 22 37 59
Other Local Service Providers 15 92 244 1 338 295 633
Total Local Competitors 4,097 10,371 6,073 * 412 16,857 10,095 26,952
Fixed Local Service Providers 20,359 84,784 41,134 * 418 126,337 23,848 150,185
Payphone Service Providers 28 449 72 2 523 31 554
Wireless Telephony Including Cellular, Personal 18,848 67,589 20,346 * 233 88,168 18,801 106,969 Communications Service (PCS) and SMR Telephony Carriers
Paging & Messaging Service Providers 112 872 132 1 2 1,007 411 1,418
Specialized Mobile Radio (SMR) Dispatch 1 33 1 * 33 70 103
Wireless Data and Other Mobile Service Providers 45 87 46 * 1 135 1,199 1,334
Wireless Service Providers 19,006 68,580 20,525 2 236 89,342 20,481 109,823
Interexchange Carriers (IXCs) 31,480 17,716 33,085 1,011 9,434 61,246 16,882 78,127
Operator Service Providers (OSPs) 147 344 191 31 567 170 737
Prepaid Calling Card Providers 55 74 65 1 671 812 28 841
Satellite Service Providers 351 72 183 46 362 663 1,656 2,319
Toll Resellers 4,185 3,403 3,817 66 2,008 9,294 1,986 11,279
Other Toll Carriers 211 291 499 22 1,527 2,339 105 2,444
Toll Service Providers 36,429 21,901 37,840 1,146 14,033 74,920 20,827 95,747
All Filers $75,821 $175,714 $99,571 $1,148 $14,690 $291,123 $65,186 $356,309
Note: Amounts may not add to totals due to rounding. Contribution base revenues revised March 9, 2005 * Denotes values greater than $0 but less than $500,000. 1/ Revenues are classified by the primary carrier type of each reporting entity. For example, revenues reported by an RBOC affiliate that identifies itself
as an IXC are included in the table as IXC revenues. Many LECs provided both local and long distance services as part of package plans. Most of the revenues for the toll portion of these bundles were reported as toll revenues on FCC Form 499-A filings of LEC toll affiliates.
2/ Telecommunications service provided for resale consists of services provided to other contributors to federal universal service support mechanisms for resale. Revenues from services provided to firms that are de minimis under or exempt from federal universal service support mechanisms are reported as end-user service and are subject to contribution requirements.
3/ Universal service contribution base revenues consist of all interstate and international end-user telecommunications revenues except for international-to-international revenues reported on Line 412. The totals include revenues from filers who are de minimis or otherwise exempt from contributing. This table also includes international revenues that were exempt from contribution because of the 12 percent rule. See Table 4 for details on exempt amounts.Contribution base amounts reported as uncollectible on Line 422 have been removed.
4/ Carriers report non-telecommunications service revenues on Line 418. This category includes enhanced services, inside wiring maintenance, billing and collection, customer premises equipment, published directory, dark fiber, Internet, foreign carrier and other non-U.S. telecommunications service revenues.
28

Table 9Estimates of Average Revenue per Conversation Minute
(Dollar Amounts and Minutes Shown in Millions)
1993 1994 1995 1996 1997 1998 1999 2000 2001 2002 2003
Interstate operator service revenues 1/ $7,052 $6,561 $6,878 $6,454 $7,113 $6,971 $5,747 $6,603 $5,480 $3,843 $2,508 + Other interstate switched toll revenues 2/ $36,477 $38,843 $42,139 $47,865 $42,075 $42,620 $45,026 $38,753 $32,870 $26,431 $24,050 + International-to-international toll revenues 3/ $111 $166 $249 $374 $561 $1,121 $983 $1,087 $924 $636 $1,148 + Charges on bills identified as USF $878 $2,213 $2,830 $2,945 $2,361 $2,028 contributions 4/ + PICC pass-through reported as SLC $1,208 $0 $0 $0 $0 $0 revenues 5/ - 80% of revenues reported by toll resellers $1,001 $1,251 $2,582 $4,211 n.a. n.a. n.a. n.a. n.a. n.a. n.a. = Total end-user switched toll revenues $42,528 $44,153 $46,435 $50,107 $49,325 $52,797 $53,969 $49,273 $42,219 $33,270 $29,734
- International-to-international toll revenues 3/ $111 $166 $249 $374 $561 $1,121 $983 $1,087 $924 $636 $1,148 = U.S. international and interstate end-user $42,417 $43,987 $46,186 $49,733 $48,764 $51,677 $52,986 $48,186 $41,295 $32,634 $28,586 switched toll revenues
End-user international MTS revenues 6/ $11,564 $12,543 $14,335 $14,598 $15,661 $14,726 $14,980 $14,909 $11,380 $9,956 $8,944 - International reoriginating revenues 13/ $0 $0 $28 $43 $248 $287 $370 $430 $712 $574 $633 - International-to-international toll revenues 3/ $140 $166 $249 $374 $561 $1,121 $983 $1,087 $924 $636 $1,148 = International revenues for U.S. end users $11,424 $12,377 $14,058 $14,180 $14,853 $13,318 $13,627 $13,391 $9,743 $8,746 $7,163
Total end-user switched toll revenues $42,528 $44,153 $46,435 $50,107 $49,325 $52,797 $53,969 $49,273 $42,219 $33,270 $29,734 - End-user international MTS revenues 6/ $11,564 $12,543 $14,335 $14,598 $15,661 $14,726 $14,980 $14,909 $11,380 $9,956 $8,944 = Interstate domestic switched end-user $30,965 $31,610 $32,100 $35,509 $33,664 $38,071 $39,507 $34,364 $30,840 $23,314 $20,790 revenues
U.S. billed international minutes 11,513 13,616 15,889 19,325 22,753 24,250 28,515 29,216 33,280 35,988 42,664 - Country-direct/beyond minutes 9/ 294 350 500 728 1,053 933 1,736 1,935 1,330 1,127 1,422 - Reoriginating minutes 13/ 0 0 5 26 98 532 802 1,412 4,414 3,664 5,354 = U.S. billed international minutes excluding 11,219 13,266 15,384 18,571 21,602 22,785 25,978 25,869 27,536 31,197 35,888 country-direct/beyond and reoriginating
ILEC originating interstate access minutes 7/ 157,114 162,043 169,236 173,300 181,900 184,000 208,267 204,154 194,464 175,092 153,275 + Estimated CLEC originating minutes 8/ 432 580 1,218 1,816 4,118 6,452 12,079 18,034 22,947 21,186 22,991 - U.S. billed international minutes excluding country-direct/beyond and reoriginating 9/ 11,219 13,266 15,384 18,571 21,602 22,785 25,978 25,869 27,536 31,197 35,888 = Domestic originating access minutes 146,327 149,357 155,071 156,545 164,416 167,667 194,369 196,319 189,875 165,081 140,378
ILEC terminating interstate access minutes 7/ 214,126 239,360 262,712 292,800 315,400 334,800 344,465 363,295 345,306 310,908 290,792 + Estimated CLEC terminating minutes 8/ 589 856 1,891 3,068 7,141 11,739 20,757 32,092 40,746 37,620 43,619 - Country-direct/beyond international 294 350 500 728 1,053 933 1,736 1,935 1,330 1,127 1,422 settlement minutes 9/ Foreign billed international settlement - minutes 10/ 5,678 6,385 7,121 8,291 9,107 10,208 10,765 12,719 13,478 13,575 13,575 = Domestic terminating access minutes 208,743 233,481 256,982 286,849 312,381 335,398 352,721 380,734 371,245 333,826 319,414
Conversation minutes 11/ U.S. interstate and international minutes 219,962 246,747 272,366 305,420 333,984 358,183 377,163 406,603 398,780 365,023 355,302 International conversation minutes 9/ 11,219 13,266 15,384 18,571 21,602 22,785 25,016 25,869 27,536 31,197 35,888 Interstate domestic conversation minutes 208,743 233,481 256,982 286,849 312,381 335,398 352,147 380,734 371,245 333,826 319,414
End-user revenue per U.S. interstate and international minute $0.19 $0.18 $0.17 $0.16 $0.15 $0.14 $0.14 $0.12 $0.10 $0.09 $0.08 International conversation minute 12/ $1.02 $0.93 $0.91 $0.76 $0.69 $0.58 $0.54 $0.52 $0.35 $0.28 $0.20 Interstate domestic conversation minute $0.15 $0.14 $0.12 $0.12 $0.11 $0.11 $0.11 $0.09 $0.08 $0.07 $0.07
See notes on next page.
29

Notes for Table 9. n.a. - not applicable Note: Some data for prior years have been revised. 1/ Starting in 1997, interstate operator service revenues are interstate and international prepaid calling card revenues (currently Table 6,
Line 411) plus revenues from interstate and international operator and toll calls with alternative billing arrangements (currently Table 6, Line 413).
2/ Starting in 1997, other interstate switched toll revenues are equal to revenues from interstate and international ordinary long distance and other switched toll services (currently Table 6, Line 414).
3/ Starting in 1997, amounts shown are revenues from international calls that both originate and terminate at foreign points (currently Table 6, Line 412). International-to-international revenues were not reported separately prior to 1997. Amounts for 1992 through 1996 were estimated using a 50% growth rate. Most international-to-international services are provided to foreign customers. Some international-to-international services, such as call-back service, generate both originating and terminating access minutes.
4/ Carriers only report aggregate universal service surcharge revenues. Such revenues are allocated across services based on the share of contribution base revenues generated by each service.
5/ PICC charges were introduced in 1998. The reporting instructions for 1998 data were not clear and many toll carriers reported PICC pass-through charges as local revenues rather than as toll revenues. Carrier-by-carrier information was used to identify misclassified amounts to ensure that the amount of toll revenues for 1998 was accurate.
6/ Table 2 of Trends in the U.S. International Telecommunications Industry contains estimates of international end-user revenues. Preliminary figures are used for 2003. Note that these figures differ significantly from data contained in Table 6 herein. Table 3 in Trends in the U.S. International Telecommunications Industry contains data for country-direct/beyond and reoriginated minutes.
7/ Based on National Exchange Carrier Association (NECA) filings. Separate data were available for originating and terminating access minutesthrough 1998. Beginning in 1999, ILEC total interstate access minutes (Monitoring Report, Table 8.1) are allocated between originating and terminating based on the originating and terminating shares of carrier common line (CCL) minutes of use reported by carriers subject to price-capregulation and all local exchange carriers in the NECA pool (see Trends in Telephone Service, Table 1.4. The May 2004 edition contains data for 2003.) These figures exclude the minutes of rate-of-return ILECs.
8/ CLEC access minutes are estimated based on the local service competitors share of the local services market. Data taken from Table 8.7 of Trends in Telephone Service. That table includes all local service revenues of local carriers, but includes only local exchange service revenues of wireless and toll carriers.
Local service competitors' share of 1993 1994 1995 1996 1997 1998 1999 2000 2001 2002 2003local revenues 0.3% 0.4% 0.7% 1.0% 2.3% 3.5% 5.8% 8.8% 11.8% 12.1% 15.0%
9/ World total MTS minutes billed in the United States from Section 43.61 International Telecommunications Data includes data for all U.S. points, all settlement arrangements and all U.S. carriers. Billing types covered are 1, 11, and 21. (See the International Data report for an explanation of billing types.) Starting in 1995, carriers separately reported country-direct/beyond minutes. Most country-direct traffic generates terminating access minutes and generally represents billed end-user revenues from U.S. customers. Country-beyond minutes generally do not result in access minutes and generate revenues that are reported as international-to-international. Some other international-to-international traffic, however, results in access minutes and ordinary U.S. billed minutes of traffic. In the absence of better assumptions, and recognizing the offsetting bias for call-back minutes, the country-beyond/direct minutes are treated as terminating access minutes but are not included as international conversation minutes.
10/ World total MTS minutes originating or terminating in the United States but billed in foreign countries are from Section 43.61 International Telecommunications Data. Includes data for all U.S. points, all settlement arrangments and all U.S. carriers. Billing typescovered are 2, 12, and 22. (See the International Data report for an explanation of billing types.) Foreign billed minutes of international traffic generate terminating access minutes.
11/ International conversation minutes are estimated as U.S. billed international traffic minutes excluding country-direct/beyond and reoriginating minutes. Domestic conversation minutes are estimated as domestic terminating access minutes. An unknown quantity of conversation minutes result in reported interstate or international switched toll revenues but not in reported interstate access minutes. This may result in an upward bias in therevenue per minute estimates. For 2002 and 2003, revenue per minute estimates may be overstated by as much as 10% or 20%.
12/ International revenue per-minute amounts published herein differ from estimates published in Trends in the U.S. InternationalTelecommunications Industry, Table 2, because the latter estimates include revenues and billed minutes associated with calls that originate and terminate at foreign points.
13/ Reorigination traffic originates and terminates outside of the United States. U.S. carriers receive settlement like payments forthis service which are reported as U.S. billed revenues in 43.61 reports. For FCC Form 499 reporting, these amounts are treated assettlements and not reported as revenues. Reorigination data are taken from Table 3 in Trends in the U.S. InternationalTelecommunications Industry and from Section 43.61 International Telecommunications Data.
30

Table 10Estimates of Access and Universal Service Contribution Costs per Conversation Minute(Dollar Amounts and Minutes Shown in Millions, Per-Minute Amounts Shown in Dollars and Cents)
1993 1994 1995 1996 1997 1998 1999 2000 2001 2002 2003
Minutes data from Table 9 1/ ILEC originating interstate access minutes 157,114 162,043 169,236 173,300 181,900 184,000 208,267 204,154 194,464 175,092 153,275 Originating minutes of international traffic 11,219 13,266 15,384 18,571 21,602 22,785 25,978 25,869 27,536 31,197 35,888 Domestic originating access minutes 146,327 149,357 155,071 156,545 164,416 167,667 194,369 196,319 189,875 165,081 140,378 ILEC terminating interstate access minutes 214,126 239,360 262,712 292,800 315,400 334,800 344,465 363,295 345,306 310,908 290,792 Terminating minutes of international traffic 5,972 6,735 7,621 9,019 10,159 11,141 12,501 14,654 14,808 14,702 14,997 U.S. Interstate and international 219,962 246,747 272,366 305,420 333,984 358,183 377,163 406,603 398,780 365,023 355,302 conversation minutes International conversation minutes 11,219 13,266 15,384 18,571 21,602 22,785 25,016 25,869 27,536 31,197 35,888 Interstate domestic conversation minutes 208,743 233,481 256,982 286,849 312,381 335,398 352,147 380,734 371,245 333,826 319,414 End-user revenue per minute data from Table 9
U.S. interstate and international minute $0.19 $0.18 $0.17 $0.16 $0.15 $0.14 $0.14 $0.12 $0.10 $0.09 $0.08International conversation minute $1.02 $0.93 $0.91 $0.76 $0.69 $0.58 $0.54 $0.52 $0.35 $0.28 $0.20Interstate domestic conversation minute $0.15 $0.14 $0.12 $0.12 $0.11 $0.11 $0.11 $0.09 $0.08 $0.07 $0.07
Access cost per interstate 2-ended minute 2/ $0.067 $0.068 $0.065 $0.061 $0.056 $0.039 $0.033 $0.024 $0.018 $0.016 $0.014Originating access minutes $0.031 $0.032 $0.031 $0.029 $0.026 $0.022 $0.018 $0.013 $0.010 $0.008 $0.007Terminating access minutes $0.034 $0.034 $0.033 $0.030 $0.028 $0.016 $0.013 $0.011 $0.008 $0.007 $0.007
Access cost per average conversation minute 3/
U.S. interstate and international minutes $0.055 $0.054 $0.050 $0.045 $0.041 $0.026 $0.022 $0.016 $0.012 $0.010 $0.009International conversation minutes $0.049 $0.049 $0.047 $0.043 $0.039 $0.030 $0.026 $0.019 $0.014 $0.012 $0.010Interstate domestic conversation minutes $0.055 $0.054 $0.051 $0.046 $0.041 $0.026 $0.022 $0.016 $0.012 $0.010 $0.009
Universal service contributions assessed on a per-line basis ($millions) 4/ $873 $891 $907 $944 $973 $0 $0 $0 $0 $0 $0 Expressed per minute 5/:
U.S. interstate and international minutes $0.004 $0.004 $0.003 $0.003 $0.003 $0.006 $0.007 $0.007 $0.006 $0.006 $0.006International conversation minutes $0.004 $0.004 $0.003 $0.003 $0.003 $0.025 $0.025 $0.029 $0.020 $0.019 $0.014Interstate domestic conversation minutes $0.004 $0.004 $0.003 $0.003 $0.003 $0.005 $0.005 $0.005 $0.005 $0.005 $0.005
CLEC access revenues assessed on a per-minute basis ($millions) 6/ $26 $93 $213 $369 $573 $854 $901 Expressed per conversation minute $0.0001 $0.0003 $0.0006 $0.0009 $0.0014 $0.0023 $0.0025 International-to-international revenues as % of total international end-user revenues 7/ 1.0% 1.3% 1.7% 2.6% 3.6% 7.6% 6.6% 7.3% 8.1% 6.4% 12.8% Net international settlement payouts ($millions) 7/ $3,704 $4,289 $4,919 $5,601 $5,207 $4,663 $4,477 $4,335 $2,649 $2,560 $2,650
Per U.S. interstate and international minute $0.017 $0.017 $0.018 $0.018 $0.015 $0.012 $0.011 $0.010 $0.006 $0.007 $0.007Per international conversation minute $0.327 $0.319 $0.314 $0.294 $0.232 $0.189 $0.167 $0.155 $0.088 $0.077 $0.064
PICC charges billed by Tier 1 carriers ($millions) 8/ $2,000 $2,258 $1,732 $571 $134 $72 Expressed per conversation minute $0.006 $0.006 $0.004 $0.001 $0.000 $0.000 Access and universal service contribution costs 9/ per:
U.S. interstate and international minute $0.076 $0.075 $0.072 $0.066 $0.059 $0.050 $0.046 $0.038 $0.027 $0.026 $0.024International conversation minute 10/ $0.380 $0.371 $0.364 $0.340 $0.275 $0.249 $0.224 $0.209 $0.126 $0.111 $0.092Interstate domestic conversation minute $0.059 $0.058 $0.054 $0.049 $0.044 $0.037 $0.034 $0.026 $0.019 $0.018 $0.016
Revenue per-minute net of access and universal service contribution costs, per:
U.S. interstate and international minute $0.117 $0.104 $0.098 $0.096 $0.087 $0.094 $0.094 $0.081 $0.077 $0.064 $0.056International conversation minute 10/ $0.638 $0.562 $0.550 $0.423 $0.413 $0.335 $0.314 $0.309 $0.228 $0.170 $0.108Interstate domestic conversation minute $0.089 $0.078 $0.071 $0.075 $0.064 $0.077 $0.078 $0.064 $0.064 $0.052 $0.049
Access and universal service contribution costs as a percentage of revenue per minute
U.S. interstate and international minutes 39.3% 41.8% 42.2% 40.8% 40.3% 34.8% 33.1% 31.7% 25.9% 28.8% 29.8%International conversation minutes 37.3% 39.8% 39.9% 44.6% 40.0% 42.6% 41.6% 40.3% 35.5% 39.4% 46.0%Interstate domestic conversation minutes 40.0% 42.6% 43.2% 39.3% 40.7% 32.3% 30.2% 28.7% 23.3% 25.3% 24.9%
See notes on next page.
31

Notes for Table 10.
Note: Some data for prior years have been revised. Some 2002 international data are preliminary. See text for additional commentary. 1/ The number of conversation minutes is based on the number of access minutes. An unknown quantity of conversation minutes result in
reported revenues but do not result in interstate access minutes. Therefore, the analysis may overstate average access and universal servicecontribution costs per minute. Note that the end-user revenue per-minute data taken from Table 9 includes revenues from universal service pass-through charges levied on end users by filers to recover contribution amounts.
2/ Originating and terminating per-minute charges are derived from data in Table 1.2 of Trends in Telephone Service. Charges for the year are calculated as charges for the first and second half of each year, weighted by the actual access minutes for the respective halves.
3/ Access cost per average conversation minute is calculated as the total cost of originating and terminating access (based on ILEC but not CLEC access minutes and costs per minute shown in the table) divided by conversation minutes. For example, for international minutes, originating access minutes equal the U.S. billed international minutes excluding country-direct/beyond minutes and hubbing minutes. Similarly, terminating access minutes equal the number of foreign billed minutes plus country-direct/beyond minutes. Ideally, country-direct minutes would be treated differently from country-beyond minutes, but Section 43.61 international traffic data reports do not contain that breakout. For simplicity, all CLEC minutes are treated as domestic access minutes.
4/ Source: National Exchange Carrier Association (NECA). Through 1997, toll carriers were assessed based on the number of presubscribed lines.
5/ Through 1997, universal service contributions per minute were calculated as the assessments based on lines divided by all U.S.conversation minutes. Starting with 1998, the amounts are estimated as the approximate contribution rate for interstate and international revenues times the average per-minute charges.
6/ Interstate access per-minute revenues reported on FCC Form 457 and FCC Form 499-A by carriers other than ILECs. 7/ Section 43.61 International Telecommunications Data. Totals exclude settlement payouts for hubbing service. Net
international settlement payouts have been reduced by the ratio of international-to-international service revenues to total international end-user revenues, reflecting the assumption that these revenues cause a proportionate share of net settlement payouts.
8/ Since 1998, Tier 1 incumbent local exchange carriers were allowed to recover a portion of interstate expenses through presubscribed interexchange carrier charges (PICCs) on access lines. Where the access line was presubscribed, the PICC was levied on the interexchange carrier (IXC) and the associated revenues were reported as carrier's carrier revenues. The PICC charges shown in the table are based on Tier 1 carrier charges as well as line count information from Tariff Review Plans and from the Statistics of Communications Common Carriers. Where consumers did not have a presubscribed IXC, however, the LEC billed the PICC charge to the customer rather than the IXC. We estimated that 97% of ILEC PICC revenues were collected from IXCs. Note that PICCs on residential and single line business lines were eliminated on July 1, 2000 and that PICC charges largely have been phased out for other lines.
9/ Includes tariffed per-minute access charges, net international settlement payouts, universal service contributions and PICC charges but excludes the cost of dedicated access lines.
10/ The net cost of settling international traffic consists of the settlement payouts for U.S. billed traffic less the settlement receipts for foreign billed traffic. The minutes of foreign billed traffic are not included as international conversation minutes becauseU.S. carriers do not bill U.S. customers for this traffic. U.S. carriers incur terminating access charges for these minutes and international transmission costs. The terminating access costs are included in the cost per-minute estimates. Trends in the U.S.International Telecommunications Industry shows end-user revenue per minute handled, as compared to end-user revenueper U.S. billed conversation minute shown herein.
32

Table 11End-User Telecommunications Service Revenues
By Region of the Country: 2003(Dollar Amounts Shown in Millions)
By Type of Service All Services
Fixed Local Wireless Toll Total Region asand including for Percent of
Payphone Satellite Region Total
Southeast: $19,893 $21,464 $10,784 $52,140 22.6 % Alabama, Florida, Georgia, Kentucky, Louisiana, Mississippi, North Carolina, Puerto Rico,
South Carolina, Tennessee, and U.S. Virgin Islands
Western: 10,979 10,991 6,819 28,789 12.5 Alaska, Arizona, Colorado, Idaho, Iowa, Minnesota, Montana, Nebraska, New Mexico, North Dakota,
Oregon, South Dakota, Utah, Washington, and Wyoming
West Coast: 10,373 11,390 7,920 29,683 12.9 California, Hawaii, Nevada, American Samoa, Guam, Northern Mariana Islands, and Wake Island
Mid-Atlantic: 11,269 9,230 9,131 29,631 12.8 Delaware, District of Columbia, Maryland, New Jersey, Pennsylvania, Virginia, and West Virginia
Mid-West: 12,202 10,331 8,809 31,342 13.6 Illinois, Indiana, Michigan, Ohio, and Wisconsin
Northeast: 10,468 8,581 8,291 27,341 11.9 Connecticut, Maine, Massachusetts, New Hampshire,
New York, Rhode Island, and Vermont
Southwest: 10,942 13,266 6,813 31,021 13.4 Arkansas, Kansas, Missouri, Oklahoma, and Texas
Filers that did not identify revenues by region 1/ 348 0 415 764 0.3
Total $86,474 $85,254 $58,983 $230,711 100.0 %
1/ Filers that are exempt from contributing to local number portability administration are not required to provide a breakout by region of the country.
33

Table 12Share of Universal Service Contributions 1/
By Principal Type of ContributorUsing Traditional Carrier Categories 2/
Preliminary 1/
Q1 Service Provider Category 1997 1998 1999 2000 2001 2002 2003 2004 2005
Regional Bell Operating Companies (RBOCs) 11.7 % 14.4 % 14.3 % 16.2 % 18.3 % 19.9 % 19.9 % 22.6 % 22.7 % Including CLEC Affiliates.
Incumbent Local Exchange Carriers (ILECs) 2.6 1.4 1.5 1.7 2.1 2.8 3.2 3.8 3.8 Other Than RBOCs
Competitive Local Exchange Carriers (CLECs) Local Resellers and Other Local Carriers Other Than RBOCs 0.8 1.3 2.6 2.2 2.7 3.3 3.5 3.9 4.3
Total: Fixed Local Service Providers 15.1 17.1 18.5 20.1 23.1 26.0 26.6 30.3 30.9
Payphone Providers 0.0 0.1 0.1 0.1 0.1 0.0 0.0 0.0 0.0
Wireless Service Providers 3.3 5.1 6.6 9.2 12.0 17.2 24.8 32.6 34.1
RBOC Toll Service Providers 1.7 1.7 2.0 2.3 3.0 3.4 5.0 7.7 8.4
Other Toll Service Providers 79.9 76.0 72.9 68.3 61.9 53.3 43.6 29.4 26.6
Total: Toll Service Providers 81.6 77.7 74.9 70.6 64.9 56.7 48.6 37.1 35.0
Total All Filers 100.0 % 100.0 % 100.0 % 100.0 % 100.0 % 100.0 % 100.0 % 100.0 % 100.0 %
1/ For years 1997 through 2002, the percentages are based on shares of reported subject interstate and international end-user billed revenues. The percentages shown for 2003 are based on shares of reported subject interstate and international end-user collected revenues. Preliminarypercentages shown for 2004 and first Quarter 2005 are based on projected collected revenues from FCC Form 499-Q filings. Calculations exclude revenues for calls that both originate and terminate in foreign points. Calculations for years 1999 through 2003 include revenues for all filers. De minimis carriers were exempt from filing FCC Form 457 worksheets, which were used to identify 1997 and 1998 revenues, and are now exempt from filing FCC Form 499-Q worksheets.
2/ Prior to 2004, the FCC Form 499-A asked each filer to identify a single category of communications business that best described its operations. Theservice provider categories listed on FCC Form 499-A correspond to traditional breakdowns of the industry. Starting in 2004, carriers were allowedto specify more than one category and were allowed to identify themselves as an All Distance service provider. Revenues have been categorized using the traditional industry classification that best described each company.
Source: 1997 and 1998: FCC Form 457 filings; 1999 through 2003: FCC Form 499-A filings; 2004 and 2005: FCC Form 499-Q filings.
34

Customer Response Publication: Telecommunications Industry Revenues: 2003 You can help us provide the best possible information to the public by completing this form and returning it to the Industry Analysis & Technology Division of the FCC's Wireline Competition Bureau. 1. Please check the category that best describes you: ____ press ____ current telecommunications carrier ____ potential telecommunications carrier ____ business customer evaluating vendors/service options ____ consultant, law firm, lobbyist ____ other business customer ____ academic/student ____ residential customer ____ FCC employee ____ other federal government employee ____ state or local government employee ____ Other (please specify) 2. Please rate the report: Excellent Good Satisfactory Poor No opinion Data accuracy (_) (_) (_) (_) (_) Data presentation (_) (_) (_) (_) (_) Timeliness of data (_) (_) (_) (_) (_) Completeness of data (_) (_) (_) (_) (_) Text clarity (_) (_) (_) (_) (_) Completeness of text (_) (_) (_) (_) (_) 3. Overall, how do you Excellent Good Satisfactory Poor No opinion rate this report? (_) (_) (_) (_) (_) 4. How can this report be improved? 5. May we contact you to discuss possible improvements? Name: Telephone #:
Questions? Contact Jim Lande or Ken Lynch at 202-418-0940 or email [email protected], [email protected]
Fax this response to Or Mail this response to
202-418-0520 FCC/IATD Washington, D.C. 20554