revenue sharing payments to cities, villages, and...
TRANSCRIPT

Revenue Sharing Payments to Cities, Villages, and TownshipsFinal FY 2013-14, Estimated FY 2014-15, and Estimated FY 2015-16 Based on SB 133 (S-1) CR-1
FY 2015-16FY 2014-15FY 2013-14
Change from FY 2014-15TotalEligibleEstimatedChange from FY 2013-14TotalEligibleEstimatedTotal
CombinedCVTConstitutionalCombinedCVTConstitutionalCombinedLocal Unit
PercentDollarPaymentPaymentPaymentPercentDollarPaymentPaymentPaymentPaymentTypeLocal Unit Name
Alcona County
3.1%$2,328$77,013$0$77,0132.9%$2,071$74,685$0$74,685$72,614TownshipAlcona
3.1%$2,792$92,368$0$92,3682.9%$2,484$89,576$0$89,576$87,092TownshipCaledonia
3.1%$2,972$98,335$0$98,3352.9%$2,644$95,363$0$95,363$92,719TownshipCurtis
3.1%$3,388$112,099$0$112,0992.9%$3,015$108,711$0$108,711$105,696TownshipGreenbush
3.1%$1,555$51,474$0$51,4742.9%$1,385$49,919$0$49,919$48,534TownshipGustin
3.1%$3,241$107,245$0$107,2452.9%$2,884$104,004$0$104,004$101,120TownshipHarrisville
3.1%$2,207$73,035$0$73,0352.9%$1,964$70,828$0$70,828$68,864TownshipHawes
3.1%$1,736$57,441$0$57,4412.9%$1,544$55,705$0$55,705$54,161TownshipHaynes
3.1%$2,277$75,342$0$75,3422.9%$2,027$73,065$0$73,065$71,038TownshipMikado
3.1%$971$32,141$0$32,1412.9%$864$31,170$0$31,170$30,306TownshipMillen
3.1%$846$28,004$0$28,0042.8%$752$27,158$0$27,158$26,406TownshipMitchell
3.1%$1,151$38,108$0$38,1082.8%$1,024$36,957$0$36,957$35,933CityHarrisville
3.1%$810$26,811$0$26,8112.9%$722$26,001$0$26,001$25,279VillageLincoln
Alger County
3.1%$2,736$90,538$0$90,5382.9%$2,435$87,802$0$87,802$85,367TownshipAu Train
3.1%$1,255$41,529$0$41,5292.8%$1,116$40,274$0$40,274$39,158TownshipBurt
3.1%$113$3,739$0$3,7392.8%$99$3,626$0$3,626$3,527TownshipGrand Island
3.1%$1,053$34,846$0$34,8462.8%$935$33,793$0$33,793$32,858TownshipLimestone
3.1%$1,332$44,075$0$44,0752.8%$1,184$42,743$0$42,743$41,559TownshipMathias
3.1%$6,155$203,671$0$203,6712.9%$5,478$197,516$0$197,516$192,038TownshipMunising
3.1%$846$28,004$0$28,0042.8%$752$27,158$0$27,158$26,406TownshipOnota
3.1%$2,385$78,922$0$78,9222.9%$2,121$76,537$0$76,537$74,416TownshipRock River
2.3%$5,643$248,583$61,858$186,7252.9%$6,855$242,940$61,858$181,082$236,085CityMunising
3.1%$529$17,503$0$17,5032.9%$471$16,974$0$16,974$16,503VillageChatham
06/03/15 Prepared by The House Fiscal Agency Page 1

Revenue Sharing Payments to Cities, Villages, and TownshipsFinal FY 2013-14, Estimated FY 2014-15, and Estimated FY 2015-16 Based on SB 133 (S-1) CR-1
FY 2015-16FY 2014-15FY 2013-14
Change from FY 2014-15TotalEligibleEstimatedChange from FY 2013-14TotalEligibleEstimatedTotal
CombinedCVTConstitutionalCombinedCVTConstitutionalCombinedLocal Unit
PercentDollarPaymentPaymentPaymentPercentDollarPaymentPaymentPaymentPaymentTypeLocal Unit Name
Allegan County
3.1%$10,595$350,538$0$350,5382.9%$9,427$339,943$0$339,943$330,516TownshipAllegan
3.1%$6,788$224,595$0$224,5952.9%$6,039$217,807$0$217,807$211,768TownshipCasco
3.1%$5,287$174,950$0$174,9502.9%$4,704$169,663$0$169,663$164,959TownshipCheshire
3.1%$5,011$165,801$0$165,8012.9%$4,459$160,790$0$160,790$156,331TownshipClyde
3.1%$17,887$591,841$0$591,8412.9%$15,918$573,954$0$573,954$558,036TownshipDorr
3.1%$6,447$213,298$0$213,2982.9%$5,736$206,851$0$206,851$201,115TownshipFillmore
3.1%$6,083$201,284$0$201,2842.9%$5,414$195,201$0$195,201$189,787TownshipGanges
3.1%$14,174$469,001$0$469,0012.9%$12,613$454,827$0$454,827$442,214TownshipGun Plain
3.1%$7,976$263,898$0$263,8982.9%$7,097$255,922$0$255,922$248,825TownshipHeath
3.1%$4,787$158,402$0$158,4022.9%$4,261$153,615$0$153,615$149,354TownshipHopkins
3.1%$13,237$437,973$0$437,9732.9%$11,779$424,736$0$424,736$412,957TownshipLaketown
2.9%$9,654$342,174$22,744$319,4302.9%$9,264$332,520$22,744$309,776$323,256TownshipLee
3.1%$11,864$392,545$0$392,5452.9%$10,557$380,681$0$380,681$370,124TownshipLeighton
3.1%$7,255$240,030$0$240,0302.9%$6,454$232,775$0$232,775$226,321TownshipManlius
3.1%$5,336$176,542$0$176,5422.9%$4,747$171,206$0$171,206$166,459TownshipMartin
3.1%$5,665$187,441$0$187,4412.9%$5,040$181,776$0$181,776$176,736TownshipMonterey
3.1%$13,451$445,054$0$445,0542.9%$11,969$431,603$0$431,603$419,634TownshipOtsego
3.0%$7,000$243,739$12,142$231,5972.9%$6,589$236,739$12,142$224,597$230,150TownshipOverisel
3.1%$10,690$353,720$0$353,7202.9%$9,514$343,030$0$343,030$333,516TownshipSalem
3.1%$7,079$234,222$0$234,2222.9%$6,299$227,143$0$227,143$220,844TownshipSaugatuck
3.1%$6,016$199,057$0$199,0572.9%$5,352$193,041$0$193,041$187,689TownshipTrowbridge
3.1%$4,852$160,550$0$160,5502.9%$4,319$155,698$0$155,698$151,379TownshipValley
3.1%$4,960$164,130$0$164,1302.9%$4,413$159,170$0$159,170$154,757TownshipWatson
3.1%$7,426$245,679$0$245,6792.9%$6,606$238,253$0$238,253$231,647TownshipWayland
2.4%$11,828$505,680$114,328$391,3522.9%$13,913$493,852$114,328$379,524$479,939CityAllegan
3.0%$2,963$102,085$4,068$98,0173.6%$3,416$99,122$4,068$95,054$95,706CityDouglas
2.5%$3,361$137,054$25,831$111,2232.9%$3,757$133,693$25,831$107,862$129,936CityFennville
See the city of Holland in Ottawa CountySee the city of Holland in Ottawa CountyCityHolland
2.6%$9,512$373,836$59,100$314,7362.9%$10,216$364,324$59,100$305,224$354,108CityOtsego
2.4%$9,147$385,911$83,268$302,6432.9%$10,608$376,764$83,268$293,496$366,156CityPlainwell
2.8%$2,224$83,071$9,479$73,5922.9%$2,260$80,847$9,479$71,368$78,587CitySaugatuck
See the city of South Haven in Van Buren CountySee the city of South Haven in Van Buren CountyCitySouth Haven
2.6%$9,808$386,756$62,234$324,5222.9%$10,571$376,948$62,234$314,714$366,377CityWayland
2.8%$1,467$54,462$5,931$48,5312.9%$1,481$52,995$5,931$47,064$51,514VillageHopkins
2.7%$986$37,519$4,900$32,6192.9%$1,022$36,533$4,900$31,633$35,511VillageMartin
Alpena County
3.0%$21,784$744,784$23,978$720,8066.4%$43,364$723,000$23,978$699,022$679,636TownshipAlpena
3.1%$2,943$97,380$0$97,3802.9%$2,619$94,437$0$94,437$91,818TownshipGreen
3.1%$2,428$80,354$0$80,3542.9%$2,161$77,926$0$77,926$75,765TownshipLong Rapids
3.1%$4,064$134,455$0$134,4552.9%$3,617$130,391$0$130,391$126,774TownshipMaple Ridge
3.1%$4,027$133,261$0$133,2612.9%$3,584$129,234$0$129,234$125,650TownshipOssineke
3.1%$5,088$168,347$0$168,3472.9%$4,528$163,259$0$163,259$158,731TownshipSanborn
3.1%$738$24,424$0$24,4242.8%$656$23,686$0$23,686$23,030TownshipWellington
3.1%$4,878$161,425$0$161,4252.9%$4,342$156,547$0$156,547$152,205TownshipWilson
2.2%$25,141$1,191,658$359,787$831,8712.9%$33,032$1,166,517$359,787$806,730$1,133,485CityAlpena
See the village of Hillman in Montmorency CountySee the village of Hillman in Montmorency CountyVillageHillman
06/03/15 Prepared by The House Fiscal Agency Page 2

Revenue Sharing Payments to Cities, Villages, and TownshipsFinal FY 2013-14, Estimated FY 2014-15, and Estimated FY 2015-16 Based on SB 133 (S-1) CR-1
FY 2015-16FY 2014-15FY 2013-14
Change from FY 2014-15TotalEligibleEstimatedChange from FY 2013-14TotalEligibleEstimatedTotal
CombinedCVTConstitutionalCombinedCVTConstitutionalCombinedLocal Unit
PercentDollarPaymentPaymentPaymentPercentDollarPaymentPaymentPaymentPaymentTypeLocal Unit Name
Antrim County
3.1%$3,030$100,244$0$100,2442.9%$2,696$97,214$0$97,214$94,518TownshipBanks
3.1%$2,996$99,130$0$99,1302.9%$2,666$96,134$0$96,134$93,468TownshipCentral Lake
3.1%$1,228$40,654$0$40,6542.8%$1,092$39,426$0$39,426$38,334TownshipChestonia
3.1%$2,732$90,379$0$90,3792.9%$2,430$87,647$0$87,647$85,217TownshipCuster
3.1%$2,109$69,773$0$69,7732.9%$1,875$67,664$0$67,664$65,789TownshipEcho
3.1%$2,378$78,684$0$78,6842.9%$2,116$76,306$0$76,306$74,190TownshipElk Rapids
3.1%$2,979$98,573$0$98,5732.9%$2,649$95,594$0$95,594$92,945TownshipForest Home
3.1%$2,407$79,638$0$79,6382.9%$2,141$77,231$0$77,231$75,090TownshipHelena
3.1%$2,385$78,922$0$78,9222.9%$2,121$76,537$0$76,537$74,416TownshipJordan
3.1%$2,789$92,288$0$92,2882.9%$2,482$89,499$0$89,499$87,017TownshipKearney
3.1%$7,238$239,473$0$239,4732.9%$6,440$232,235$0$232,235$225,795TownshipMancelona
3.1%$5,299$175,348$0$175,3482.9%$4,716$170,049$0$170,049$165,333TownshipMilton
3.1%$2,226$73,671$0$73,6712.9%$1,980$71,445$0$71,445$69,465TownshipStar
3.1%$2,871$94,993$0$94,9932.9%$2,554$92,122$0$92,122$89,568TownshipTorch Lake
3.1%$1,000$33,096$0$33,0962.9%$890$32,096$0$32,096$31,206TownshipWarner
2.6%$2,561$102,741$18,011$84,7302.9%$2,811$100,180$18,011$82,169$97,369VillageBellaire
2.8%$2,289$84,545$8,805$75,7402.9%$2,298$82,256$8,805$73,451$79,958VillageCentral Lake
2.9%$3,948$138,632$7,996$130,6362.9%$3,751$134,684$7,996$126,688$130,933VillageElk Rapids
2.5%$839$34,631$6,865$27,7662.9%$951$33,792$6,865$26,927$32,841VillageEllsworth
2.4%$3,342$141,235$30,648$110,5872.9%$3,885$137,893$30,648$107,245$134,008VillageMancelona
Arenac County
3.1%$1,353$44,791$0$44,7912.9%$1,205$43,438$0$43,438$42,233TownshipAdams
3.1%$2,172$71,842$0$71,8422.9%$1,932$69,670$0$69,670$67,738TownshipArenac
3.1%$2,291$75,819$0$75,8192.9%$2,039$73,528$0$73,528$71,489TownshipAu Gres
3.1%$2,638$87,276$0$87,2762.9%$2,347$84,638$0$84,638$82,291TownshipClayton
3.1%$3,893$128,806$0$128,8062.9%$3,465$124,913$0$124,913$121,448TownshipDeep River
3.1%$2,265$74,944$0$74,9442.9%$2,016$72,679$0$72,679$70,663TownshipLincoln
3.1%$1,799$59,510$0$59,5102.9%$1,600$57,711$0$57,711$56,111TownshipMason
3.1%$2,847$94,198$0$94,1982.9%$2,533$91,351$0$91,351$88,818TownshipMoffatt
3.1%$2,633$87,117$0$87,1172.9%$2,343$84,484$0$84,484$82,141TownshipSims
3.1%$4,568$151,162$0$151,1622.9%$4,065$146,594$0$146,594$142,529TownshipStandish
3.1%$861$28,482$0$28,4822.9%$766$27,621$0$27,621$26,855TownshipTurner
3.1%$2,407$79,638$0$79,6382.9%$2,141$77,231$0$77,231$75,090TownshipWhitney
2.8%$2,138$78,142$7,414$70,7282.9%$2,122$76,004$7,414$68,590$73,882CityAu Gres
2.3%$753$33,259$8,357$24,9022.9%$917$32,506$8,357$24,149$31,589CityOmer
2.2%$3,578$162,872$44,488$118,3842.9%$4,501$159,294$44,488$114,806$154,793CityStandish
3.1%$1,274$42,166$0$42,1662.9%$1,134$40,892$0$40,892$39,758VillageSterling
3.1%$274$9,069$0$9,0692.9%$245$8,795$0$8,795$8,550VillageTurner
2.4%$435$18,632$4,232$14,40016.4%$2,568$18,197$4,232$13,965$15,629VillageTwining
06/03/15 Prepared by The House Fiscal Agency Page 3

Revenue Sharing Payments to Cities, Villages, and TownshipsFinal FY 2013-14, Estimated FY 2014-15, and Estimated FY 2015-16 Based on SB 133 (S-1) CR-1
FY 2015-16FY 2014-15FY 2013-14
Change from FY 2014-15TotalEligibleEstimatedChange from FY 2013-14TotalEligibleEstimatedTotal
CombinedCVTConstitutionalCombinedCVTConstitutionalCombinedLocal Unit
PercentDollarPaymentPaymentPaymentPercentDollarPaymentPaymentPaymentPaymentTypeLocal Unit Name
Baraga County
3.1%$1,082$35,801$0$35,8012.8%$962$34,719$0$34,719$33,757TownshipArvon
3.1%$4,237$140,183$0$140,1832.9%$3,770$135,946$0$135,946$132,176TownshipBaraga
3.1%$1,145$37,870$0$37,8702.9%$1,018$36,725$0$36,725$35,707TownshipCovington
3.1%$4,405$145,752$0$145,7522.9%$3,919$141,347$0$141,347$137,428TownshipLanse
3.1%$664$21,958$0$21,9582.8%$590$21,294$0$21,294$20,704TownshipSpurr
2.5%$3,912$158,106$28,664$129,4422.9%$4,332$154,194$28,664$125,530$149,862VillageBaraga
2.5%$4,812$201,029$41,831$159,1982.9%$5,523$196,217$41,831$154,386$190,694VillageLanse
Barry County
3.1%$4,775$158,004$0$158,0042.9%$4,250$153,229$0$153,229$148,979TownshipAssyria
3.1%$4,474$148,059$0$148,0592.9%$3,983$143,585$0$143,585$139,602TownshipBaltimore
3.1%$8,123$268,751$0$268,7512.9%$7,227$260,628$0$260,628$253,401TownshipBarry
3.1%$5,636$186,486$0$186,4862.9%$5,016$180,850$0$180,850$175,834TownshipCarlton
3.1%$4,604$152,355$0$152,3552.9%$4,097$147,751$0$147,751$143,654TownshipCastleton
3.1%$7,088$234,540$0$234,5402.9%$6,308$227,452$0$227,452$221,144TownshipHastings
3.1%$7,788$257,692$0$257,6922.9%$6,931$249,904$0$249,904$242,973TownshipHope
3.1%$6,766$223,879$0$223,8792.9%$6,020$217,113$0$217,113$211,093TownshipIrving
3.1%$7,233$239,314$0$239,3142.9%$6,435$232,081$0$232,081$225,646TownshipJohnstown
3.1%$3,657$121,009$0$121,0092.9%$3,254$117,352$0$117,352$114,098TownshipMaple Grove
3.1%$7,961$263,420$0$263,4202.9%$7,084$255,459$0$255,459$248,375TownshipOrangeville
3.1%$8,185$270,819$0$270,8192.9%$7,283$262,634$0$262,634$255,351TownshipPrairieville
3.1%$9,586$317,202$0$317,2022.9%$8,531$307,616$0$307,616$299,085TownshipRutland
3.1%$10,977$363,188$0$363,1882.9%$9,768$352,211$0$352,211$342,443TownshipThornapple
3.1%$3,900$129,045$0$129,0452.9%$3,469$125,145$0$125,145$121,676TownshipWoodland
3.1%$9,774$323,408$0$323,4082.9%$8,698$313,634$0$313,634$304,936TownshipYankee Springs
2.5%$17,579$725,727$144,070$581,6572.9%$19,914$708,148$144,070$564,078$688,234CityHastings
2.8%$1,162$42,006$3,579$38,4272.9%$1,140$40,844$3,579$37,265$39,704VillageFreeport
2.9%$7,981$284,150$20,093$264,0572.9%$7,697$276,169$20,093$256,076$268,472VillageMiddleville
2.4%$3,915$169,567$40,045$129,5222.9%$4,668$165,652$40,045$125,607$160,984VillageNashville
2.5%$1,022$42,033$8,221$33,8122.9%$1,153$41,011$8,221$32,790$39,858VillageWoodland
06/03/15 Prepared by The House Fiscal Agency Page 4

Revenue Sharing Payments to Cities, Villages, and TownshipsFinal FY 2013-14, Estimated FY 2014-15, and Estimated FY 2015-16 Based on SB 133 (S-1) CR-1
FY 2015-16FY 2014-15FY 2013-14
Change from FY 2014-15TotalEligibleEstimatedChange from FY 2013-14TotalEligibleEstimatedTotal
CombinedCVTConstitutionalCombinedCVTConstitutionalCombinedLocal Unit
PercentDollarPaymentPaymentPaymentPercentDollarPaymentPaymentPaymentPaymentTypeLocal Unit Name
Bay County
3.0%$35,205$1,203,576$38,749$1,164,8276.4%$70,077$1,168,371$38,749$1,129,622$1,098,294TownshipBangor
3.1%$6,937$229,528$0$229,5282.9%$6,172$222,591$0$222,591$216,419TownshipBeaver
3.1%$8,565$283,390$0$283,3902.9%$7,621$274,825$0$274,825$267,204TownshipFrankenlust
3.1%$7,676$253,953$0$253,9532.9%$6,830$246,277$0$246,277$239,447TownshipFraser
3.1%$4,191$138,671$0$138,6712.9%$3,728$134,480$0$134,480$130,752TownshipGarfield
3.1%$2,909$96,266$0$96,2662.9%$2,590$93,357$0$93,357$90,767TownshipGibson
3.0%$23,209$793,451$25,545$767,9066.4%$46,198$770,242$25,545$744,697$724,044TownshipHampton
3.1%$11,657$385,703$0$385,7032.9%$10,374$374,046$0$374,046$363,672TownshipKawkawlin
3.1%$3,464$114,644$0$114,6442.9%$3,083$111,180$0$111,180$108,097TownshipMerritt
3.0%$25,812$882,479$28,411$854,0686.4%$51,381$856,667$28,411$828,256$805,286TownshipMonitor
3.1%$3,347$110,746$0$110,7462.9%$2,978$107,399$0$107,399$104,421TownshipMt Forest
3.1%$5,845$193,408$0$193,4082.9%$5,200$187,563$0$187,563$182,363TownshipPinconning
3.1%$7,949$263,022$0$263,0222.9%$7,075$255,073$0$255,073$247,998TownshipPortsmouth
3.1%$11,474$379,656$0$379,6562.9%$10,209$368,182$0$368,182$357,973TownshipWilliams
2.7%$5,019$188,924$22,884$166,0402.9%$5,143$183,905$22,884$161,021$178,762CityAuburn
2.0%$83,783$4,322,388$1,550,225$2,772,1632.9%$120,484$4,238,605$1,550,225$2,688,380$4,118,121CityBay City
2.5%$8,363$344,482$67,775$276,7072.9%$9,452$336,119$67,775$268,344$326,667CityEssexville
See the city of Midland in Midland CountySee the city of Midland in Midland CountyCityMidland
2.4%$3,142$132,185$28,202$103,9832.9%$3,633$129,043$28,202$100,841$125,410CityPinconning
Benzie County
3.1%$8,120$268,671$0$268,6712.9%$7,226$260,551$0$260,551$253,325TownshipAlmira
3.1%$4,539$150,207$0$150,2072.9%$4,041$145,668$0$145,668$141,627TownshipBenzonia
3.1%$1,325$43,837$0$43,8372.8%$1,177$42,512$0$42,512$41,335TownshipBlaine
3.1%$1,210$40,018$0$40,0182.8%$1,075$38,808$0$38,808$37,733TownshipColfax
3.1%$2,301$76,138$0$76,1382.9%$2,048$73,837$0$73,837$71,789TownshipCrystal Lake
3.1%$1,080$35,722$0$35,7222.9%$961$34,642$0$34,642$33,681TownshipGilmore
3.1%$4,878$161,425$0$161,4252.9%$4,342$156,547$0$156,547$152,205TownshipHomestead
3.1%$4,977$164,687$0$164,6872.9%$4,429$159,710$0$159,710$155,281TownshipInland
3.1%$1,921$63,567$0$63,5672.9%$1,709$61,646$0$61,646$59,937TownshipJoyfield
3.1%$1,825$60,385$0$60,3852.9%$1,623$58,560$0$58,560$56,937TownshipLake
3.1%$851$28,163$0$28,1632.9%$757$27,312$0$27,312$26,555TownshipPlatte
3.1%$613$20,287$0$20,2872.9%$546$19,674$0$19,674$19,128TownshipWeldon
2.7%$3,092$119,064$16,751$102,3132.9%$3,249$115,972$16,751$99,221$112,723CityFrankfort
2.8%$1,195$43,713$4,173$39,54010.1%$3,887$42,518$4,173$38,345$38,631VillageBenzonia
3.1%$762$25,220$0$25,2202.9%$678$24,458$0$24,458$23,780VillageBeulah
2.2%$895$41,260$11,664$29,5962.9%$1,143$40,365$11,664$28,701$39,222VillageElberta
3.1%$789$26,095$0$26,0952.8%$701$25,306$0$25,306$24,605VillageHonor
3.1%$644$21,321$0$21,3212.8%$572$20,677$0$20,677$20,105VillageLake Ann
2.6%$1,060$41,984$6,899$35,08523.7%$7,843$40,924$6,899$34,025$33,081VillageThompsonville
06/03/15 Prepared by The House Fiscal Agency Page 5

Revenue Sharing Payments to Cities, Villages, and TownshipsFinal FY 2013-14, Estimated FY 2014-15, and Estimated FY 2015-16 Based on SB 133 (S-1) CR-1
FY 2015-16FY 2014-15FY 2013-14
Change from FY 2014-15TotalEligibleEstimatedChange from FY 2013-14TotalEligibleEstimatedTotal
CombinedCVTConstitutionalCombinedCVTConstitutionalCombinedLocal Unit
PercentDollarPaymentPaymentPaymentPercentDollarPaymentPaymentPaymentPaymentTypeLocal Unit Name
Berrien County
3.1%$6,852$226,743$0$226,7432.9%$6,100$219,891$0$219,891$213,791TownshipBainbridge
3.1%$4,636$153,390$0$153,3902.9%$4,127$148,754$0$148,754$144,627TownshipBaroda
2.7%$35,464$1,343,232$169,813$1,173,4192.9%$36,591$1,307,768$169,813$1,137,955$1,271,177TownshipBenton
3.1%$11,167$369,473$0$369,4732.9%$9,935$358,306$0$358,306$348,371TownshipBerrien
3.1%$6,388$211,388$0$211,3882.9%$5,684$205,000$0$205,000$199,316TownshipBertrand
3.1%$8,471$280,287$0$280,2872.9%$7,538$271,816$0$271,816$264,278TownshipBuchanan
3.1%$7,454$246,633$0$246,6332.9%$6,633$239,179$0$239,179$232,546TownshipChikaming
3.1%$12,071$399,387$0$399,3872.9%$10,741$387,316$0$387,316$376,575TownshipColoma
3.1%$2,172$71,842$0$71,8422.9%$1,932$69,670$0$69,670$67,738TownshipGalien
3.1%$8,827$292,062$0$292,0622.9%$7,855$283,235$0$283,235$275,380TownshipHagar
3.1%$7,147$236,450$0$236,4502.9%$6,359$229,303$0$229,303$222,944TownshipLake
3.0%$32,579$1,113,807$35,859$1,077,9486.4%$64,851$1,081,228$35,859$1,045,369$1,016,377TownshipLincoln
3.1%$4,646$153,708$0$153,7082.9%$4,132$149,062$0$149,062$144,930TownshipNew Buffalo
3.0%$34,058$1,164,363$37,486$1,126,8776.4%$67,793$1,130,305$37,486$1,092,819$1,062,512TownshipNiles
3.1%$17,786$588,499$0$588,4992.9%$15,827$570,713$0$570,713$554,886TownshipOronoko
3.1%$5,105$168,904$0$168,9042.9%$4,542$163,799$0$163,799$159,257TownshipPipestone
3.1%$11,460$379,179$0$379,1792.9%$10,198$367,719$0$367,719$357,521TownshipRoyalton
3.0%$22,040$753,499$24,259$729,2406.4%$43,872$731,459$24,259$707,200$687,587TownshipSt Joseph
3.1%$4,646$153,708$0$153,7082.9%$4,132$149,062$0$149,062$144,930TownshipSodus
3.1%$2,289$75,740$0$75,7402.9%$2,037$73,451$0$73,451$71,414TownshipThree Oaks
3.1%$7,458$246,792$0$246,7922.9%$6,637$239,334$0$239,334$232,697TownshipWatervliet
3.1%$4,655$154,026$0$154,0262.9%$4,142$149,371$0$149,371$145,229TownshipWeesaw
1.5%$24,136$1,678,603$879,988$798,6153.0%$47,549$1,654,467$879,988$774,479$1,606,918CityBenton Harbor
2.8%$5,509$203,247$20,977$182,2702.9%$5,523$197,738$20,977$176,761$192,215CityBridgman
2.0%$10,715$554,185$199,669$354,5162.9%$15,450$543,470$199,669$343,801$528,020CityBuchanan
2.3%$3,566$158,299$40,313$117,9862.9%$4,367$154,733$40,313$114,420$150,366CityColoma
2.9%$4,528$159,905$10,095$149,8102.9%$4,329$155,377$10,095$145,282$151,048CityNew Buffalo
2.2%$27,892$1,301,139$378,252$922,8872.9%$36,025$1,273,247$378,252$894,995$1,237,222CityNiles
2.3%$19,621$879,472$230,269$649,2032.9%$24,283$859,851$230,269$629,582$835,568CitySt Joseph
2.1%$4,172$205,185$67,150$138,0352.9%$5,703$201,013$67,150$133,863$195,310CityWatervliet
2.7%$2,099$79,964$10,509$69,4552.9%$2,179$77,865$10,509$67,356$75,686VillageBaroda
2.6%$4,328$167,773$24,567$143,2062.9%$4,581$163,445$24,567$138,878$158,864VillageBerrien Springs
2.3%$1,503$68,234$18,510$49,7242.9%$1,885$66,731$18,510$48,221$64,846VillageEau Claire
2.7%$1,321$49,838$6,160$43,6782.9%$1,358$48,517$6,160$42,357$47,159VillageGalien
3.1%$654$21,640$0$21,6402.9%$582$20,986$0$20,986$20,404VillageGrand Beach
3.1%$437$14,479$0$14,4792.9%$390$14,042$0$14,042$13,652VillageMichiana
3.1%$2,073$68,580$0$68,5802.9%$1,843$66,507$0$66,507$64,664VillageShoreham
3.0%$2,746$95,290$4,434$90,8562.9%$2,575$92,544$4,434$88,110$89,969VillageStevensville
2.4%$3,900$163,751$34,706$129,0452.9%$4,497$159,851$34,706$125,145$155,354VillageThree Oaks
06/03/15 Prepared by The House Fiscal Agency Page 6

Revenue Sharing Payments to Cities, Villages, and TownshipsFinal FY 2013-14, Estimated FY 2014-15, and Estimated FY 2015-16 Based on SB 133 (S-1) CR-1
FY 2015-16FY 2014-15FY 2013-14
Change from FY 2014-15TotalEligibleEstimatedChange from FY 2013-14TotalEligibleEstimatedTotal
CombinedCVTConstitutionalCombinedCVTConstitutionalCombinedLocal Unit
PercentDollarPaymentPaymentPaymentPercentDollarPaymentPaymentPaymentPaymentTypeLocal Unit Name
Branch County
3.1%$4,746$157,049$0$157,0492.9%$4,224$152,303$0$152,303$148,079TownshipAlgansee
3.1%$3,219$106,529$0$106,5292.9%$2,864$103,310$0$103,310$100,446TownshipBatavia
3.1%$3,448$114,087$0$114,0872.9%$3,068$110,639$0$110,639$107,571TownshipBethel
3.1%$3,244$107,325$0$107,3252.9%$2,885$104,081$0$104,081$101,196TownshipBronson
3.1%$3,527$116,713$0$116,7132.9%$3,139$113,186$0$113,186$110,047TownshipButler
3.1%$2,501$82,741$0$82,7412.9%$2,224$80,240$0$80,240$78,016TownshipCalifornia
3.1%$11,388$376,792$0$376,7922.9%$10,132$365,404$0$365,404$355,272TownshipColdwater
3.1%$1,589$52,588$0$52,5882.9%$1,414$50,999$0$50,999$49,585TownshipGilead
3.1%$4,280$141,615$0$141,6152.9%$3,808$137,335$0$137,335$133,527TownshipGirard
3.1%$3,600$119,100$0$119,1002.9%$3,202$115,500$0$115,500$112,298TownshipKinderhook
3.1%$2,929$96,903$0$96,9032.9%$2,606$93,974$0$93,974$91,368TownshipMatteson
3.1%$1,250$41,370$0$41,3702.9%$1,113$40,120$0$40,120$39,007TownshipNoble
3.1%$5,593$185,054$0$185,0542.9%$4,976$179,461$0$179,461$174,485TownshipOvid
3.1%$6,331$209,479$0$209,4792.9%$5,634$203,148$0$203,148$197,514TownshipQuincy
3.1%$4,292$142,013$0$142,0132.9%$3,818$137,721$0$137,721$133,903TownshipSherwood
3.1%$3,148$104,143$0$104,1432.9%$2,801$100,995$0$100,995$98,194TownshipUnion
2.1%$5,648$273,604$86,720$186,8842.9%$7,595$267,956$86,720$181,236$260,361CityBronson
2.7%$26,318$985,180$114,404$870,7762.9%$26,807$958,862$114,404$844,458$932,055CityColdwater
2.1%$3,972$190,140$58,709$131,4312.9%$5,277$186,168$58,709$127,459$180,891VillageQuincy
2.7%$743$28,779$4,196$24,5832.9%$786$28,036$4,196$23,840$27,250VillageSherwood
2.3%$3,845$172,860$45,645$127,2152.9%$4,773$169,015$45,645$123,370$164,242VillageUnion City
06/03/15 Prepared by The House Fiscal Agency Page 7
Revenue Sharing Payments to Cities, Villages, and TownshipsFinal FY 2013-14, Estimated FY 2014-15, and Estimated FY 2015-16 Based on SB 133 (S-1) CR-1
FY 2015-16FY 2014-15FY 2013-14
Change from FY 2014-15TotalEligibleEstimatedChange from FY 2013-14TotalEligibleEstimatedTotal
CombinedCVTConstitutionalCombinedCVTConstitutionalCombinedLocal Unit
PercentDollarPaymentPaymentPaymentPercentDollarPaymentPaymentPaymentPaymentTypeLocal Unit Name
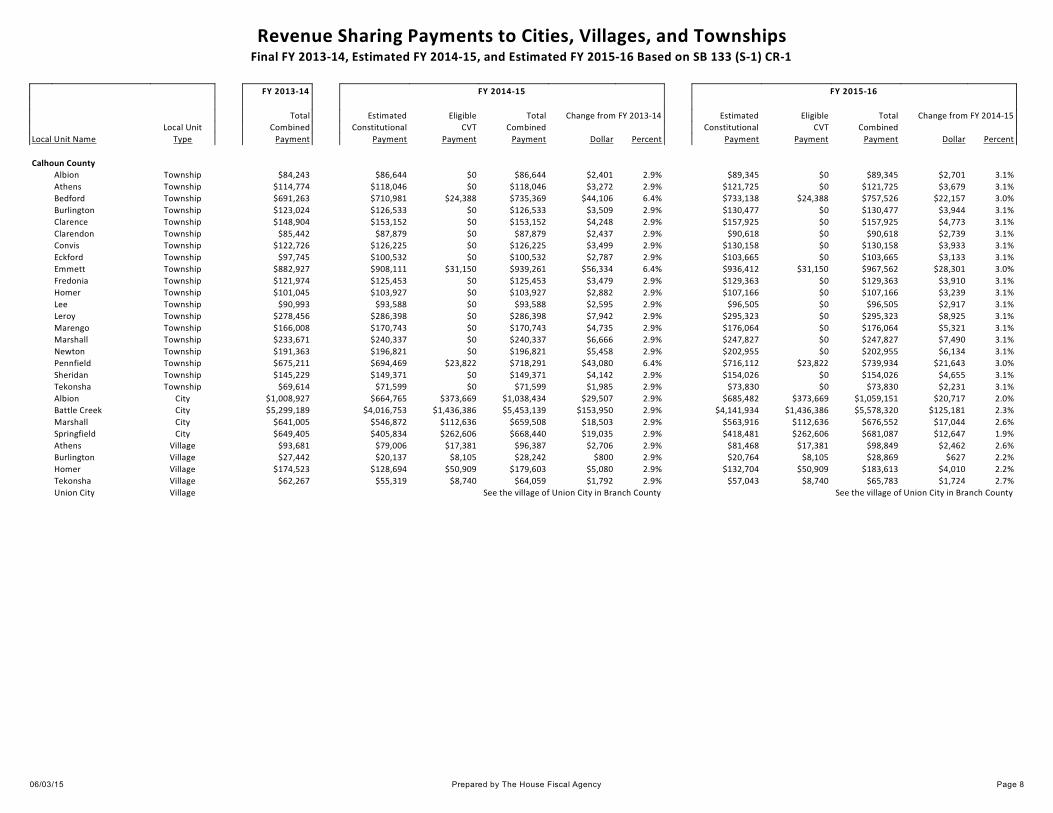
Calhoun County
3.1%$2,701$89,345$0$89,3452.9%$2,401$86,644$0$86,644$84,243TownshipAlbion
3.1%$3,679$121,725$0$121,7252.9%$3,272$118,046$0$118,046$114,774TownshipAthens
3.0%$22,157$757,526$24,388$733,1386.4%$44,106$735,369$24,388$710,981$691,263TownshipBedford
3.1%$3,944$130,477$0$130,4772.9%$3,509$126,533$0$126,533$123,024TownshipBurlington
3.1%$4,773$157,925$0$157,9252.9%$4,248$153,152$0$153,152$148,904TownshipClarence
3.1%$2,739$90,618$0$90,6182.9%$2,437$87,879$0$87,879$85,442TownshipClarendon
3.1%$3,933$130,158$0$130,1582.9%$3,499$126,225$0$126,225$122,726TownshipConvis
3.1%$3,133$103,665$0$103,6652.9%$2,787$100,532$0$100,532$97,745TownshipEckford
3.0%$28,301$967,562$31,150$936,4126.4%$56,334$939,261$31,150$908,111$882,927TownshipEmmett
3.1%$3,910$129,363$0$129,3632.9%$3,479$125,453$0$125,453$121,974TownshipFredonia
3.1%$3,239$107,166$0$107,1662.9%$2,882$103,927$0$103,927$101,045TownshipHomer
3.1%$2,917$96,505$0$96,5052.9%$2,595$93,588$0$93,588$90,993TownshipLee
3.1%$8,925$295,323$0$295,3232.9%$7,942$286,398$0$286,398$278,456TownshipLeroy
3.1%$5,321$176,064$0$176,0642.9%$4,735$170,743$0$170,743$166,008TownshipMarengo
3.1%$7,490$247,827$0$247,8272.9%$6,666$240,337$0$240,337$233,671TownshipMarshall
3.1%$6,134$202,955$0$202,9552.9%$5,458$196,821$0$196,821$191,363TownshipNewton
3.0%$21,643$739,934$23,822$716,1126.4%$43,080$718,291$23,822$694,469$675,211TownshipPennfield
3.1%$4,655$154,026$0$154,0262.9%$4,142$149,371$0$149,371$145,229TownshipSheridan
3.1%$2,231$73,830$0$73,8302.9%$1,985$71,599$0$71,599$69,614TownshipTekonsha
2.0%$20,717$1,059,151$373,669$685,4822.9%$29,507$1,038,434$373,669$664,765$1,008,927CityAlbion
2.3%$125,181$5,578,320$1,436,386$4,141,9342.9%$153,950$5,453,139$1,436,386$4,016,753$5,299,189CityBattle Creek
2.6%$17,044$676,552$112,636$563,9162.9%$18,503$659,508$112,636$546,872$641,005CityMarshall
1.9%$12,647$681,087$262,606$418,4812.9%$19,035$668,440$262,606$405,834$649,405CitySpringfield
2.6%$2,462$98,849$17,381$81,4682.9%$2,706$96,387$17,381$79,006$93,681VillageAthens
2.2%$627$28,869$8,105$20,7642.9%$800$28,242$8,105$20,137$27,442VillageBurlington
2.2%$4,010$183,613$50,909$132,7042.9%$5,080$179,603$50,909$128,694$174,523VillageHomer
2.7%$1,724$65,783$8,740$57,0432.9%$1,792$64,059$8,740$55,319$62,267VillageTekonsha
See the village of Union City in Branch CountySee the village of Union City in Branch CountyVillageUnion City
06/03/15 Prepared by The House Fiscal Agency Page 8

Revenue Sharing Payments to Cities, Villages, and TownshipsFinal FY 2013-14, Estimated FY 2014-15, and Estimated FY 2015-16 Based on SB 133 (S-1) CR-1
FY 2015-16FY 2014-15FY 2013-14
Change from FY 2014-15TotalEligibleEstimatedChange from FY 2013-14TotalEligibleEstimatedTotal
CombinedCVTConstitutionalCombinedCVTConstitutionalCombinedLocal Unit
PercentDollarPaymentPaymentPaymentPercentDollarPaymentPaymentPaymentPaymentTypeLocal Unit Name
Cass County
3.1%$4,898$162,062$0$162,0622.9%$4,359$157,164$0$157,164$152,805TownshipCalvin
3.1%$14,925$493,824$0$493,8242.9%$13,281$478,899$0$478,899$465,618TownshipHoward
3.1%$6,110$202,160$0$202,1602.9%$5,436$196,050$0$196,050$190,614TownshipJefferson
3.1%$4,150$137,319$0$137,3192.9%$3,692$133,169$0$133,169$129,477TownshipLagrange
3.1%$3,224$106,688$0$106,6882.9%$2,870$103,464$0$103,464$100,594TownshipMarcellus
3.1%$7,082$234,302$0$234,3022.9%$6,301$227,220$0$227,220$220,919TownshipMason
3.1%$9,324$308,530$0$308,5302.9%$8,298$299,206$0$299,206$290,908TownshipMilton
3.1%$3,924$129,840$0$129,8402.9%$3,491$125,916$0$125,916$122,425TownshipNewberg
3.1%$12,720$420,868$0$420,8682.9%$11,318$408,148$0$408,148$396,830TownshipOntwa
3.1%$3,542$117,190$0$117,1902.9%$3,151$113,648$0$113,648$110,497TownshipPenn
3.1%$4,878$161,425$0$161,4252.9%$4,342$156,547$0$156,547$152,205TownshipPokagon
3.1%$9,133$302,166$0$302,1662.9%$8,126$293,033$0$293,033$284,907TownshipPorter
3.1%$7,737$256,021$0$256,0212.9%$6,886$248,284$0$248,284$241,398TownshipSilver Creek
3.1%$2,673$88,469$0$88,4692.9%$2,379$85,796$0$85,796$83,417TownshipVolinia
3.1%$6,382$211,150$0$211,1502.9%$5,679$204,768$0$204,768$199,089TownshipWayne
2.1%$14,136$674,235$206,507$467,7282.9%$18,698$660,099$206,507$453,592$641,401CityDowagiac
See the city of Niles in Berrien CountySee the city of Niles in Berrien CountyCityNiles
2.3%$4,129$187,588$50,985$136,6032.9%$5,185$183,459$50,985$132,474$178,274VillageCassopolis
2.6%$3,028$118,229$18,064$100,1652.9%$3,228$115,201$18,064$97,137$111,973VillageEdwardsburg
2.3%$2,880$129,264$33,953$95,3112.9%$3,570$126,384$33,953$92,431$122,814VillageMarcellus
2.1%$724$35,619$11,672$23,9472.9%$990$34,895$11,672$23,223$33,905VillageVandalia
Charlevoix County
3.1%$2,698$89,265$0$89,2652.9%$2,399$86,567$0$86,567$84,168TownshipBay
3.1%$2,166$71,682$0$71,6822.9%$1,928$69,516$0$69,516$67,588TownshipBoyne Valley
3.1%$596$19,730$0$19,7302.9%$532$19,134$0$19,134$18,602TownshipChandler
3.1%$3,955$130,874$0$130,8742.9%$3,520$126,919$0$126,919$123,399TownshipCharlevoix
3.1%$1,712$56,646$0$56,6462.9%$1,523$54,934$0$54,934$53,411TownshipEvangeline
3.1%$3,568$118,065$0$118,0652.9%$3,176$114,497$0$114,497$111,321TownshipEveline
3.1%$4,615$152,674$0$152,6742.9%$4,105$148,059$0$148,059$143,954TownshipHayes
3.1%$1,662$54,975$0$54,9752.9%$1,478$53,313$0$53,313$51,835TownshipHudson
3.1%$4,121$136,364$0$136,3642.9%$3,666$132,243$0$132,243$128,577TownshipMarion
3.1%$3,373$111,621$0$111,6212.9%$3,002$108,248$0$108,248$105,246TownshipMelrose
3.1%$1,739$57,521$0$57,5212.9%$1,546$55,782$0$55,782$54,236TownshipNorwood
3.1%$702$23,231$0$23,2312.9%$625$22,529$0$22,529$21,904TownshipPeaine
3.1%$878$29,039$0$29,0392.9%$781$28,161$0$28,161$27,380TownshipSt James
3.1%$4,504$149,014$0$149,0142.9%$4,006$144,510$0$144,510$140,504TownshipSouth Arm
3.1%$4,723$156,254$0$156,2542.9%$4,200$151,531$0$151,531$147,331TownshipWilson
2.6%$8,980$353,462$56,309$297,1532.9%$9,662$344,482$56,309$288,173$334,820CityBoyne City
2.8%$5,982$218,330$20,387$197,9432.9%$5,929$212,348$20,387$191,961$206,419CityCharlevoix
2.4%$5,653$240,801$53,758$187,0432.9%$6,624$235,148$53,758$181,390$228,524CityEast Jordan
2.5%$707$28,999$5,609$23,3906.4%$1,703$28,292$5,609$22,683$26,589VillageBoyne Falls
06/03/15 Prepared by The House Fiscal Agency Page 9
Revenue Sharing Payments to Cities, Villages, and TownshipsFinal FY 2013-14, Estimated FY 2014-15, and Estimated FY 2015-16 Based on SB 133 (S-1) CR-1
FY 2015-16FY 2014-15FY 2013-14
Change from FY 2014-15TotalEligibleEstimatedChange from FY 2013-14TotalEligibleEstimatedTotal
CombinedCVTConstitutionalCombinedCVTConstitutionalCombinedLocal Unit
PercentDollarPaymentPaymentPaymentPercentDollarPaymentPaymentPaymentPaymentTypeLocal Unit Name
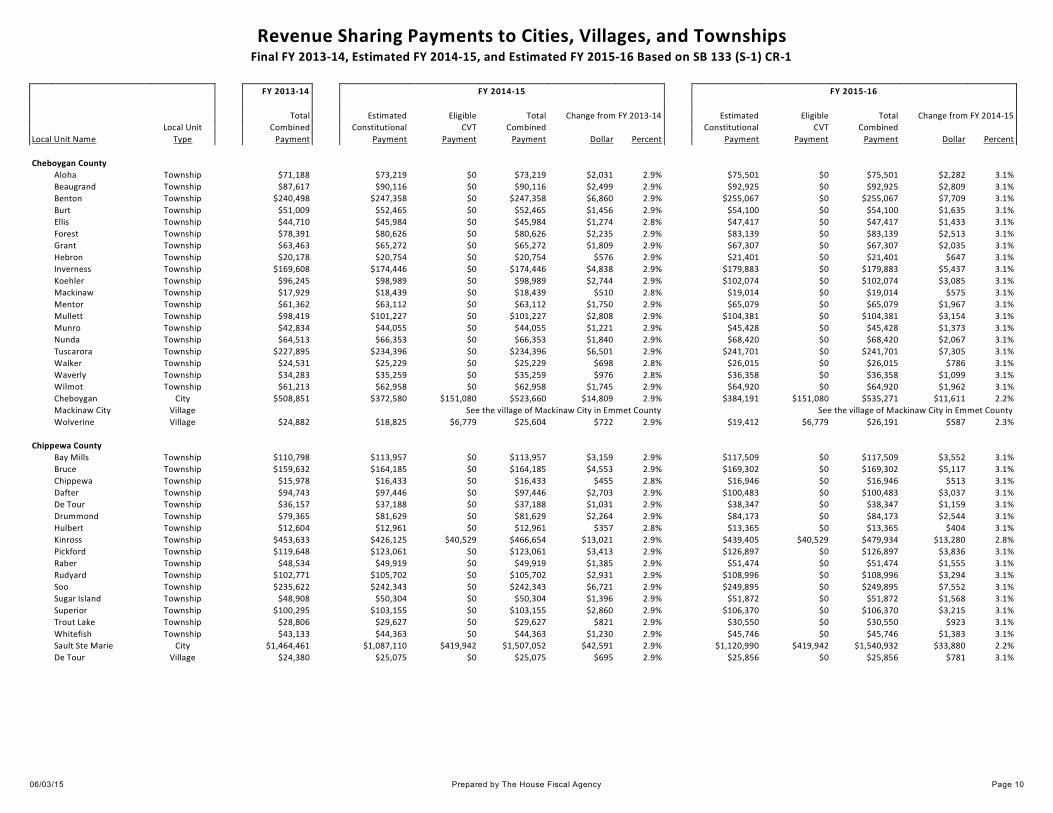
Cheboygan County
3.1%$2,282$75,501$0$75,5012.9%$2,031$73,219$0$73,219$71,188TownshipAloha
3.1%$2,809$92,925$0$92,9252.9%$2,499$90,116$0$90,116$87,617TownshipBeaugrand
3.1%$7,709$255,067$0$255,0672.9%$6,860$247,358$0$247,358$240,498TownshipBenton
3.1%$1,635$54,100$0$54,1002.9%$1,456$52,465$0$52,465$51,009TownshipBurt
3.1%$1,433$47,417$0$47,4172.8%$1,274$45,984$0$45,984$44,710TownshipEllis
3.1%$2,513$83,139$0$83,1392.9%$2,235$80,626$0$80,626$78,391TownshipForest
3.1%$2,035$67,307$0$67,3072.9%$1,809$65,272$0$65,272$63,463TownshipGrant
3.1%$647$21,401$0$21,4012.9%$576$20,754$0$20,754$20,178TownshipHebron
3.1%$5,437$179,883$0$179,8832.9%$4,838$174,446$0$174,446$169,608TownshipInverness
3.1%$3,085$102,074$0$102,0742.9%$2,744$98,989$0$98,989$96,245TownshipKoehler
3.1%$575$19,014$0$19,0142.8%$510$18,439$0$18,439$17,929TownshipMackinaw
3.1%$1,967$65,079$0$65,0792.9%$1,750$63,112$0$63,112$61,362TownshipMentor
3.1%$3,154$104,381$0$104,3812.9%$2,808$101,227$0$101,227$98,419TownshipMullett
3.1%$1,373$45,428$0$45,4282.9%$1,221$44,055$0$44,055$42,834TownshipMunro
3.1%$2,067$68,420$0$68,4202.9%$1,840$66,353$0$66,353$64,513TownshipNunda
3.1%$7,305$241,701$0$241,7012.9%$6,501$234,396$0$234,396$227,895TownshipTuscarora
3.1%$786$26,015$0$26,0152.8%$698$25,229$0$25,229$24,531TownshipWalker
3.1%$1,099$36,358$0$36,3582.8%$976$35,259$0$35,259$34,283TownshipWaverly
3.1%$1,962$64,920$0$64,9202.9%$1,745$62,958$0$62,958$61,213TownshipWilmot
2.2%$11,611$535,271$151,080$384,1912.9%$14,809$523,660$151,080$372,580$508,851CityCheboygan
See the village of Mackinaw City in Emmet CountySee the village of Mackinaw City in Emmet CountyVillageMackinaw City
2.3%$587$26,191$6,779$19,4122.9%$722$25,604$6,779$18,825$24,882VillageWolverine
Chippewa County
3.1%$3,552$117,509$0$117,5092.9%$3,159$113,957$0$113,957$110,798TownshipBay Mills
3.1%$5,117$169,302$0$169,3022.9%$4,553$164,185$0$164,185$159,632TownshipBruce
3.1%$513$16,946$0$16,9462.8%$455$16,433$0$16,433$15,978TownshipChippewa
3.1%$3,037$100,483$0$100,4832.9%$2,703$97,446$0$97,446$94,743TownshipDafter
3.1%$1,159$38,347$0$38,3472.9%$1,031$37,188$0$37,188$36,157TownshipDe Tour
3.1%$2,544$84,173$0$84,1732.9%$2,264$81,629$0$81,629$79,365TownshipDrummond
3.1%$404$13,365$0$13,3652.8%$357$12,961$0$12,961$12,604TownshipHulbert
2.8%$13,280$479,934$40,529$439,4052.9%$13,021$466,654$40,529$426,125$453,633TownshipKinross
3.1%$3,836$126,897$0$126,8972.9%$3,413$123,061$0$123,061$119,648TownshipPickford
3.1%$1,555$51,474$0$51,4742.9%$1,385$49,919$0$49,919$48,534TownshipRaber
3.1%$3,294$108,996$0$108,9962.9%$2,931$105,702$0$105,702$102,771TownshipRudyard
3.1%$7,552$249,895$0$249,8952.9%$6,721$242,343$0$242,343$235,622TownshipSoo
3.1%$1,568$51,872$0$51,8722.9%$1,396$50,304$0$50,304$48,908TownshipSugar Island
3.1%$3,215$106,370$0$106,3702.9%$2,860$103,155$0$103,155$100,295TownshipSuperior
3.1%$923$30,550$0$30,5502.9%$821$29,627$0$29,627$28,806TownshipTrout Lake
3.1%$1,383$45,746$0$45,7462.9%$1,230$44,363$0$44,363$43,133TownshipWhitefish
2.2%$33,880$1,540,932$419,942$1,120,9902.9%$42,591$1,507,052$419,942$1,087,110$1,464,461CitySault Ste Marie
3.1%$781$25,856$0$25,8562.9%$695$25,075$0$25,075$24,380VillageDe Tour
06/03/15 Prepared by The House Fiscal Agency Page 10

Revenue Sharing Payments to Cities, Villages, and TownshipsFinal FY 2013-14, Estimated FY 2014-15, and Estimated FY 2015-16 Based on SB 133 (S-1) CR-1
FY 2015-16FY 2014-15FY 2013-14
Change from FY 2014-15TotalEligibleEstimatedChange from FY 2013-14TotalEligibleEstimatedTotal
CombinedCVTConstitutionalCombinedCVTConstitutionalCombinedLocal Unit
PercentDollarPaymentPaymentPaymentPercentDollarPaymentPaymentPaymentPaymentTypeLocal Unit Name
Clare County
3.1%$1,555$51,474$0$51,4742.9%$1,385$49,919$0$49,919$48,534TownshipArthur
3.1%$1,984$65,636$0$65,6362.9%$1,765$63,652$0$63,652$61,887TownshipFranklin
3.1%$2,782$92,050$0$92,0502.9%$2,476$89,268$0$89,268$86,792TownshipFreeman
3.1%$2,517$83,298$0$83,2982.9%$2,241$80,781$0$80,781$78,540TownshipFrost
3.1%$4,525$149,730$0$149,7302.9%$4,027$145,205$0$145,205$141,178TownshipGarfield
3.1%$7,836$259,283$0$259,2832.9%$6,973$251,447$0$251,447$244,474TownshipGrant
3.1%$2,503$82,821$0$82,8212.9%$2,228$80,318$0$80,318$78,090TownshipGreenwood
3.1%$4,397$145,513$0$145,5132.9%$3,914$141,116$0$141,116$137,202TownshipHamilton
3.1%$2,243$74,228$0$74,2282.9%$1,997$71,985$0$71,985$69,988TownshipHatton
3.1%$11,241$371,939$0$371,9392.9%$10,002$360,698$0$360,698$350,696TownshipHayes
3.1%$4,386$145,116$0$145,1162.9%$3,903$140,730$0$140,730$136,827TownshipLincoln
3.1%$1,265$41,848$0$41,8482.9%$1,125$40,583$0$40,583$39,458TownshipRedding
3.1%$3,787$125,305$0$125,3052.9%$3,369$121,518$0$121,518$118,149TownshipSheridan
3.1%$1,097$36,279$0$36,2792.9%$975$35,182$0$35,182$34,207TownshipSummerfield
3.1%$6,576$217,594$0$217,5942.9%$5,853$211,018$0$211,018$205,165TownshipSurrey
3.1%$1,103$36,517$0$36,5172.9%$982$35,414$0$35,414$34,432TownshipWinterfield
2.4%$7,497$319,015$70,950$248,0652.9%$8,772$311,518$70,950$240,568$302,746CityClare
2.7%$4,946$187,026$23,373$163,6532.9%$5,094$182,080$23,373$158,707$176,986CityHarrison
2.7%$2,095$80,718$11,422$69,2962.9%$2,203$78,623$11,422$67,201$76,420VillageFarwell
Clinton County
3.0%$27,888$953,423$30,695$922,7286.4%$55,511$925,535$30,695$894,840$870,024TownshipBath
3.1%$2,857$94,516$0$94,5162.9%$2,540$91,659$0$91,659$89,119TownshipBengal
3.1%$6,874$227,459$0$227,4592.9%$6,116$220,585$0$220,585$214,469TownshipBingham
3.1%$2,792$92,368$0$92,3682.9%$2,484$89,576$0$89,576$87,092TownshipDallas
3.0%$34,435$1,177,270$37,902$1,139,3686.4%$68,545$1,142,835$37,902$1,104,933$1,074,290TownshipDewitt
3.1%$3,359$111,144$0$111,1442.9%$2,990$107,785$0$107,785$104,795TownshipDuplain
3.1%$6,127$202,717$0$202,7172.9%$5,451$196,590$0$196,590$191,139TownshipEagle
3.1%$2,977$98,494$0$98,4942.9%$2,648$95,517$0$95,517$92,869TownshipEssex
3.1%$5,287$174,950$0$174,9502.9%$4,704$169,663$0$169,663$164,959TownshipGreenbush
3.1%$1,349$44,632$0$44,6322.8%$1,199$43,283$0$43,283$42,084TownshipLebanon
3.1%$5,953$196,988$0$196,9882.9%$5,297$191,035$0$191,035$185,738TownshipOlive
3.1%$5,285$174,871$0$174,8712.9%$4,703$169,586$0$169,586$164,883TownshipOvid
3.1%$4,866$161,027$0$161,0272.9%$4,331$156,161$0$156,161$151,830TownshipRiley
3.1%$8,320$275,275$0$275,2752.9%$7,403$266,955$0$266,955$259,552TownshipVictor
3.1%$11,628$384,748$0$384,7482.9%$10,347$373,120$0$373,120$362,773TownshipWatertown
3.1%$3,467$114,724$0$114,7242.9%$3,085$111,257$0$111,257$108,172TownshipWestphalia
3.0%$10,837$378,137$19,564$358,5732.9%$10,223$367,300$19,564$347,736$357,077CityDewitt
See the city of East Lansing in Ingham CountySee the city of East Lansing in Ingham CountyCityEast Lansing
See the city of Grand Ledge in Eaton CountySee the city of Grand Ledge in Eaton CountyCityGrand Ledge
2.7%$18,700$721,637$102,905$618,7322.9%$19,690$702,937$102,905$600,032$683,247CitySt Johns
3.1%$295$9,785$0$9,7852.9%$263$9,490$0$9,490$9,227VillageEagle
2.4%$2,323$98,760$21,906$76,8542.9%$2,719$96,437$21,906$74,531$93,718VillageElsie
3.0%$2,905$99,905$3,798$96,1072.9%$2,698$97,000$3,798$93,202$94,302VillageFowler
See the village of Hubbardston in Ionia CountySee the village of Hubbardston in Ionia CountyVillageHubbardston
2.5%$1,616$65,518$12,055$53,4632.9%$1,795$63,902$12,055$51,847$62,107VillageMaple Rapids
2.6%$3,854$151,253$23,720$127,5332.9%$4,133$147,399$23,720$123,679$143,266VillageOvid
3.1%$2,220$73,433$0$73,4332.9%$1,974$71,213$0$71,213$69,239VillageWestphalia
06/03/15 Prepared by The House Fiscal Agency Page 11

Revenue Sharing Payments to Cities, Villages, and TownshipsFinal FY 2013-14, Estimated FY 2014-15, and Estimated FY 2015-16 Based on SB 133 (S-1) CR-1
FY 2015-16FY 2014-15FY 2013-14
Change from FY 2014-15TotalEligibleEstimatedChange from FY 2013-14TotalEligibleEstimatedTotal
CombinedCVTConstitutionalCombinedCVTConstitutionalCombinedLocal Unit
PercentDollarPaymentPaymentPaymentPercentDollarPaymentPaymentPaymentPaymentTypeLocal Unit Name
Crawford County
3.1%$4,174$138,114$0$138,1142.9%$3,714$133,940$0$133,940$130,226TownshipBeaver Creek
3.1%$3,224$106,688$0$106,6882.9%$2,870$103,464$0$103,464$100,594TownshipFrederic
3.1%$14,011$463,591$0$463,5912.9%$12,469$449,580$0$449,580$437,111TownshipGrayling
3.1%$1,506$49,804$0$49,8042.9%$1,339$48,298$0$48,298$46,959TownshipLovells
3.1%$1,570$51,952$0$51,9522.9%$1,397$50,382$0$50,382$48,985TownshipMaple Forest
3.1%$4,826$159,675$0$159,6752.9%$4,294$154,849$0$154,849$150,555TownshipSouth Branch
2.3%$4,485$200,848$52,470$148,3782.9%$5,543$196,363$52,470$143,893$190,820CityGrayling
Delta County
3.1%$1,825$60,385$0$60,3852.9%$1,623$58,560$0$58,560$56,937TownshipBaldwin
3.1%$3,794$125,544$0$125,5442.9%$3,377$121,750$0$121,750$118,373TownshipBark River
3.1%$733$24,265$0$24,2652.9%$654$23,532$0$23,532$22,878TownshipBay De Noc
3.1%$2,525$83,537$0$83,5372.9%$2,246$81,012$0$81,012$78,766TownshipBrampton
3.1%$1,426$47,178$0$47,1782.9%$1,269$45,752$0$45,752$44,483TownshipCornell
3.1%$1,799$59,510$0$59,5102.9%$1,600$57,711$0$57,711$56,111TownshipEnsign
3.1%$8,373$277,025$0$277,0252.9%$7,450$268,652$0$268,652$261,202TownshipEscanaba
3.1%$676$22,356$0$22,3562.9%$602$21,680$0$21,680$21,078TownshipFairbanks
3.1%$4,939$163,414$0$163,4142.9%$4,393$158,475$0$158,475$154,082TownshipFord River
3.1%$1,272$42,086$0$42,0862.9%$1,131$40,814$0$40,814$39,683TownshipGarden
3.1%$1,842$60,942$0$60,9422.8%$1,637$59,100$0$59,100$57,463TownshipMaple Ridge
3.1%$4,169$137,955$0$137,9552.9%$3,710$133,786$0$133,786$130,076TownshipMasonville
3.1%$1,190$39,381$0$39,3812.8%$1,058$38,191$0$38,191$37,133TownshipNahma
3.1%$11,747$388,647$0$388,6472.9%$10,452$376,900$0$376,900$366,448TownshipWells
2.3%$30,191$1,340,083$341,137$998,9462.9%$36,976$1,309,892$341,137$968,755$1,272,916CityEscanaba
2.4%$11,958$507,814$112,166$395,6482.9%$13,964$495,856$112,166$383,690$481,892CityGladstone
3.1%$531$17,582$0$17,5822.8%$472$17,051$0$17,051$16,579VillageGarden
Dickinson County
3.1%$1,200$39,700$0$39,7002.9%$1,068$38,500$0$38,500$37,432TownshipBreen
3.1%$14,074$465,660$0$465,6602.9%$12,522$451,586$0$451,586$439,064TownshipBreitung
3.1%$1,808$59,828$0$59,8282.9%$1,609$58,020$0$58,020$56,411TownshipFelch
3.1%$3,580$118,463$0$118,4632.9%$3,185$114,883$0$114,883$111,698TownshipNorway
3.1%$2,659$87,992$0$87,9922.9%$2,366$85,333$0$85,333$82,967TownshipSagola
3.1%$1,933$63,965$0$63,9652.9%$1,719$62,032$0$62,032$60,313TownshipWaucedah
3.1%$152$5,012$0$5,0122.8%$133$4,860$0$4,860$4,727TownshipWest Branch
2.4%$18,193$776,639$174,694$601,9452.9%$21,364$758,446$174,694$583,752$737,082CityIron Mountain
2.3%$12,342$540,484$132,107$408,3772.9%$14,897$528,142$132,107$396,035$513,245CityKingsford
2.4%$6,841$286,868$60,522$226,3462.9%$7,881$280,027$60,522$219,505$272,146CityNorway
06/03/15 Prepared by The House Fiscal Agency Page 12

Revenue Sharing Payments to Cities, Villages, and TownshipsFinal FY 2013-14, Estimated FY 2014-15, and Estimated FY 2015-16 Based on SB 133 (S-1) CR-1
FY 2015-16FY 2014-15FY 2013-14
Change from FY 2014-15TotalEligibleEstimatedChange from FY 2013-14TotalEligibleEstimatedTotal
CombinedCVTConstitutionalCombinedCVTConstitutionalCombinedLocal Unit
PercentDollarPaymentPaymentPaymentPercentDollarPaymentPaymentPaymentPaymentTypeLocal Unit Name
Eaton County
3.1%$4,491$148,616$0$148,6162.9%$3,997$144,125$0$144,125$140,128TownshipBellevue
3.1%$6,723$222,447$0$222,4472.9%$5,982$215,724$0$215,724$209,742TownshipBenton
3.1%$3,696$122,282$0$122,2822.9%$3,288$118,586$0$118,586$115,298TownshipBrookfield
3.1%$6,865$227,141$0$227,1412.9%$6,108$220,276$0$220,276$214,168TownshipCarmel
3.1%$4,201$138,990$0$138,9902.9%$3,738$134,789$0$134,789$131,051TownshipChester
3.0%$77,925$2,664,127$85,771$2,578,3566.4%$155,116$2,586,202$85,771$2,500,431$2,431,086TownshipDelta Charter
3.1%$9,793$324,044$0$324,0442.9%$8,714$314,251$0$314,251$305,537TownshipEaton
3.1%$9,890$327,227$0$327,2272.9%$8,800$317,337$0$317,337$308,537TownshipEaton Rapids
3.1%$8,038$265,966$0$265,9662.9%$7,153$257,928$0$257,928$250,775TownshipHamlin
3.1%$4,429$146,548$0$146,5482.9%$3,941$142,119$0$142,119$138,178TownshipKalamo
3.1%$9,293$307,496$0$307,4962.9%$8,271$298,203$0$298,203$289,932TownshipOneida
3.1%$3,114$103,029$0$103,0292.9%$2,770$99,915$0$99,915$97,145TownshipRoxand
3.1%$3,412$112,894$0$112,8942.9%$3,035$109,482$0$109,482$106,447TownshipSunfield
3.1%$3,111$102,949$0$102,9492.9%$2,768$99,838$0$99,838$97,070TownshipVermontville
3.1%$5,449$180,281$0$180,2812.9%$4,847$174,832$0$174,832$169,985TownshipWalton
3.1%$13,475$445,850$0$445,8502.9%$11,990$432,375$0$432,375$420,385TownshipWindsor
2.6%$21,571$863,391$149,665$713,7262.9%$23,629$841,820$149,665$692,155$818,191CityCharlotte
2.8%$12,538$457,565$42,743$414,8222.9%$12,424$445,027$42,743$402,284$432,603CityEaton Rapids
2.7%$18,722$717,376$97,928$619,4482.9%$19,561$698,654$97,928$600,726$679,093CityGrand Ledge
See the city of Lansing in Ingham CountySee the city of Lansing in Ingham CountyCityLansing
2.3%$3,859$172,278$44,586$127,6922.9%$4,756$168,419$44,586$123,833$163,663CityOlivet
2.6%$6,292$244,009$35,803$208,2062.9%$6,663$237,717$35,803$201,914$231,054CityPotterville
2.4%$3,082$131,892$29,898$101,9942.9%$3,631$128,810$29,898$98,912$125,179VillageBellevue
3.1%$2,968$98,176$0$98,1762.9%$2,640$95,208$0$95,208$92,568VillageDimondale
3.1%$1,330$43,996$0$43,9962.9%$1,183$42,666$0$42,666$41,483VillageMulliken
2.7%$1,390$53,011$7,026$45,9852.9%$1,445$51,621$7,026$44,595$50,176VillageSunfield
2.4%$1,825$78,348$17,963$60,3852.9%$2,156$76,523$17,963$58,560$74,367VillageVermontville
06/03/15 Prepared by The House Fiscal Agency Page 13

Revenue Sharing Payments to Cities, Villages, and TownshipsFinal FY 2013-14, Estimated FY 2014-15, and Estimated FY 2015-16 Based on SB 133 (S-1) CR-1
FY 2015-16FY 2014-15FY 2013-14
Change from FY 2014-15TotalEligibleEstimatedChange from FY 2013-14TotalEligibleEstimatedTotal
CombinedCVTConstitutionalCombinedCVTConstitutionalCombinedLocal Unit
PercentDollarPaymentPaymentPaymentPercentDollarPaymentPaymentPaymentPaymentTypeLocal Unit Name
Emmet County
3.1%$14,911$493,347$0$493,3472.9%$13,268$478,436$0$478,436$465,168TownshipBear Creek
3.1%$1,491$49,326$0$49,3262.9%$1,326$47,835$0$47,835$46,509TownshipBliss
3.1%$1,825$60,385$0$60,3852.9%$1,623$58,560$0$58,560$56,937TownshipCarp Lake
3.1%$1,366$45,189$0$45,1892.8%$1,214$43,823$0$43,823$42,609TownshipCenter
3.1%$676$22,356$0$22,3562.9%$602$21,680$0$21,680$21,078TownshipCross Village
3.1%$2,138$70,728$0$70,7282.9%$1,902$68,590$0$68,590$66,688TownshipFriendship
3.1%$5,386$178,212$0$178,2122.9%$4,791$172,826$0$172,826$168,035TownshipLittlefield
3.1%$5,723$189,351$0$189,3512.9%$5,092$183,628$0$183,628$178,536TownshipLittle Traverse
3.1%$2,763$91,413$0$91,4132.9%$2,457$88,650$0$88,650$86,193TownshipMaple River
3.1%$1,620$53,622$0$53,6222.9%$1,441$52,002$0$52,002$50,561TownshipMc Kinley
3.1%$1,979$65,477$0$65,4772.8%$1,759$63,498$0$63,498$61,739TownshipPleasantview
3.1%$1,397$46,223$0$46,2232.9%$1,244$44,826$0$44,826$43,582TownshipReadmond
3.1%$6,485$214,571$0$214,5712.9%$5,770$208,086$0$208,086$202,316TownshipResort
3.1%$5,148$170,336$0$170,3362.9%$4,581$165,188$0$165,188$160,607TownshipSpringvale
3.1%$373$12,331$0$12,3312.8%$330$11,958$0$11,958$11,628TownshipWawatam
3.1%$3,862$127,772$0$127,7722.9%$3,437$123,910$0$123,910$120,473TownshipWest Traverse
3.1%$2,871$94,993$0$94,9932.9%$2,554$92,122$0$92,122$89,568CityHarbor Springs
2.8%$13,542$504,262$56,185$448,0772.9%$13,718$490,720$56,185$434,535$477,002CityPetoskey
2.8%$1,774$64,672$5,958$58,7142.9%$1,756$62,898$5,958$56,940$61,142VillageAlanson
2.7%$1,938$73,826$9,702$64,1242.9%$2,012$71,888$9,702$62,186$69,876VillageMackinaw City
2.4%$1,976$84,367$18,970$65,3972.9%$2,320$82,391$18,970$63,421$80,071VillagePellston
06/03/15 Prepared by The House Fiscal Agency Page 14

Revenue Sharing Payments to Cities, Villages, and TownshipsFinal FY 2013-14, Estimated FY 2014-15, and Estimated FY 2015-16 Based on SB 133 (S-1) CR-1
FY 2015-16FY 2014-15FY 2013-14
Change from FY 2014-15TotalEligibleEstimatedChange from FY 2013-14TotalEligibleEstimatedTotal
CombinedCVTConstitutionalCombinedCVTConstitutionalCombinedLocal Unit
PercentDollarPaymentPaymentPaymentPercentDollarPaymentPaymentPaymentPaymentTypeLocal Unit Name
Genesee County
3.1%$16,623$549,993$0$549,9932.9%$14,790$533,370$0$533,370$518,580TownshipArgentine
3.1%$14,746$487,936$0$487,9362.9%$13,123$473,190$0$473,190$460,067TownshipAtlas
3.1%$18,031$596,614$0$596,6142.9%$16,046$578,583$0$578,583$562,537TownshipClayton
3.0%$47,068$1,609,179$51,807$1,557,3726.4%$93,692$1,562,111$51,807$1,510,304$1,468,419TownshipDavison
3.0%$37,395$1,278,465$41,160$1,237,3056.4%$74,436$1,241,070$41,160$1,199,910$1,166,634TownshipFenton
3.0%$76,773$2,624,750$84,503$2,540,2476.4%$152,823$2,547,977$84,503$2,463,474$2,395,154TownshipFlint
3.0%$25,584$874,670$28,160$846,5106.4%$50,927$849,086$28,160$820,926$798,159TownshipFlushing
3.1%$9,062$299,858$0$299,8582.9%$8,065$290,796$0$290,796$282,731TownshipForest
3.1%$15,485$512,361$0$512,3612.9%$13,779$496,876$0$496,876$483,097TownshipGaines
2.7%$51,892$1,954,777$237,809$1,716,9682.9%$53,224$1,902,885$237,809$1,665,076$1,849,661TownshipGenesee
3.0%$90,188$3,083,376$99,268$2,984,1086.4%$179,526$2,993,188$99,268$2,893,920$2,813,662TownshipGrand Blanc
3.1%$14,965$495,176$0$495,1762.9%$13,318$480,211$0$480,211$466,893TownshipMontrose
2.6%$51,699$2,050,342$339,739$1,710,6032.9%$56,073$1,998,643$339,739$1,658,904$1,942,570TownshipMt Morris
3.0%$36,264$1,239,828$39,916$1,199,9126.4%$72,188$1,203,564$39,916$1,163,648$1,131,376TownshipMundy
3.0%$20,991$717,657$23,105$694,5526.4%$41,785$696,666$23,105$673,561$654,881TownshipRichfield
3.1%$16,950$560,813$0$560,8132.9%$15,083$543,863$0$543,863$528,780TownshipThetford
3.0%$31,872$1,089,639$35,081$1,054,5586.4%$63,443$1,057,767$35,081$1,022,686$994,324TownshipVienna
2.9%$72,133$2,583,670$196,972$2,386,6982.9%$70,026$2,511,537$196,972$2,314,565$2,441,511CityBurton
2.4%$6,362$273,737$63,224$210,5132.9%$7,535$267,375$63,224$204,151$259,840CityClio
2.4%$12,439$533,545$121,985$411,5602.9%$14,683$521,106$121,985$399,121$506,423CityDavison
3.0%$28,267$974,491$39,193$935,2982.9%$26,318$946,224$39,193$907,031$919,906CityFenton
1.7%$245,529$14,802,446$6,678,491$8,123,9552.9%$416,344$14,556,917$6,678,491$7,878,426$14,140,573CityFlint
2.9%$20,171$727,775$60,353$667,4222.9%$19,742$707,604$60,353$647,251$687,862CityFlushing
2.9%$19,900$702,716$44,284$658,4322.9%$19,020$682,816$44,284$638,532$663,796CityGrand Blanc
2.3%$3,984$176,790$44,961$131,8292.9%$4,877$172,806$44,961$127,845$167,929CityMontrose
2.2%$7,420$351,039$105,520$245,5192.9%$9,729$343,619$105,520$238,099$333,890CityMt Morris
2.8%$13,845$505,403$47,301$458,1022.9%$13,721$491,558$47,301$444,257$477,837CitySwartz Creek
3.0%$9,597$332,112$14,591$317,5212.9%$8,974$322,515$14,591$307,924$313,541CityLinden
2.5%$914$37,736$7,504$30,2322.9%$1,035$36,822$7,504$29,318$35,787VillageGaines
3.1%$4,473$147,980$0$147,9802.9%$3,979$143,507$0$143,507$139,528VillageGoodrich
See the village of Lennon in Shiawassee CountySee the village of Lennon in Shiawassee CountyVillageLennon
2.5%$2,078$86,000$17,261$68,7392.9%$2,361$83,922$17,261$66,661$81,561VillageOtisville
See the village of Otter Lake in Lapeer CountySee the village of Otter Lake in Lapeer CountyVillageOtter Lake
06/03/15 Prepared by The House Fiscal Agency Page 15

Revenue Sharing Payments to Cities, Villages, and TownshipsFinal FY 2013-14, Estimated FY 2014-15, and Estimated FY 2015-16 Based on SB 133 (S-1) CR-1
FY 2015-16FY 2014-15FY 2013-14
Change from FY 2014-15TotalEligibleEstimatedChange from FY 2013-14TotalEligibleEstimatedTotal
CombinedCVTConstitutionalCombinedCVTConstitutionalCombinedLocal Unit
PercentDollarPaymentPaymentPaymentPercentDollarPaymentPaymentPaymentPaymentTypeLocal Unit Name
Gladwin County
3.1%$4,723$156,254$0$156,2542.9%$4,200$151,531$0$151,531$147,331TownshipBeaverton
3.1%$2,030$67,148$0$67,1482.9%$1,806$65,118$0$65,118$63,312TownshipBentley
3.1%$5,810$192,215$0$192,2152.9%$5,170$186,405$0$186,405$181,235TownshipBillings
3.1%$1,108$36,676$0$36,6762.9%$986$35,568$0$35,568$34,582TownshipBourret
3.1%$3,145$104,063$0$104,0632.9%$2,799$100,918$0$100,918$98,119TownshipBuckeye
3.1%$4,806$159,038$0$159,0382.9%$4,277$154,232$0$154,232$149,955TownshipButman
3.1%$2,166$71,682$0$71,6822.9%$1,928$69,516$0$69,516$67,588TownshipClement
3.1%$2,684$88,788$0$88,7882.9%$2,387$86,104$0$86,104$83,717TownshipGladwin
3.1%$327$10,820$0$10,8202.9%$291$10,493$0$10,493$10,202TownshipGrim
3.1%$4,723$156,254$0$156,2542.9%$4,200$151,531$0$151,531$147,331TownshipGrout
3.1%$3,275$108,359$0$108,3592.9%$2,914$105,084$0$105,084$102,170TownshipHay
3.1%$5,908$195,477$0$195,4772.9%$5,257$189,569$0$189,569$184,312TownshipSage
3.1%$2,767$91,572$0$91,5722.9%$2,463$88,805$0$88,805$86,342TownshipSecord
3.1%$2,508$82,980$0$82,9802.9%$2,232$80,472$0$80,472$78,240TownshipSherman
3.1%$6,170$204,149$0$204,1492.9%$5,490$197,979$0$197,979$192,489TownshipTobacco
2.2%$2,575$121,798$36,591$85,2072.9%$3,377$119,223$36,591$82,632$115,846CityBeaverton
2.4%$6,973$303,656$72,935$230,7212.9%$8,366$296,683$72,935$223,748$288,317CityGladwin
Gogebic County
2.9%$2,828$98,732$5,171$93,5612.9%$2,669$95,904$5,171$90,733$93,235TownshipBessemer
3.1%$784$25,936$0$25,9362.9%$698$25,152$0$25,152$24,454TownshipErwin
3.1%$5,609$185,611$0$185,6112.9%$4,992$180,002$0$180,002$175,010TownshipIronwood
3.1%$2,761$91,334$0$91,3342.9%$2,455$88,573$0$88,573$86,118TownshipMarenisco
3.1%$733$24,265$0$24,2652.9%$654$23,532$0$23,532$22,878TownshipWakefield
3.1%$3,407$112,735$0$112,7352.9%$3,030$109,328$0$109,328$106,298TownshipWatersmeet
2.1%$4,554$221,640$70,955$150,6852.9%$6,154$217,086$70,955$146,131$210,932CityBessemer
1.9%$12,953$708,853$280,268$428,5852.9%$19,829$695,900$280,268$415,632$676,071CityIronwood
2.0%$4,451$229,117$81,853$147,2642.9%$6,385$224,666$81,853$142,813$218,281CityWakefield
Grand Traverse County
3.1%$10,519$348,071$0$348,0712.9%$9,362$337,552$0$337,552$328,190TownshipAcme
3.0%$19,739$674,828$21,726$653,1026.4%$39,292$655,089$21,726$633,363$615,797TownshipBlair
3.0%$25,639$876,561$28,221$848,3406.4%$51,037$850,922$28,221$822,701$799,885TownshipEast Bay
3.1%$4,049$133,977$0$133,9772.9%$3,604$129,928$0$129,928$126,324TownshipFife Lake
3.0%$39,088$1,336,338$43,023$1,293,3156.4%$77,806$1,297,250$43,023$1,254,227$1,219,444TownshipGarfield
3.1%$2,564$84,810$0$84,8102.8%$2,279$82,246$0$82,246$79,967TownshipGrant
3.1%$13,907$460,170$0$460,1702.9%$12,376$446,263$0$446,263$433,887TownshipGreen Lake
3.0%$20,828$712,067$22,925$689,1426.4%$41,459$691,239$22,925$668,314$649,780TownshipLong Lake
3.1%$3,727$123,316$0$123,3162.9%$3,316$119,589$0$119,589$116,273TownshipMayfield
3.1%$7,774$257,215$0$257,2152.9%$6,918$249,441$0$249,441$242,523TownshipParadise
3.1%$13,064$432,245$0$432,2452.9%$11,626$419,181$0$419,181$407,555TownshipPeninsula
3.1%$974$32,221$0$32,2212.8%$865$31,247$0$31,247$30,382TownshipUnion
3.1%$6,245$206,615$0$206,6152.9%$5,556$200,370$0$200,370$194,814TownshipWhitewater
2.7%$35,094$1,328,525$167,358$1,161,1672.9%$36,189$1,293,431$167,358$1,126,073$1,257,242CityTraverse City
2.8%$1,065$38,962$3,718$35,2444.6%$1,661$37,897$3,718$34,179$36,236VillageFife Lake
2.8%$3,558$131,201$13,454$117,7472.9%$3,566$127,643$13,454$114,189$124,077VillageKingsley
06/03/15 Prepared by The House Fiscal Agency Page 16

Revenue Sharing Payments to Cities, Villages, and TownshipsFinal FY 2013-14, Estimated FY 2014-15, and Estimated FY 2015-16 Based on SB 133 (S-1) CR-1
FY 2015-16FY 2014-15FY 2013-14
Change from FY 2014-15TotalEligibleEstimatedChange from FY 2013-14TotalEligibleEstimatedTotal
CombinedCVTConstitutionalCombinedCVTConstitutionalCombinedLocal Unit
PercentDollarPaymentPaymentPaymentPercentDollarPaymentPaymentPaymentPaymentTypeLocal Unit Name
Gratiot County
3.1%$4,042$133,739$0$133,7392.9%$3,596$129,697$0$129,697$126,101TownshipArcada
3.1%$4,912$162,539$0$162,5392.9%$4,372$157,627$0$157,627$153,255TownshipBethany
3.1%$2,003$66,272$0$66,2722.9%$1,781$64,269$0$64,269$62,488TownshipElba
3.1%$2,289$75,740$0$75,7402.9%$2,037$73,451$0$73,451$71,414TownshipEmerson
3.1%$5,085$168,267$0$168,2672.9%$4,525$163,182$0$163,182$158,657TownshipFulton
3.1%$1,119$36,995$0$36,9952.8%$994$35,876$0$35,876$34,882TownshipHamilton
3.1%$1,421$47,019$0$47,0192.9%$1,265$45,598$0$45,598$44,333TownshipLafayette
3.1%$2,628$86,958$0$86,9582.9%$2,340$84,330$0$84,330$81,990TownshipNewark
3.1%$2,414$79,877$0$79,8772.9%$2,148$77,463$0$77,463$75,315TownshipNew Haven
3.1%$1,599$52,906$0$52,9062.9%$1,422$51,307$0$51,307$49,885TownshipNorth Shade
3.1%$2,135$70,648$0$70,6482.9%$1,901$68,513$0$68,513$66,612TownshipNorth Star
3.1%$5,480$181,315$0$181,3152.9%$4,877$175,835$0$175,835$170,958TownshipPine River
3.1%$5,225$172,882$0$172,8822.9%$4,650$167,657$0$167,657$163,007TownshipSeville
3.1%$4,641$153,549$0$153,5492.9%$4,129$148,908$0$148,908$144,779TownshipSumner
3.1%$2,092$69,216$0$69,2162.9%$1,861$67,124$0$67,124$65,263TownshipWashington
3.1%$3,506$115,997$0$115,9972.9%$3,119$112,491$0$112,491$109,372TownshipWheeler
2.2%$22,561$1,044,435$297,931$746,5042.9%$28,906$1,021,874$297,931$723,943$992,968CityAlma
2.3%$6,928$313,186$83,976$229,2102.9%$8,653$306,258$83,976$222,282$297,605CityIthaca
2.4%$12,035$514,120$115,926$398,1942.9%$14,143$502,085$115,926$386,159$487,942CitySt Louis
2.5%$1,353$55,216$10,425$44,7912.9%$1,514$53,863$10,425$43,438$52,349VillageAshley
2.3%$3,193$141,362$35,708$105,6542.9%$3,898$138,169$35,708$102,461$134,271VillageBreckenridge
2.6%$977$38,299$5,998$32,3012.9%$1,045$37,322$5,998$31,324$36,277VillagePerrinton
06/03/15 Prepared by The House Fiscal Agency Page 17

Revenue Sharing Payments to Cities, Villages, and TownshipsFinal FY 2013-14, Estimated FY 2014-15, and Estimated FY 2015-16 Based on SB 133 (S-1) CR-1
FY 2015-16FY 2014-15FY 2013-14
Change from FY 2014-15TotalEligibleEstimatedChange from FY 2013-14TotalEligibleEstimatedTotal
CombinedCVTConstitutionalCombinedCVTConstitutionalCombinedLocal Unit
PercentDollarPaymentPaymentPaymentPercentDollarPaymentPaymentPaymentPaymentTypeLocal Unit Name
Hillsdale County
3.1%$4,848$160,391$0$160,3912.9%$4,312$155,543$0$155,543$151,231TownshipAdams
3.1%$3,525$116,633$0$116,6332.9%$3,136$113,108$0$113,108$109,972TownshipAllen
3.1%$2,821$93,323$0$93,3232.9%$2,509$90,502$0$90,502$87,993TownshipAmboy
3.1%$6,090$201,523$0$201,5232.9%$5,419$195,433$0$195,433$190,014TownshipCambria
3.1%$2,869$94,914$0$94,9142.9%$2,552$92,045$0$92,045$89,493TownshipCamden
3.1%$2,568$84,969$0$84,9692.9%$2,286$82,401$0$82,401$80,115TownshipFayette
3.1%$4,888$161,743$0$161,7432.9%$4,350$156,855$0$156,855$152,505TownshipHillsdale
3.1%$7,365$243,690$0$243,6902.9%$6,553$236,325$0$236,325$229,772TownshipJefferson
3.1%$2,411$79,797$0$79,7972.9%$2,146$77,386$0$77,386$75,240TownshipLitchfield
3.1%$3,535$116,952$0$116,9522.9%$3,145$113,417$0$113,417$110,272TownshipMoscow
3.1%$3,854$127,533$0$127,5332.9%$3,429$123,679$0$123,679$120,250TownshipPittsford
3.1%$2,241$74,149$0$74,1492.9%$1,994$71,908$0$71,908$69,914TownshipRansom
3.1%$4,244$140,422$0$140,4222.9%$3,777$136,178$0$136,178$132,401TownshipReading
3.1%$4,530$149,889$0$149,8892.9%$4,031$145,359$0$145,359$141,328TownshipScipio
3.1%$11,116$367,802$0$367,8022.9%$9,891$356,686$0$356,686$346,795TownshipSomerset
3.1%$3,248$107,484$0$107,4842.9%$2,891$104,236$0$104,236$101,345TownshipWheatland
3.1%$3,186$105,416$0$105,4162.9%$2,835$102,230$0$102,230$99,395TownshipWoodbridge
3.1%$2,686$88,867$0$88,8672.9%$2,389$86,181$0$86,181$83,792TownshipWright
2.4%$19,892$863,706$205,513$658,1932.9%$23,791$843,814$205,513$638,301$820,023CityHillsdale
2.6%$5,429$214,379$34,735$179,6442.9%$5,861$208,950$34,735$174,215$203,089VillageJonesville
2.7%$3,292$125,101$16,185$108,9167.6%$8,645$121,809$16,185$105,624$113,164CityLitchfield
2.3%$2,592$113,357$27,593$85,7642.9%$3,123$110,765$27,593$83,172$107,642CityReading
3.1%$459$15,195$0$15,1952.8%$408$14,736$0$14,736$14,328VillageAllen
2.4%$1,231$52,615$11,881$40,7342.9%$1,447$51,384$11,881$39,503$49,937VillageCamden
2.4%$823$34,654$7,445$27,2096.8%$2,156$33,831$7,445$26,386$31,675VillageMontgomery
2.6%$1,147$45,550$7,601$37,9495.9%$2,476$44,403$7,601$36,802$41,927VillageNorth Adams
2.4%$1,293$55,893$13,091$42,8022.9%$1,540$54,600$13,091$41,509$53,060VillageWaldron
06/03/15 Prepared by The House Fiscal Agency Page 18

Revenue Sharing Payments to Cities, Villages, and TownshipsFinal FY 2013-14, Estimated FY 2014-15, and Estimated FY 2015-16 Based on SB 133 (S-1) CR-1
FY 2015-16FY 2014-15FY 2013-14
Change from FY 2014-15TotalEligibleEstimatedChange from FY 2013-14TotalEligibleEstimatedTotal
CombinedCVTConstitutionalCombinedCVTConstitutionalCombinedLocal Unit
PercentDollarPaymentPaymentPaymentPercentDollarPaymentPaymentPaymentPaymentTypeLocal Unit Name
Houghton County
3.1%$4,365$144,400$0$144,4002.9%$3,883$140,035$0$140,035$136,152TownshipAdams
3.1%$8,647$286,095$0$286,0952.9%$7,694$277,448$0$277,448$269,754TownshipCalumet
3.1%$4,357$144,161$0$144,1612.9%$3,877$139,804$0$139,804$135,927TownshipChassell
3.1%$567$18,775$0$18,7752.9%$505$18,208$0$18,208$17,703TownshipDuncan
3.1%$425$14,081$0$14,0812.9%$379$13,656$0$13,656$13,277TownshipElm River
3.1%$3,525$116,633$0$116,6332.9%$3,136$113,108$0$113,108$109,972TownshipFranklin
3.1%$1,108$36,676$0$36,6762.9%$986$35,568$0$35,568$34,582TownshipHancock
3.1%$1,335$44,155$0$44,1552.9%$1,187$42,820$0$42,820$41,633TownshipLaird
3.1%$4,539$150,207$0$150,2072.9%$4,041$145,668$0$145,668$141,627TownshipOsceola
3.1%$7,745$256,260$0$256,2602.9%$6,892$248,515$0$248,515$241,623TownshipPortage
3.1%$650$21,481$0$21,4812.9%$578$20,831$0$20,831$20,253TownshipQuincy
3.1%$2,005$66,352$0$66,3522.9%$1,784$64,347$0$64,347$62,563TownshipSchoolcraft
3.1%$3,412$112,894$0$112,8942.9%$3,035$109,482$0$109,482$106,447TownshipStanton
3.1%$4,516$149,412$0$149,4122.9%$4,019$144,896$0$144,896$140,877TownshipTorch Lake
2.5%$11,142$461,211$92,534$368,6772.9%$12,658$450,069$92,534$357,535$437,411CityHancock
2.4%$18,500$802,903$190,775$612,1282.9%$22,117$784,403$190,775$593,628$762,286CityHoughton
1.8%$1,746$99,878$42,118$57,7602.9%$2,802$98,132$42,118$56,014$95,330VillageCalumet
2.4%$457$19,879$4,763$15,1162.9%$549$19,422$4,763$14,659$18,873VillageCopper City
2.2%$2,422$114,141$34,025$80,1162.9%$3,164$111,719$34,025$77,694$108,555VillageLake Linden
1.9%$4,754$250,069$92,781$157,2882.9%$6,977$245,315$92,781$152,534$238,338VillageLaurium
2.3%$1,822$80,407$20,102$60,3052.9%$2,218$78,585$20,102$58,483$76,367VillageSouth Range
06/03/15 Prepared by The House Fiscal Agency Page 19

Revenue Sharing Payments to Cities, Villages, and TownshipsFinal FY 2013-14, Estimated FY 2014-15, and Estimated FY 2015-16 Based on SB 133 (S-1) CR-1
FY 2015-16FY 2014-15FY 2013-14
Change from FY 2014-15TotalEligibleEstimatedChange from FY 2013-14TotalEligibleEstimatedTotal
CombinedCVTConstitutionalCombinedCVTConstitutionalCombinedLocal Unit
PercentDollarPaymentPaymentPaymentPercentDollarPaymentPaymentPaymentPaymentTypeLocal Unit Name
Huron County
3.1%$2,046$67,704$0$67,7042.9%$1,820$65,658$0$65,658$63,838TownshipBingham
3.1%$1,094$36,199$0$36,1992.9%$973$35,105$0$35,105$34,132TownshipBloomfield
3.1%$1,248$41,291$0$41,2912.9%$1,110$40,043$0$40,043$38,933TownshipBrookfield
3.1%$4,311$142,649$0$142,6492.9%$3,836$138,338$0$138,338$134,502TownshipCaseville
3.1%$1,134$37,551$0$37,5512.9%$1,010$36,417$0$36,417$35,407TownshipChandler
3.1%$4,530$149,889$0$149,8892.9%$4,031$145,359$0$145,359$141,328TownshipColfax
3.1%$1,087$35,960$0$35,9602.8%$966$34,873$0$34,873$33,907TownshipDwight
3.1%$2,662$88,072$0$88,0722.9%$2,369$85,410$0$85,410$83,041TownshipFair Haven
3.1%$346$11,456$0$11,4562.8%$307$11,110$0$11,110$10,803TownshipGore
3.1%$2,195$72,637$0$72,6372.9%$1,954$70,442$0$70,442$68,488TownshipGrant
3.1%$1,801$59,589$0$59,5892.8%$1,601$57,788$0$57,788$56,187TownshipHume
3.1%$1,051$34,767$0$34,7672.8%$934$33,716$0$33,716$32,782TownshipHuron
3.1%$2,056$68,023$0$68,0232.9%$1,829$65,967$0$65,967$64,138TownshipLake
3.1%$1,599$52,906$0$52,9062.9%$1,422$51,307$0$51,307$49,885TownshipLincoln
3.1%$1,070$35,403$0$35,4032.8%$950$34,333$0$34,333$33,383TownshipMckinley
3.1%$1,731$57,282$0$57,2822.9%$1,540$55,551$0$55,551$54,011TownshipMeade
3.1%$1,623$53,702$0$53,7022.9%$1,444$52,079$0$52,079$50,635TownshipOliver
3.1%$1,157$38,268$0$38,2682.9%$1,029$37,111$0$37,111$36,082TownshipParis
3.1%$24$795$0$7952.9%$22$771$0$771$749TownshipPte Aux Barques
3.1%$1,828$60,465$0$60,4652.9%$1,626$58,637$0$58,637$57,011TownshipPort Austin
3.1%$1,119$36,995$0$36,9952.8%$994$35,876$0$35,876$34,882TownshipRubicon
3.1%$2,936$97,141$0$97,1412.9%$2,611$94,205$0$94,205$91,594TownshipSand Beach
3.1%$2,320$76,774$0$76,7742.9%$2,065$74,454$0$74,454$72,389TownshipSebewaing
3.1%$1,712$56,646$0$56,6462.9%$1,523$54,934$0$54,934$53,411TownshipSheridan
3.1%$2,604$86,162$0$86,1622.9%$2,317$83,558$0$83,558$81,241TownshipSherman
3.1%$1,119$36,995$0$36,9952.8%$994$35,876$0$35,876$34,882TownshipSigel
3.1%$3,028$100,165$0$100,1652.9%$2,693$97,137$0$97,137$94,444TownshipVerona
3.1%$1,680$55,611$0$55,6112.9%$1,495$53,931$0$53,931$52,436TownshipWinsor
2.2%$7,458$339,687$92,895$246,7922.9%$9,391$332,229$92,895$239,334$322,838CityBad Axe
2.9%$1,868$66,355$4,538$61,8172.9%$1,799$64,487$4,538$59,949$62,688CityCaseville
2.3%$4,095$184,904$49,415$135,4892.9%$5,109$180,809$49,415$131,394$175,700CityHarbor Beach
2.3%$1,942$87,247$22,964$64,2832.9%$2,411$85,305$22,964$62,341$82,894VillageElkton
2.3%$1,077$47,784$12,142$35,6422.9%$1,319$46,707$12,142$34,565$45,388VillageKinde
2.0%$579$28,902$9,729$19,1732.9%$803$28,323$9,729$18,594$27,520VillageOwendale
2.6%$2,905$114,784$18,677$96,1072.9%$3,138$111,879$18,677$93,202$108,741VillagePigeon
3.1%$1,597$52,827$0$52,8272.9%$1,421$51,230$0$51,230$49,809VillagePort Austin
3.1%$642$21,242$0$21,2422.9%$571$20,600$0$20,600$20,029VillagePort Hope
2.2%$4,229$199,314$59,370$139,9442.9%$5,523$195,085$59,370$135,715$189,562VillageSebewaing
2.6%$2,063$81,677$13,416$68,2615.9%$4,404$79,614$13,416$66,198$75,210VillageUbly
06/03/15 Prepared by The House Fiscal Agency Page 20

Revenue Sharing Payments to Cities, Villages, and TownshipsFinal FY 2013-14, Estimated FY 2014-15, and Estimated FY 2015-16 Based on SB 133 (S-1) CR-1
FY 2015-16FY 2014-15FY 2013-14
Change from FY 2014-15TotalEligibleEstimatedChange from FY 2013-14TotalEligibleEstimatedTotal
CombinedCVTConstitutionalCombinedCVTConstitutionalCombinedLocal Unit
PercentDollarPaymentPaymentPaymentPercentDollarPaymentPaymentPaymentPaymentTypeLocal Unit Name
Ingham County
3.1%$6,959$230,244$0$230,2442.9%$6,191$223,285$0$223,285$217,094TownshipAlaiedon
3.1%$8,476$280,446$0$280,4462.9%$7,543$271,970$0$271,970$264,427TownshipAurelius
3.1%$5,096$168,586$0$168,5862.9%$4,534$163,490$0$163,490$158,956TownshipBunker Hill
3.0%$62,222$2,127,241$68,486$2,058,7554.0%$80,185$2,065,019$68,486$1,996,533$1,984,834TownshipDelhi
3.1%$4,542$150,287$0$150,2872.9%$4,042$145,745$0$145,745$141,703TownshipIngham
2.9%$19,539$696,903$50,405$646,4984.2%$27,032$677,364$50,405$626,959$650,332TownshipLansing
3.1%$5,429$179,644$0$179,6442.9%$4,831$174,215$0$174,215$169,384TownshipLeroy
3.1%$5,745$190,067$0$190,0672.9%$5,111$184,322$0$184,322$179,211TownshipLeslie
3.1%$4,306$142,490$0$142,4902.9%$3,831$138,184$0$138,184$134,353TownshipLocke
3.0%$95,430$3,262,586$105,038$3,157,5486.2%$185,733$3,167,156$105,038$3,062,118$2,981,423TownshipMeridian
3.1%$7,594$251,248$0$251,2482.9%$6,757$243,654$0$243,654$236,897TownshipOnondaga
3.1%$6,439$213,059$0$213,0592.9%$5,730$206,620$0$206,620$200,890TownshipStockbridge
3.1%$8,505$281,401$0$281,4012.9%$7,568$272,896$0$272,896$265,328TownshipVevay
3.1%$3,924$129,840$0$129,8402.9%$3,491$125,916$0$125,916$122,425TownshipWheatfield
3.1%$2,821$93,323$0$93,3232.9%$2,509$90,502$0$90,502$87,993TownshipWhite Oak
3.1%$11,970$396,046$0$396,0462.9%$10,653$384,076$0$384,076$373,423TownshipWilliamston
2.2%$116,809$5,326,306$1,461,397$3,864,9092.9%$147,240$5,209,497$1,461,397$3,748,100$5,062,257CityEast Lansing
2.0%$274,828$14,304,297$5,210,912$9,093,3852.9%$398,942$14,029,469$5,210,912$8,818,557$13,630,527CityLansing
2.1%$4,451$220,539$73,275$147,2642.9%$6,132$216,088$73,275$142,813$209,956CityLeslie
2.7%$19,030$711,500$81,868$629,6322.9%$19,359$692,470$81,868$610,602$673,111CityMason
2.8%$9,267$343,125$36,504$306,6212.9%$9,329$333,858$36,504$297,354$324,529CityWilliamston
3.1%$1,353$44,791$0$44,7912.9%$1,205$43,438$0$43,438$42,233VillageDansville
2.7%$2,929$109,681$12,778$96,9032.9%$2,985$106,752$12,778$93,974$103,767VillageStockbridge
2.6%$3,059$121,596$20,397$101,1995.9%$6,625$118,537$20,397$98,140$111,912VillageWebberville
06/03/15 Prepared by The House Fiscal Agency Page 21

Revenue Sharing Payments to Cities, Villages, and TownshipsFinal FY 2013-14, Estimated FY 2014-15, and Estimated FY 2015-16 Based on SB 133 (S-1) CR-1
FY 2015-16FY 2014-15FY 2013-14
Change from FY 2014-15TotalEligibleEstimatedChange from FY 2013-14TotalEligibleEstimatedTotal
CombinedCVTConstitutionalCombinedCVTConstitutionalCombinedLocal Unit
PercentDollarPaymentPaymentPaymentPercentDollarPaymentPaymentPaymentPaymentTypeLocal Unit Name
Ionia County
3.1%$5,088$168,347$0$168,3472.9%$4,528$163,259$0$163,259$158,731TownshipBerlin
3.1%$10,541$348,787$0$348,7872.9%$9,381$338,246$0$338,246$328,865TownshipBoston
3.1%$4,795$158,641$0$158,6412.9%$4,267$153,846$0$153,846$149,579TownshipCampbell
3.1%$7,185$237,723$0$237,7232.9%$6,394$230,538$0$230,538$224,144TownshipDanby
3.1%$7,411$245,201$0$245,2012.9%$6,595$237,790$0$237,790$231,195TownshipEaston
3.1%$8,959$296,437$0$296,4372.9%$7,972$287,478$0$287,478$279,506TownshipIonia
3.1%$4,403$145,673$0$145,6732.9%$3,918$141,270$0$141,270$137,352TownshipKeene
3.1%$3,982$131,750$0$131,7502.9%$3,544$127,768$0$127,768$124,224TownshipLyons
3.1%$2,231$73,830$0$73,8302.9%$1,985$71,599$0$71,599$69,614TownshipNorth Plains
3.1%$4,232$140,024$0$140,0242.9%$3,765$135,792$0$135,792$132,027TownshipOdessa
3.1%$2,373$78,524$0$78,5242.9%$2,112$76,151$0$76,151$74,039TownshipOrange
3.1%$6,596$218,231$0$218,2312.9%$5,869$211,635$0$211,635$205,766TownshipOrleans
3.1%$5,487$181,554$0$181,5542.9%$4,882$176,067$0$176,067$171,185TownshipOtisco
3.1%$8,185$270,819$0$270,8192.9%$7,283$262,634$0$262,634$255,351TownshipPortland
3.1%$4,494$148,696$0$148,6962.9%$4,000$144,202$0$144,202$140,202TownshipRonald
3.1%$2,815$93,163$0$93,1632.9%$2,506$90,348$0$90,348$87,842TownshipSebewa
2.2%$13,843$644,838$186,816$458,0222.9%$17,852$630,995$186,816$444,179$613,143CityBelding
2.2%$21,212$979,215$277,344$701,8712.9%$27,093$958,003$277,344$680,659$930,910CityIonia
2.3%$9,337$415,194$106,266$308,9282.9%$11,457$405,857$106,266$299,591$394,400CityPortland
2.7%$948$36,582$5,236$31,3462.9%$999$35,634$5,236$30,398$34,635VillageClarksville
2.7%$949$36,217$4,792$31,4252.9%$988$35,268$4,792$30,476$34,280VillageHubbardston
2.4%$4,852$204,623$44,073$160,5502.9%$5,627$199,771$44,073$155,698$194,144VillageLake Odessa
2.4%$1,897$82,559$19,787$62,7722.9%$2,275$80,662$19,787$60,875$78,387VillageLyons
2.3%$1,452$64,663$16,610$48,0532.9%$1,786$63,211$16,610$46,601$61,425VillageMuir
2.6%$1,128$45,303$7,990$37,3132.9%$1,241$44,175$7,990$36,185$42,934VillagePewamo
2.4%$3,186$136,578$31,162$105,4162.9%$3,760$133,392$31,162$102,230$129,632VillageSaranac
06/03/15 Prepared by The House Fiscal Agency Page 22

Revenue Sharing Payments to Cities, Villages, and TownshipsFinal FY 2013-14, Estimated FY 2014-15, and Estimated FY 2015-16 Based on SB 133 (S-1) CR-1
FY 2015-16FY 2014-15FY 2013-14
Change from FY 2014-15TotalEligibleEstimatedChange from FY 2013-14TotalEligibleEstimatedTotal
CombinedCVTConstitutionalCombinedCVTConstitutionalCombinedLocal Unit
PercentDollarPaymentPaymentPaymentPercentDollarPaymentPaymentPaymentPaymentTypeLocal Unit Name
Iosco County
3.1%$1,171$38,745$0$38,7452.9%$1,042$37,574$0$37,574$36,532TownshipAlabaster
3.1%$4,922$162,857$0$162,8572.9%$4,379$157,935$0$157,935$153,556TownshipAusable
3.1%$4,073$134,773$0$134,7732.9%$3,624$130,700$0$130,700$127,076TownshipBaldwin
3.1%$1,893$62,613$0$62,6132.9%$1,683$60,720$0$60,720$59,037TownshipBurleigh
3.1%$3,717$122,998$0$122,9982.9%$3,308$119,281$0$119,281$115,973TownshipGrant
3.0%$16,825$574,305$17,629$556,6762.9%$15,495$557,480$17,629$539,851$541,985TownshipOscoda
3.1%$9,135$302,245$0$302,2452.9%$8,128$293,110$0$293,110$284,982TownshipPlainfield
3.1%$1,418$46,939$0$46,9392.9%$1,262$45,521$0$45,521$44,259TownshipReno
3.1%$1,077$35,642$0$35,6422.9%$958$34,565$0$34,565$33,607TownshipSherman
3.1%$4,194$138,751$0$138,7512.9%$3,731$134,557$0$134,557$130,826TownshipTawas
3.1%$1,753$57,998$0$57,9982.9%$1,560$56,245$0$56,245$54,685TownshipWilber
2.6%$6,752$270,080$46,678$223,4022.9%$7,393$263,328$46,678$216,650$255,935CityEast Tawas
2.5%$4,309$173,593$31,023$142,5702.9%$4,755$169,284$31,023$138,261$164,529CityTawas
2.4%$923$38,715$8,165$30,5502.9%$1,063$37,792$8,165$29,627$36,729CityWhittemore
Iron County
3.1%$2,215$73,274$0$73,2742.9%$1,970$71,059$0$71,059$69,089TownshipBates
3.1%$4,191$138,671$0$138,6712.9%$3,728$134,480$0$134,480$130,752TownshipCrystal Falls
3.1%$813$26,891$0$26,8912.9%$724$26,078$0$26,078$25,354TownshipHematite
3.1%$2,470$81,707$0$81,7072.9%$2,196$79,237$0$79,237$77,041TownshipIron River
3.1%$579$19,173$0$19,1732.8%$515$18,594$0$18,594$18,079TownshipMansfield
3.1%$1,228$40,654$0$40,6542.8%$1,092$39,426$0$39,426$38,334TownshipMastodon
3.1%$2,741$90,697$0$90,6972.9%$2,439$87,956$0$87,956$85,517TownshipStambaugh
2.0%$2,178$111,798$39,718$72,0802.9%$3,115$109,620$39,718$69,902$106,505CityCaspian
2.0%$3,501$174,422$58,584$115,8382.9%$4,852$170,921$58,584$112,337$166,069CityCrystal Falls
1.9%$835$43,775$16,168$27,6072.9%$1,223$42,940$16,168$26,772$41,717CityGaastra
2.0%$7,284$371,066$130,081$240,9852.9%$10,337$363,782$130,081$233,701$353,445CityIron River
1.8%$349$19,304$7,768$11,53619.2%$3,054$18,955$7,768$11,187$15,901VillageAlpha
06/03/15 Prepared by The House Fiscal Agency Page 23

Revenue Sharing Payments to Cities, Villages, and TownshipsFinal FY 2013-14, Estimated FY 2014-15, and Estimated FY 2015-16 Based on SB 133 (S-1) CR-1
FY 2015-16FY 2014-15FY 2013-14
Change from FY 2014-15TotalEligibleEstimatedChange from FY 2013-14TotalEligibleEstimatedTotal
CombinedCVTConstitutionalCombinedCVTConstitutionalCombinedLocal Unit
PercentDollarPaymentPaymentPaymentPercentDollarPaymentPaymentPaymentPaymentTypeLocal Unit Name
Isabella County
3.1%$3,222$106,609$0$106,6092.9%$2,868$103,387$0$103,387$100,519TownshipBroomfield
3.1%$11,190$370,268$0$370,2682.9%$9,957$359,078$0$359,078$349,121TownshipChippewa
3.1%$3,760$124,430$0$124,4302.9%$3,347$120,670$0$120,670$117,323TownshipCoe
3.1%$1,868$61,817$0$61,8172.9%$1,662$59,949$0$59,949$58,287TownshipColdwater
3.1%$7,665$253,634$0$253,6342.9%$6,821$245,969$0$245,969$239,148TownshipDeerfield
3.1%$2,761$91,334$0$91,3342.9%$2,455$88,573$0$88,573$86,118TownshipDenver
3.1%$3,498$115,758$0$115,7582.9%$3,113$112,260$0$112,260$109,147TownshipFremont
3.1%$3,508$116,076$0$116,0762.9%$3,122$112,568$0$112,568$109,446TownshipGilmore
3.1%$4,533$149,969$0$149,9692.9%$4,033$145,436$0$145,436$141,403TownshipIsabella
3.1%$5,085$168,267$0$168,2672.9%$4,525$163,182$0$163,182$158,657TownshipLincoln
3.1%$5,487$181,554$0$181,5542.9%$4,882$176,067$0$176,067$171,185TownshipNottawa
3.1%$3,138$103,824$0$103,8242.9%$2,792$100,686$0$100,686$97,894TownshipRolland
3.1%$4,374$144,718$0$144,7182.9%$3,892$140,344$0$140,344$136,452TownshipSherman
3.0%$31,083$1,062,674$34,212$1,028,4626.4%$61,872$1,031,591$34,212$997,379$969,719TownshipUnion
3.1%$3,292$108,916$0$108,9162.9%$2,930$105,624$0$105,624$102,694TownshipVernon
3.1%$3,359$111,144$0$111,1442.9%$2,990$107,785$0$107,785$104,795TownshipWise
See the city of Clare in Clare CountySee the city of Clare in Clare CountyCityClare
2.3%$62,368$2,762,577$698,969$2,063,6082.9%$76,209$2,700,209$698,969$2,001,240$2,624,000CityMt Pleasant
3.1%$4,042$133,739$0$133,7392.9%$3,596$129,697$0$129,697$126,101VillageLake Isabella
3.1%$885$29,277$0$29,2772.8%$786$28,392$0$28,392$27,606VillageRosebush
2.6%$3,643$145,859$25,327$120,5322.9%$3,991$142,216$25,327$116,889$138,225VillageShepherd
06/03/15 Prepared by The House Fiscal Agency Page 24

Revenue Sharing Payments to Cities, Villages, and TownshipsFinal FY 2013-14, Estimated FY 2014-15, and Estimated FY 2015-16 Based on SB 133 (S-1) CR-1
FY 2015-16FY 2014-15FY 2013-14
Change from FY 2014-15TotalEligibleEstimatedChange from FY 2013-14TotalEligibleEstimatedTotal
CombinedCVTConstitutionalCombinedCVTConstitutionalCombinedLocal Unit
PercentDollarPaymentPaymentPaymentPercentDollarPaymentPaymentPaymentPaymentTypeLocal Unit Name
Jackson County
3.0%$49,408$1,689,165$54,382$1,634,7836.4%$98,349$1,639,757$54,382$1,585,375$1,541,408TownshipBlackman
3.1%$14,862$491,755$0$491,7552.9%$13,224$476,893$0$476,893$463,669TownshipColumbia
3.1%$4,023$133,102$0$133,1022.9%$3,580$129,079$0$129,079$125,499TownshipConcord
3.1%$10,846$358,891$0$358,8912.9%$9,653$348,045$0$348,045$338,392TownshipGrass Lake
3.1%$7,824$258,885$0$258,8852.9%$6,963$251,061$0$251,061$244,098TownshipHanover
3.1%$11,313$374,326$0$374,3262.9%$10,067$363,013$0$363,013$352,946TownshipHenrietta
3.0%$33,199$1,135,015$36,541$1,098,4746.4%$66,083$1,101,816$36,541$1,065,275$1,035,733TownshipLeoni
3.1%$7,119$235,574$0$235,5742.9%$6,336$228,455$0$228,455$222,119TownshipLiberty
3.1%$16,293$539,093$0$539,0932.9%$14,499$522,800$0$522,800$508,301TownshipNapoleon
3.1%$7,125$235,734$0$235,7342.9%$6,340$228,609$0$228,609$222,269TownshipNorvell
3.1%$6,021$199,216$0$199,2162.9%$5,358$193,195$0$193,195$187,837TownshipParma
3.1%$4,989$165,085$0$165,0852.9%$4,440$160,096$0$160,096$155,656TownshipPulaski
3.1%$11,261$372,576$0$372,5762.9%$10,020$361,315$0$361,315$351,295TownshipRives
3.1%$8,265$273,445$0$273,4452.9%$7,354$265,180$0$265,180$257,826TownshipSandstone
3.0%$19,878$679,595$21,879$657,7166.4%$39,568$659,717$21,879$637,838$620,149TownshipSpring Arbor
3.1%$3,268$108,121$0$108,1212.9%$2,908$104,853$0$104,853$101,945TownshipSpringport
3.0%$54,120$1,850,288$59,569$1,790,7196.4%$107,730$1,796,168$59,569$1,736,599$1,688,438TownshipSummit
3.1%$6,422$212,502$0$212,5022.9%$5,716$206,080$0$206,080$200,364TownshipTompkins
3.1%$6,868$227,221$0$227,2212.9%$6,110$220,353$0$220,353$214,243TownshipWaterloo
1.9%$80,419$4,368,142$1,707,283$2,660,8592.9%$122,141$4,287,723$1,707,283$2,580,440$4,165,582CityJackson
2.7%$2,900$110,927$14,979$95,9482.9%$3,024$108,027$14,979$93,048$105,003VillageBrooklyn
See the village of Cement City in Lenawee CountySee the village of Cement City in Lenawee CountyVillageCement City
2.5%$2,525$102,818$19,281$83,5372.9%$2,819$100,293$19,281$81,012$97,474VillageConcord
2.9%$2,821$98,513$5,190$93,3238.7%$7,699$95,692$5,190$90,502$87,993VillageGrass Lake
2.7%$1,060$39,741$4,656$35,0852.9%$1,082$38,681$4,656$34,025$37,599VillageHanover
2.9%$1,849$65,852$4,671$61,1812.9%$1,784$64,003$4,671$59,332$62,219VillageParma
2.3%$1,924$87,189$23,542$63,6472.9%$2,408$85,265$23,542$61,723$82,857VillageSpringport
06/03/15 Prepared by The House Fiscal Agency Page 25

Revenue Sharing Payments to Cities, Villages, and TownshipsFinal FY 2013-14, Estimated FY 2014-15, and Estimated FY 2015-16 Based on SB 133 (S-1) CR-1
FY 2015-16FY 2014-15FY 2013-14
Change from FY 2014-15TotalEligibleEstimatedChange from FY 2013-14TotalEligibleEstimatedTotal
CombinedCVTConstitutionalCombinedCVTConstitutionalCombinedLocal Unit
PercentDollarPaymentPaymentPaymentPercentDollarPaymentPaymentPaymentPaymentTypeLocal Unit Name
Kalamazoo County
3.1%$9,045$299,301$0$299,3012.9%$8,050$290,256$0$290,256$282,206TownshipAlamo
3.1%$8,687$287,447$0$287,4472.9%$7,730$278,760$0$278,760$271,030TownshipBrady
3.1%$4,670$154,504$0$154,5042.9%$4,155$149,834$0$149,834$145,679TownshipCharleston
3.1%$4,078$134,932$0$134,9322.9%$3,629$130,854$0$130,854$127,225TownshipClimax
3.0%$35,717$1,221,085$39,312$1,181,7736.4%$71,095$1,185,368$39,312$1,146,056$1,114,273TownshipComstock
3.0%$24,312$831,183$26,760$804,4236.4%$48,394$806,871$26,760$780,111$758,477TownshipCooper
2.5%$52,702$2,140,378$396,599$1,743,7792.9%$58,648$2,087,676$396,599$1,691,077$2,029,028TownshipKalamazoo
3.0%$52,189$1,784,277$57,444$1,726,8336.4%$103,887$1,732,088$57,444$1,674,644$1,628,201TownshipOshtemo
3.1%$14,961$495,017$0$495,0172.9%$13,313$480,056$0$480,056$466,743TownshipPavilion
3.1%$5,410$179,008$0$179,0082.9%$4,814$173,598$0$173,598$168,784TownshipPrairie Ronde
3.1%$16,421$543,310$0$543,3102.9%$14,611$526,889$0$526,889$512,278TownshipRichland
3.1%$9,166$303,279$0$303,2792.9%$8,157$294,113$0$294,113$285,956TownshipRoss
3.1%$10,623$351,492$0$351,4922.9%$9,452$340,869$0$340,869$331,417TownshipSchoolcraft
3.0%$35,339$1,208,179$38,897$1,169,2826.4%$70,345$1,172,840$38,897$1,133,943$1,102,495TownshipTexas
3.1%$3,128$103,506$0$103,5062.9%$2,784$100,378$0$100,378$97,594TownshipWakeshma
2.7%$4,831$184,657$24,823$159,8342.9%$5,034$179,826$24,823$155,003$174,792CityGalesburg
2.1%$178,023$8,803,656$2,913,327$5,890,3292.9%$244,728$8,625,633$2,913,327$5,712,306$8,380,905CityKalamazoo
2.5%$4,337$175,370$31,846$143,5242.9%$4,802$171,033$31,846$139,187$166,231CityParchment
2.9%$111,309$3,995,489$312,532$3,682,9572.9%$108,313$3,884,180$312,532$3,571,648$3,775,867CityPortage
2.9%$2,128$76,307$5,898$70,4098.6%$5,884$74,179$5,898$68,281$68,295VillageAugusta
2.8%$1,844$68,894$7,873$61,0212.9%$1,876$67,050$7,873$59,177$65,174VillageClimax
3.1%$1,806$59,749$0$59,7492.9%$1,607$57,943$0$57,943$56,336VillageRichland
2.6%$3,666$143,348$22,021$121,3272.9%$3,916$139,682$22,021$117,661$135,766VillageSchoolcraft
2.7%$6,988$266,043$34,844$231,1992.9%$7,251$259,055$34,844$224,211$251,804VillageVicksburg
Kalkaska County
3.1%$1,604$53,066$0$53,0662.8%$1,426$51,462$0$51,462$50,036TownshipBear Lake
3.1%$931$30,789$0$30,7892.9%$828$29,858$0$29,858$29,030TownshipBlue Lake
3.1%$3,679$121,725$0$121,7252.9%$3,272$118,046$0$118,046$114,774TownshipBoardman
3.1%$5,876$194,442$0$194,4422.9%$5,229$188,566$0$188,566$183,337TownshipClearwater
3.1%$3,520$116,474$0$116,4742.9%$3,132$112,954$0$112,954$109,822TownshipColdsprings
3.1%$2,291$75,819$0$75,8192.9%$2,039$73,528$0$73,528$71,489TownshipExcelsior
3.1%$1,933$63,965$0$63,9652.9%$1,719$62,032$0$62,032$60,313TownshipGarfield
3.1%$6,497$214,969$0$214,9692.9%$5,783$208,472$0$208,472$202,689TownshipKalkaska
3.1%$676$22,356$0$22,3562.9%$602$21,680$0$21,680$21,078TownshipOliver
3.1%$2,965$98,096$0$98,0962.8%$2,636$95,131$0$95,131$92,495TownshipOrange
3.1%$2,753$91,095$0$91,0952.9%$2,450$88,342$0$88,342$85,892TownshipRapid River
3.1%$3,662$121,168$0$121,1682.9%$3,258$117,506$0$117,506$114,248TownshipSpringfield
2.9%$4,792$170,751$12,190$158,5612.9%$4,628$165,959$12,190$153,769$161,331VillageKalkaska
06/03/15 Prepared by The House Fiscal Agency Page 26

Revenue Sharing Payments to Cities, Villages, and TownshipsFinal FY 2013-14, Estimated FY 2014-15, and Estimated FY 2015-16 Based on SB 133 (S-1) CR-1
FY 2015-16FY 2014-15FY 2013-14
Change from FY 2014-15TotalEligibleEstimatedChange from FY 2013-14TotalEligibleEstimatedTotal
CombinedCVTConstitutionalCombinedCVTConstitutionalCombinedLocal Unit
PercentDollarPaymentPaymentPaymentPercentDollarPaymentPaymentPaymentPaymentTypeLocal Unit Name
Kent County
3.0%$31,600$1,080,348$34,781$1,045,5676.4%$62,901$1,048,748$34,781$1,013,967$985,847TownshipAda
3.0%$23,881$816,468$26,286$790,1826.4%$47,537$792,587$26,286$766,301$745,050TownshipAlgoma
3.0%$32,067$1,096,297$35,295$1,061,0026.4%$63,829$1,064,230$35,295$1,028,935$1,000,401TownshipAlpine
3.1%$7,415$245,360$0$245,3602.9%$6,599$237,945$0$237,945$231,346TownshipBowne
3.0%$48,852$1,670,176$53,771$1,616,4056.4%$97,244$1,621,324$53,771$1,567,553$1,524,080TownshipByron
3.0%$26,019$889,549$28,639$860,9106.4%$51,793$863,530$28,639$834,891$811,737TownshipCaledonia
3.0%$32,067$1,096,297$35,295$1,061,0026.4%$63,829$1,064,230$35,295$1,028,935$1,000,401TownshipCannon
3.0%$41,199$1,408,515$45,347$1,363,1686.4%$82,009$1,367,316$45,347$1,321,969$1,285,307TownshipCascade
3.0%$18,462$631,177$20,321$610,8566.4%$36,750$612,715$20,321$592,394$575,965TownshipCourtland
3.0%$60,464$2,067,148$66,551$2,000,5976.4%$120,357$2,006,684$66,551$1,940,133$1,886,327TownshipGaines
3.0%$40,061$1,369,631$44,095$1,325,5366.4%$79,745$1,329,570$44,095$1,285,475$1,249,825TownshipGrand Rapids
3.1%$8,707$288,084$0$288,0842.9%$7,748$279,377$0$279,377$271,629TownshipGrattan
3.1%$14,305$473,298$0$473,2982.9%$12,729$458,993$0$458,993$446,264TownshipLowell
3.1%$10,253$339,240$0$339,2402.9%$9,123$328,987$0$328,987$319,864TownshipNelson
3.1%$13,903$460,011$0$460,0112.9%$12,370$446,108$0$446,108$433,738TownshipOakfield
3.0%$74,424$2,544,435$81,917$2,462,5186.4%$148,147$2,470,011$81,917$2,388,094$2,321,864TownshipPlainfield
3.1%$14,365$475,287$0$475,2872.9%$12,783$460,922$0$460,922$448,139TownshipSolon
3.1%$11,950$395,409$0$395,4092.9%$10,634$383,459$0$383,459$372,825TownshipSparta
3.1%$9,469$313,304$0$313,3042.9%$8,426$303,835$0$303,835$295,409TownshipSpencer
3.1%$8,411$278,298$0$278,2982.9%$7,484$269,887$0$269,887$262,403TownshipTyrone
3.1%$10,072$333,273$0$333,2732.9%$8,962$323,201$0$323,201$314,239TownshipVergennes
2.7%$8,437$321,824$42,651$279,1732.9%$8,775$313,387$42,651$270,736$304,612CityCedar Springs
2.8%$25,714$938,662$87,856$850,8062.9%$25,487$912,948$87,856$825,092$887,461CityEast Grand Rapids
2.3%$450,932$20,209,304$5,289,078$14,920,2262.9%$557,968$19,758,372$5,289,078$14,469,294$19,200,404CityGrand Rapids
3.0%$36,977$1,264,161$40,699$1,223,4623.2%$37,565$1,227,184$40,699$1,186,485$1,189,619CityGrandville
3.0%$117,117$4,004,000$128,907$3,875,0936.4%$233,128$3,886,883$128,907$3,757,976$3,653,755CityKentwood
2.6%$9,096$364,289$63,317$300,9722.9%$9,971$355,193$63,317$291,876$345,222CityLowell
2.9%$13,751$487,567$32,568$454,9992.9%$13,203$473,816$32,568$441,248$460,613CityRockford
3.0%$56,595$1,934,879$62,293$1,872,5864.6%$82,047$1,878,284$62,293$1,815,991$1,796,237CityWalker
2.8%$173,426$6,365,338$627,126$5,738,2122.9%$172,907$6,191,912$627,126$5,564,786$6,019,005CityWyoming
3.1%$3,634$120,214$0$120,2142.9%$3,232$116,580$0$116,580$113,348VillageCaledonia
3.1%$767$25,379$0$25,3792.8%$680$24,612$0$24,612$23,932VillageCasnovia
2.8%$2,542$92,528$8,434$84,0942.9%$2,511$89,986$8,434$81,552$87,475VillageKent City
2.5%$1,202$49,823$10,044$39,7792.9%$1,370$48,621$10,044$38,577$47,251VillageSand Lake
2.5%$9,955$403,942$74,567$329,3752.9%$11,067$393,987$74,567$319,420$382,920VillageSparta
Keweenaw County
3.1%$3,426$113,371$0$113,3712.9%$3,048$109,945$0$109,945$106,897TownshipAllouez
3.1%$522$17,264$0$17,2642.9%$464$16,742$0$16,742$16,278TownshipEagle Harbor
3.1%$527$17,423$0$17,4232.8%$467$16,896$0$16,896$16,429TownshipGrant
3.1%$192$6,364$0$6,3642.8%$169$6,172$0$6,172$6,003TownshipHoughton
3.1%$161$5,330$0$5,3302.8%$143$5,169$0$5,169$5,026TownshipSherman
2.3%$351$15,804$4,189$11,6152.9%$439$15,453$4,189$11,264$15,014VillageAhmeek
06/03/15 Prepared by The House Fiscal Agency Page 27

Revenue Sharing Payments to Cities, Villages, and TownshipsFinal FY 2013-14, Estimated FY 2014-15, and Estimated FY 2015-16 Based on SB 133 (S-1) CR-1
FY 2015-16FY 2014-15FY 2013-14
Change from FY 2014-15TotalEligibleEstimatedChange from FY 2013-14TotalEligibleEstimatedTotal
CombinedCVTConstitutionalCombinedCVTConstitutionalCombinedLocal Unit
PercentDollarPaymentPaymentPaymentPercentDollarPaymentPaymentPaymentPaymentTypeLocal Unit Name
Lake County
3.1%$2,734$90,458$0$90,4582.9%$2,432$87,724$0$87,724$85,292TownshipChase
3.1%$952$31,505$0$31,5052.8%$846$30,553$0$30,553$29,707TownshipCherry Valley
3.1%$949$31,425$0$31,4252.9%$846$30,476$0$30,476$29,630TownshipDover
3.1%$1,171$38,745$0$38,7452.9%$1,042$37,574$0$37,574$36,532TownshipEden
3.1%$2,368$78,365$0$78,3652.9%$2,107$75,997$0$75,997$73,890TownshipElk
3.1%$1,676$55,452$0$55,4522.9%$1,492$53,776$0$53,776$52,284TownshipEllsworth
3.1%$2,073$68,580$0$68,5802.9%$1,843$66,507$0$66,507$64,664TownshipLake
3.1%$1,043$34,528$0$34,5282.9%$928$33,485$0$33,485$32,557TownshipNewkirk
3.1%$1,183$39,143$0$39,1432.9%$1,053$37,960$0$37,960$36,907TownshipPeacock
3.1%$1,724$57,043$0$57,0432.9%$1,533$55,319$0$55,319$53,786TownshipPinora
3.1%$2,455$81,230$0$81,2302.9%$2,184$78,775$0$78,775$76,591TownshipPleasant Plains
3.1%$801$26,493$0$26,4932.9%$712$25,692$0$25,692$24,980TownshipSauble
3.1%$590$19,492$0$19,4922.8%$523$18,902$0$18,902$18,379TownshipSweetwater
3.1%$2,527$83,616$0$83,6162.9%$2,247$81,089$0$81,089$78,842TownshipWebber
3.1%$1,830$60,544$0$60,5442.9%$1,628$58,714$0$58,714$57,086TownshipYates
2.5%$2,556$104,846$20,275$84,5712.9%$2,875$102,290$20,275$82,015$99,415VillageBaldwin
2.5%$764$31,307$6,008$25,2996.4%$1,831$30,543$6,008$24,535$28,712VillageLuther
Lapeer County
3.1%$9,400$310,997$0$310,9972.9%$8,364$301,597$0$301,597$293,233TownshipAlmont
3.1%$7,485$247,667$0$247,6672.9%$6,659$240,182$0$240,182$233,523TownshipArcadia
3.1%$11,434$378,304$0$378,3042.9%$10,173$366,870$0$366,870$356,697TownshipAttica
3.1%$2,775$91,811$0$91,8112.9%$2,470$89,036$0$89,036$86,566TownshipBurlington
3.1%$4,482$148,298$0$148,2982.9%$3,988$143,816$0$143,816$139,828TownshipBurnside
3.1%$13,694$453,090$0$453,0902.9%$12,186$439,396$0$439,396$427,210TownshipDeerfield
3.1%$9,178$303,677$0$303,6772.9%$8,166$294,499$0$294,499$286,333TownshipDryden
3.1%$12,624$417,686$0$417,6862.9%$11,234$405,062$0$405,062$393,828TownshipElba
3.1%$4,396$145,434$0$145,4342.9%$3,911$141,038$0$141,038$137,127TownshipGoodland
3.1%$10,888$360,244$0$360,2442.9%$9,688$349,356$0$349,356$339,668TownshipHadley
3.1%$7,521$248,861$0$248,8612.9%$6,693$241,340$0$241,340$234,647TownshipImlay
3.1%$12,157$402,251$0$402,2512.9%$10,819$390,094$0$390,094$379,275TownshipLapeer
3.1%$8,322$275,354$0$275,3542.9%$7,406$267,032$0$267,032$259,626TownshipMarathon
3.0%$19,127$653,947$21,054$632,8936.4%$38,076$634,820$21,054$613,766$596,744TownshipMayfield
3.1%$8,858$293,096$0$293,0962.9%$7,882$284,238$0$284,238$276,356TownshipMetamora
3.1%$6,280$207,808$0$207,8082.9%$5,589$201,528$0$201,528$195,939TownshipNorth Branch
3.1%$13,912$460,329$0$460,3292.9%$12,380$446,417$0$446,417$434,037TownshipOregon
3.1%$3,902$129,124$0$129,1242.9%$3,473$125,222$0$125,222$121,749TownshipRich
See the city of Brown City in Sanilac CountySee the city of Brown City in Sanilac CountyCityBrown City
2.4%$8,649$364,547$78,373$286,1742.9%$10,019$355,898$78,373$277,525$345,879CityImlay City
2.7%$19,981$762,058$100,921$661,1372.9%$20,772$742,077$100,921$641,156$721,305CityLapeer
2.6%$6,430$256,115$43,374$212,7412.9%$7,007$249,685$43,374$206,311$242,678VillageAlmont
2.3%$779$34,127$8,350$25,7772.9%$940$33,348$8,350$24,998$32,408VillageClifford
2.3%$1,893$82,685$20,072$62,6132.9%$2,279$80,792$20,072$60,720$78,513VillageColumbiaville
2.9%$2,286$81,151$5,491$75,6602.9%$2,197$78,865$5,491$73,374$76,668VillageDryden
3.1%$1,358$44,950$0$44,9502.9%$1,208$43,592$0$43,592$42,384VillageMetamora
2.5%$2,484$102,071$19,887$82,1842.9%$2,800$99,587$19,887$79,700$96,787VillageNorth Branch
2.4%$935$39,800$8,852$30,9482.9%$1,095$38,865$8,852$30,013$37,770VillageOtter Lake
06/03/15 Prepared by The House Fiscal Agency Page 28

Revenue Sharing Payments to Cities, Villages, and TownshipsFinal FY 2013-14, Estimated FY 2014-15, and Estimated FY 2015-16 Based on SB 133 (S-1) CR-1
FY 2015-16FY 2014-15FY 2013-14
Change from FY 2014-15TotalEligibleEstimatedChange from FY 2013-14TotalEligibleEstimatedTotal
CombinedCVTConstitutionalCombinedCVTConstitutionalCombinedLocal Unit
PercentDollarPaymentPaymentPaymentPercentDollarPaymentPaymentPaymentPaymentTypeLocal Unit Name
Leelanau County
3.1%$6,004$198,659$0$198,6592.9%$5,344$192,655$0$192,655$187,311TownshipBingham
3.1%$3,063$101,358$0$101,3582.9%$2,727$98,295$0$98,295$95,568TownshipCenterville
3.1%$2,479$82,025$0$82,0252.9%$2,206$79,546$0$79,546$77,340TownshipCleveland
3.1%$10,828$358,255$0$358,2552.9%$9,634$347,427$0$347,427$337,793TownshipElmwood
3.1%$1,941$64,204$0$64,2042.9%$1,727$62,263$0$62,263$60,536TownshipEmpire
3.1%$2,066$68,341$0$68,3412.9%$1,838$66,275$0$66,275$64,437TownshipGlen Arbor
3.1%$3,868$128,010$0$128,0102.9%$3,443$124,142$0$124,142$120,699TownshipKasson
3.1%$3,609$119,418$0$119,4182.9%$3,212$115,809$0$115,809$112,597TownshipLeelanau
3.1%$4,912$162,539$0$162,5392.9%$4,372$157,627$0$157,627$153,255TownshipLeland
3.1%$3,628$120,054$0$120,0542.9%$3,227$116,426$0$116,426$113,199TownshipSolon
3.1%$5,651$186,964$0$186,9642.9%$5,029$181,313$0$181,313$176,284TownshipSuttons Bay
See the city of Traverse City in Grand Traverse CountySee the city of Traverse City in Grand Traverse CountyCityTraverse City
3.1%$901$29,834$0$29,8342.9%$803$28,933$0$28,933$28,130VillageEmpire
3.1%$1,265$41,848$0$41,8482.9%$1,125$40,583$0$40,583$39,458VillageNorthport
3.1%$1,486$49,167$0$49,1672.8%$1,320$47,681$0$47,681$46,361VillageSuttons Bay
06/03/15 Prepared by The House Fiscal Agency Page 29

Revenue Sharing Payments to Cities, Villages, and TownshipsFinal FY 2013-14, Estimated FY 2014-15, and Estimated FY 2015-16 Based on SB 133 (S-1) CR-1
FY 2015-16FY 2014-15FY 2013-14
Change from FY 2014-15TotalEligibleEstimatedChange from FY 2013-14TotalEligibleEstimatedTotal
CombinedCVTConstitutionalCombinedCVTConstitutionalCombinedLocal Unit
PercentDollarPaymentPaymentPaymentPercentDollarPaymentPaymentPaymentPaymentTypeLocal Unit Name
Lenawee County
3.1%$14,512$480,140$0$480,1402.9%$12,912$465,628$0$465,628$452,716TownshipAdrian
3.1%$1,541$50,997$0$50,9972.9%$1,371$49,456$0$49,456$48,085TownshipBlissfield
3.1%$11,580$383,157$0$383,1572.9%$10,305$371,577$0$371,577$361,272TownshipCambridge
3.1%$3,049$100,881$0$100,8812.9%$2,713$97,832$0$97,832$95,119TownshipClinton
3.1%$1,611$53,304$0$53,3042.9%$1,433$51,693$0$51,693$50,260TownshipDeerfield
3.1%$3,999$132,307$0$132,3072.9%$3,558$128,308$0$128,308$124,750TownshipDover
3.1%$4,242$140,342$0$140,3422.9%$3,773$136,100$0$136,100$132,327TownshipFairfield
3.1%$7,632$252,521$0$252,5212.9%$6,791$244,889$0$244,889$238,098TownshipFranklin
3.1%$3,184$105,336$0$105,3362.9%$2,833$102,152$0$102,152$99,319TownshipHudson
3.1%$3,574$118,225$0$118,2252.9%$3,179$114,651$0$114,651$111,472TownshipMacon
3.1%$17,923$593,034$0$593,0342.9%$15,949$575,111$0$575,111$559,162TownshipMadison
3.1%$2,621$86,719$0$86,7192.9%$2,332$84,098$0$84,098$81,766TownshipMedina
3.1%$2,340$77,411$0$77,4112.9%$2,082$75,071$0$75,071$72,989TownshipOgden
3.1%$4,992$165,165$0$165,1652.9%$4,442$160,173$0$160,173$155,731TownshipPalmyra
3.0%$18,176$621,394$20,006$601,3886.4%$36,180$603,218$20,006$583,212$567,038TownshipRaisin
3.1%$2,299$76,058$0$76,0582.9%$2,045$73,759$0$73,759$71,714TownshipRidgeway
3.1%$3,381$111,860$0$111,8602.9%$3,008$108,479$0$108,479$105,471TownshipRiga
3.1%$6,829$225,948$0$225,9482.9%$6,077$219,119$0$219,119$213,042TownshipRollin
3.1%$4,306$142,490$0$142,4902.9%$3,831$138,184$0$138,184$134,353TownshipRome
3.1%$2,957$97,857$0$97,8572.9%$2,632$94,900$0$94,900$92,268TownshipSeneca
3.1%$4,741$156,890$0$156,8902.9%$4,220$152,149$0$152,149$147,929TownshipTecumseh
3.1%$7,033$232,710$0$232,7102.9%$6,257$225,677$0$225,677$219,420TownshipWoodstock
2.4%$50,564$2,145,023$471,972$1,673,0512.9%$58,981$2,094,459$471,972$1,622,487$2,035,478CityAdrian
2.3%$5,547$246,227$62,684$183,5432.9%$6,795$240,680$62,684$177,996$233,885CityHudson
2.3%$5,338$237,653$61,032$176,6212.9%$6,558$232,315$61,032$171,283$225,757CityMorenci
2.7%$20,489$781,741$103,817$677,9242.9%$21,308$761,252$103,817$657,435$739,944CityTecumseh
2.6%$1,455$57,082$8,949$48,1332.9%$1,561$55,627$8,949$46,678$54,066VillageAddison
2.6%$8,031$319,478$53,751$265,7272.9%$8,739$311,447$53,751$257,696$302,708VillageBlissfield
2.6%$1,409$54,679$8,058$46,6212.9%$1,493$53,270$8,058$45,212$51,777VillageBritton
2.7%$1,053$40,222$5,376$34,8462.9%$1,098$39,169$5,376$33,793$38,071VillageCement City
2.7%$827$32,012$4,644$27,36811.1%$3,127$31,185$4,644$26,541$28,058VillageClayton
2.8%$5,617$207,282$21,432$185,8502.9%$5,634$201,665$21,432$180,233$196,031VillageClinton
2.7%$2,160$82,225$10,781$71,44418.9%$12,701$80,065$10,781$69,284$67,364VillageDeerfield
3.1%$2,205$72,955$0$72,9552.9%$1,961$70,750$0$70,750$68,789VillageOnsted
06/03/15 Prepared by The House Fiscal Agency Page 30

Revenue Sharing Payments to Cities, Villages, and TownshipsFinal FY 2013-14, Estimated FY 2014-15, and Estimated FY 2015-16 Based on SB 133 (S-1) CR-1
FY 2015-16FY 2014-15FY 2013-14
Change from FY 2014-15TotalEligibleEstimatedChange from FY 2013-14TotalEligibleEstimatedTotal
CombinedCVTConstitutionalCombinedCVTConstitutionalCombinedLocal Unit
PercentDollarPaymentPaymentPaymentPercentDollarPaymentPaymentPaymentPaymentTypeLocal Unit Name
Livingston County
3.0%$42,778$1,462,523$47,085$1,415,4386.4%$85,153$1,419,745$47,085$1,372,660$1,334,592TownshipBrighton
3.1%$7,976$263,898$0$263,8982.9%$7,097$255,922$0$255,922$248,825TownshipCohoctah
3.1%$8,527$282,117$0$282,1172.9%$7,586$273,590$0$273,590$266,004TownshipConway
3.1%$10,027$331,762$0$331,7622.9%$8,923$321,735$0$321,735$312,812TownshipDeerfield
3.0%$47,660$1,629,402$52,458$1,576,9446.4%$94,870$1,581,742$52,458$1,529,284$1,486,872TownshipGenoa
3.0%$41,899$1,432,437$46,117$1,386,3206.4%$83,402$1,390,538$46,117$1,344,421$1,307,136TownshipGreen Oak
3.0%$50,891$1,739,886$56,015$1,683,8716.4%$101,302$1,688,995$56,015$1,632,980$1,587,693TownshipHamburg
3.1%$12,311$407,343$0$407,3432.9%$10,956$395,032$0$395,032$384,076TownshipHandy
3.0%$35,257$1,205,384$38,807$1,166,5776.4%$70,181$1,170,127$38,807$1,131,320$1,099,946TownshipHartland
3.1%$16,115$533,206$0$533,2062.9%$14,340$517,091$0$517,091$502,751TownshipHowell
3.1%$9,139$302,404$0$302,4042.9%$8,133$293,265$0$293,265$285,132TownshipIosco
3.0%$24,036$821,729$26,455$795,2746.4%$47,842$797,693$26,455$771,238$749,851TownshipMarion
3.0%$28,700$981,209$31,590$949,6196.4%$57,130$952,509$31,590$920,919$895,379TownshipOceola
3.1%$13,997$463,114$0$463,1142.9%$12,454$449,117$0$449,117$436,663TownshipPutnam
3.0%$24,093$823,702$26,519$797,1836.4%$47,960$799,609$26,519$773,090$751,649TownshipTyrone
3.1%$8,094$267,796$0$267,7962.9%$7,201$259,702$0$259,702$252,501TownshipUnadilla
2.9%$17,899$645,746$53,507$592,2392.9%$17,513$627,847$53,507$574,340$610,334CityBrighton
See the city of Fenton in Genesee CountySee the city of Fenton in Genesee CountyCityFenton
2.7%$22,566$848,611$101,948$746,6632.9%$23,101$826,045$101,948$724,097$802,944CityHowell
2.6%$6,940$274,207$44,599$229,6082.9%$7,496$267,267$44,599$222,668$259,771VillageFowlerville
3.1%$5,836$193,090$0$193,0902.9%$5,192$187,254$0$187,254$182,062VillagePinckney
Luce County
3.1%$491$16,230$0$16,2302.9%$437$15,739$0$15,739$15,302TownshipColumbus
3.1%$2,551$84,412$0$84,4122.9%$2,270$81,861$0$81,861$79,591TownshipLakefield
3.1%$2,821$93,323$0$93,3232.9%$2,509$90,502$0$90,502$87,993TownshipMcmillan
3.1%$5,105$168,904$0$168,9042.9%$4,542$163,799$0$163,799$159,257TownshipPentland
2.0%$3,652$183,234$62,384$120,8502.9%$5,100$179,582$62,384$117,198$174,482VillageNewberry
Mackinac County
3.1%$229$7,558$0$7,5582.8%$202$7,329$0$7,329$7,127TownshipBois Blanc
3.1%$1,429$47,258$0$47,2582.9%$1,270$45,829$0$45,829$44,559TownshipBrevort
3.1%$4,943$163,573$0$163,5732.9%$4,399$158,630$0$158,630$154,231TownshipClark
3.1%$2,755$91,174$0$91,1742.9%$2,453$88,419$0$88,419$85,966TownshipGarfield
3.1%$368$12,172$0$12,1722.8%$327$11,804$0$11,804$11,477TownshipHendricks
3.1%$435$14,400$0$14,4002.9%$388$13,965$0$13,965$13,577TownshipHudson
3.1%$1,450$47,974$0$47,9742.8%$1,289$46,524$0$46,524$45,235TownshipMarquette
3.1%$2,390$79,081$0$79,0812.9%$2,126$76,691$0$76,691$74,565TownshipMoran
3.1%$1,026$33,971$0$33,9712.9%$914$32,945$0$32,945$32,031TownshipNewton
3.1%$2,359$78,047$0$78,0472.9%$2,098$75,688$0$75,688$73,590TownshipPortage
3.1%$2,258$74,706$0$74,7062.9%$2,008$72,448$0$72,448$70,440TownshipSt Ignace
3.1%$1,183$39,143$0$39,1432.9%$1,053$37,960$0$37,960$36,907CityMackinac Island
2.8%$5,881$217,104$22,503$194,6012.9%$5,902$211,223$22,503$188,720$205,321CitySt Ignace
06/03/15 Prepared by The House Fiscal Agency Page 31

Revenue Sharing Payments to Cities, Villages, and TownshipsFinal FY 2013-14, Estimated FY 2014-15, and Estimated FY 2015-16 Based on SB 133 (S-1) CR-1
FY 2015-16FY 2014-15FY 2013-14
Change from FY 2014-15TotalEligibleEstimatedChange from FY 2013-14TotalEligibleEstimatedTotal
CombinedCVTConstitutionalCombinedCVTConstitutionalCombinedLocal Unit
PercentDollarPaymentPaymentPaymentPercentDollarPaymentPaymentPaymentPaymentTypeLocal Unit Name
Macomb County
3.1%$8,774$290,311$0$290,3112.9%$7,808$281,537$0$281,537$273,729TownshipArmada
3.1%$16,704$552,698$0$552,6982.9%$14,865$535,994$0$535,994$521,129TownshipBruce
3.0%$104,310$3,566,172$114,812$3,451,3606.4%$207,636$3,461,862$114,812$3,347,050$3,254,226TownshipChesterfield
3.0%$232,747$8,114,261$413,243$7,701,0182.9%$219,360$7,881,514$413,243$7,468,271$7,662,154TownshipClinton
3.0%$59,119$2,021,195$65,072$1,956,1236.4%$117,683$1,962,076$65,072$1,897,004$1,844,393TownshipHarrison
3.1%$12,493$413,389$0$413,3892.9%$11,118$400,896$0$400,896$389,778TownshipLenox
3.0%$191,351$6,541,942$210,616$6,331,3266.4%$380,896$6,350,591$210,616$6,139,975$5,969,695TownshipMacomb
3.1%$8,991$297,472$0$297,4722.9%$8,000$288,481$0$288,481$280,481TownshipRay
3.1%$8,812$291,584$0$291,5842.9%$7,842$282,772$0$282,772$274,930TownshipRichmond
3.0%$177,463$6,067,121$195,329$5,871,7925.6%$311,182$5,889,658$195,329$5,694,329$5,578,476TownshipShelby
3.0%$56,015$1,915,067$61,655$1,853,4126.4%$111,503$1,859,052$61,655$1,797,397$1,747,549TownshipWashington
2.2%$19,854$905,247$248,327$656,9202.9%$25,026$885,393$248,327$637,066$860,367CityCenter Line
2.4%$78,007$3,391,928$810,867$2,581,0612.9%$93,442$3,313,921$810,867$2,503,054$3,220,479CityEastpointe
2.7%$34,818$1,328,411$176,393$1,152,0182.9%$36,209$1,293,593$176,393$1,117,200$1,257,384CityFraser
See the city of Grosse Pointe Shores in Wayne CountySee the city of Grosse Pointe Shores in Wayne CountyCityGrosse Pointe Shores
2.6%$2,844$112,421$18,303$94,1182.9%$3,072$109,577$18,303$91,274$106,505CityMemphis
2.1%$37,857$1,807,472$554,891$1,252,5812.9%$50,127$1,769,615$554,891$1,214,724$1,719,488CityMt Clemens
3.0%$29,056$994,340$32,946$961,3942.9%$26,835$965,284$32,946$932,338$938,449CityNew Baltimore
2.7%$13,790$525,086$68,814$456,2722.9%$14,310$511,296$68,814$442,482$496,986CityRichmond
2.5%$113,731$4,615,158$852,085$3,763,0732.9%$126,451$4,501,427$852,085$3,649,342$4,374,976CityRoseville
2.8%$143,585$5,353,064$602,183$4,750,8812.9%$145,617$5,209,479$602,183$4,607,296$5,063,862CitySt Clair Shores
2.9%$311,863$11,222,382$903,625$10,318,7572.9%$304,294$10,910,519$903,625$10,006,894$10,606,225CitySterling Heights
2.6%$11,438$446,269$67,806$378,4632.9%$12,189$434,831$67,806$367,025$422,642CityUtica
2.5%$322,338$13,291,096$2,625,700$10,665,3962.9%$364,636$12,968,758$2,625,700$10,343,058$12,604,122CityWarren
2.6%$4,160$162,429$24,792$137,6372.9%$4,437$158,269$24,792$133,477$153,832VillageArmada
2.6%$11,162$446,460$77,146$369,3142.9%$12,219$435,298$77,146$358,152$423,079VillageNew Haven
2.4%$8,647$367,700$81,605$286,0952.9%$10,114$359,053$81,605$277,448$348,939VillageRomeo
Manistee County
3.1%$1,537$50,838$0$50,8382.9%$1,367$49,301$0$49,301$47,934TownshipArcadia
3.1%$3,523$116,554$0$116,5542.9%$3,134$113,031$0$113,031$109,897TownshipBear Lake
3.1%$1,796$59,430$0$59,4302.9%$1,598$57,634$0$57,634$56,036TownshipBrown
3.1%$1,834$60,703$0$60,7032.9%$1,633$58,869$0$58,869$57,236TownshipCleon
3.1%$2,388$79,002$0$79,0022.9%$2,124$76,614$0$76,614$74,490TownshipDickson
3.1%$5,591$184,975$0$184,9752.9%$4,974$179,384$0$179,384$174,410TownshipFiler
3.1%$7,278$240,825$0$240,8252.9%$6,477$233,547$0$233,547$227,070TownshipManistee
3.1%$2,035$67,307$0$67,3072.9%$1,809$65,272$0$65,272$63,463TownshipMaple Grove
3.1%$945$31,266$0$31,2662.8%$840$30,321$0$30,321$29,481TownshipMarilla
3.1%$3,734$123,555$0$123,5552.9%$3,323$119,821$0$119,821$116,498TownshipNorman
3.1%$2,207$73,035$0$73,0352.9%$1,964$70,828$0$70,828$68,864TownshipOnekama
3.1%$1,967$65,079$0$65,0792.9%$1,750$63,112$0$63,112$61,362TownshipPleasanton
3.1%$1,878$62,135$0$62,1352.9%$1,670$60,257$0$60,257$58,587TownshipSpringdale
3.1%$1,974$65,318$0$65,3182.9%$1,757$63,344$0$63,344$61,587TownshipStronach
2.3%$14,970$660,672$165,337$495,3352.9%$18,223$645,702$165,337$480,365$627,479CityManistee
3.1%$687$22,753$0$22,7532.9%$613$22,066$0$22,066$21,453VillageBear Lake
3.1%$466$15,434$0$15,4342.9%$415$14,968$0$14,968$14,553VillageCopemish
3.1%$1,231$40,734$0$40,7342.9%$1,095$39,503$0$39,503$38,408VillageEastlake
3.1%$1,130$37,392$0$37,3922.9%$1,005$36,262$0$36,262$35,257VillageKaleva
3.1%$988$32,698$0$32,6982.9%$879$31,710$0$31,710$30,831VillageOnekama
06/03/15 Prepared by The House Fiscal Agency Page 32

Revenue Sharing Payments to Cities, Villages, and TownshipsFinal FY 2013-14, Estimated FY 2014-15, and Estimated FY 2015-16 Based on SB 133 (S-1) CR-1
FY 2015-16FY 2014-15FY 2013-14
Change from FY 2014-15TotalEligibleEstimatedChange from FY 2013-14TotalEligibleEstimatedTotal
CombinedCVTConstitutionalCombinedCVTConstitutionalCombinedLocal Unit
PercentDollarPaymentPaymentPaymentPercentDollarPaymentPaymentPaymentPaymentTypeLocal Unit Name
Marquette County
3.1%$715$23,629$0$23,6292.9%$635$22,914$0$22,914$22,279TownshipChampion
3.1%$14,194$469,638$0$469,6382.9%$12,630$455,444$0$455,444$442,814TownshipChocolay
3.1%$4,693$155,299$0$155,2992.9%$4,178$150,606$0$150,606$146,428TownshipEly
3.1%$385$12,729$0$12,7292.8%$341$12,344$0$12,344$12,003TownshipEwing
2.7%$14,822$561,025$70,622$490,4032.9%$15,281$546,203$70,622$475,581$530,922TownshipForsyth
3.1%$1,116$36,915$0$36,9152.9%$992$35,799$0$35,799$34,807TownshipHumboldt
3.1%$8,447$279,491$0$279,4912.9%$7,516$271,044$0$271,044$263,528TownshipIshpeming
3.1%$9,389$310,678$0$310,6782.9%$8,355$301,289$0$301,289$292,934TownshipMarquette
3.1%$839$27,766$0$27,7662.8%$746$26,927$0$26,927$26,181TownshipMichigamme
3.1%$7,426$245,679$0$245,6792.9%$6,606$238,253$0$238,253$231,647TownshipNegaunee
3.1%$1,962$64,920$0$64,9202.9%$1,745$62,958$0$62,958$61,213TownshipPowell
3.1%$2,548$84,332$0$84,3322.9%$2,268$81,784$0$81,784$79,516TownshipRepublic
3.1%$2,121$70,171$0$70,1712.9%$1,887$68,050$0$68,050$66,163TownshipRichmond
3.1%$5,494$181,792$0$181,7922.9%$4,888$176,298$0$176,298$171,410TownshipSands
3.1%$1,986$65,715$0$65,7152.9%$1,767$63,729$0$63,729$61,962TownshipSkandia
3.1%$2,436$80,593$0$80,5932.9%$2,167$78,157$0$78,157$75,990TownshipTilden
3.1%$368$12,172$0$12,1722.8%$327$11,804$0$11,804$11,477TownshipTurin
3.1%$556$18,378$0$18,3782.9%$494$17,822$0$17,822$17,328TownshipWells
3.1%$3,902$129,124$0$129,1242.9%$3,473$125,222$0$125,222$121,749TownshipWest Branch
1.9%$15,557$834,800$320,052$514,7482.9%$23,327$819,243$320,052$499,191$795,916CityIshpeming
2.5%$49,739$2,002,806$357,044$1,645,7622.9%$54,840$1,953,067$357,044$1,596,023$1,898,227CityMarquette
2.2%$10,984$517,116$153,690$363,4262.9%$14,329$506,132$153,690$352,442$491,803CityNegaunee
Mason County
3.1%$6,095$201,682$0$201,6822.9%$5,423$195,587$0$195,587$190,164TownshipAmber
3.1%$3,193$105,654$0$105,6542.9%$2,840$102,461$0$102,461$99,621TownshipBranch
3.1%$2,332$77,172$0$77,1722.9%$2,076$74,840$0$74,840$72,764TownshipCuster
3.1%$1,399$46,303$0$46,3032.9%$1,245$44,904$0$44,904$43,659TownshipEden
3.1%$1,631$53,941$0$53,9412.9%$1,450$52,310$0$52,310$50,860TownshipFreesoil
3.1%$2,186$72,319$0$72,3192.9%$1,946$70,133$0$70,133$68,187TownshipGrant
3.1%$8,194$271,137$0$271,1372.9%$7,291$262,943$0$262,943$255,652TownshipHamlin
3.1%$750$24,822$0$24,8222.9%$668$24,072$0$24,072$23,404TownshipLogan
3.1%$435$14,400$0$14,4002.9%$388$13,965$0$13,965$13,577TownshipMeade
3.1%$5,689$188,237$0$188,2372.9%$5,063$182,548$0$182,548$177,485TownshipPere Marquette
3.1%$2,772$91,731$0$91,7312.9%$2,467$88,959$0$88,959$86,492TownshipRiverton
3.1%$2,578$85,287$0$85,2872.9%$2,294$82,709$0$82,709$80,415TownshipSheridan
3.1%$2,388$79,002$0$79,0022.9%$2,124$76,614$0$76,614$74,490TownshipSherman
3.1%$2,222$73,512$0$73,5122.9%$1,977$71,290$0$71,290$69,313TownshipSummit
3.1%$3,325$110,030$0$110,0302.9%$2,959$106,705$0$106,705$103,746TownshipVictory
2.6%$19,349$772,889$132,676$640,2132.9%$21,149$753,540$132,676$620,864$732,391CityLudington
2.1%$2,919$140,603$44,019$96,5842.9%$3,901$137,684$44,019$93,665$133,783CityScottville
3.1%$683$22,594$0$22,5942.8%$607$21,911$0$21,911$21,304VillageCuster
3.1%$464$15,354$0$15,3542.8%$411$14,890$0$14,890$14,479VillageFountain
3.1%$346$11,456$0$11,4562.8%$307$11,110$0$11,110$10,803VillageFreesoil
06/03/15 Prepared by The House Fiscal Agency Page 33

Revenue Sharing Payments to Cities, Villages, and TownshipsFinal FY 2013-14, Estimated FY 2014-15, and Estimated FY 2015-16 Based on SB 133 (S-1) CR-1
FY 2015-16FY 2014-15FY 2013-14
Change from FY 2014-15TotalEligibleEstimatedChange from FY 2013-14TotalEligibleEstimatedTotal
CombinedCVTConstitutionalCombinedCVTConstitutionalCombinedLocal Unit
PercentDollarPaymentPaymentPaymentPercentDollarPaymentPaymentPaymentPaymentTypeLocal Unit Name
Mecosta County
3.1%$4,792$158,561$0$158,5612.9%$4,264$153,769$0$153,769$149,505TownshipAetna
3.1%$3,754$124,192$0$124,1922.9%$3,339$120,438$0$120,438$117,099TownshipAustin
3.1%$10,118$334,785$0$334,7852.9%$9,004$324,667$0$324,667$315,663TownshipBig Rapids
3.1%$2,914$96,425$0$96,4252.9%$2,592$93,511$0$93,511$90,919TownshipChippewa
3.1%$4,648$153,788$0$153,7882.9%$4,137$149,140$0$149,140$145,003TownshipColfax
3.1%$3,917$129,602$0$129,6022.9%$3,485$125,685$0$125,685$122,200TownshipDeerfield
3.1%$3,003$99,369$0$99,3692.9%$2,673$96,366$0$96,366$93,693TownshipFork
3.1%$1,649$54,577$0$54,5772.9%$1,468$52,928$0$52,928$51,460TownshipGrant
3.1%$7,916$261,909$0$261,9092.9%$7,045$253,993$0$253,993$246,948TownshipGreen
3.1%$2,707$89,583$0$89,5832.9%$2,409$86,876$0$86,876$84,467TownshipHinton
3.1%$3,907$129,283$0$129,2832.9%$3,476$125,376$0$125,376$121,900TownshipMartiny
3.1%$5,780$191,260$0$191,2602.9%$5,143$185,480$0$185,480$180,337TownshipMecosta
3.1%$2,676$88,549$0$88,5492.9%$2,382$85,873$0$85,873$83,491TownshipMillbrook
3.1%$9,267$306,621$0$306,6212.9%$8,246$297,354$0$297,354$289,108TownshipMorton
3.1%$3,350$110,826$0$110,8262.9%$2,980$107,476$0$107,476$104,496TownshipSheridan
3.1%$3,373$111,621$0$111,6212.9%$3,002$108,248$0$108,248$105,246TownshipWheatland
2.1%$25,402$1,253,117$412,653$840,4642.9%$34,829$1,227,715$412,653$815,062$1,192,886CityBig Rapids
2.7%$854$32,462$4,219$28,2432.9%$886$31,608$4,219$27,389$30,722VillageBarryton
3.1%$1,099$36,358$0$36,3582.8%$976$35,259$0$35,259$34,283VillageMecosta
2.6%$1,185$46,135$6,913$39,2222.9%$1,261$44,950$6,913$38,037$43,689VillageMorley
3.1%$508$16,787$0$16,7872.8%$451$16,279$0$16,279$15,828VillageStanwood
Menominee County
3.1%$608$20,128$0$20,1282.9%$541$19,520$0$19,520$18,979TownshipCedarville
3.1%$1,097$36,279$0$36,2792.9%$975$35,182$0$35,182$34,207TownshipDaggett
3.1%$584$19,332$0$19,3322.8%$519$18,748$0$18,748$18,229TownshipFaithorn
3.1%$1,010$33,414$0$33,4142.9%$899$32,404$0$32,404$31,505TownshipGourley
3.1%$4,732$156,572$0$156,5722.9%$4,211$151,840$0$151,840$147,629TownshipHarris
3.1%$806$26,652$0$26,6522.8%$715$25,846$0$25,846$25,131TownshipHolmes
3.1%$2,248$74,387$0$74,3872.9%$2,000$72,139$0$72,139$70,139TownshipIngallston
3.1%$1,336$44,234$0$44,2342.9%$1,190$42,898$0$42,898$41,708TownshipLake
3.1%$2,766$91,493$0$91,4932.9%$2,460$88,727$0$88,727$86,267TownshipMellen
3.1%$8,387$277,502$0$277,5022.9%$7,462$269,115$0$269,115$261,653TownshipMenominee
3.1%$2,407$79,638$0$79,6382.9%$2,141$77,231$0$77,231$75,090TownshipMeyer
3.1%$2,330$77,092$0$77,0922.9%$2,072$74,762$0$74,762$72,690TownshipNadeau
3.1%$3,011$99,608$0$99,6082.9%$2,679$96,597$0$96,597$93,918TownshipSpalding
3.1%$1,611$53,304$0$53,3042.9%$1,433$51,693$0$51,693$50,260TownshipStephenson
2.1%$20,648$995,581$312,406$683,1752.9%$27,629$974,933$312,406$662,527$947,304CityMenominee
2.9%$2,073$73,093$4,513$68,5802.9%$1,979$71,020$4,513$66,507$69,041CityStephenson
3.1%$462$15,275$0$15,2752.9%$411$14,813$0$14,813$14,402VillageCarney
3.1%$621$20,526$0$20,5262.8%$551$19,905$0$19,905$19,354VillageDaggett
3.1%$1,015$33,574$0$33,5742.9%$903$32,559$0$32,559$31,656VillagePowers
06/03/15 Prepared by The House Fiscal Agency Page 34

Revenue Sharing Payments to Cities, Villages, and TownshipsFinal FY 2013-14, Estimated FY 2014-15, and Estimated FY 2015-16 Based on SB 133 (S-1) CR-1
FY 2015-16FY 2014-15FY 2013-14
Change from FY 2014-15TotalEligibleEstimatedChange from FY 2013-14TotalEligibleEstimatedTotal
CombinedCVTConstitutionalCombinedCVTConstitutionalCombinedLocal Unit
PercentDollarPaymentPaymentPaymentPercentDollarPaymentPaymentPaymentPaymentTypeLocal Unit Name
Midland County
3.1%$6,134$202,955$0$202,9552.9%$5,458$196,821$0$196,821$191,363TownshipEdenville
3.1%$2,539$84,014$0$84,0142.9%$2,259$81,475$0$81,475$79,216TownshipGeneva
3.1%$4,211$139,308$0$139,3082.9%$3,746$135,097$0$135,097$131,351TownshipGreendale
3.1%$9,640$318,953$0$318,9532.9%$8,578$309,313$0$309,313$300,735TownshipHomer
3.1%$3,273$108,280$0$108,2802.9%$2,911$105,007$0$105,007$102,096TownshipHope
3.1%$6,615$218,867$0$218,8672.9%$5,886$212,252$0$212,252$206,366TownshipIngersoll
3.1%$2,837$93,879$0$93,8792.9%$2,524$91,042$0$91,042$88,518TownshipJasper
3.1%$9,466$313,224$0$313,2242.9%$8,423$303,758$0$303,758$295,335TownshipJerome
3.1%$12,350$408,616$0$408,6162.9%$10,989$396,266$0$396,266$385,277TownshipLarkin
3.1%$10,376$343,298$0$343,2982.9%$9,232$332,922$0$332,922$323,690TownshipLee
3.1%$5,949$196,829$0$196,8292.9%$5,293$190,880$0$190,880$185,587TownshipLincoln
3.1%$5,500$181,952$0$181,9522.9%$4,893$176,452$0$176,452$171,559TownshipMidland
3.1%$4,662$154,265$0$154,2652.9%$4,148$149,603$0$149,603$145,455TownshipMills
3.1%$4,035$133,500$0$133,5002.9%$3,590$129,465$0$129,465$125,875TownshipMt Haley
3.1%$3,071$101,597$0$101,5972.9%$2,732$98,526$0$98,526$95,794TownshipPorter
3.1%$5,096$168,586$0$168,5862.9%$4,534$163,490$0$163,490$158,956TownshipWarren
2.1%$2,989$144,180$45,288$98,8922.9%$4,003$141,191$45,288$95,903$137,188CityColeman
2.9%$100,521$3,540,283$214,308$3,325,9752.9%$95,802$3,439,762$214,308$3,225,454$3,343,960CityMidland
3.1%$2,066$68,341$0$68,3412.9%$1,838$66,275$0$66,275$64,437VillageSanford
Missaukee County
3.1%$993$32,857$0$32,8572.8%$881$31,864$0$31,864$30,983TownshipAetna
3.1%$1,276$42,245$0$42,2452.9%$1,137$40,969$0$40,969$39,832TownshipBloomfield
3.1%$1,176$38,904$0$38,9042.9%$1,046$37,728$0$37,728$36,682TownshipButterfield
3.1%$3,167$104,779$0$104,7792.9%$2,817$101,612$0$101,612$98,795TownshipCaldwell
3.1%$2,121$70,171$0$70,1712.9%$1,887$68,050$0$68,050$66,163TownshipClam Union
3.1%$466$15,434$0$15,4342.9%$415$14,968$0$14,968$14,553TownshipEnterprise
3.1%$2,782$92,050$0$92,0502.9%$2,476$89,268$0$89,268$86,792TownshipForest
3.1%$596$19,730$0$19,7302.9%$532$19,134$0$19,134$18,602TownshipHolland
3.1%$6,732$222,765$0$222,7652.9%$5,992$216,033$0$216,033$210,041TownshipLake
3.1%$1,469$48,610$0$48,6102.8%$1,306$47,141$0$47,141$45,835TownshipNorwich
3.1%$1,085$35,881$0$35,8812.8%$964$34,796$0$34,796$33,832TownshipPioneer
3.1%$2,712$89,742$0$89,7422.9%$2,413$87,030$0$87,030$84,617TownshipReeder
3.1%$3,585$118,622$0$118,6222.9%$3,190$115,037$0$115,037$111,847TownshipRichland
3.1%$2,835$93,800$0$93,8002.9%$2,522$90,965$0$90,965$88,443TownshipRiverside
3.1%$1,120$37,074$0$37,0742.9%$997$35,954$0$35,954$34,957TownshipWest Branch
2.8%$1,962$72,224$7,304$64,9202.9%$1,963$70,262$7,304$62,958$68,299CityLake City
2.9%$1,577$56,324$4,134$52,1902.9%$1,526$54,747$4,134$50,613$53,221CityMcbain
06/03/15 Prepared by The House Fiscal Agency Page 35
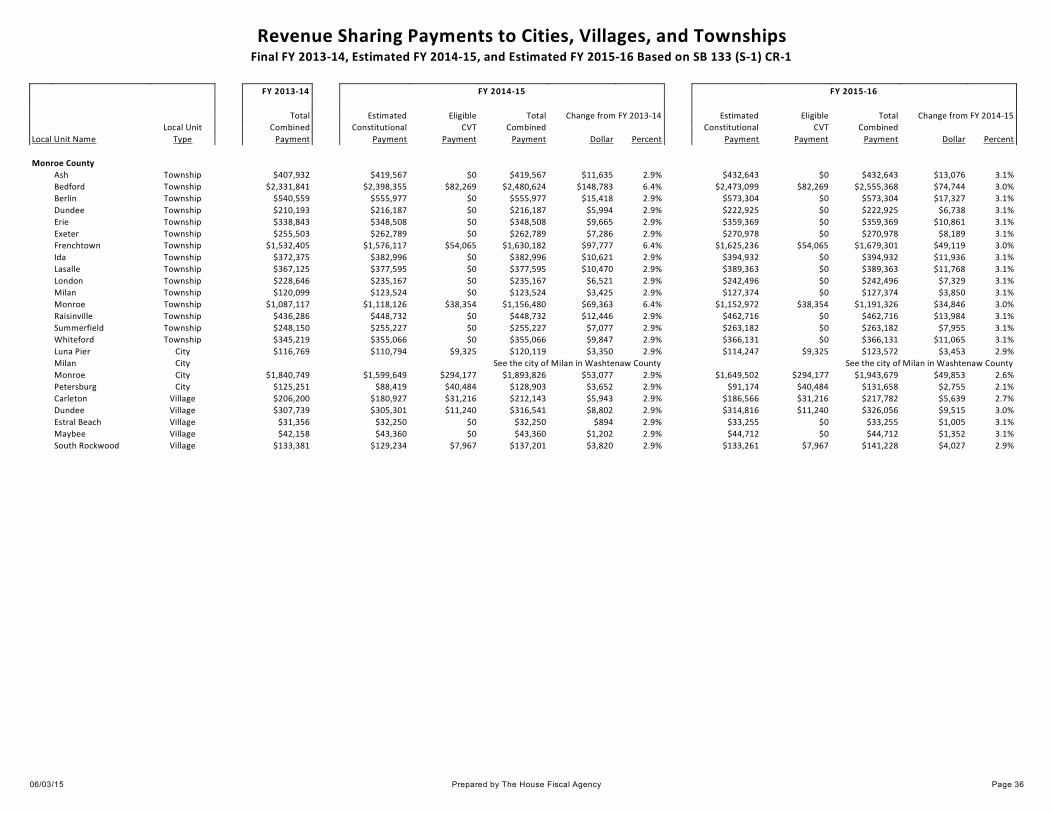
Revenue Sharing Payments to Cities, Villages, and TownshipsFinal FY 2013-14, Estimated FY 2014-15, and Estimated FY 2015-16 Based on SB 133 (S-1) CR-1
FY 2015-16FY 2014-15FY 2013-14
Change from FY 2014-15TotalEligibleEstimatedChange from FY 2013-14TotalEligibleEstimatedTotal
CombinedCVTConstitutionalCombinedCVTConstitutionalCombinedLocal Unit
PercentDollarPaymentPaymentPaymentPercentDollarPaymentPaymentPaymentPaymentTypeLocal Unit Name
Monroe County
3.1%$13,076$432,643$0$432,6432.9%$11,635$419,567$0$419,567$407,932TownshipAsh
3.0%$74,744$2,555,368$82,269$2,473,0996.4%$148,783$2,480,624$82,269$2,398,355$2,331,841TownshipBedford
3.1%$17,327$573,304$0$573,3042.9%$15,418$555,977$0$555,977$540,559TownshipBerlin
3.1%$6,738$222,925$0$222,9252.9%$5,994$216,187$0$216,187$210,193TownshipDundee
3.1%$10,861$359,369$0$359,3692.9%$9,665$348,508$0$348,508$338,843TownshipErie
3.1%$8,189$270,978$0$270,9782.9%$7,286$262,789$0$262,789$255,503TownshipExeter
3.0%$49,119$1,679,301$54,065$1,625,2366.4%$97,777$1,630,182$54,065$1,576,117$1,532,405TownshipFrenchtown
3.1%$11,936$394,932$0$394,9322.9%$10,621$382,996$0$382,996$372,375TownshipIda
3.1%$11,768$389,363$0$389,3632.9%$10,470$377,595$0$377,595$367,125TownshipLasalle
3.1%$7,329$242,496$0$242,4962.9%$6,521$235,167$0$235,167$228,646TownshipLondon
3.1%$3,850$127,374$0$127,3742.9%$3,425$123,524$0$123,524$120,099TownshipMilan
3.0%$34,846$1,191,326$38,354$1,152,9726.4%$69,363$1,156,480$38,354$1,118,126$1,087,117TownshipMonroe
3.1%$13,984$462,716$0$462,7162.9%$12,446$448,732$0$448,732$436,286TownshipRaisinville
3.1%$7,955$263,182$0$263,1822.9%$7,077$255,227$0$255,227$248,150TownshipSummerfield
3.1%$11,065$366,131$0$366,1312.9%$9,847$355,066$0$355,066$345,219TownshipWhiteford
2.9%$3,453$123,572$9,325$114,2472.9%$3,350$120,119$9,325$110,794$116,769CityLuna Pier
See the city of Milan in Washtenaw CountySee the city of Milan in Washtenaw CountyCityMilan
2.6%$49,853$1,943,679$294,177$1,649,5022.9%$53,077$1,893,826$294,177$1,599,649$1,840,749CityMonroe
2.1%$2,755$131,658$40,484$91,1742.9%$3,652$128,903$40,484$88,419$125,251CityPetersburg
2.7%$5,639$217,782$31,216$186,5662.9%$5,943$212,143$31,216$180,927$206,200VillageCarleton
3.0%$9,515$326,056$11,240$314,8162.9%$8,802$316,541$11,240$305,301$307,739VillageDundee
3.1%$1,005$33,255$0$33,2552.9%$894$32,250$0$32,250$31,356VillageEstral Beach
3.1%$1,352$44,712$0$44,7122.9%$1,202$43,360$0$43,360$42,158VillageMaybee
2.9%$4,027$141,228$7,967$133,2612.9%$3,820$137,201$7,967$129,234$133,381VillageSouth Rockwood
06/03/15 Prepared by The House Fiscal Agency Page 36

Revenue Sharing Payments to Cities, Villages, and TownshipsFinal FY 2013-14, Estimated FY 2014-15, and Estimated FY 2015-16 Based on SB 133 (S-1) CR-1
FY 2015-16FY 2014-15FY 2013-14
Change from FY 2014-15TotalEligibleEstimatedChange from FY 2013-14TotalEligibleEstimatedTotal
CombinedCVTConstitutionalCombinedCVTConstitutionalCombinedLocal Unit
PercentDollarPaymentPaymentPaymentPercentDollarPaymentPaymentPaymentPaymentTypeLocal Unit Name
Montcalm County
3.1%$5,312$175,746$0$175,7462.9%$4,726$170,434$0$170,434$165,708TownshipBelvidere
3.1%$6,391$211,468$0$211,4682.9%$5,687$205,077$0$205,077$199,390TownshipBloomer
3.1%$3,797$125,624$0$125,6242.9%$3,378$121,827$0$121,827$118,449TownshipBushnell
3.1%$4,155$137,478$0$137,4782.9%$3,698$133,323$0$133,323$129,625TownshipCato
3.1%$6,465$213,934$0$213,9342.9%$5,753$207,469$0$207,469$201,716TownshipCrystal
3.1%$2,325$76,933$0$76,9332.8%$2,067$74,608$0$74,608$72,541TownshipDay
3.1%$5,242$173,439$0$173,4392.9%$4,664$168,197$0$168,197$163,533TownshipDouglass
3.1%$9,520$314,975$0$314,9752.9%$8,472$305,455$0$305,455$296,983TownshipEureka
3.1%$5,771$190,942$0$190,9422.9%$5,135$185,171$0$185,171$180,036TownshipEvergreen
3.1%$4,408$145,832$0$145,8322.9%$3,920$141,424$0$141,424$137,504TownshipFairplains
3.1%$3,419$113,133$0$113,1332.9%$3,043$109,714$0$109,714$106,671TownshipFerris
3.1%$3,224$106,688$0$106,6882.9%$2,870$103,464$0$103,464$100,594TownshipHome
3.1%$4,675$154,663$0$154,6632.9%$4,159$149,988$0$149,988$145,829TownshipMaple Valley
3.1%$8,055$266,523$0$266,5232.9%$7,168$258,468$0$258,468$251,300TownshipMontcalm
3.1%$7,319$242,178$0$242,1782.9%$6,514$234,859$0$234,859$228,345TownshipPierson
3.1%$4,410$145,911$0$145,9112.9%$3,924$141,501$0$141,501$137,577TownshipPine
3.1%$8,421$278,616$0$278,6162.9%$7,492$270,195$0$270,195$262,703TownshipReynolds
3.1%$6,680$221,015$0$221,0152.9%$5,942$214,335$0$214,335$208,393TownshipRichland
3.1%$5,797$191,817$0$191,8172.9%$5,159$186,020$0$186,020$180,861TownshipSidney
3.1%$5,374$177,814$0$177,8142.9%$4,783$172,440$0$172,440$167,657TownshipWinfield
2.3%$2,628$118,259$31,301$86,9582.9%$3,269$115,631$31,301$84,330$112,362CityCarson City
2.7%$20,393$783,535$108,793$674,7422.9%$21,370$763,142$108,793$654,349$741,772CityGreenville
2.4%$3,191$138,387$32,812$105,5752.9%$3,811$135,196$32,812$102,384$131,385CityStanton
2.6%$2,888$113,954$18,404$95,5502.9%$3,114$111,066$18,404$92,662$107,952VillageEdmore
2.9%$4,348$153,921$10,078$143,8432.9%$4,169$149,573$10,078$139,495$145,404VillageHoward City
2.4%$2,422$105,230$25,114$80,1162.9%$2,899$102,808$25,114$77,694$99,909VillageLakeview
3.1%$493$16,309$0$16,3092.8%$438$15,816$0$15,816$15,378VillageMcbride
3.1%$414$13,684$0$13,6842.8%$367$13,270$0$13,270$12,903VillagePierson
2.6%$1,560$61,324$9,691$51,6332.9%$1,676$59,764$9,691$50,073$58,088VillageSheridan
Montmorency County
3.1%$6,074$200,966$0$200,9662.9%$5,403$194,892$0$194,892$189,489TownshipAlbert
3.1%$1,554$51,395$0$51,3952.8%$1,381$49,841$0$49,841$48,460TownshipAvery
3.1%$4,439$146,866$0$146,8662.9%$3,950$142,427$0$142,427$138,477TownshipBriley
3.1%$3,554$117,588$0$117,5882.9%$3,162$114,034$0$114,034$110,872TownshipHillman
3.1%$704$23,310$0$23,3102.9%$627$22,606$0$22,606$21,979TownshipLoud
3.1%$2,686$88,867$0$88,8672.9%$2,389$86,181$0$86,181$83,792TownshipMontmorency
3.1%$1,349$44,632$0$44,6322.8%$1,199$43,283$0$43,283$42,084TownshipRust
3.1%$1,412$46,701$0$46,7012.9%$1,256$45,289$0$45,289$44,033TownshipVienna
2.9%$1,686$60,476$4,705$55,7712.9%$1,641$58,790$4,705$54,085$57,149VillageHillman
06/03/15 Prepared by The House Fiscal Agency Page 37

Revenue Sharing Payments to Cities, Villages, and TownshipsFinal FY 2013-14, Estimated FY 2014-15, and Estimated FY 2015-16 Based on SB 133 (S-1) CR-1
FY 2015-16FY 2014-15FY 2013-14
Change from FY 2014-15TotalEligibleEstimatedChange from FY 2013-14TotalEligibleEstimatedTotal
CombinedCVTConstitutionalCombinedCVTConstitutionalCombinedLocal Unit
PercentDollarPaymentPaymentPaymentPercentDollarPaymentPaymentPaymentPaymentTypeLocal Unit Name
Muskegon County
3.1%$5,768$190,862$0$190,8622.9%$5,133$185,094$0$185,094$179,961TownshipBlue Lake
3.1%$6,401$211,786$0$211,7862.9%$5,696$205,385$0$205,385$199,689TownshipCasnovia
3.1%$7,660$253,475$0$253,4752.9%$6,816$245,815$0$245,815$238,999TownshipCedar Creek
3.0%$19,258$658,387$21,197$637,1906.4%$38,333$639,129$21,197$617,932$600,796TownshipDalton
3.0%$23,826$814,577$26,225$788,3524.0%$30,250$790,751$26,225$764,526$760,501TownshipEgelston
3.1%$13,329$440,997$0$440,9972.9%$11,859$427,668$0$427,668$415,809TownshipFruitland
3.0%$30,068$1,027,984$33,096$994,8886.4%$59,854$997,916$33,096$964,820$938,062TownshipFruitport
3.1%$6,047$200,091$0$200,0912.9%$5,381$194,044$0$194,044$188,663TownshipHolton
3.0%$18,185$621,722$20,016$601,7066.4%$36,199$603,537$20,016$583,521$567,338TownshipLaketon
3.1%$3,847$127,294$0$127,2942.9%$3,423$123,447$0$123,447$120,024TownshipMontague
3.1%$3,787$125,305$0$125,3052.9%$3,369$121,518$0$121,518$118,149TownshipMoorland
2.8%$42,897$1,588,189$168,852$1,419,3372.9%$43,177$1,545,292$168,852$1,376,440$1,502,115TownshipMuskegon
3.1%$4,054$134,136$0$134,1362.9%$3,606$130,082$0$130,082$126,476TownshipRavenna
3.1%$5,870$194,204$0$194,2042.9%$5,222$188,334$0$188,334$183,112TownshipSullivan
3.1%$4,181$138,353$0$138,3532.9%$3,721$134,172$0$134,172$130,451TownshipWhitehall
3.1%$3,210$106,211$0$106,2112.9%$2,855$103,001$0$103,001$100,146TownshipWhite River
2.7%$5,677$213,206$25,367$187,8392.9%$5,804$207,529$25,367$182,162$201,725CityMontague
2.2%$87,492$4,011,658$1,116,736$2,894,9222.9%$110,945$3,924,166$1,116,736$2,807,430$3,813,221CityMuskegon
1.8%$26,103$1,450,433$586,738$863,6952.9%$40,612$1,424,330$586,738$837,592$1,383,718CityMuskegon Heights
2.9%$9,104$319,840$18,629$301,2112.9%$8,655$310,736$18,629$292,107$302,081CityNorth Muskegon
3.0%$57,694$1,972,447$63,502$1,908,9454.5%$81,660$1,914,753$63,502$1,851,251$1,833,093CityNorton Shores
2.9%$9,212$331,916$27,125$304,7912.9%$9,000$322,704$27,125$295,579$313,704CityRoosevelt Park
2.5%$6,507$271,296$56,009$215,2872.9%$7,450$264,789$56,009$208,780$257,339CityWhitehall
See the village of Casnovia in Kent CountySee the village of Casnovia in Kent CountyVillageCasnovia
2.9%$2,628$91,843$4,885$86,9582.9%$2,485$89,215$4,885$84,330$86,730VillageFruitport
2.9%$3,105$110,099$7,388$102,7112.9%$2,983$106,994$7,388$99,606$104,011VillageLakewood Club
3.0%$2,931$100,778$3,796$96,9822.9%$2,720$97,847$3,796$94,051$95,127VillageRavenna
06/03/15 Prepared by The House Fiscal Agency Page 38

Revenue Sharing Payments to Cities, Villages, and TownshipsFinal FY 2013-14, Estimated FY 2014-15, and Estimated FY 2015-16 Based on SB 133 (S-1) CR-1
FY 2015-16FY 2014-15FY 2013-14
Change from FY 2014-15TotalEligibleEstimatedChange from FY 2013-14TotalEligibleEstimatedTotal
CombinedCVTConstitutionalCombinedCVTConstitutionalCombinedLocal Unit
PercentDollarPaymentPaymentPaymentPercentDollarPaymentPaymentPaymentPaymentTypeLocal Unit Name
Newaygo County
3.1%$6,667$220,617$0$220,6172.9%$5,935$213,950$0$213,950$208,015TownshipAshland
3.1%$1,724$57,043$0$57,0432.9%$1,533$55,319$0$55,319$53,786TownshipBarton
3.1%$1,224$40,495$0$40,4952.8%$1,088$39,271$0$39,271$38,183TownshipBeaver
3.1%$6,186$204,705$0$204,7052.9%$5,505$198,519$0$198,519$193,014TownshipBig Prairie
3.1%$5,148$170,336$0$170,3362.9%$4,581$165,188$0$165,188$160,607TownshipBridgeton
3.1%$8,440$279,253$0$279,2532.9%$7,511$270,813$0$270,813$263,302TownshipBrooks
3.1%$7,762$256,817$0$256,8172.9%$6,907$249,055$0$249,055$242,148TownshipCroton
3.1%$4,687$155,061$0$155,0612.9%$4,170$150,374$0$150,374$146,204TownshipDayton
3.1%$3,821$126,419$0$126,4192.9%$3,398$122,598$0$122,598$119,200TownshipDenver
3.1%$6,336$209,638$0$209,6382.9%$5,638$203,302$0$203,302$197,664TownshipEnsley
3.1%$4,477$148,139$0$148,1392.9%$3,984$143,662$0$143,662$139,678TownshipEverett
3.1%$6,100$201,841$0$201,8412.9%$5,428$195,741$0$195,741$190,313TownshipGarfield
3.1%$1,315$43,518$0$43,5182.9%$1,170$42,203$0$42,203$41,033TownshipGoodwell
3.1%$7,921$262,068$0$262,0682.9%$7,048$254,147$0$254,147$247,099TownshipGrant
3.1%$558$18,457$0$18,4572.9%$496$17,899$0$17,899$17,403TownshipHome
3.1%$1,916$63,408$0$63,4082.9%$1,705$61,492$0$61,492$59,787TownshipLilley
3.1%$3,066$101,438$0$101,4382.9%$2,729$98,372$0$98,372$95,643TownshipLincoln
3.1%$1,604$53,066$0$53,0662.8%$1,426$51,462$0$51,462$50,036TownshipMerrill
3.1%$769$25,458$0$25,4582.8%$684$24,689$0$24,689$24,005TownshipMonroe
3.1%$1,460$48,292$0$48,2922.9%$1,298$46,832$0$46,832$45,534TownshipNorwich
3.1%$6,035$199,693$0$199,6932.9%$5,371$193,658$0$193,658$188,287TownshipSheridan
3.1%$5,071$167,790$0$167,7902.9%$4,511$162,719$0$162,719$158,208TownshipSherman
3.1%$681$22,515$0$22,5152.8%$604$21,834$0$21,834$21,230TownshipTroy
3.1%$2,641$87,356$0$87,3562.9%$2,348$84,715$0$84,715$82,367TownshipWilcox
2.6%$9,813$385,187$60,506$324,6812.9%$10,525$375,374$60,506$314,868$364,849CityFremont
2.3%$2,149$94,488$23,363$71,1252.9%$2,603$92,339$23,363$68,976$89,736CityGrant
2.7%$4,752$183,231$26,022$157,2092.9%$4,998$178,479$26,022$152,457$173,481CityNewaygo
2.3%$3,154$143,110$38,729$104,3812.9%$3,956$139,956$38,729$101,227$136,000CityWhite Cloud
See the village of Hesperia in Oceania CountySee the village of Hesperia in Oceania CountyVillageHesperia
06/03/15 Prepared by The House Fiscal Agency Page 39

Revenue Sharing Payments to Cities, Villages, and TownshipsFinal FY 2013-14, Estimated FY 2014-15, and Estimated FY 2015-16 Based on SB 133 (S-1) CR-1
FY 2015-16FY 2014-15FY 2013-14
Change from FY 2014-15TotalEligibleEstimatedChange from FY 2013-14TotalEligibleEstimatedTotal
CombinedCVTConstitutionalCombinedCVTConstitutionalCombinedLocal Unit
PercentDollarPaymentPaymentPaymentPercentDollarPaymentPaymentPaymentPaymentTypeLocal Unit Name
Oakland County
3.1%$14,302$473,218$0$473,2182.9%$12,727$458,916$0$458,916$446,189TownshipAddison
3.0%$98,754$3,376,194$108,695$3,267,4996.2%$190,301$3,277,440$108,695$3,168,745$3,087,139TownshipBloomfield
3.0%$33,021$1,128,933$36,346$1,092,5876.4%$65,731$1,095,912$36,346$1,059,566$1,030,181TownshipBrandon
3.0%$86,260$2,949,053$94,944$2,854,1096.4%$171,704$2,862,793$94,944$2,767,849$2,691,089TownshipCommerce
3.1%$13,167$435,666$0$435,6662.9%$11,717$422,499$0$422,499$410,782TownshipGroveland
3.0%$46,172$1,578,517$50,820$1,527,6976.4%$91,907$1,532,345$50,820$1,481,525$1,440,438TownshipHighland
3.1%$12,686$419,754$0$419,7542.9%$11,288$407,068$0$407,068$395,780TownshipHolly
3.0%$83,390$2,850,980$91,786$2,759,1946.4%$165,995$2,767,590$91,786$2,675,804$2,601,595TownshipIndependence
3.0%$34,974$1,195,684$38,495$1,157,1896.4%$69,616$1,160,710$38,495$1,122,215$1,091,094TownshipLyon
3.0%$22,990$785,970$25,304$760,6666.4%$45,762$762,980$25,304$737,676$717,218TownshipMilford
3.1%$360$11,933$0$11,9332.9%$321$11,573$0$11,573$11,252TownshipNovi
3.0%$40,345$1,379,331$44,407$1,334,9246.4%$80,309$1,338,986$44,407$1,294,579$1,258,677TownshipOakland
3.0%$77,956$2,665,195$85,805$2,579,3906.4%$155,178$2,587,239$85,805$2,501,434$2,432,061TownshipOrion
3.0%$41,093$1,404,897$45,230$1,359,6676.4%$81,798$1,363,804$45,230$1,318,574$1,282,006TownshipOxford
3.1%$15,028$497,245$0$497,2452.9%$13,374$482,217$0$482,217$468,843TownshipRose
1.2%$5,816$511,483$319,030$192,4533.0%$14,627$505,667$319,030$186,637$491,040TownshipRoyal Oak
3.1%$46$1,511$0$1,5112.8%$40$1,465$0$1,465$1,425TownshipSouthfield
3.0%$33,519$1,145,949$36,893$1,109,0566.4%$66,721$1,112,430$36,893$1,075,537$1,045,709TownshipSpringfield
2.9%$172,420$6,053,790$348,834$5,704,9562.9%$163,770$5,881,370$348,834$5,532,536$5,717,600TownshipWaterford
3.0%$155,547$5,317,896$171,208$5,146,6886.4%$309,629$5,162,349$171,208$4,991,141$4,852,720TownshipWest Bloomfield
3.0%$72,181$2,467,737$79,448$2,388,2896.4%$143,681$2,395,556$79,448$2,316,108$2,251,875TownshipWhite Lake
3.0%$51,267$1,752,711$56,428$1,696,2833.1%$51,112$1,701,444$56,428$1,645,016$1,650,332CityAuburn Hills
2.7%$35,996$1,366,463$175,461$1,191,0022.9%$37,230$1,330,467$175,461$1,155,006$1,293,237CityBerkley
2.8%$48,337$1,789,103$189,724$1,599,3792.9%$48,635$1,740,766$189,724$1,551,042$1,692,131CityBirmingham
3.1%$9,303$307,814$0$307,8142.9%$8,279$298,511$0$298,511$290,232CityBloomfield Hills
2.9%$2,121$75,165$4,994$70,1712.9%$2,036$73,044$4,994$68,050$71,008CityClarkston
2.7%$28,433$1,084,987$144,199$940,7882.9%$29,576$1,056,554$144,199$912,355$1,026,978CityClawson
2.7%$24,939$933,165$107,977$825,1882.9%$25,392$908,226$107,977$800,249$882,834CityFarmington
3.0%$191,735$6,689,682$345,627$6,344,0552.9%$180,866$6,497,947$345,627$6,152,320$6,317,081CityFarmington Hills
See the city of Fenton in Genesee CountySee the city of Fenton in Genesee CountyCityFenton
1.9%$47,850$2,573,089$989,860$1,583,2292.9%$71,905$2,525,239$989,860$1,535,379$2,453,334CityFerndale
2.0%$39,487$2,046,818$740,296$1,306,5222.9%$57,070$2,007,331$740,296$1,267,035$1,950,261CityHazel Park
2.7%$14,999$569,322$73,032$496,2902.9%$15,513$554,323$73,032$481,291$538,810CityHuntington Woods
2.8%$7,142$259,868$23,577$236,2912.9%$7,053$252,726$23,577$229,149$245,673CityKeego Harbor
3.1%$698$23,072$0$23,0722.8%$619$22,374$0$22,374$21,755CityLake Angelus
2.7%$9,799$369,219$45,015$324,2042.9%$10,054$359,420$45,015$314,405$349,366CityLathrup Village
2.5%$71,399$2,877,241$514,809$2,362,4322.9%$78,791$2,805,842$514,809$2,291,033$2,727,051CityMadison Heights
2.7%$14,355$539,928$64,960$474,9682.9%$14,701$525,573$64,960$460,613$510,872CityNorthville
3.0%$132,786$4,539,735$146,155$4,393,5805.7%$236,140$4,406,949$146,155$4,260,794$4,170,809CityNovi
2.2%$70,498$3,296,114$963,516$2,332,5982.9%$91,280$3,225,616$963,516$2,262,100$3,134,336CityOak Park
3.1%$5,711$188,953$0$188,9532.9%$5,081$183,242$0$183,242$178,161CityOrchard Lake Village
2.5%$6,074$247,198$46,232$200,9662.9%$6,773$241,124$46,232$194,892$234,351CityPleasant Ridge
1.5%$141,357$9,563,453$4,886,323$4,677,1303.0%$270,549$9,422,096$4,886,323$4,535,773$9,151,547CityPontiac
3.0%$30,563$1,045,010$33,733$1,011,2772.9%$28,199$1,014,447$33,733$980,714$986,248CityRochester
3.0%$170,708$5,836,205$187,895$5,648,3105.1%$274,080$5,665,497$187,895$5,477,602$5,391,417CityRochester Hills
2.7%$137,625$5,228,121$674,467$4,553,6542.9%$142,453$5,090,496$674,467$4,416,029$4,948,043CityRoyal Oak
2.7%$172,497$6,658,474$950,972$5,707,5022.9%$181,676$6,485,977$950,972$5,535,005$6,304,301CitySouthfield
3.0%$27,236$948,886$47,719$901,1672.9%$25,649$921,650$47,719$873,931$896,001CitySouth Lyon
2.9%$4,135$145,926$9,085$136,8412.9%$3,950$141,791$9,085$132,706$137,841CitySylvan Lake
2.9%$194,717$6,814,144$371,435$6,442,7092.9%$184,282$6,619,427$371,435$6,247,992$6,435,145CityTroy
2.8%$16,829$624,914$68,079$556,8352.9%$16,995$608,085$68,079$540,006$591,090CityWalled Lake
06/03/15 Prepared by The House Fiscal Agency Page 40

Revenue Sharing Payments to Cities, Villages, and TownshipsFinal FY 2013-14, Estimated FY 2014-15, and Estimated FY 2015-16 Based on SB 133 (S-1) CR-1
FY 2015-16FY 2014-15FY 2013-14
Change from FY 2014-15TotalEligibleEstimatedChange from FY 2013-14TotalEligibleEstimatedTotal
CombinedCVTConstitutionalCombinedCVTConstitutionalCombinedLocal Unit
PercentDollarPaymentPaymentPaymentPercentDollarPaymentPaymentPaymentPaymentTypeLocal Unit Name
3.0%$32,456$1,131,294$57,404$1,073,8902.9%$30,584$1,098,838$57,404$1,041,434$1,068,254CityWixom
3.0%$24,687$844,007$27,173$816,8343.0%$23,929$819,320$27,173$792,147$795,391VillageBeverly Hills
3.1%$2,672$88,390$0$88,3902.9%$2,376$85,718$0$85,718$83,342VillageBingham Farms
3.1%$7,574$250,611$0$250,6112.9%$6,740$243,037$0$243,037$236,297VillageFranklin
2.6%$14,634$586,495$102,298$484,1972.9%$16,052$571,861$102,298$469,563$555,809VillageHolly
2.9%$7,148$252,365$15,836$236,5292.9%$6,832$245,217$15,836$229,381$238,385VillageLake Orion
3.1%$969$32,062$0$32,0622.9%$863$31,093$0$31,093$30,230VillageLeonard
2.9%$14,848$529,893$38,615$491,2782.9%$14,356$515,045$38,615$476,430$500,689VillageMilford
3.1%$3,467$114,724$0$114,7242.9%$3,085$111,257$0$111,257$108,172VillageOrtonville
3.1%$8,262$273,365$0$273,3652.9%$7,352$265,103$0$265,103$257,751VillageOxford
3.1%$10,368$347,344$4,285$343,0592.9%$9,353$336,976$4,285$332,691$327,623VillageWolverine Lake
Oceana County
3.1%$3,455$114,326$0$114,3262.9%$3,074$110,871$0$110,871$107,797TownshipBenona
3.1%$1,868$61,817$0$61,8172.9%$1,662$59,949$0$59,949$58,287TownshipClaybanks
3.1%$1,111$36,756$0$36,7562.8%$987$35,645$0$35,645$34,658TownshipColfax
3.1%$2,015$66,670$0$66,6702.9%$1,793$64,655$0$64,655$62,862TownshipCrystal
3.1%$2,335$77,252$0$77,2522.9%$2,076$74,917$0$74,917$72,841TownshipElbridge
3.1%$3,107$102,790$0$102,7902.9%$2,764$99,683$0$99,683$96,919TownshipFerry
3.1%$4,189$138,592$0$138,5922.9%$3,727$134,403$0$134,403$130,676TownshipGolden
3.1%$5,978$197,784$0$197,7842.9%$5,319$191,806$0$191,806$186,487TownshipGrant
3.1%$2,847$94,198$0$94,1982.9%$2,533$91,351$0$91,351$88,818TownshipGreenwood
3.1%$4,456$147,423$0$147,4232.9%$3,965$142,967$0$142,967$139,002TownshipHart
3.1%$1,549$51,236$0$51,2362.9%$1,377$49,687$0$49,687$48,310TownshipLeavitt
3.1%$4,294$142,092$0$142,0922.9%$3,822$137,798$0$137,798$133,976TownshipNewfield
3.1%$1,986$65,715$0$65,7152.9%$1,767$63,729$0$63,729$61,962TownshipOtto
3.1%$1,582$52,349$0$52,3492.9%$1,408$50,767$0$50,767$49,359TownshipPentwater
3.1%$3,873$128,169$0$128,1692.9%$3,445$124,296$0$124,296$120,851TownshipShelby
3.1%$2,909$96,266$0$96,2662.9%$2,590$93,357$0$93,357$90,767TownshipWeare
2.6%$5,054$198,143$30,910$167,2332.9%$5,413$193,089$30,910$162,179$187,676CityHart
2.4%$2,294$96,163$20,264$75,8992.9%$2,642$93,869$20,264$73,605$91,227VillageHesperia
3.1%$1,085$35,881$0$35,8812.8%$964$34,796$0$34,796$33,832VillageNew Era
3.1%$2,061$68,182$0$68,1822.9%$1,835$66,121$0$66,121$64,286VillagePentwater
3.1%$1,039$34,369$0$34,3692.9%$924$33,330$0$33,330$32,406VillageRothbury
2.4%$4,965$210,628$46,339$164,2892.9%$5,793$205,663$46,339$159,324$199,870VillageShelby
2.4%$594$25,000$5,349$19,6512.9%$688$24,406$5,349$19,057$23,718VillageWalkerville
06/03/15 Prepared by The House Fiscal Agency Page 41

Revenue Sharing Payments to Cities, Villages, and TownshipsFinal FY 2013-14, Estimated FY 2014-15, and Estimated FY 2015-16 Based on SB 133 (S-1) CR-1
FY 2015-16FY 2014-15FY 2013-14
Change from FY 2014-15TotalEligibleEstimatedChange from FY 2013-14TotalEligibleEstimatedTotal
CombinedCVTConstitutionalCombinedCVTConstitutionalCombinedLocal Unit
PercentDollarPaymentPaymentPaymentPercentDollarPaymentPaymentPaymentPaymentTypeLocal Unit Name
Ogemaw County
3.1%$4,119$136,285$0$136,2852.9%$3,665$132,166$0$132,166$128,501TownshipChurchill
3.1%$1,678$55,532$0$55,5322.9%$1,494$53,854$0$53,854$52,360TownshipCumming
3.1%$3,398$112,417$0$112,4172.9%$3,023$109,019$0$109,019$105,996TownshipEdwards
3.1%$2,027$67,068$0$67,0682.9%$1,805$65,041$0$65,041$63,236TownshipFoster
3.1%$957$31,664$0$31,6642.8%$850$30,707$0$30,707$29,857TownshipGoodar
3.1%$3,273$108,280$0$108,2802.9%$2,911$105,007$0$105,007$102,096TownshipHill
3.1%$2,229$73,751$0$73,7512.9%$1,983$71,522$0$71,522$69,539TownshipHorton
3.1%$1,476$48,849$0$48,8492.9%$1,315$47,373$0$47,373$46,058TownshipKlacking
3.1%$1,325$43,837$0$43,8372.8%$1,177$42,512$0$42,512$41,335TownshipLogan
3.1%$10,317$341,388$0$341,3882.9%$9,182$331,071$0$331,071$321,889TownshipMills
3.1%$2,940$97,300$0$97,3002.9%$2,618$94,360$0$94,360$91,742TownshipOgemaw
3.1%$1,558$51,554$0$51,5542.9%$1,387$49,996$0$49,996$48,609TownshipRichland
3.1%$3,290$108,837$0$108,8372.9%$2,926$105,547$0$105,547$102,621TownshipRose
3.1%$6,235$206,297$0$206,2972.9%$5,549$200,062$0$200,062$194,513TownshipWest Branch
2.2%$1,570$73,058$21,106$51,9522.9%$2,022$71,488$21,106$50,382$69,466CityRose City
2.7%$5,105$195,448$26,544$168,9042.9%$5,331$190,343$26,544$163,799$185,012CityWest Branch
3.1%$639$21,162$0$21,1622.8%$568$20,523$0$20,523$19,955VillagePrescott
Ontonagon County
3.1%$1,123$37,154$0$37,1542.9%$999$36,031$0$36,031$35,032TownshipBergland
3.1%$197$6,523$0$6,5232.8%$175$6,326$0$6,326$6,151TownshipBohemia
3.1%$1,736$57,441$0$57,4412.9%$1,544$55,705$0$55,705$54,161TownshipCarp Lake
3.1%$1,904$63,010$0$63,0102.9%$1,695$61,106$0$61,106$59,411TownshipGreenland
3.1%$510$16,866$0$16,8662.8%$452$16,356$0$16,356$15,904TownshipHaight
3.1%$808$26,731$0$26,7312.9%$719$25,923$0$25,923$25,204TownshipInterior
3.1%$226$7,478$0$7,4782.8%$200$7,252$0$7,252$7,052TownshipMatchwood
3.1%$1,150$38,029$0$38,0292.9%$1,022$36,879$0$36,879$35,857TownshipMcmillan
3.1%$2,609$86,321$0$86,3212.9%$2,321$83,712$0$83,712$81,391TownshipOntonagon
3.1%$548$18,139$0$18,1392.8%$487$17,591$0$17,591$17,104TownshipRockland
3.1%$1,899$62,851$0$62,8512.9%$1,690$60,952$0$60,952$59,262TownshipStannard
2.5%$3,585$148,706$30,084$118,6222.9%$4,084$145,121$30,084$115,037$141,037VillageOntonagon
06/03/15 Prepared by The House Fiscal Agency Page 42

Revenue Sharing Payments to Cities, Villages, and TownshipsFinal FY 2013-14, Estimated FY 2014-15, and Estimated FY 2015-16 Based on SB 133 (S-1) CR-1
FY 2015-16FY 2014-15FY 2013-14
Change from FY 2014-15TotalEligibleEstimatedChange from FY 2013-14TotalEligibleEstimatedTotal
CombinedCVTConstitutionalCombinedCVTConstitutionalCombinedLocal Unit
PercentDollarPaymentPaymentPaymentPercentDollarPaymentPaymentPaymentPaymentTypeLocal Unit Name
Osceola County
3.1%$2,647$87,594$0$87,5942.9%$2,356$84,947$0$84,947$82,591TownshipBurdell
3.1%$1,094$36,199$0$36,1992.9%$973$35,105$0$35,105$34,132TownshipCedar
3.1%$3,566$117,986$0$117,9862.9%$3,171$114,420$0$114,420$111,249TownshipEvart
3.1%$1,364$45,110$0$45,1102.8%$1,212$43,746$0$43,746$42,534TownshipHartwick
3.1%$3,847$127,294$0$127,2942.9%$3,423$123,447$0$123,447$120,024TownshipHersey
3.1%$3,006$99,449$0$99,4492.9%$2,674$96,443$0$96,443$93,769TownshipHighland
3.1%$2,299$76,058$0$76,0582.9%$2,045$73,759$0$73,759$71,714TownshipLeroy
3.1%$3,606$119,338$0$119,3382.9%$3,209$115,732$0$115,732$112,523TownshipLincoln
3.1%$1,972$65,238$0$65,2382.8%$1,753$63,266$0$63,266$61,513TownshipMarion
3.1%$2,027$67,068$0$67,0682.9%$1,805$65,041$0$65,041$63,236TownshipMiddle Branch
3.1%$1,859$61,499$0$61,4992.9%$1,653$59,640$0$59,640$57,987TownshipOrient
3.1%$2,587$85,605$0$85,6052.9%$2,302$83,018$0$83,018$80,716TownshipOsceola
3.1%$3,737$123,635$0$123,6352.9%$3,323$119,898$0$119,898$116,575TownshipRichmond
3.1%$3,301$109,234$0$109,2342.9%$2,938$105,933$0$105,933$102,995TownshipRose Lake
3.1%$2,505$82,900$0$82,9002.9%$2,229$80,395$0$80,395$78,166TownshipSherman
3.1%$2,642$87,435$0$87,4352.9%$2,350$84,793$0$84,793$82,443TownshipSylvan
2.7%$4,576$175,483$24,082$151,4012.9%$4,787$170,907$24,082$146,825$166,120CityEvart
2.4%$5,737$241,810$51,982$189,8282.9%$6,645$236,073$51,982$184,091$229,428CityReed City
3.1%$841$27,845$0$27,8452.9%$749$27,004$0$27,004$26,255VillageHersey
3.1%$616$20,367$0$20,3672.8%$547$19,751$0$19,751$19,204VillageLeroy
2.1%$2,097$101,227$31,852$69,3752.9%$2,807$99,130$31,852$67,278$96,323VillageMarion
2.5%$553$22,416$4,118$18,2989.8%$1,946$21,863$4,118$17,745$19,917VillageTustin
Oscoda County
3.1%$6,798$224,914$0$224,9142.9%$6,049$218,116$0$218,116$212,067TownshipBig Creek
3.1%$1,060$35,085$0$35,0852.9%$944$34,025$0$34,025$33,081TownshipClinton
3.1%$4,737$156,731$0$156,7312.9%$4,214$151,994$0$151,994$147,780TownshipComins
3.1%$2,736$90,538$0$90,5382.9%$2,435$87,802$0$87,802$85,367TownshipElmer
3.1%$2,695$89,185$0$89,1852.9%$2,399$86,490$0$86,490$84,091TownshipGreenwood
3.1%$2,749$90,936$0$90,9362.9%$2,444$88,187$0$88,187$85,743TownshipMentor
Otsego County
3.1%$14,153$468,285$0$468,2852.9%$12,593$454,132$0$454,132$441,539TownshipBagley
3.1%$3,256$107,723$0$107,7232.9%$2,896$104,467$0$104,467$101,571TownshipCharlton
3.1%$3,107$102,790$0$102,7902.9%$2,764$99,683$0$99,683$96,919TownshipChester
3.1%$2,852$94,357$0$94,3572.9%$2,537$91,505$0$91,505$88,968TownshipCorwith
3.1%$1,349$44,632$0$44,6322.8%$1,199$43,283$0$43,283$42,084TownshipDover
3.1%$4,056$134,216$0$134,2162.9%$3,610$130,160$0$130,160$126,550TownshipElmira
3.1%$6,297$208,365$0$208,3652.9%$5,604$202,068$0$202,068$196,464TownshipHayes
3.1%$6,072$200,887$0$200,8872.9%$5,402$194,815$0$194,815$189,413TownshipLivingston
3.1%$6,846$226,505$0$226,5052.9%$6,091$219,659$0$219,659$213,568TownshipOtsego Lake
2.8%$8,726$319,173$30,453$288,7202.9%$8,667$310,447$30,453$279,994$301,780CityGaylord
2.7%$1,352$51,885$7,173$44,71210.7%$4,895$50,533$7,173$43,360$45,638VillageVanderbilt
06/03/15 Prepared by The House Fiscal Agency Page 43

Revenue Sharing Payments to Cities, Villages, and TownshipsFinal FY 2013-14, Estimated FY 2014-15, and Estimated FY 2015-16 Based on SB 133 (S-1) CR-1
FY 2015-16FY 2014-15FY 2013-14
Change from FY 2014-15TotalEligibleEstimatedChange from FY 2013-14TotalEligibleEstimatedTotal
CombinedCVTConstitutionalCombinedCVTConstitutionalCombinedLocal Unit
PercentDollarPaymentPaymentPaymentPercentDollarPaymentPaymentPaymentPaymentTypeLocal Unit Name
Ottawa County
3.0%$49,793$1,702,319$54,806$1,647,5136.4%$99,115$1,652,526$54,806$1,597,720$1,553,411TownshipAllendale
3.1%$13,879$459,216$0$459,2162.9%$12,350$445,337$0$445,337$432,987TownshipBlendon
3.0%$4,850$166,815$6,344$160,4712.9%$4,504$161,965$6,344$155,621$157,461TownshipChester
3.1%$9,522$315,054$0$315,0542.9%$8,473$305,532$0$305,532$297,059TownshipCrockery
3.0%$112,976$3,862,442$124,350$3,738,0926.4%$224,887$3,749,466$124,350$3,625,116$3,524,579TownshipGeorgetown
3.0%$36,496$1,247,720$40,170$1,207,5506.4%$72,647$1,211,224$40,170$1,171,054$1,138,577TownshipGrand Haven
3.0%$85,687$2,929,487$94,314$2,835,1736.4%$170,566$2,843,800$94,314$2,749,486$2,673,234TownshipHolland
3.1%$16,913$559,619$0$559,6192.9%$15,050$542,706$0$542,706$527,656TownshipJamestown
3.1%$11,003$364,063$0$364,0632.9%$9,791$353,060$0$353,060$343,269TownshipOlive
3.0%$42,806$1,463,429$47,115$1,416,3146.4%$85,206$1,420,623$47,115$1,373,508$1,335,417TownshipPark
3.1%$5,827$192,772$0$192,7722.9%$5,184$186,945$0$186,945$181,761TownshipPolkton
3.1%$10,195$337,331$0$337,3312.9%$9,072$327,136$0$327,136$318,064TownshipPort Sheldon
3.1%$14,629$484,038$0$484,0382.9%$13,018$469,409$0$469,409$456,391TownshipRobinson
3.0%$28,799$984,579$31,698$952,8816.4%$57,325$955,780$31,698$924,082$898,455TownshipSpring Lake
3.0%$18,214$622,709$20,048$602,6616.4%$36,257$604,495$20,048$584,447$568,238TownshipTallmadge
3.1%$7,567$250,373$0$250,3732.9%$6,734$242,806$0$242,806$236,072TownshipWright
3.0%$23,975$819,674$26,389$793,2856.4%$47,724$795,699$26,389$769,310$747,975TownshipZeeland
2.8%$10,279$372,337$32,222$340,1152.9%$10,104$362,058$32,222$329,836$351,954CityCoopersville
2.9%$6,954$245,664$15,579$230,0852.9%$6,649$238,710$15,579$223,131$232,061CityFerrysburg
2.7%$25,036$962,154$133,783$828,3712.9%$26,241$937,118$133,783$803,335$910,877CityGrand Haven
2.7%$79,472$2,983,680$354,167$2,629,5132.9%$81,212$2,904,208$354,167$2,550,041$2,822,996CityHolland
2.9%$17,110$598,180$32,037$566,1432.9%$16,178$581,070$32,037$549,033$564,892CityHudsonville
2.6%$13,235$514,051$76,157$437,8942.9%$14,034$500,816$76,157$424,659$486,782CityZeeland
3.0%$5,586$193,783$8,967$184,8162.9%$5,237$188,197$8,967$179,230$182,960VillageSpring Lake
Presque Isle County
3.1%$2,280$75,422$0$75,4222.9%$2,028$73,142$0$73,142$71,114TownshipAllis
3.1%$887$29,357$0$29,3572.9%$791$28,470$0$28,470$27,679TownshipBearinger
3.1%$1,806$59,749$0$59,7492.9%$1,607$57,943$0$57,943$56,336TownshipBelknap
3.1%$928$30,709$0$30,7092.9%$826$29,781$0$29,781$28,955TownshipBismarck
3.1%$1,676$55,452$0$55,4522.9%$1,492$53,776$0$53,776$52,284TownshipCase
3.1%$1,695$56,089$0$56,0892.9%$1,509$54,394$0$54,394$52,885TownshipKrakow
3.1%$726$24,026$0$24,0262.8%$645$23,300$0$23,300$22,655TownshipMetz
3.1%$712$23,549$0$23,5492.9%$633$22,837$0$22,837$22,204TownshipMoltke
3.1%$1,253$41,450$0$41,4502.9%$1,114$40,197$0$40,197$39,083TownshipNorth Allis
3.1%$1,575$52,111$0$52,1112.9%$1,401$50,536$0$50,536$49,135TownshipOcqueoc
3.1%$1,481$49,008$0$49,0082.9%$1,318$47,527$0$47,527$46,209TownshipPosen
3.1%$3,982$131,750$0$131,7502.9%$3,544$127,768$0$127,768$124,224TownshipPresque Isle
3.1%$824$27,288$0$27,2882.9%$735$26,464$0$26,464$25,729TownshipPulawski
3.1%$2,366$78,286$0$78,2862.9%$2,105$75,920$0$75,920$73,815TownshipRogers
2.0%$2,116$106,219$36,207$70,0122.9%$2,957$104,103$36,207$67,896$101,146CityOnaway
2.3%$6,766$306,233$82,354$223,8792.9%$8,460$299,467$82,354$217,113$291,007CityRogers City
3.1%$496$16,389$0$16,3892.8%$440$15,893$0$15,893$15,453VillageMillersburg
3.1%$562$18,616$0$18,6162.9%$501$18,054$0$18,054$17,553VillagePosen
06/03/15 Prepared by The House Fiscal Agency Page 44
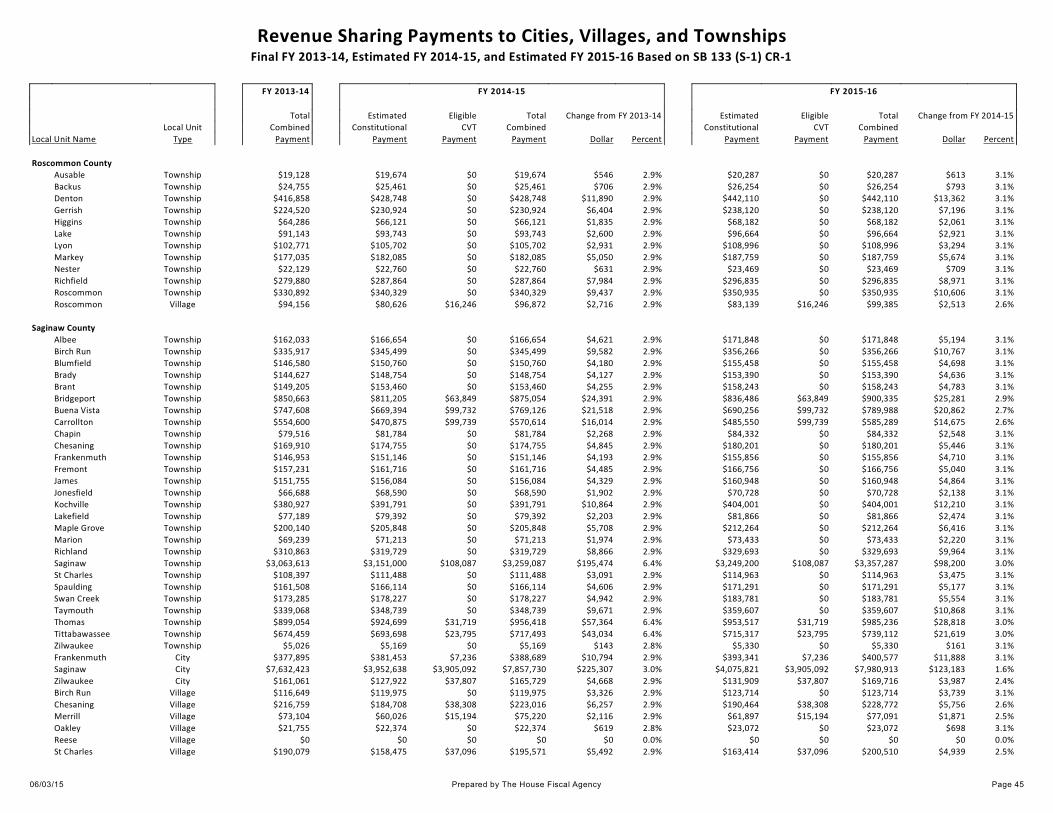
Revenue Sharing Payments to Cities, Villages, and TownshipsFinal FY 2013-14, Estimated FY 2014-15, and Estimated FY 2015-16 Based on SB 133 (S-1) CR-1
FY 2015-16FY 2014-15FY 2013-14
Change from FY 2014-15TotalEligibleEstimatedChange from FY 2013-14TotalEligibleEstimatedTotal
CombinedCVTConstitutionalCombinedCVTConstitutionalCombinedLocal Unit
PercentDollarPaymentPaymentPaymentPercentDollarPaymentPaymentPaymentPaymentTypeLocal Unit Name
Roscommon County
3.1%$613$20,287$0$20,2872.9%$546$19,674$0$19,674$19,128TownshipAusable
3.1%$793$26,254$0$26,2542.9%$706$25,461$0$25,461$24,755TownshipBackus
3.1%$13,362$442,110$0$442,1102.9%$11,890$428,748$0$428,748$416,858TownshipDenton
3.1%$7,196$238,120$0$238,1202.9%$6,404$230,924$0$230,924$224,520TownshipGerrish
3.1%$2,061$68,182$0$68,1822.9%$1,835$66,121$0$66,121$64,286TownshipHiggins
3.1%$2,921$96,664$0$96,6642.9%$2,600$93,743$0$93,743$91,143TownshipLake
3.1%$3,294$108,996$0$108,9962.9%$2,931$105,702$0$105,702$102,771TownshipLyon
3.1%$5,674$187,759$0$187,7592.9%$5,050$182,085$0$182,085$177,035TownshipMarkey
3.1%$709$23,469$0$23,4692.9%$631$22,760$0$22,760$22,129TownshipNester
3.1%$8,971$296,835$0$296,8352.9%$7,984$287,864$0$287,864$279,880TownshipRichfield
3.1%$10,606$350,935$0$350,9352.9%$9,437$340,329$0$340,329$330,892TownshipRoscommon
2.6%$2,513$99,385$16,246$83,1392.9%$2,716$96,872$16,246$80,626$94,156VillageRoscommon
Saginaw County
3.1%$5,194$171,848$0$171,8482.9%$4,621$166,654$0$166,654$162,033TownshipAlbee
3.1%$10,767$356,266$0$356,2662.9%$9,582$345,499$0$345,499$335,917TownshipBirch Run
3.1%$4,698$155,458$0$155,4582.9%$4,180$150,760$0$150,760$146,580TownshipBlumfield
3.1%$4,636$153,390$0$153,3902.9%$4,127$148,754$0$148,754$144,627TownshipBrady
3.1%$4,783$158,243$0$158,2432.9%$4,255$153,460$0$153,460$149,205TownshipBrant
2.9%$25,281$900,335$63,849$836,4862.9%$24,391$875,054$63,849$811,205$850,663TownshipBridgeport
2.7%$20,862$789,988$99,732$690,2562.9%$21,518$769,126$99,732$669,394$747,608TownshipBuena Vista
2.6%$14,675$585,289$99,739$485,5502.9%$16,014$570,614$99,739$470,875$554,600TownshipCarrollton
3.1%$2,548$84,332$0$84,3322.9%$2,268$81,784$0$81,784$79,516TownshipChapin
3.1%$5,446$180,201$0$180,2012.9%$4,845$174,755$0$174,755$169,910TownshipChesaning
3.1%$4,710$155,856$0$155,8562.9%$4,193$151,146$0$151,146$146,953TownshipFrankenmuth
3.1%$5,040$166,756$0$166,7562.9%$4,485$161,716$0$161,716$157,231TownshipFremont
3.1%$4,864$160,948$0$160,9482.9%$4,329$156,084$0$156,084$151,755TownshipJames
3.1%$2,138$70,728$0$70,7282.9%$1,902$68,590$0$68,590$66,688TownshipJonesfield
3.1%$12,210$404,001$0$404,0012.9%$10,864$391,791$0$391,791$380,927TownshipKochville
3.1%$2,474$81,866$0$81,8662.9%$2,203$79,392$0$79,392$77,189TownshipLakefield
3.1%$6,416$212,264$0$212,2642.9%$5,708$205,848$0$205,848$200,140TownshipMaple Grove
3.1%$2,220$73,433$0$73,4332.9%$1,974$71,213$0$71,213$69,239TownshipMarion
3.1%$9,964$329,693$0$329,6932.9%$8,866$319,729$0$319,729$310,863TownshipRichland
3.0%$98,200$3,357,287$108,087$3,249,2006.4%$195,474$3,259,087$108,087$3,151,000$3,063,613TownshipSaginaw
3.1%$3,475$114,963$0$114,9632.9%$3,091$111,488$0$111,488$108,397TownshipSt Charles
3.1%$5,177$171,291$0$171,2912.9%$4,606$166,114$0$166,114$161,508TownshipSpaulding
3.1%$5,554$183,781$0$183,7812.9%$4,942$178,227$0$178,227$173,285TownshipSwan Creek
3.1%$10,868$359,607$0$359,6072.9%$9,671$348,739$0$348,739$339,068TownshipTaymouth
3.0%$28,818$985,236$31,719$953,5176.4%$57,364$956,418$31,719$924,699$899,054TownshipThomas
3.0%$21,619$739,112$23,795$715,3176.4%$43,034$717,493$23,795$693,698$674,459TownshipTittabawassee
3.1%$161$5,330$0$5,3302.8%$143$5,169$0$5,169$5,026TownshipZilwaukee
3.1%$11,888$400,577$7,236$393,3412.9%$10,794$388,689$7,236$381,453$377,895CityFrankenmuth
1.6%$123,183$7,980,913$3,905,092$4,075,8213.0%$225,307$7,857,730$3,905,092$3,952,638$7,632,423CitySaginaw
2.4%$3,987$169,716$37,807$131,9092.9%$4,668$165,729$37,807$127,922$161,061CityZilwaukee
3.1%$3,739$123,714$0$123,7142.9%$3,326$119,975$0$119,975$116,649VillageBirch Run
2.6%$5,756$228,772$38,308$190,4642.9%$6,257$223,016$38,308$184,708$216,759VillageChesaning
2.5%$1,871$77,091$15,194$61,8972.9%$2,116$75,220$15,194$60,026$73,104VillageMerrill
3.1%$698$23,072$0$23,0722.8%$619$22,374$0$22,374$21,755VillageOakley
0.0%$0$0$0$00.0%$0$0$0$0$0VillageReese
2.5%$4,939$200,510$37,096$163,4142.9%$5,492$195,571$37,096$158,475$190,079VillageSt Charles
06/03/15 Prepared by The House Fiscal Agency Page 45
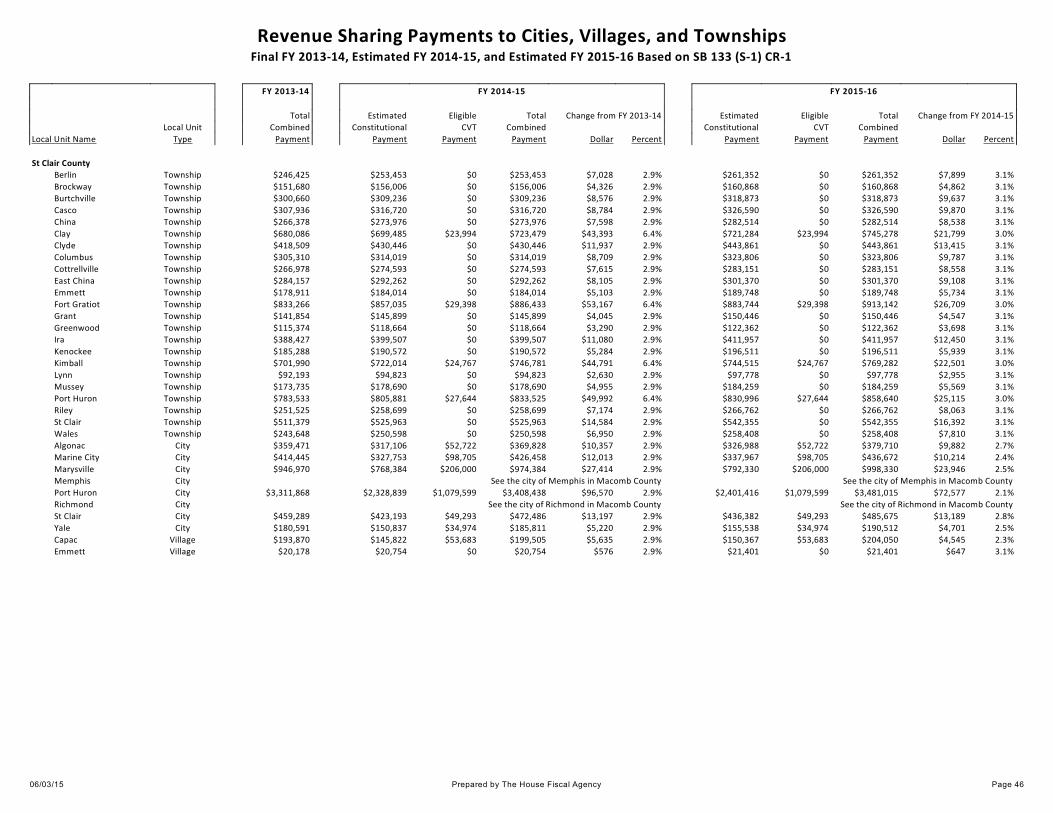
Revenue Sharing Payments to Cities, Villages, and TownshipsFinal FY 2013-14, Estimated FY 2014-15, and Estimated FY 2015-16 Based on SB 133 (S-1) CR-1
FY 2015-16FY 2014-15FY 2013-14
Change from FY 2014-15TotalEligibleEstimatedChange from FY 2013-14TotalEligibleEstimatedTotal
CombinedCVTConstitutionalCombinedCVTConstitutionalCombinedLocal Unit
PercentDollarPaymentPaymentPaymentPercentDollarPaymentPaymentPaymentPaymentTypeLocal Unit Name
St Clair County
3.1%$7,899$261,352$0$261,3522.9%$7,028$253,453$0$253,453$246,425TownshipBerlin
3.1%$4,862$160,868$0$160,8682.9%$4,326$156,006$0$156,006$151,680TownshipBrockway
3.1%$9,637$318,873$0$318,8732.9%$8,576$309,236$0$309,236$300,660TownshipBurtchville
3.1%$9,870$326,590$0$326,5902.9%$8,784$316,720$0$316,720$307,936TownshipCasco
3.1%$8,538$282,514$0$282,5142.9%$7,598$273,976$0$273,976$266,378TownshipChina
3.0%$21,799$745,278$23,994$721,2846.4%$43,393$723,479$23,994$699,485$680,086TownshipClay
3.1%$13,415$443,861$0$443,8612.9%$11,937$430,446$0$430,446$418,509TownshipClyde
3.1%$9,787$323,806$0$323,8062.9%$8,709$314,019$0$314,019$305,310TownshipColumbus
3.1%$8,558$283,151$0$283,1512.9%$7,615$274,593$0$274,593$266,978TownshipCottrellville
3.1%$9,108$301,370$0$301,3702.9%$8,105$292,262$0$292,262$284,157TownshipEast China
3.1%$5,734$189,748$0$189,7482.9%$5,103$184,014$0$184,014$178,911TownshipEmmett
3.0%$26,709$913,142$29,398$883,7446.4%$53,167$886,433$29,398$857,035$833,266TownshipFort Gratiot
3.1%$4,547$150,446$0$150,4462.9%$4,045$145,899$0$145,899$141,854TownshipGrant
3.1%$3,698$122,362$0$122,3622.9%$3,290$118,664$0$118,664$115,374TownshipGreenwood
3.1%$12,450$411,957$0$411,9572.9%$11,080$399,507$0$399,507$388,427TownshipIra
3.1%$5,939$196,511$0$196,5112.9%$5,284$190,572$0$190,572$185,288TownshipKenockee
3.0%$22,501$769,282$24,767$744,5156.4%$44,791$746,781$24,767$722,014$701,990TownshipKimball
3.1%$2,955$97,778$0$97,7782.9%$2,630$94,823$0$94,823$92,193TownshipLynn
3.1%$5,569$184,259$0$184,2592.9%$4,955$178,690$0$178,690$173,735TownshipMussey
3.0%$25,115$858,640$27,644$830,9966.4%$49,992$833,525$27,644$805,881$783,533TownshipPort Huron
3.1%$8,063$266,762$0$266,7622.9%$7,174$258,699$0$258,699$251,525TownshipRiley
3.1%$16,392$542,355$0$542,3552.9%$14,584$525,963$0$525,963$511,379TownshipSt Clair
3.1%$7,810$258,408$0$258,4082.9%$6,950$250,598$0$250,598$243,648TownshipWales
2.7%$9,882$379,710$52,722$326,9882.9%$10,357$369,828$52,722$317,106$359,471CityAlgonac
2.4%$10,214$436,672$98,705$337,9672.9%$12,013$426,458$98,705$327,753$414,445CityMarine City
2.5%$23,946$998,330$206,000$792,3302.9%$27,414$974,384$206,000$768,384$946,970CityMarysville
See the city of Memphis in Macomb CountySee the city of Memphis in Macomb CountyCityMemphis
2.1%$72,577$3,481,015$1,079,599$2,401,4162.9%$96,570$3,408,438$1,079,599$2,328,839$3,311,868CityPort Huron
See the city of Richmond in Macomb CountySee the city of Richmond in Macomb CountyCityRichmond
2.8%$13,189$485,675$49,293$436,3822.9%$13,197$472,486$49,293$423,193$459,289CitySt Clair
2.5%$4,701$190,512$34,974$155,5382.9%$5,220$185,811$34,974$150,837$180,591CityYale
2.3%$4,545$204,050$53,683$150,3672.9%$5,635$199,505$53,683$145,822$193,870VillageCapac
3.1%$647$21,401$0$21,4012.9%$576$20,754$0$20,754$20,178VillageEmmett
06/03/15 Prepared by The House Fiscal Agency Page 46
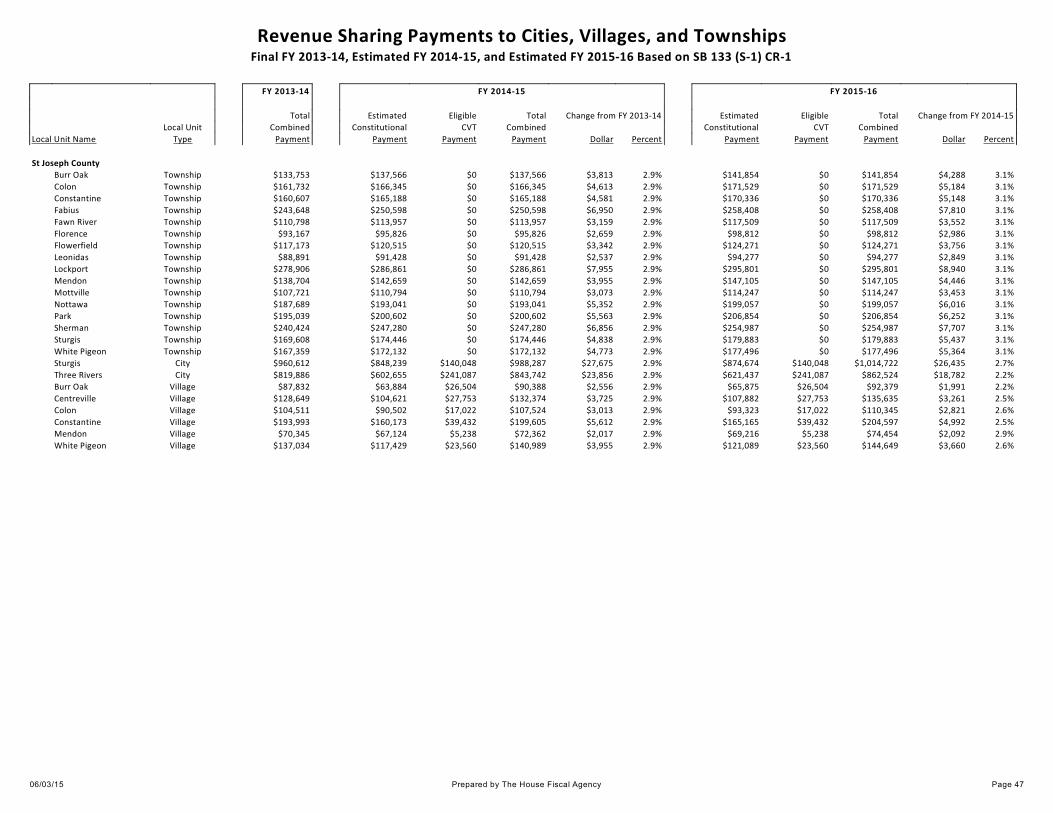
Revenue Sharing Payments to Cities, Villages, and TownshipsFinal FY 2013-14, Estimated FY 2014-15, and Estimated FY 2015-16 Based on SB 133 (S-1) CR-1
FY 2015-16FY 2014-15FY 2013-14
Change from FY 2014-15TotalEligibleEstimatedChange from FY 2013-14TotalEligibleEstimatedTotal
CombinedCVTConstitutionalCombinedCVTConstitutionalCombinedLocal Unit
PercentDollarPaymentPaymentPaymentPercentDollarPaymentPaymentPaymentPaymentTypeLocal Unit Name
St Joseph County
3.1%$4,288$141,854$0$141,8542.9%$3,813$137,566$0$137,566$133,753TownshipBurr Oak
3.1%$5,184$171,529$0$171,5292.9%$4,613$166,345$0$166,345$161,732TownshipColon
3.1%$5,148$170,336$0$170,3362.9%$4,581$165,188$0$165,188$160,607TownshipConstantine
3.1%$7,810$258,408$0$258,4082.9%$6,950$250,598$0$250,598$243,648TownshipFabius
3.1%$3,552$117,509$0$117,5092.9%$3,159$113,957$0$113,957$110,798TownshipFawn River
3.1%$2,986$98,812$0$98,8122.9%$2,659$95,826$0$95,826$93,167TownshipFlorence
3.1%$3,756$124,271$0$124,2712.9%$3,342$120,515$0$120,515$117,173TownshipFlowerfield
3.1%$2,849$94,277$0$94,2772.9%$2,537$91,428$0$91,428$88,891TownshipLeonidas
3.1%$8,940$295,801$0$295,8012.9%$7,955$286,861$0$286,861$278,906TownshipLockport
3.1%$4,446$147,105$0$147,1052.9%$3,955$142,659$0$142,659$138,704TownshipMendon
3.1%$3,453$114,247$0$114,2472.9%$3,073$110,794$0$110,794$107,721TownshipMottville
3.1%$6,016$199,057$0$199,0572.9%$5,352$193,041$0$193,041$187,689TownshipNottawa
3.1%$6,252$206,854$0$206,8542.9%$5,563$200,602$0$200,602$195,039TownshipPark
3.1%$7,707$254,987$0$254,9872.9%$6,856$247,280$0$247,280$240,424TownshipSherman
3.1%$5,437$179,883$0$179,8832.9%$4,838$174,446$0$174,446$169,608TownshipSturgis
3.1%$5,364$177,496$0$177,4962.9%$4,773$172,132$0$172,132$167,359TownshipWhite Pigeon
2.7%$26,435$1,014,722$140,048$874,6742.9%$27,675$988,287$140,048$848,239$960,612CitySturgis
2.2%$18,782$862,524$241,087$621,4372.9%$23,856$843,742$241,087$602,655$819,886CityThree Rivers
2.2%$1,991$92,379$26,504$65,8752.9%$2,556$90,388$26,504$63,884$87,832VillageBurr Oak
2.5%$3,261$135,635$27,753$107,8822.9%$3,725$132,374$27,753$104,621$128,649VillageCentreville
2.6%$2,821$110,345$17,022$93,3232.9%$3,013$107,524$17,022$90,502$104,511VillageColon
2.5%$4,992$204,597$39,432$165,1652.9%$5,612$199,605$39,432$160,173$193,993VillageConstantine
2.9%$2,092$74,454$5,238$69,2162.9%$2,017$72,362$5,238$67,124$70,345VillageMendon
2.6%$3,660$144,649$23,560$121,0892.9%$3,955$140,989$23,560$117,429$137,034VillageWhite Pigeon
06/03/15 Prepared by The House Fiscal Agency Page 47
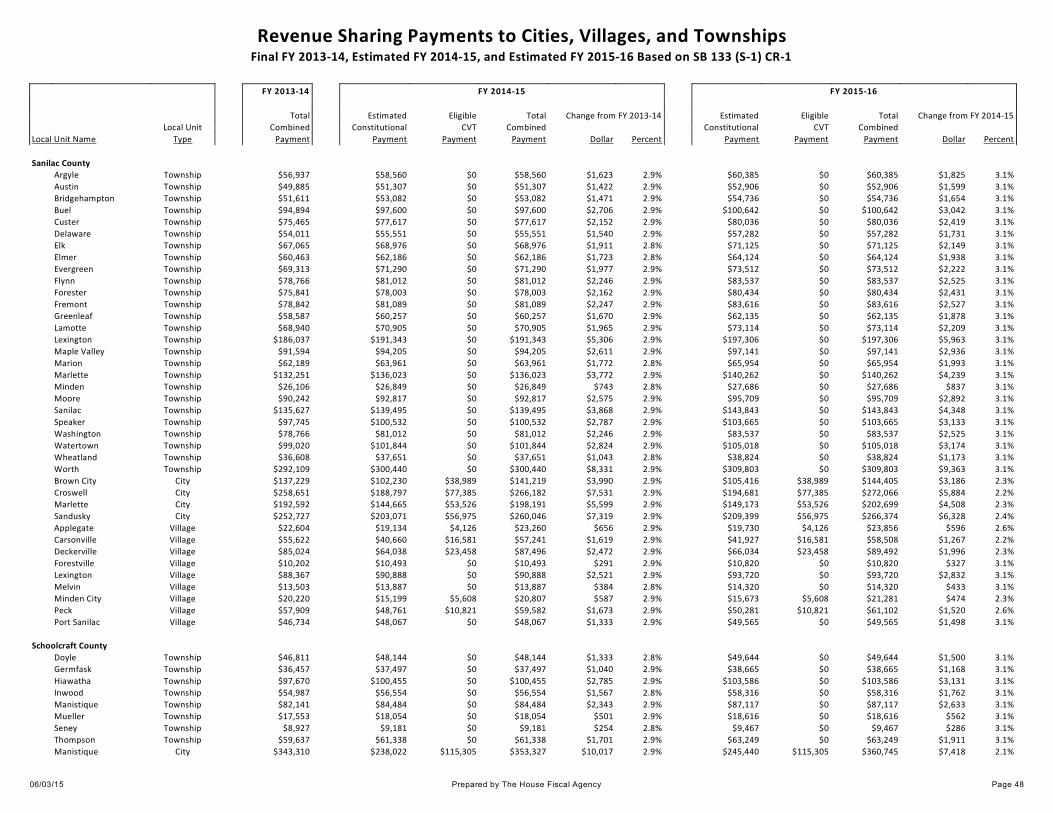
Revenue Sharing Payments to Cities, Villages, and TownshipsFinal FY 2013-14, Estimated FY 2014-15, and Estimated FY 2015-16 Based on SB 133 (S-1) CR-1
FY 2015-16FY 2014-15FY 2013-14
Change from FY 2014-15TotalEligibleEstimatedChange from FY 2013-14TotalEligibleEstimatedTotal
CombinedCVTConstitutionalCombinedCVTConstitutionalCombinedLocal Unit
PercentDollarPaymentPaymentPaymentPercentDollarPaymentPaymentPaymentPaymentTypeLocal Unit Name
Sanilac County
3.1%$1,825$60,385$0$60,3852.9%$1,623$58,560$0$58,560$56,937TownshipArgyle
3.1%$1,599$52,906$0$52,9062.9%$1,422$51,307$0$51,307$49,885TownshipAustin
3.1%$1,654$54,736$0$54,7362.9%$1,471$53,082$0$53,082$51,611TownshipBridgehampton
3.1%$3,042$100,642$0$100,6422.9%$2,706$97,600$0$97,600$94,894TownshipBuel
3.1%$2,419$80,036$0$80,0362.9%$2,152$77,617$0$77,617$75,465TownshipCuster
3.1%$1,731$57,282$0$57,2822.9%$1,540$55,551$0$55,551$54,011TownshipDelaware
3.1%$2,149$71,125$0$71,1252.8%$1,911$68,976$0$68,976$67,065TownshipElk
3.1%$1,938$64,124$0$64,1242.8%$1,723$62,186$0$62,186$60,463TownshipElmer
3.1%$2,222$73,512$0$73,5122.9%$1,977$71,290$0$71,290$69,313TownshipEvergreen
3.1%$2,525$83,537$0$83,5372.9%$2,246$81,012$0$81,012$78,766TownshipFlynn
3.1%$2,431$80,434$0$80,4342.9%$2,162$78,003$0$78,003$75,841TownshipForester
3.1%$2,527$83,616$0$83,6162.9%$2,247$81,089$0$81,089$78,842TownshipFremont
3.1%$1,878$62,135$0$62,1352.9%$1,670$60,257$0$60,257$58,587TownshipGreenleaf
3.1%$2,209$73,114$0$73,1142.9%$1,965$70,905$0$70,905$68,940TownshipLamotte
3.1%$5,963$197,306$0$197,3062.9%$5,306$191,343$0$191,343$186,037TownshipLexington
3.1%$2,936$97,141$0$97,1412.9%$2,611$94,205$0$94,205$91,594TownshipMaple Valley
3.1%$1,993$65,954$0$65,9542.8%$1,772$63,961$0$63,961$62,189TownshipMarion
3.1%$4,239$140,262$0$140,2622.9%$3,772$136,023$0$136,023$132,251TownshipMarlette
3.1%$837$27,686$0$27,6862.8%$743$26,849$0$26,849$26,106TownshipMinden
3.1%$2,892$95,709$0$95,7092.9%$2,575$92,817$0$92,817$90,242TownshipMoore
3.1%$4,348$143,843$0$143,8432.9%$3,868$139,495$0$139,495$135,627TownshipSanilac
3.1%$3,133$103,665$0$103,6652.9%$2,787$100,532$0$100,532$97,745TownshipSpeaker
3.1%$2,525$83,537$0$83,5372.9%$2,246$81,012$0$81,012$78,766TownshipWashington
3.1%$3,174$105,018$0$105,0182.9%$2,824$101,844$0$101,844$99,020TownshipWatertown
3.1%$1,173$38,824$0$38,8242.8%$1,043$37,651$0$37,651$36,608TownshipWheatland
3.1%$9,363$309,803$0$309,8032.9%$8,331$300,440$0$300,440$292,109TownshipWorth
2.3%$3,186$144,405$38,989$105,4162.9%$3,990$141,219$38,989$102,230$137,229CityBrown City
2.2%$5,884$272,066$77,385$194,6812.9%$7,531$266,182$77,385$188,797$258,651CityCroswell
2.3%$4,508$202,699$53,526$149,1732.9%$5,599$198,191$53,526$144,665$192,592CityMarlette
2.4%$6,328$266,374$56,975$209,3992.9%$7,319$260,046$56,975$203,071$252,727CitySandusky
2.6%$596$23,856$4,126$19,7302.9%$656$23,260$4,126$19,134$22,604VillageApplegate
2.2%$1,267$58,508$16,581$41,9272.9%$1,619$57,241$16,581$40,660$55,622VillageCarsonville
2.3%$1,996$89,492$23,458$66,0342.9%$2,472$87,496$23,458$64,038$85,024VillageDeckerville
3.1%$327$10,820$0$10,8202.9%$291$10,493$0$10,493$10,202VillageForestville
3.1%$2,832$93,720$0$93,7202.9%$2,521$90,888$0$90,888$88,367VillageLexington
3.1%$433$14,320$0$14,3202.8%$384$13,887$0$13,887$13,503VillageMelvin
2.3%$474$21,281$5,608$15,6732.9%$587$20,807$5,608$15,199$20,220VillageMinden City
2.6%$1,520$61,102$10,821$50,2812.9%$1,673$59,582$10,821$48,761$57,909VillagePeck
3.1%$1,498$49,565$0$49,5652.9%$1,333$48,067$0$48,067$46,734VillagePort Sanilac
Schoolcraft County
3.1%$1,500$49,644$0$49,6442.8%$1,333$48,144$0$48,144$46,811TownshipDoyle
3.1%$1,168$38,665$0$38,6652.9%$1,040$37,497$0$37,497$36,457TownshipGermfask
3.1%$3,131$103,586$0$103,5862.9%$2,785$100,455$0$100,455$97,670TownshipHiawatha
3.1%$1,762$58,316$0$58,3162.8%$1,567$56,554$0$56,554$54,987TownshipInwood
3.1%$2,633$87,117$0$87,1172.9%$2,343$84,484$0$84,484$82,141TownshipManistique
3.1%$562$18,616$0$18,6162.9%$501$18,054$0$18,054$17,553TownshipMueller
3.1%$286$9,467$0$9,4672.8%$254$9,181$0$9,181$8,927TownshipSeney
3.1%$1,911$63,249$0$63,2492.9%$1,701$61,338$0$61,338$59,637TownshipThompson
2.1%$7,418$360,745$115,305$245,4402.9%$10,017$353,327$115,305$238,022$343,310CityManistique
06/03/15 Prepared by The House Fiscal Agency Page 48

Revenue Sharing Payments to Cities, Villages, and TownshipsFinal FY 2013-14, Estimated FY 2014-15, and Estimated FY 2015-16 Based on SB 133 (S-1) CR-1
FY 2015-16FY 2014-15FY 2013-14
Change from FY 2014-15TotalEligibleEstimatedChange from FY 2013-14TotalEligibleEstimatedTotal
CombinedCVTConstitutionalCombinedCVTConstitutionalCombinedLocal Unit
PercentDollarPaymentPaymentPaymentPercentDollarPaymentPaymentPaymentPaymentTypeLocal Unit Name
Shiawassee County
3.1%$5,196$171,927$0$171,9272.9%$4,624$166,731$0$166,731$162,107TownshipAntrim
3.1%$7,617$252,043$0$252,0432.9%$6,779$244,426$0$244,426$237,647TownshipBennington
3.1%$6,915$228,812$0$228,8122.9%$6,154$221,897$0$221,897$215,743TownshipBurns
3.1%$10,760$356,027$0$356,0272.9%$9,574$345,267$0$345,267$335,693TownshipCaledonia
3.1%$1,816$60,067$0$60,0672.8%$1,614$58,251$0$58,251$56,637TownshipFairfield
3.1%$3,583$118,543$0$118,5432.9%$3,186$114,960$0$114,960$111,774TownshipHazelton
3.1%$3,617$119,657$0$119,6572.9%$3,218$116,040$0$116,040$112,822TownshipMiddlebury
3.1%$3,196$105,734$0$105,7342.9%$2,843$102,538$0$102,538$99,695TownshipNew Haven
3.1%$11,592$383,555$0$383,5552.9%$10,315$371,963$0$371,963$361,648TownshipOwosso
3.1%$8,175$270,501$0$270,5012.9%$7,275$262,326$0$262,326$255,051TownshipPerry
3.1%$3,105$102,711$0$102,7112.9%$2,762$99,606$0$99,606$96,844TownshipRush
3.1%$4,408$145,832$0$145,8322.9%$3,920$141,424$0$141,424$137,504TownshipSciota
3.1%$5,518$182,588$0$182,5882.9%$4,911$177,070$0$177,070$172,159TownshipShiawassee
3.1%$5,167$170,972$0$170,9722.9%$4,597$165,805$0$165,805$161,208TownshipVenice
3.1%$9,212$304,791$0$304,7912.9%$8,197$295,579$0$295,579$287,382TownshipVernon
3.1%$9,161$303,120$0$303,1202.9%$8,152$293,959$0$293,959$285,807TownshipWoodhull
2.4%$8,252$348,440$75,393$273,0472.9%$9,578$340,188$75,393$264,795$330,610CityCorunna
2.0%$8,286$423,420$149,259$274,1612.9%$11,796$415,134$149,259$265,875$403,338CityDurand
2.3%$3,085$134,971$32,897$102,0742.9%$3,721$131,886$32,897$98,989$128,165CityLaingsburg
2.3%$36,534$1,608,552$399,729$1,208,8232.9%$44,354$1,572,018$399,729$1,172,289$1,527,664CityOwosso
2.5%$5,261$212,453$38,378$174,0752.9%$5,820$207,192$38,378$168,814$201,372CityPerry
2.4%$1,310$55,971$12,612$43,3592.9%$1,541$54,661$12,612$42,049$53,120VillageBancroft
2.6%$1,397$55,702$9,479$46,2232.9%$1,525$54,305$9,479$44,826$52,780VillageByron
2.8%$1,228$45,168$4,514$40,6542.9%$1,227$43,940$4,514$39,426$42,713VillageLennon
2.6%$2,229$88,730$14,979$73,7512.9%$2,427$86,501$14,979$71,522$84,074VillageMorrice
2.7%$1,397$52,515$6,292$46,22317.3%$7,536$51,118$6,292$44,826$43,582VillageNew Lothrop
See the village of Ovid in Clinton CountySee the village of Ovid in Clinton CountyVillageOvid
2.5%$1,882$77,545$15,251$62,2942.9%$2,126$75,663$15,251$60,412$73,537VillageVernon
06/03/15 Prepared by The House Fiscal Agency Page 49

Revenue Sharing Payments to Cities, Villages, and TownshipsFinal FY 2013-14, Estimated FY 2014-15, and Estimated FY 2015-16 Based on SB 133 (S-1) CR-1
FY 2015-16FY 2014-15FY 2013-14
Change from FY 2014-15TotalEligibleEstimatedChange from FY 2013-14TotalEligibleEstimatedTotal
CombinedCVTConstitutionalCombinedCVTConstitutionalCombinedLocal Unit
PercentDollarPaymentPaymentPaymentPercentDollarPaymentPaymentPaymentPaymentTypeLocal Unit Name
Tuscola County
3.1%$3,008$99,528$0$99,5282.9%$2,677$96,520$0$96,520$93,843TownshipAkron
3.1%$5,085$168,267$0$168,2672.9%$4,525$163,182$0$163,182$158,657TownshipAlmer
3.1%$7,381$244,246$0$244,2462.9%$6,570$236,865$0$236,865$230,295TownshipArbela
3.1%$1,865$61,737$0$61,7372.9%$1,660$59,872$0$59,872$58,212TownshipColumbia
3.1%$4,444$147,025$0$147,0252.9%$3,953$142,581$0$142,581$138,628TownshipDayton
3.1%$3,896$128,886$0$128,8862.9%$3,466$124,990$0$124,990$121,524TownshipDenmark
3.1%$2,645$87,515$0$87,5152.9%$2,354$84,870$0$84,870$82,516TownshipElkland
3.1%$3,202$105,972$0$105,9722.9%$2,850$102,770$0$102,770$99,920TownshipEllington
3.1%$1,970$65,159$0$65,1592.9%$1,753$63,189$0$63,189$61,436TownshipElmwood
3.1%$2,082$68,898$0$68,8982.9%$1,853$66,816$0$66,816$64,963TownshipFairgrove
3.1%$5,679$187,918$0$187,9182.9%$5,053$182,239$0$182,239$177,186TownshipFremont
3.1%$1,782$58,953$0$58,9532.9%$1,585$57,171$0$57,171$55,586TownshipGilford
3.1%$6,372$210,832$0$210,8322.9%$5,670$204,460$0$204,460$198,790TownshipIndianfields
3.1%$3,768$124,669$0$124,6692.9%$3,353$120,901$0$120,901$117,548TownshipJuniata
3.1%$2,858$94,595$0$94,5952.9%$2,543$91,737$0$91,737$89,194TownshipKingston
3.1%$3,679$121,725$0$121,7252.9%$3,272$118,046$0$118,046$114,774TownshipKoylton
3.1%$7,892$261,113$0$261,1132.9%$7,023$253,221$0$253,221$246,198TownshipMillington
3.1%$3,585$118,622$0$118,6222.9%$3,190$115,037$0$115,037$111,847TownshipNovesta
3.1%$5,006$165,642$0$165,6422.9%$4,454$160,636$0$160,636$156,182TownshipTuscola
3.1%$9,842$325,636$0$325,6362.9%$8,758$315,794$0$315,794$307,036TownshipVassar
3.1%$5,295$175,189$0$175,1892.9%$4,712$169,894$0$169,894$165,182TownshipWatertown
3.1%$4,263$141,058$0$141,0582.9%$3,794$136,795$0$136,795$133,001TownshipWells
3.1%$1,659$54,895$0$54,8952.9%$1,476$53,236$0$53,236$51,760TownshipWisner
2.5%$10,080$415,721$82,209$333,5122.9%$11,405$405,641$82,209$323,432$394,236CityCaro
2.1%$6,485$317,313$102,742$214,5712.9%$8,816$310,828$102,742$208,086$302,012CityVassar
2.3%$966$42,376$10,394$31,9822.9%$1,168$41,410$10,394$31,016$40,242VillageAkron
2.5%$5,838$241,887$48,718$193,1692.9%$6,639$236,049$48,718$187,331$229,410VillageCass City
2.5%$1,353$55,859$11,068$44,7912.9%$1,533$54,506$11,068$43,438$52,973VillageFairgrove
2.3%$932$41,852$10,984$30,8682.9%$1,156$40,920$10,984$29,936$39,764VillageGagetown
2.2%$1,058$48,745$13,739$35,0062.9%$1,348$47,687$13,739$33,948$46,339VillageKingston
2.3%$2,284$100,728$25,147$75,5812.9%$2,777$98,444$25,147$73,297$95,667VillageMayville
2.5%$2,578$106,961$21,674$85,2872.9%$2,938$104,383$21,674$82,709$101,445VillageMillington
2.6%$3,496$138,636$22,957$115,6792.9%$3,791$135,140$22,957$112,183$131,349VillageReese
2.2%$1,222$55,549$15,133$40,4162.9%$1,535$54,327$15,133$39,194$52,792VillageUnionville
06/03/15 Prepared by The House Fiscal Agency Page 50

Revenue Sharing Payments to Cities, Villages, and TownshipsFinal FY 2013-14, Estimated FY 2014-15, and Estimated FY 2015-16 Based on SB 133 (S-1) CR-1
FY 2015-16FY 2014-15FY 2013-14
Change from FY 2014-15TotalEligibleEstimatedChange from FY 2013-14TotalEligibleEstimatedTotal
CombinedCVTConstitutionalCombinedCVTConstitutionalCombinedLocal Unit
PercentDollarPaymentPaymentPaymentPercentDollarPaymentPaymentPaymentPaymentTypeLocal Unit Name
Van Buren County
3.1%$12,003$397,159$0$397,1592.9%$10,682$385,156$0$385,156$374,474TownshipAlmena
3.0%$19,712$673,923$21,697$652,2266.4%$39,238$654,211$21,697$632,514$614,973TownshipAntwerp
3.1%$4,985$164,926$0$164,9262.9%$4,435$159,941$0$159,941$155,506TownshipArlington
3.0%$5,162$177,371$6,558$170,8132.9%$4,789$172,209$6,558$165,651$167,420TownshipBangor
3.1%$6,370$210,752$0$210,7522.9%$5,667$204,382$0$204,382$198,715TownshipBloomingdale
3.1%$5,745$190,067$0$190,0672.9%$5,111$184,322$0$184,322$179,211TownshipColumbia
3.1%$6,945$229,767$0$229,7672.9%$6,180$222,822$0$222,822$216,642TownshipCovert
3.1%$4,585$151,719$0$151,7192.9%$4,081$147,134$0$147,134$143,053TownshipDecatur
3.0%$8,592$295,394$11,129$284,2655.6%$15,173$286,802$11,129$275,673$271,629TownshipGeneva
3.1%$3,580$118,463$0$118,4632.9%$3,185$114,883$0$114,883$111,698TownshipHamilton
3.1%$7,873$260,477$0$260,4772.9%$7,005$252,604$0$252,604$245,599TownshipHartford
3.1%$5,216$172,564$0$172,5642.9%$4,640$167,348$0$167,348$162,708TownshipKeeler
3.1%$5,441$180,042$0$180,0422.9%$4,843$174,601$0$174,601$169,758TownshipLawrence
3.1%$8,641$285,935$0$285,9352.9%$7,690$277,294$0$277,294$269,604TownshipPaw Paw
3.1%$7,091$234,620$0$234,6202.9%$6,310$227,529$0$227,529$221,219TownshipPine Grove
3.1%$5,930$196,193$0$196,1932.9%$5,277$190,263$0$190,263$184,986TownshipPorter
3.1%$9,577$316,884$0$316,8842.9%$8,522$307,307$0$307,307$298,785TownshipSouth Haven
3.1%$6,141$203,194$0$203,1942.9%$5,463$197,053$0$197,053$191,590TownshipWaverly
2.0%$4,533$233,744$83,775$149,9692.9%$6,517$229,211$83,775$145,436$222,694CityBangor
2.2%$1,993$94,079$28,125$65,9542.9%$2,606$92,086$28,125$63,961$89,480CityGobles
2.2%$6,464$305,990$92,135$213,8552.9%$8,480$299,526$92,135$207,391$291,046CityHartford
2.6%$10,587$422,507$72,208$350,2996.0%$23,239$411,920$72,208$339,712$388,681CitySouth Haven
2.1%$1,091$52,856$16,737$36,1192.9%$1,470$51,765$16,737$35,028$50,295VillageBloomingdale
3.1%$479$15,832$0$15,8322.9%$426$15,353$0$15,353$14,927VillageBreedsville
2.4%$4,374$188,912$44,194$144,7182.9%$5,201$184,538$44,194$140,344$179,337VillageDecatur
2.3%$2,395$108,404$29,163$79,2412.9%$2,995$106,009$29,163$76,846$103,014VillageLawrence
2.4%$4,568$191,312$40,150$151,1622.9%$5,254$186,744$40,150$146,594$181,490VillageLawton
3.1%$4,801$158,879$0$158,8792.9%$4,273$154,078$0$154,078$149,805VillageMattawan
2.5%$8,331$338,010$62,338$275,6722.9%$9,264$329,679$62,338$267,341$320,415VillagePaw Paw
06/03/15 Prepared by The House Fiscal Agency Page 51

Revenue Sharing Payments to Cities, Villages, and TownshipsFinal FY 2013-14, Estimated FY 2014-15, and Estimated FY 2015-16 Based on SB 133 (S-1) CR-1
FY 2015-16FY 2014-15FY 2013-14
Change from FY 2014-15TotalEligibleEstimatedChange from FY 2013-14TotalEligibleEstimatedTotal
CombinedCVTConstitutionalCombinedCVTConstitutionalCombinedLocal Unit
PercentDollarPaymentPaymentPaymentPercentDollarPaymentPaymentPaymentPaymentTypeLocal Unit Name
Washtenaw County
3.1%$9,779$323,567$0$323,5672.9%$8,700$313,788$0$313,788$305,088TownshipAnn Arbor
3.1%$16,219$536,627$0$536,6272.9%$14,432$520,408$0$520,408$505,976TownshipAugusta
3.1%$4,025$133,182$0$133,1822.9%$3,581$129,157$0$129,157$125,576TownshipBridgewater
3.1%$14,528$480,697$0$480,6972.9%$12,929$466,169$0$466,169$453,240TownshipDexter
3.1%$3,434$113,610$0$113,6102.9%$3,055$110,176$0$110,176$107,121TownshipFreedom
3.1%$7,952$263,102$0$263,1022.9%$7,075$255,150$0$255,150$248,075TownshipLima
3.1%$14,567$481,970$0$481,9702.9%$12,961$467,403$0$467,403$454,442TownshipLodi
3.1%$6,297$208,365$0$208,3652.9%$5,604$202,068$0$202,068$196,464TownshipLyndon
3.1%$5,958$197,147$0$197,1472.9%$5,303$191,189$0$191,189$185,886TownshipManchester
3.0%$19,826$677,787$21,821$655,9666.4%$39,462$657,961$21,821$636,140$618,499TownshipNorthfield
3.0%$82,932$2,835,280$91,281$2,743,9996.4%$165,082$2,752,348$91,281$2,661,067$2,587,266TownshipPittsfield
3.1%$13,530$447,679$0$447,6792.9%$12,040$434,149$0$434,149$422,109TownshipSalem
3.1%$4,559$150,844$0$150,8442.9%$4,057$146,285$0$146,285$142,228TownshipSaline
3.0%$39,603$1,353,930$43,589$1,310,3416.4%$78,830$1,314,327$43,589$1,270,738$1,235,497TownshipScio
3.1%$4,177$138,194$0$138,1942.9%$3,716$134,017$0$134,017$130,301TownshipSharon
3.0%$31,398$1,073,443$34,559$1,038,8846.4%$62,499$1,042,045$34,559$1,007,486$979,546TownshipSuperior
3.1%$6,812$225,391$0$225,3912.9%$6,062$218,579$0$218,579$212,517TownshipSylvan
3.1%$15,216$503,451$0$503,4512.9%$13,540$488,235$0$488,235$474,695TownshipWebster
3.0%$19,127$653,947$21,054$632,8936.4%$38,076$634,820$21,054$613,766$596,744TownshipYork
2.8%$128,309$4,712,577$467,136$4,245,4412.9%$128,020$4,584,268$467,136$4,117,132$4,456,248TownshipYpsilanti
2.6%$273,951$10,679,413$1,615,067$9,064,3462.9%$291,632$10,405,462$1,615,067$8,790,395$10,113,830CityAnn Arbor
2.7%$11,888$453,109$59,768$393,3412.9%$12,350$441,221$59,768$381,453$428,871CityChelsea
2.8%$14,032$515,224$50,917$464,3074.6%$22,232$501,192$50,917$450,275$478,960CityMilan
2.7%$21,184$817,595$116,678$700,9172.9%$22,308$796,411$116,678$679,733$774,103CitySaline
1.9%$46,732$2,522,147$975,913$1,546,2342.9%$70,498$2,475,415$975,913$1,499,502$2,404,917CityYpsilanti
3.1%$707$23,390$0$23,3902.9%$629$22,683$0$22,683$22,054VillageBarton Hills
3.1%$9,779$328,699$5,132$323,5672.9%$8,852$318,920$5,132$313,788$310,068VillageDexter
2.7%$5,028$191,711$25,353$166,3582.9%$5,227$186,683$25,353$161,330$181,456VillageManchester
06/03/15 Prepared by The House Fiscal Agency Page 52

Revenue Sharing Payments to Cities, Villages, and TownshipsFinal FY 2013-14, Estimated FY 2014-15, and Estimated FY 2015-16 Based on SB 133 (S-1) CR-1
FY 2015-16FY 2014-15FY 2013-14
Change from FY 2014-15TotalEligibleEstimatedChange from FY 2013-14TotalEligibleEstimatedTotal
CombinedCVTConstitutionalCombinedCVTConstitutionalCombinedLocal Unit
PercentDollarPaymentPaymentPaymentPercentDollarPaymentPaymentPaymentPaymentTypeLocal Unit Name
Wayne County
2.7%$73,643$2,766,434$329,773$2,436,6612.9%$75,306$2,692,791$329,773$2,363,018$2,617,485TownshipBrownstown
3.0%$216,822$7,412,748$238,651$7,174,0975.2%$355,492$7,195,926$238,651$6,957,275$6,840,434TownshipCanton
3.0%$24,938$863,709$38,600$825,1092.9%$23,336$838,771$38,600243,039,993$815,435TownshipGrosse Ile
3.0%$38,181$1,305,346$42,025$1,263,3216.4%$76,002$1,267,165$42,025$1,225,140$1,191,163TownshipHuron
3.0%$68,521$2,342,620$75,420$2,267,2006.4%$136,396$2,274,099$75,420$2,198,679$2,137,703TownshipNorthville
3.0%$66,182$2,262,634$72,845$2,189,7895.8%$120,646$2,196,452$72,845$2,123,607$2,075,806TownshipPlymouth
2.4%$116,287$5,029,214$1,181,569$3,847,6452.9%$138,487$4,912,927$1,181,569$3,731,358$4,774,440TownshipRedford
3.0%$22,961$784,983$25,272$759,7115.7%$41,246$762,022$25,272$736,750$720,776TownshipSumpter
3.0%$69,300$2,416,256$123,279$2,292,9772.9%$65,324$2,346,956$123,279$2,223,677$2,281,632TownshipVanburen
2.6%$67,831$2,632,639$388,273$2,244,3662.9%$71,864$2,564,808$388,273$2,176,535$2,492,944CityAllen Park
2.7%$9,597$371,223$53,702$317,5212.9%$10,132$361,626$53,702$307,924$351,494CityBelleville
2.6%$235,993$9,284,415$1,475,992$7,808,4232.9%$253,734$9,048,422$1,475,992$7,572,430$8,794,688CityDearborn
2.6%$138,918$5,540,338$943,882$4,596,4562.9%$151,587$5,401,420$943,882$4,457,538$5,249,833CityDearborn Heights
0.9%$1,713,418$197,156,275$140,463,457$56,692,8183.0%$5,685,956$195,442,857$140,463,457$54,979,400$189,756,901CityDetroit
1.6%$22,862$1,446,090$689,641$756,4492.9%$40,775$1,423,228$689,641$733,587$1,382,453CityEcorse
2.7%$23,752$887,859$101,973$785,8862.9%$24,158$864,107$101,973$762,134$839,949CityFlat Rock
2.4%$66,586$2,866,441$663,286$2,203,1552.9%$78,905$2,799,855$663,286$2,136,569$2,720,950CityGarden
2.6%$11,195$434,925$64,498$370,4272.9%$11,873$423,730$64,498$359,232$411,857CityGibraltar
2.8%$13,035$474,344$43,054$431,2902.9%$12,874$461,309$43,054$418,255$448,435CityGrosse Pointe
2.9%$22,793$801,863$47,721$754,1422.9%$21,698$779,070$47,721$731,349$757,372CityGrosse Pointe Farms
2.8%$27,780$1,022,200$103,052$919,1482.9%$27,773$994,420$103,052$891,368$966,647CityGrosse Pointe Parks
3.0%$7,233$249,382$10,068$239,3142.9%$6,735$242,149$10,068$232,081$235,414CityGrosse Pointe Shores
2.7%$38,796$1,478,545$194,857$1,283,6882.9%$40,297$1,439,749$194,857$1,244,892$1,399,452CityGrosse Pointe Woods
1.7%$53,395$3,190,384$1,423,691$1,766,6932.9%$89,692$3,136,989$1,423,691$1,713,298$3,047,297CityHamtramck
2.4%$34,230$1,443,179$310,574$1,132,6052.9%$39,665$1,408,949$310,574$1,098,375$1,369,284CityHarper Woods
1.1%$28,315$2,573,165$1,636,276$936,8893.0%$73,672$2,544,850$1,636,276$908,574$2,471,178CityHighland Park
1.8%$60,999$3,450,400$1,432,062$2,018,3382.9%$96,710$3,389,401$1,432,062$1,957,339$3,292,691CityInkster
2.1%$91,717$4,530,425$1,495,717$3,034,7082.9%$125,930$4,438,708$1,495,717$2,942,991$4,312,778CityLincoln Park
2.8%$233,098$8,595,945$883,311$7,712,6342.9%$233,601$8,362,847$883,311$7,479,536$8,129,246CityLivonia
1.8%$25,764$1,432,675$580,198$852,4772.9%$40,116$1,406,911$580,198$826,713$1,366,795CityMelvindale
See the city of Northville in Oakland CountySee the city of Northville in Oakland CountyCityNorthville
2.7%$21,958$848,155$121,620$726,5352.9%$23,143$826,197$121,620$704,577$803,054CityPlymouth
1.7%$19,002$1,141,251$512,495$628,7562.9%$32,095$1,122,249$512,495$609,754$1,090,154CityRiver Rouge
2.6%$30,022$1,177,681$184,305$993,3762.9%$32,177$1,147,659$184,305$963,354$1,115,482CityRiverview
2.6%$7,909$311,252$49,582$261,6702.9%$8,508$303,343$49,582$253,761$294,835CityRockwood
2.7%$57,682$2,218,294$309,747$1,908,5472.9%$60,507$2,160,612$309,747$1,850,865$2,100,105CityRomulus
2.5%$72,248$2,987,266$596,749$2,390,5172.9%$81,972$2,915,018$596,749$2,318,269$2,833,046CitySouthgate
2.2%$151,798$7,005,041$1,982,386$5,022,6552.9%$193,814$6,853,243$1,982,386$4,870,857$6,659,429CityTaylor
2.3%$45,332$1,987,346$487,416$1,499,9302.9%$54,782$1,942,014$487,416$1,454,598$1,887,232CityTrenton
2.3%$42,303$1,915,061$515,375$1,399,6862.9%$52,913$1,872,758$515,375$1,357,383$1,819,845CityWayne
2.6%$201,928$8,033,860$1,352,553$6,681,3072.9%$219,764$7,831,932$1,352,553$6,479,379$7,612,168CityWestland
2.7%$30,958$1,197,342$173,017$1,024,3252.9%$32,675$1,166,384$173,017$993,367$1,133,709CityWoodhaven
2.2%$62,236$2,897,165$837,933$2,059,2322.9%$80,209$2,834,929$837,933$1,996,996$2,754,720CityWyandotte
06/03/15 Prepared by The House Fiscal Agency Page 53

Revenue Sharing Payments to Cities, Villages, and TownshipsFinal FY 2013-14, Estimated FY 2014-15, and Estimated FY 2015-16 Based on SB 133 (S-1) CR-1
FY 2015-16FY 2014-15FY 2013-14
Change from FY 2014-15TotalEligibleEstimatedChange from FY 2013-14TotalEligibleEstimatedTotal
CombinedCVTConstitutionalCombinedCVTConstitutionalCombinedLocal Unit
PercentDollarPaymentPaymentPaymentPercentDollarPaymentPaymentPaymentPaymentTypeLocal Unit Name
Wexford County
3.1%$1,959$64,840$0$64,8402.9%$1,744$62,881$0$62,881$61,137TownshipAntioch
3.1%$1,339$44,314$0$44,3142.9%$1,191$42,975$0$42,975$41,784TownshipBoon
3.1%$4,225$139,785$0$139,7852.9%$3,759$135,560$0$135,560$131,801TownshipCedar Creek
3.1%$5,716$189,112$0$189,1122.9%$5,086$183,396$0$183,396$178,310TownshipCherry Grove
3.1%$5,932$196,272$0$196,2722.9%$5,278$190,340$0$190,340$185,062TownshipClam Lake
3.1%$2,020$66,829$0$66,8292.9%$1,796$64,809$0$64,809$63,013TownshipColfax
3.1%$1,412$46,701$0$46,7012.9%$1,256$45,289$0$45,289$44,033TownshipGreenwood
3.1%$2,075$68,659$0$68,6592.9%$1,847$66,584$0$66,584$64,737TownshipHanover
3.1%$7,629$252,441$0$252,4412.9%$6,789$244,812$0$244,812$238,023TownshipHaring
3.1%$392$12,968$0$12,9682.8%$348$12,576$0$12,576$12,228TownshipHenderson
3.1%$2,070$68,500$0$68,5002.9%$1,841$66,430$0$66,430$64,589TownshipLiberty
3.1%$5,033$166,517$0$166,5172.9%$4,478$161,484$0$161,484$157,006TownshipSelma
3.1%$1,179$38,984$0$38,9842.8%$1,046$37,805$0$37,805$36,759TownshipSlagle
3.1%$921$30,471$0$30,4712.9%$820$29,550$0$29,550$28,730TownshipSouth Branch
3.1%$3,273$108,280$0$108,2802.9%$2,911$105,007$0$105,007$102,096TownshipSpringville
3.1%$2,578$85,287$0$85,2872.9%$2,294$82,709$0$82,709$80,415TownshipWexford
2.5%$24,800$1,010,148$189,574$820,5742.9%$27,687$985,348$189,574$795,774$957,661CityCadillac
2.3%$3,094$136,415$34,023$102,3922.9%$3,761$133,321$34,023$99,298$129,560CityManton
2.9%$1,676$59,275$3,823$55,4526.4%$3,461$57,599$3,823$53,776$54,138VillageBuckley
3.1%$343$11,376$0$11,3762.8%$305$11,033$0$11,033$10,728VillageHarrietta
2.6%$948$37,464$6,118$31,3462.9%$1,023$36,516$6,118$30,398$35,493VillageMesick
06/03/15 Prepared by The House Fiscal Agency Page 54

Revenue Sharing Payments to Cities, Villages, and TownshipsFinal FY 2013-14, Estimated FY 2014-15, and Estimated FY 2015-16 Based on SB 133 (S-1) CR-1
FY 2015-16FY 2014-15FY 2013-14
Change from FY 2014-15TotalEligibleEstimatedChange from FY 2013-14TotalEligibleEstimatedTotal
CombinedCVTConstitutionalCombinedCVTConstitutionalCombinedLocal Unit
PercentDollarPaymentPaymentPaymentPercentDollarPaymentPaymentPaymentPaymentTypeLocal Unit Name
2.3%$23,690,670$1,032,705,132$248,840,003$783,865,1293.5%$34,181,605$1,009,014,462$248,840,003$760,174,459$974,832,857TOTALS
0.9%$1,713,418$197,156,275$140,463,457$56,692,8183.0%$5,685,956$195,442,857$140,463,457$54,979,400$189,756,901Detroit
2.7%$21,977,252$835,548,857$108,376,546$727,172,3113.6%$28,495,649$813,571,605$108,376,546$705,195,059$785,075,956Other CVTs
1.9%$11,548,194$616,716,551$234,615,251$382,101,3003.0%$17,673,903$605,168,357$234,615,251$370,553,106$587,494,454Cities
2.4%$9,834,776$419,560,276$94,151,794$325,408,4823.0%$11,987,947$409,725,500$94,151,794$315,573,706$397,737,553 Less Detroit
2.7%$655,791$25,305,685$3,607,454$21,698,2313.1%$750,324$24,649,894$3,607,454$21,042,440$23,899,570Villages
3.0%$11,486,685$390,682,896$10,617,298$380,065,5984.3%$15,757,378$379,196,211$10,617,298$368,578,913$363,438,833Townships
06/03/15 Prepared by The House Fiscal Agency Page 55
