revenues: total revenues expendituresuserfiles/editor/docs/finance/monthly... · 18 parking...
TRANSCRIPT

YTD Variance
YTD Revenues and Favorable Jan 31, 2011
Budget Budget Expenditures (Unfavorable) Unaudited
REVENUES:
1 General property taxes $17,648,900 $1,470,742 $159,612 ($1,311,129) $182,909
2 Sales taxes 92,199,900 7,683,325 7,360,028 (323,297) 5,817,318
3 Licenses and permits 9,664,800 805,400 4,599,449 3,794,049 4,581,517
4 Intergovernmental 2,190,000 182,500 0 (182,500) 0
5 Charges for services 4,902,200 408,517 418,133 9,616 419,802
6 Fines and fees 3,401,700 283,475 192,331 (91,144) 189,457
7 Utility franchise fees 26,332,200 2,194,350 783,213 (1,411,137) 801,680
8 Investment income 25,000 2,083 725 (1,358) 3,185
9 Miscellaneous 875,600 72,967 57,522 (15,445) 88,692
10 TOTAL REVENUES 157,240,300 13,103,358 13,571,013 467,655 12,084,561
EXPENDITURES:
GENERAL GOVERNMENT:
11 General Administration 21,800,398 1,816,700 1,314,300 502,400 1,139,310
12 Board of Directors 236,721 19,727 16,556 3,171 16,412
13 Community Programs 372,645 31,054 35,527 (4,474) 27,825
14 City Attorney 1,615,725 134,644 135,137 (493) 124,436
15 District Court - First Division (Criminal) 1,348,558 112,380 98,894 13,486 95,855
16 District Court - Third Division (Environmental) 543,771 45,314 42,832 2,482 42,167
17 District Court - Second Division (Traffic) 1,187,972 98,998 141,544 (42,547) 136,072
18 Finance 2,753,231 229,436 233,970 (4,534) 242,433
19 Human Resources 1,477,887 123,157 105,888 17,269 118,278
20 Information Technology 4,122,201 343,517 294,174 49,343 263,532
21 Planning and Development 2,347,479 195,623 155,455 40,169 158,607
22 TOTAL GENERAL GOVERNMENT 37,806,588 3,150,549 2,574,278 576,271 2,364,927
23 PUBLIC WORKS 1,112,595 92,716 70,189 22,527 74,656
24 PARKS & RECREATION 8,463,789 705,316 434,118 271,198 485,845
25 FIRE 36,222,266 3,018,522 2,731,776 286,746 2,629,343
26 POLICE 54,710,388 4,559,199 4,290,319 268,880 4,002,035
27 HOUSING & NEIGHBORHOOD PROGRAMS 4,621,336 385,111 319,551 65,560 294,784
28 VACANCY SAVINGS (2,914,060) (242,838) 0 (242,838) 0
29 TOTAL EXPENDITURES 140,022,902 11,668,575 10,420,231 1,248,344 9,851,589
30 REVENUES OVER (UNDER) EXPENDITURES 17,217,398 1,434,783 3,150,782 1,715,998 2,232,972
OTHER FINANCING SOURCES/(USES):
31 TRANSFERS IN 1,319,515 109,960 1,319,515 1,209,555 1,499,072
32 TRANSFERS OUT (18,536,913) (1,544,743) (10,774,440) (9,229,697) (4,318,399)
REVENUES AND OTHER FINANCING SOURCES OVER (UNDER)
33 EXPENDITURES AND OTHER FINANCING USES 0 0 (6,304,144) (6,304,144) (586,355)
34 BEGINNING FUND BALANCE 24,539,896 24,539,896 24,539,896 0 24,866,080
35 ENDING FUND BALANCE (Notes 1 and 2) $24,539,896 $24,539,896 $18,235,752 ($6,304,144) $24,279,725
Note 1: Total encumbrances included in the reported expenditures are $61,319.
Note 2: This presentation includes Fund 100A restricted reserves of $9,418,000.
1
This Monthly Financial Report was presented to the Little Rock
Board of Directors at its meeting on May 29, 2012
(Unaudited)
City of Little Rock, Arkansas
Monthly Financial Report
General Fund
For the Period Ended January 31, 2012
YTD Variance
YTD Revenues and Favorable Jan 31, 2011
Budget Budget Expenditures (Unfavorable) Unaudited
REVENUES:
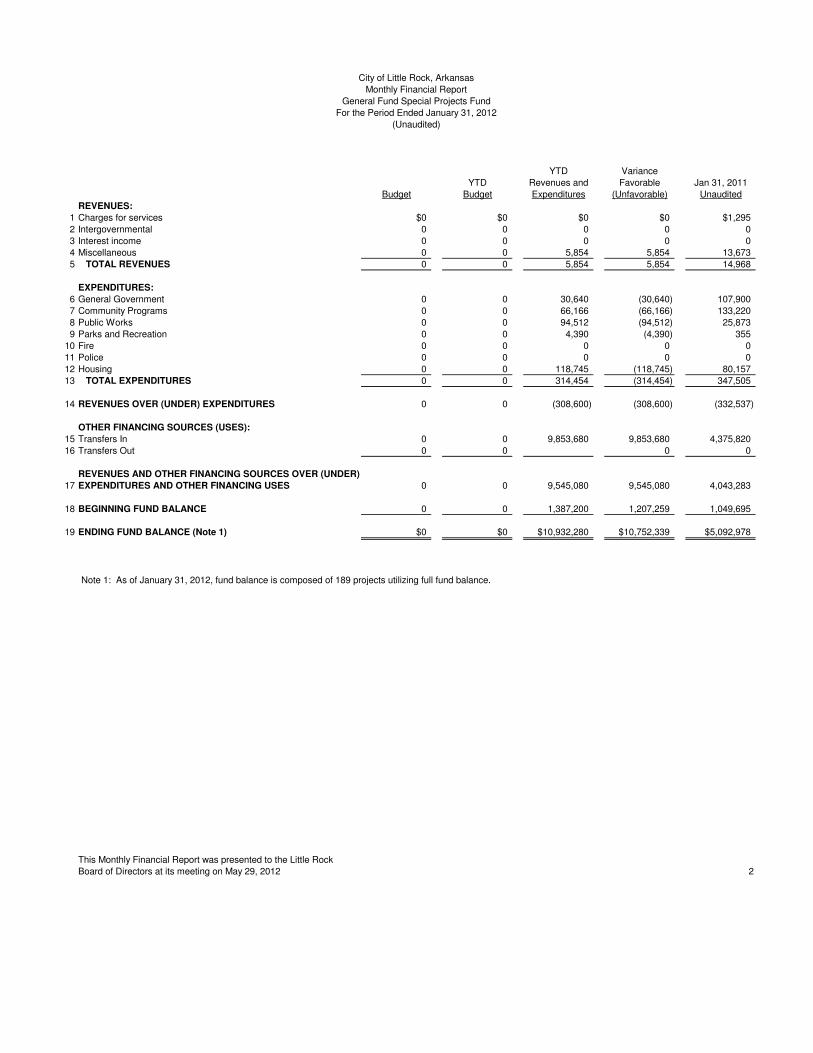
1 Charges for services $0 $0 $0 $0 $1,295
2 Intergovernmental 0 0 0 0 0
3 Interest income 0 0 0 0 0
4 Miscellaneous 0 0 5,854 5,854 13,673
5 TOTAL REVENUES 0 0 5,854 5,854 14,968
EXPENDITURES:
6 General Government 0 0 30,640 (30,640) 107,900
7 Community Programs 0 0 66,166 (66,166) 133,220
8 Public Works 0 0 94,512 (94,512) 25,873
9 Parks and Recreation 0 0 4,390 (4,390) 355
10 Fire 0 0 0 0 0
11 Police 0 0 0 0 0
12 Housing 0 0 118,745 (118,745) 80,157
13 TOTAL EXPENDITURES 0 0 314,454 (314,454) 347,505
14 REVENUES OVER (UNDER) EXPENDITURES 0 0 (308,600) (308,600) (332,537)
OTHER FINANCING SOURCES (USES):
15 Transfers In 0 0 9,853,680 9,853,680 4,375,820
16 Transfers Out 0 0 0 0
REVENUES AND OTHER FINANCING SOURCES OVER (UNDER)
17 EXPENDITURES AND OTHER FINANCING USES 0 0 9,545,080 9,545,080 4,043,283
18 BEGINNING FUND BALANCE 0 0 1,387,200 1,207,259 1,049,695
19 ENDING FUND BALANCE (Note 1) $0 $0 $10,932,280 $10,752,339 $5,092,978
Note 1: As of January 31, 2012, fund balance is composed of 189 projects utilizing full fund balance.
This Monthly Financial Report was presented to the Little Rock
Board of Directors at its meeting on May 29, 2012 2
(Unaudited)
City of Little Rock, Arkansas
Monthly Financial Report
General Fund Special Projects Fund
For the Period Ended January 31, 2012

YTD Variance
YTD Revenues and Favorable Jan 31, 2011
Budget Budget Expenditures (Unfavorable) Unaudited
REVENUES:
1 General property taxes $5,040,000 $420,000 $46,284 ($373,716) $49,036
2 Intergovernmental 9,770,794 814,233 694,496 (119,737) 656,949
3 Charges for services 9,000 750 1,057 307 633
4 Investment income 1,000 83 243 160 363
5 Miscellaneous 15,000 1,250 3,421 2,171 0
6 TOTAL REVENUES 14,835,794 1,236,316 745,501 (490,815) 706,980
EXPENDITURES:
Public Works:
7 General Administration 1,155,600 96,300 57,209 39,091 65,257
8 Operations Administration 566,400 47,200 39,301 7,899 36,737
9 Street & Drainage Maintenance 6,288,743 524,062 431,952 92,110 450,340
10 Storm Drainage Maintenance 860,545 71,712 62,040 9,672 68,955
11 Work Pool 145,182 12,099 8,959 3,140 6,873
12 Resource Control & Scheduling 371,584 30,965 29,840 1,126 29,927
13 Control Devices 885,856 73,821 43,772 30,050 43,983
14 Signals 755,481 62,957 73,156 (10,199) 53,398
15 Parking Meters 96,315 8,026 8,618 (592) 6,707
16 Civil Engineering 1,338,163 111,514 101,254 10,259 106,495
17 Traffic Engineering 3,356,216 279,685 276,098 3,587 302,998
18 Parking Enforcement 265,310 22,109 17,078 5,032 15,742
19 TOTAL EXPENDITURES 16,085,395 1,340,450 1,149,276 191,174 1,187,412
20 REVENUES OVER (UNDER) EXPENDITURES (1,249,601) (104,133) (403,775) (299,641) (480,432)
OTHER FINANCING SOURCES (USES):
21 Transfers In 1,715,818 142,985 1,069,771 926,786 654,222
22 Transfers Out (466,217) (38,851) (466,217) (427,366) (466,217)
REVENUES AND OTHER FINANCING SOURCES OVER (UNDER)
23 EXPENDITURES AND OTHER FINANCING USES 0 (0) 199,779 199,779 (292,427)
24 BEGINNING FUND BALANCE 3,823,328 3,823,328 3,823,328 0 2,666,905
25 ENDING FUND BALANCE (Note 1) $3,823,328 $3,823,328 $4,023,107 $199,779 $2,374,478
Note 1: Fund 205, Street Special Projects Fund, is considered part of the Street Fund.
The January 31, 2012 fund balance in Fund 205 is $26,535.
This Monthly Financial Report was presented to the Little Rock
Board of Directors at its meeting on May 29, 2012 3
(Unaudited)
City of Little Rock, Arkansas
Monthly Financial Report
Street Fund
For the Period Ended January 31, 2012

YTD Variance
YTD Revenues and Favorable Jan 31, 2011
Budget Budget Expenditures (Unfavorable) Unaudited
REVENUES:
1 Charges for services $0 $0 $0 $0 $0
2 Interest income 0 0 0 0 0
3 Miscellaneous 0 0 0 0 0
4 TOTAL REVENUES 0 0 0 0 0
EXPENDITURES:
5 Public Works 0 0 0 0 99,477
6 TOTAL EXPENDITURES 0 0 0 0 99,477
7 REVENUES OVER (UNDER) EXPENDITURES 0 0 0 0 (99,477)
OTHER FINANCING SOURCES (USES):
8 Transfers In 0 0 0 - 0
9 Transfers Out 0 0 0 0 (53,041)
REVENUES AND OTHER FINANCING SOURCES OVER (UNDER)
10 EXPENDITURES AND OTHER FINANCING USES 0 0 0 0 (152,518)
11 BEGINNING FUND BALANCE 0 0 26,535 26,535 160,748
12 ENDING FUND BALANCE (Note 1) $0 $0 $26,535 $26,535 $8,230
Note 1: As of January 31, 2012, special project commitments for 4 projects utilizing full fund balance.
This Monthly Financial Report was presented to the Little Rock
Board of Directors at its meeting on May 29, 2012 4
(Unaudited)
City of Little Rock, Arkansas
Monthly Financial Report
Street Fund Special Projects Fund
For the Period Ended January 31, 2012

YTD Variance
YTD Revenues and Favorable Jan 31, 2011
Budget Budget Expenditures (Unfavorable) Unaudited
REVENUES:
1 Charges for services $0 $0 $0 $0 $0
2 Interest income 0 0 43 43 19
3 Miscellaneous 0 0 25,098 25,098 907
4 TOTAL REVENUES 0 0 25,141 25,141 926
EXPENDITURES:
5 Police 0 0 32,424 (32,424) 29,968
6 TOTAL EXPENDITURES 0 0 32,424 (32,424) 29,968
7 REVENUES OVER (UNDER) EXPENDITURES 0 0 (7,283) (7,283) (29,041)
OTHER FINANCING SOURCES (USES):
8 Transfers In 0 0 0 0 0
9 Transfers Out 0 0 0 0 0
REVENUES AND OTHER FINANCING SOURCES OVER (UNDER)
10 EXPENDITURES AND OTHER FINANCING USES 0 0 (7,283) (7,283) (29,041)
11 BEGINNING FUND BALANCE 0 0 81,059 81,059 95,882
12 ENDING FUND BALANCE $0 $0 $73,777 $73,777 $66,841
This Monthly Financial Report was presented to the Little Rock
Board of Directors at its meeting on May 29, 2012 5
City of Little Rock, Arkansas
(Unaudited)
For the Period Ended January 31, 2012
Seized Money Fund
Monthly Financial Report
YTD Variance
YTD Revenues and Favorable Jan 31, 2011
Budget Budget Expenditures (Unfavorable) Unaudited
REVENUES:
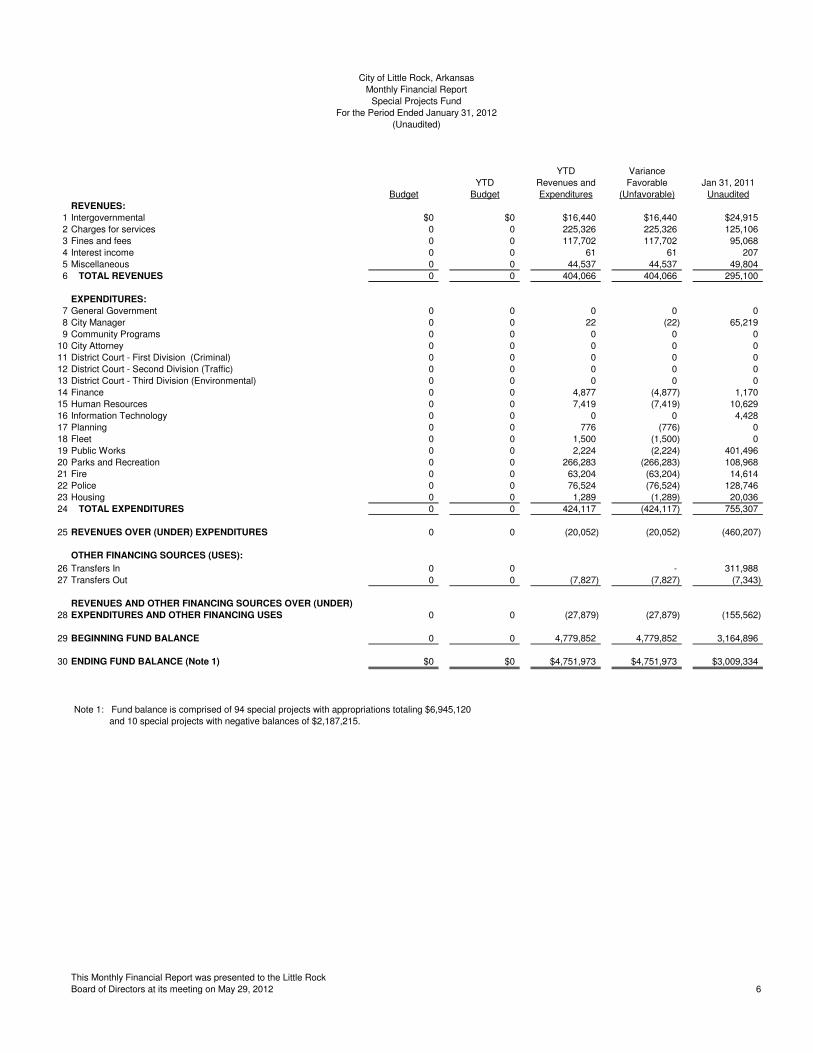
1 Intergovernmental $0 $0 $16,440 $16,440 $24,915
2 Charges for services 0 0 225,326 225,326 125,106
3 Fines and fees 0 0 117,702 117,702 95,068
4 Interest income 0 0 61 61 207
5 Miscellaneous 0 0 44,537 44,537 49,804
6 TOTAL REVENUES 0 0 404,066 404,066 295,100
EXPENDITURES:
7 General Government 0 0 0 0 0
8 City Manager 0 0 22 (22) 65,219
9 Community Programs 0 0 0 0 0
10 City Attorney 0 0 0 0 0
11 District Court - First Division (Criminal) 0 0 0 0 0
12 District Court - Second Division (Traffic) 0 0 0 0 0
13 District Court - Third Division (Environmental) 0 0 0 0 0
14 Finance 0 0 4,877 (4,877) 1,170
15 Human Resources 0 0 7,419 (7,419) 10,629
16 Information Technology 0 0 0 0 4,428
17 Planning 0 0 776 (776) 0
18 Fleet 0 0 1,500 (1,500) 0
19 Public Works 0 0 2,224 (2,224) 401,496
20 Parks and Recreation 0 0 266,283 (266,283) 108,968
21 Fire 0 0 63,204 (63,204) 14,614
22 Police 0 0 76,524 (76,524) 128,746
23 Housing 0 0 1,289 (1,289) 20,036
24 TOTAL EXPENDITURES 0 0 424,117 (424,117) 755,307
25 REVENUES OVER (UNDER) EXPENDITURES 0 0 (20,052) (20,052) (460,207)
OTHER FINANCING SOURCES (USES):
26 Transfers In 0 0 - 311,988
27 Transfers Out 0 0 (7,827) (7,827) (7,343)
REVENUES AND OTHER FINANCING SOURCES OVER (UNDER)
28 EXPENDITURES AND OTHER FINANCING USES 0 0 (27,879) (27,879) (155,562)
29 BEGINNING FUND BALANCE 0 0 4,779,852 4,779,852 3,164,896
30 ENDING FUND BALANCE (Note 1) $0 $0 $4,751,973 $4,751,973 $3,009,334
Note 1: Fund balance is comprised of 94 special projects with appropriations totaling $6,945,120
and 10 special projects with negative balances of $2,187,215.
This Monthly Financial Report was presented to the Little Rock
Board of Directors at its meeting on May 29, 2012 6
City of Little Rock, Arkansas
(Unaudited)
For the Period Ended January 31, 2012
Special Projects Fund
Monthly Financial Report

YTD Variance
YTD Revenues and Favorable Jan 31, 2011
Budget Budget Expenditures (Unfavorable) Unaudited
REVENUES:
1 Intergovernmental $0 $0 $0 $0 $0
2 Interest income 0 0 7 7 23
3 TOTAL REVENUES 0 0 7 7 23
EXPENDITURES:
4 Public Works 0 0 11,693 (11,693) 9,093
TOTAL EXPENDITURES 0 0 11,693 (11,693) 9,093
5 REVENUES OVER (UNDER) EXPENDITURES 0 0 (11,686) (11,686) (9,070)
OTHER FINANCING SOURCES (USES):
6 Transfers In 0 0 0 0 0
7 Transfers Out 0 0 0 0 0
REVENUES AND OTHER FINANCING SOURCES OVER (UNDER)
8 EXPENDITURES AND OTHER FINANCING USES 0 0 (11,686) (11,686) (9,069)
9 BEGINNING FUND BALANCE 0 0 57,863 57,863 58,729
10 ENDING FUND BALANCE (Note 1) $0 $0 $46,177 $46,177 $49,660
Note 1: As of January 31, 2012, the fund balance has been allocated to 3 special projects.
This Monthly Financial Report was presented to the Little Rock
Board of Directors at its meeting on May 29, 2012 7
(Unaudited)
City of Little Rock, Arkansas
Monthly Financial Report
Infrastructure Fund
For the Period Ended January 31, 2012

YTD Variance
YTD Revenues and Favorable Jan 31, 2011
Budget Budget Expenditures (Unfavorable) Unaudited
REVENUES:
1 Intergovernmental $0 $0 $332,485 $332,485 $252,589
2 Charges for Services 0 0 0 0
3 Interest income 0 0 39 39 433
4 TOTAL REVENUES 0 0 332,524 332,524 253,022
EXPENDITURES:
5 General Government 0 0 284,314 (284,314) 173,254
6 Public Works 0 0 411,760 (411,760) 6,460,252
7 Parks & Recreation 0 0 26,648 (26,648) 0
8 Fleet 0 0 0 0 0
9 Fire 0 0 1,707,338 (1,707,338) 187,049
10 Police 0 0 308,271 (308,271) 314,757
11 Housing 0 0 0 0 0
TOTAL EXPENDITURES 0 0 2,738,331 (2,738,331) 7,135,313
12
REVENUES OVER (UNDER) EXPENDITURES 0 0 (2,405,807) (2,405,807) (6,882,291)
13 OTHER FINANCING SOURCES (USES):
14 Transfers In 0 0 0 - 0
Transfers Out 0 0 0 0 0
15 REVENUES AND OTHER FINANCING SOURCES OVER (UNDER)
EXPENDITURES AND OTHER FINANCING USES 0 0 (2,405,807) (2,405,807) (6,882,291)
16
BEGINNING FUND BALANCE 0 0 (2,396) (2,396) 19,605
17
ENDING FUND BALANCE $0 $0 ($2,408,203) ($2,408,203) ($6,862,686)
Expenditures include:
Expended 332,393
Encumbrances 2,405,938
2,738,331$
This Monthly Financial Report was presented to the Little Rock
Board of Directors at its meeting on May 29, 2012 8
(Unaudited)
City of Little Rock, Arkansas
Monthly Financial Report
Grant Fund
For the Period Ended January 31, 2012

YTD Variance
YTD Revenues and Favorable Jan 31, 2011
Budget Budget Expenditures (Unfavorable) Unaudited
REVENUES:
1 Charges for services $0 $0 $25,000 25,000 $48,000
2 Interest income 0 0 0 0 0
3 Miscellaneous 0 0 0 0 0
4 TOTAL REVENUES 0 0 25,000 25,000 48,000
EXPENDITURES:
5 Police 0 0 120,965 (120,965) 128,599
6 TOTAL EXPENDITURES 0 0 120,965 (120,965) 128,599
7 REVENUES OVER (UNDER) EXPENDITURES 0 0 (95,965) (95,965) (80,599)
OTHER FINANCING SOURCES (USES):
8 Transfers In 0 0 0 0 0
9 Transfers Out 0 0 0 0 0
REVENUES AND OTHER FINANCING SOURCES OVER (UNDER)
10 EXPENDITURES AND OTHER FINANCING USES 0 0 (95,965) (95,965) (80,599)
11 BEGINNING FUND BALANCE 0 0 2,822 2,822 2,822
12 ENDING FUND BALANCE $0 $0 ($93,143) ($93,143) ($77,777)
This Monthly Financial Report was presented to the Little Rock
Board of Directors at its meeting on May 29, 2012 9
(Unaudited)
City of Little Rock, Arkansas
Monthly Financial Report
Emergency 911 Fund
For the Period Ended January 31, 2012

YTD Variance
YTD Revenues and Favorable Jan 31, 2011
Budget Budget Expenditures (Unfavorable) Unaudited
REVENUES:
1 Intergovernmental $0 $0 $486,080 $486,080 $329,619
2 Charges for Services 0 0 0 0 0
3 Miscellaneous 0 0 0 0 0
4 TOTAL REVENUES 0 0 486,080 486,080 329,619
EXPENDITURES:
5 General Government 0 0 0 0 0
6 Housing 0 0 1,099,324 (1,099,324) 317,443
7 TOTAL EXPENDITURES 0 0 1,099,324 (1,099,324) 317,443
8 REVENUES OVER (UNDER) EXPENDITURES 0 0 (613,243) (613,243) 12,176
OTHER FINANCING SOURCES (USES):
9 Transfers In 0 0 0 0 0
10 Transfers Out 0 0 0 0 0
REVENUES AND OTHER FINANCING SOURCES OVER (UNDER)
EXPENDITURES AND OTHER FINANCING USES 0 0 (613,243) (613,243) 12,176
12 BEGINNING FUND BALANCE 0 0 1,184,797 1,184,797 115,558
13 ENDING FUND BALANCE $0 $0 $571,554 $571,554 $127,734
This Monthly Financial Report was presented to the Little Rock
Board of Directors at its meeting on May 29, 2012 10
(Unaudited)
City of Little Rock, Arkansas
Monthly Financial Report
Community Development Block Grant Fund
For the Period Ended January 31, 2012

YTD Variance
YTD Revenues and Favorable Jan 31, 2011
Budget Budget Expenditures (Unfavorable) Unaudited
REVENUES:
1 Intergovernmental $0 $0 $17,403 $17,403 $66,000
2 Charges for Services 0 0 0 0 0
3 Miscellaneous 0 0 0 0 0
4 TOTAL REVENUES 0 0 17,403 17,403 66,000
EXPENDITURES:
5 General Government 0 0 0 0 0
6 Housing 0 0 230,159 (230,159) 17,044
7 TOTAL EXPENDITURES 0 0 230,159 (230,159) 17,044
8 REVENUES OVER (UNDER) EXPENDITURES 0 0 (212,757) (212,757) 48,956
OTHER FINANCING SOURCES (USES):
9 Transfers In 0 0 0 0 0
10 Transfers Out 0 0 0 0 0
REVENUES AND OTHER FINANCING SOURCES OVER (UNDER)
11 EXPENDITURES AND OTHER FINANCING USES 0 0 (212,757) (212,757) 48,956
12 BEGINNING FUND BALANCE 0 0 531,720 531,720 645,687
13 ENDING FUND BALANCE $0 $0 $318,963 $318,963 $694,643
This Monthly Financial Report was presented to the Little Rock
Board of Directors at its meeting on May 29, 2012 11
(Unaudited)
City of Little Rock, Arkansas
Monthly Financial Report
HIPP Fund
For the Period Ended January 31, 2012

YTD Variance
YTD Revenues and Favorable Jan 31, 2011
Budget Budget Expenditures (Unfavorable) Unaudited
REVENUES:
1 Intergovernmental $0 $0 $3 $3 $5,700
2 Charges for Services 0 0 0 0 0
3 Miscellaneous 0 0 0 0 0
4 TOTAL REVENUES 0 0 3 3 5,700
EXPENDITURES:
5 General Government 0 0 0 0 0
6 Housing 0 0 20,367 (20,367) 8,929
7 TOTAL EXPENDITURES 0 0 20,367 (20,367) 8,929
8 REVENUES OVER (UNDER) EXPENDITURES 0 0 (20,364) (20,364) (3,229)
OTHER FINANCING SOURCES (USES):
9 Loan Proceeds 0 0 0 0 0
10 Transfers In 0 0 0 0 0
11 Transfers Out 0 0 0 0 0
REVENUES AND OTHER FINANCING SOURCES OVER (UNDER)
12 EXPENDITURES AND OTHER FINANCING USES 0 0 (20,364) (20,364) (3,229)
13 BEGINNING FUND BALANCE 0 0 189,932 189,932 156,664
14 ENDING FUND BALANCE $0 $0 $169,568 $169,568 $153,435
This Monthly Financial Report was presented to the Little Rock
Board of Directors at its meeting on May 29, 2012 12
(Unaudited)
City of Little Rock, Arkansas
Monthly Financial Report
NHSP Fund
For the Period Ended January 31, 2012

YTD Variance
YTD Revenues and Favorable Jan 31, 2011
Budget Budget Expenditures (Unfavorable) Unaudited
REVENUES:
1 Charges for Services $0 $0 $0 $0 $0
2 Interest income 0 0 556 556 633
3 Donations 0 0 0 0 0
4 TOTAL REVENUES 0 0 556 556 633
EXPENDITURES:
5 General Government 0 0 23,936 (23,936) 41,711
6 Public Works 0 0 703,522 (703,522) 0
7 Parks and Recreation 0 0 0 0 0
8 Fire 0 0 2,019,194 (2,019,194) 0
9 Police 0 0 86,244 (86,244) 267,391
10 Housing 0 0 0 0 0
11 TOTAL EXPENDITURES 0 0 2,832,896 (2,832,896) 309,102
12 REVENUES OVER (UNDER) EXPENDITURES 0 0 (2,832,340) (2,832,340) (308,468)
OTHER FINANCING SOURCES (USES):
13 Temporary Note Proceeds 0 0 0 0 0
14 Transfers Out 0 0 0 0 0
REVENUES AND OTHER FINANCING SOURCES OVER (UNDER)
15 EXPENDITURES AND OTHER FINANCING USES 0 0 (2,832,340) (2,832,340) (308,468)
16 BEGINNING FUND BALANCE 0 0 5,652,968 5,652,968 1,666,491
17 ENDING FUND BALANCE $0 $0 $2,820,628 $2,820,628 $1,358,023
This Monthly Financial Report was presented to the Little Rock
Board of Directors at its meeting on May 29, 2012 13
For the Period Ended January 31, 2012
(Unaudited)
City of Little Rock, Arkansas
Monthly Financial Report
Short Term Capital Fund

YTD Variance
YTD Revenues and Favorable Jan 31, 2011
Budget Budget Expenditures (Unfavorable) Unaudited
REVENUES:
1 3/8 Cent Sales Tax $0 $0 $1,263,349 $1,263,349 $0
2 Interest income 0 0 0 0 0
3 Miscellaneous Income 0 0 0 0 0
4 TOTAL REVENUES 0 0 1,263,349 1,263,349 0
EXPENDITURES:
5 General Government 0 0 0 0 0
6 Housing 0 0 0 0 0
7 Public Works 0 0 0 0 0
8 Parks and Recreation 0 0 0 0 0
9 Fire 0 0 0 0 0
10 Police 0 0 8,136,042 (8,136,042) 0
11 Fleet 0 0 0 0 0
12 Zoo 0 0 0 0 0
13 TOTAL EXPENDITURES 0 0 8,136,042 (8,136,042) 0
14 REVENUES OVER (UNDER) EXPENDITURES 0 0 (6,872,693) (6,872,693) 0
OTHER FINANCING SOURCES (USES):
15 Temporary Note Proceeds 0 0 0 0 0
16 Transfers Out 0 0 0 0 0
REVENUES AND OTHER FINANCING SOURCES OVER (UNDER)
17 EXPENDITURES AND OTHER FINANCING USES 0 0 (6,872,693) (6,872,693) 0
18 BEGINNING FUND BALANCE 0 0 0 0 0
19 ENDING FUND BALANCE $0 $0 ($6,872,693) ($6,872,693) $0
Expenditures include:
Expended -
Encumbrances 8,136,042.00
Total 8,136,042.00
This Monthly Financial Report was presented to the Little Rock
Board of Directors at its meeting on May 29, 2012 14
For the Period Ended January 31, 2012
(Unaudited)
City of Little Rock, Arkansas
Monthly Financial Report
2012-2021 Capital Project Fund

YTD Variance
YTD Revenues and Favorable Jan 31, 2011
Budget Budget Expenditures (Unfavorable) Unaudited
REVENUES:
1 Intergovernmental $0 $0 $0 $0 $0
2 Charges for Services 0 0 0 0 0
3 Interest income 0 0 90 90 392
4 TOTAL REVENUES 0 0 90 90 392
EXPENDITURES:
5 Public Works 0 0 0 0 0
6 Parks and Recreation 0 0 0 0 0
7 TOTAL EXPENDITURES 0 0 0 0 0
8 REVENUES OVER (UNDER) EXPENDITURES 0 0 90 90 392
OTHER FINANCING SOURCES (USES):
9 Transfer In 0 0 0 0 0
10 Transfers Out 0 0 0 0 0
REVENUES AND OTHER FINANCING SOURCES OVER (UNDER)
11 EXPENDITURES AND OTHER FINANCING USES 0 0 90 90 392
12 BEGINNING FUND BALANCE 0 0 862,500 862,500 1,027,771
13 ENDING FUND BALANCE (Note 1) $0 $0 $862,590 $862,590 $1,028,163
Note 1: As of January 31, 2012, the fund balance has been allocated to 2 special projects,
including an infrastructure reserve in the amount of $81,573.
This Monthly Financial Report was presented to the Little Rock
Board of Directors at its meeting on May 29, 2012 15
(Unaudited)
City of Little Rock, Arkansas
Monthly Financial Report
1988 Capital Improvement Fund
For the Period Ended January 31, 2012

YTD Variance
YTD Revenues and Favorable Jan 31, 2011
Budget Budget Expenditures (Unfavorable) Unaudited
REVENUES:
1 Charges for Services $0 $0 $0 $0 $0
2 Interest income 0 0 0 0 0
3 Miscellaneous 0 0 0 0 0
4 TOTAL REVENUES 0 0 0 0 0
EXPENDITURES:
5 Public Works 0 0 0 0 0
6 Parks and Recreation 0 0 0 0 0
7 Fire 0 0 0 0 0
8 Housing 0 0 0 0 0
9 TOTAL EXPENDITURES 0 0 0 0 0
10 REVENUES OVER (UNDER) EXPENDITURES 0 0 0 0 0
OTHER FINANCING SOURCES (USES):
11 Transfer In 0 0 0 0 0
12 Transfers Out 0 0 0 0 0
REVENUES AND OTHER FINANCING SOURCES OVER (UNDER)
13 EXPENDITURES AND OTHER FINANCING USES 0 0 0 0 0
14 BEGINNING FUND BALANCE 0 0 0 0 9
15 ENDING FUND BALANCE (Note 1) $0 $0 $0 $0 $9
This Monthly Financial Report was presented to the Little Rock
Board of Directors at its meeting on May 29, 2012 16
(Unaudited)
City of Little Rock, Arkansas
Monthly Financial Report
1995 Capital Improvement Fund
For the Period Ended January 31, 2012

YTD Variance
YTD Revenues and Favorable Jan 31, 2011
Budget Budget Expenditures (Unfavorable) Unaudited
REVENUES:
1 Intergovernmental $0 $0 $0 $0 $0
2 Charges for Services 0 0 0 0 0
3 Interest income 0 0 103 103 385
4 TOTAL REVENUES 0 0 103 103 385
EXPENDITURES:
5 Public Works 0 0 11,195 (11,195) 21,791
6 Housing 0 0 0 0 0
7 TOTAL EXPENDITURES 0 0 11,195 (11,195) 21,791
8 REVENUES OVER (UNDER) EXPENDITURES 0 0 (11,092) (11,092) (21,406)
OTHER FINANCING SOURCES (USES):
9 Transfer In 0 0 0 0 0
10 Transfers Out 0 0 0 0 (49,515)
REVENUES AND OTHER FINANCING SOURCES OVER (UNDER)
11 EXPENDITURES AND OTHER FINANCING USES 0 0 (11,092) (11,092) (70,921)
12 BEGINNING FUND BALANCE 0 0 978,603 978,603 1,032,343
13 ENDING FUND BALANCE (Note 1) $0 $0 $967,511 $967,511 $961,422
Note 1: As of January 31, 2012, the fund balance has been allocated to 3 special projects,
including an infrastructure reserve in the amount of $4,389.
This Monthly Financial Report was presented to the Little Rock
Board of Directors at its meeting on May 29, 2012 17
(Unaudited)
City of Little Rock, Arkansas
Monthly Financial Report
1998 Capital Improvement Fund
For the Period Ended January 31, 2012
YTD Variance
YTD Revenues and Favorable Jan 31, 2011
Budget Budget Expenditures (Unfavorable) Unaudited
REVENUES:
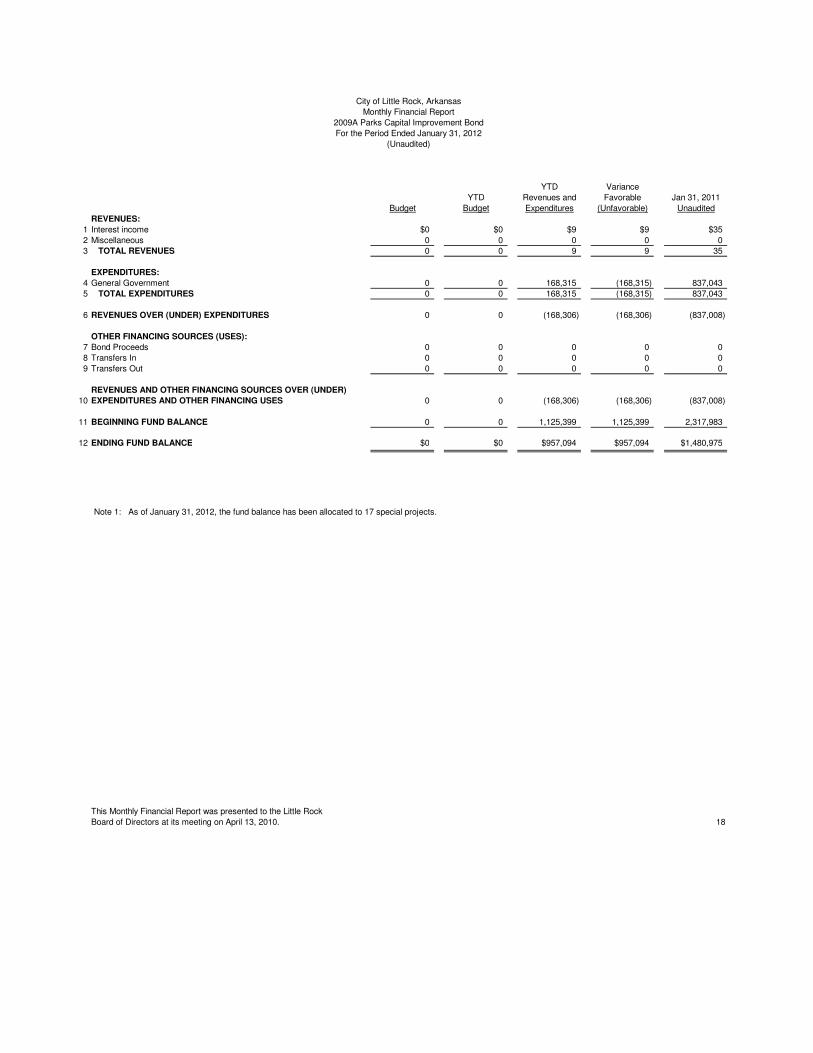
1 Interest income $0 $0 $9 $9 $35
2 Miscellaneous 0 0 0 0 0
3 TOTAL REVENUES 0 0 9 9 35
EXPENDITURES:
4 General Government 0 0 168,315 (168,315) 837,043
5 TOTAL EXPENDITURES 0 0 168,315 (168,315) 837,043
6 REVENUES OVER (UNDER) EXPENDITURES 0 0 (168,306) (168,306) (837,008)
OTHER FINANCING SOURCES (USES):
7 Bond Proceeds 0 0 0 0 0
8 Transfers In 0 0 0 0 0
9 Transfers Out 0 0 0 0 0
REVENUES AND OTHER FINANCING SOURCES OVER (UNDER)
10 EXPENDITURES AND OTHER FINANCING USES 0 0 (168,306) (168,306) (837,008)
11 BEGINNING FUND BALANCE 0 0 1,125,399 1,125,399 2,317,983
12 ENDING FUND BALANCE $0 $0 $957,094 $957,094 $1,480,975
Note 1: As of January 31, 2012, the fund balance has been allocated to 17 special projects.
This Monthly Financial Report was presented to the Little Rock
Board of Directors at its meeting on April 13, 2010. 18
(Unaudited)
City of Little Rock, Arkansas
Monthly Financial Report
2009A Parks Capital Improvement Bond
For the Period Ended January 31, 2012
YTD Variance
YTD Revenues and Favorable Jan 31, 2011
Budget Budget Expenditures (Unfavorable) Unaudited
REVENUES:
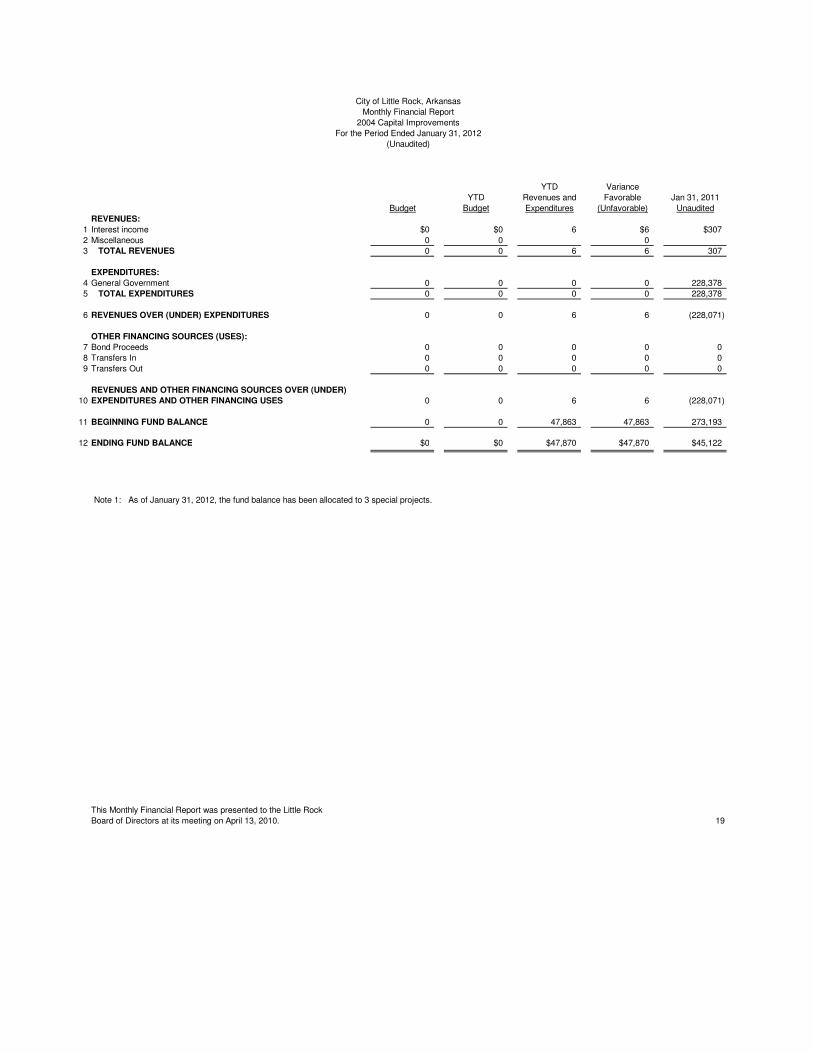
1 Interest income $0 $0 6 $6 $307
2 Miscellaneous 0 0 0
3 TOTAL REVENUES 0 0 6 6 307
EXPENDITURES:
4 General Government 0 0 0 0 228,378
5 TOTAL EXPENDITURES 0 0 0 0 228,378
6 REVENUES OVER (UNDER) EXPENDITURES 0 0 6 6 (228,071)
OTHER FINANCING SOURCES (USES):
7 Bond Proceeds 0 0 0 0 0
8 Transfers In 0 0 0 0 0
9 Transfers Out 0 0 0 0 0
REVENUES AND OTHER FINANCING SOURCES OVER (UNDER)
10 EXPENDITURES AND OTHER FINANCING USES 0 0 6 6 (228,071)
11 BEGINNING FUND BALANCE 0 0 47,863 47,863 273,193
12 ENDING FUND BALANCE $0 $0 $47,870 $47,870 $45,122
Note 1: As of January 31, 2012, the fund balance has been allocated to 3 special projects.
This Monthly Financial Report was presented to the Little Rock
Board of Directors at its meeting on April 13, 2010. 19
(Unaudited)
City of Little Rock, Arkansas
Monthly Financial Report
2004 Capital Improvements
For the Period Ended January 31, 2012

YTD Variance
YTD Revenues and Favorable Jan 31, 2011
Budget Budget Expenditures (Unfavorable) Actual
REVENUES:
1 Interest income $0 $0 $67 $67 $2,458
2 Miscellaneous 0 0 0 0 0
3 TOTAL REVENUES 0 0 67 67 2,458
EXPENDITURES:
4 General Government 0 0 313,303 (313,303) 521,207
5 TOTAL EXPENDITURES 0 0 313,303 (313,303) 521,207
6 REVENUES OVER (UNDER) EXPENDITURES 0 0 (313,236) (313,236) (518,749)
OTHER FINANCING SOURCES (USES):
7 Bond Proceeds 0 0 0 0 0
8 Transfers In 0 0 0 0 0
9 Transfers Out 0 0 0 0 0
REVENUES AND OTHER FINANCING SOURCES OVER (UNDER)
10 EXPENDITURES AND OTHER FINANCING USES 0 0 (313,236) (313,236) (518,749)
11 BEGINNING FUND BALANCE 0 0 7,828,258 7,828,258 14,205,859
12 ENDING FUND BALANCE $0 $0 $7,515,023 $7,515,023 $13,687,109
Note 1: This fund reflects bond proceeds and interest earnings dedicated to
Library improvements.
This Monthly Financial Report was presented to the Little Rock
Board of Directors at its meeting on May 29, 2012 20
(Unaudited)
City of Little Rock, Arkansas
Monthly Financial Report
2008 & 2009 Library Improvement Bond
For the Period Ended January 31, 2012

YTD Variance
YTD Revenues and Favorable Jan 31, 2011
Budget Budget Expenditures (Unfavorable) Unaudited
REVENUES:
1 Franchise Fees $0 $0 $0 $0 $0
2 Interest income 0 0 243 243 8
3 TOTAL REVENUES 0 0 243 243 8
EXPENDITURES:
4 Issuance Cost 0 0 0 0 0
5 Debt Service 0 0 316,011 (316,011) 317,405
6 TOTAL EXPENDITURES 0 0 316,011 (316,011) 317,405
7 REVENUES OVER (UNDER) EXPENDITURES 0 0 (315,768) (315,768) (317,397)
OTHER FINANCING SOURCES (USES):
8 Bond Proceeds 0 0 0 0 0
9 Bond Reoffering Premium 0 0 0 0 0
10 Discount on Bonds Issued 0 0 0 0 0
11 Payment to Refunded Bond Escrow Agent 0 0 0 0 0
12 Transfer In 0 0 71,149 71,149 66,675
13 Transfers Out 0 0 0 0 0
REVENUES AND OTHER FINANCING SOURCES OVER (UNDER)
14 EXPENDITURES AND OTHER FINANCING USES 0 0 (244,619) (244,619) (250,722)
15 BEGINNING FUND BALANCE 0 0 717,732 717,732 712,594
16 ENDING FUND BALANCE $0 $0 $473,113 $473,113 $461,872
This Monthly Financial Report was presented to the Little Rock
Board of Directors at its meeting on April 13, 2010. 21
(Unaudited)
City of Little Rock, Arkansas
Monthly Financial Report
2009A Parks & Recreation Debt Service Fund
For the Period Ended January 31, 2012
YTD Variance
YTD Revenues and Favorable Jan 31, 2011
Budget Budget Expenditures (Unfavorable) Unaudited
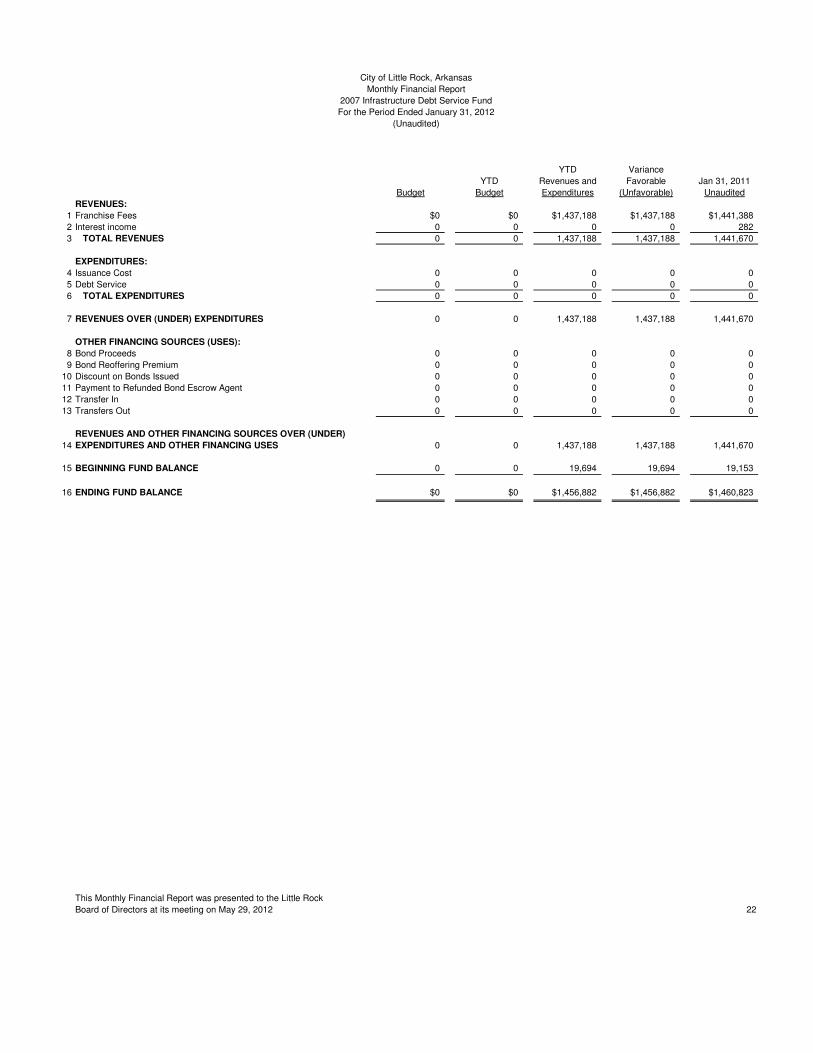
REVENUES:
1 Franchise Fees $0 $0 $1,437,188 $1,437,188 $1,441,388
2 Interest income 0 0 0 0 282
3 TOTAL REVENUES 0 0 1,437,188 1,437,188 1,441,670
EXPENDITURES:
4 Issuance Cost 0 0 0 0 0
5 Debt Service 0 0 0 0 0
6 TOTAL EXPENDITURES 0 0 0 0 0
7 REVENUES OVER (UNDER) EXPENDITURES 0 0 1,437,188 1,437,188 1,441,670
OTHER FINANCING SOURCES (USES):
8 Bond Proceeds 0 0 0 0 0
9 Bond Reoffering Premium 0 0 0 0 0
10 Discount on Bonds Issued 0 0 0 0 0
11 Payment to Refunded Bond Escrow Agent 0 0 0 0 0
12 Transfer In 0 0 0 0 0
13 Transfers Out 0 0 0 0 0
REVENUES AND OTHER FINANCING SOURCES OVER (UNDER)
14 EXPENDITURES AND OTHER FINANCING USES 0 0 1,437,188 1,437,188 1,441,670
15 BEGINNING FUND BALANCE 0 0 19,694 19,694 19,153
16 ENDING FUND BALANCE $0 $0 $1,456,882 $1,456,882 $1,460,823
This Monthly Financial Report was presented to the Little Rock
Board of Directors at its meeting on May 29, 2012 22
(Unaudited)
City of Little Rock, Arkansas
Monthly Financial Report
2007 Infrastructure Debt Service Fund
For the Period Ended January 31, 2012

YTD Variance
YTD Revenues and Favorable Jan 31, 2011
Budget Budget Expenditures (Unfavorable) Unaudited
REVENUES:
1 Franchise Fees $0 $0 $317,448 $317,448 $316,448
2 Interest income 0 0 0 0 69
3 TOTAL REVENUES 0 0 317,448 317,448 316,516
EXPENDITURES:
4 Debt Service 0 0 0 0 0
5 TOTAL EXPENDITURES 0 0 0 0 0
6 REVENUES OVER (UNDER) EXPENDITURES 0 0 317,448 317,448 316,516
OTHER FINANCING SOURCES (USES):
7 Transfer In 0 0 0 0 0
8 Transfers Out 0 0 0 0 0
REVENUES AND OTHER FINANCING SOURCES OVER (UNDER)
9 EXPENDITURES AND OTHER FINANCING USES 0 0 317,448 317,448 316,516
10 BEGINNING FUND BALANCE 0 0 20,789 20,789 21,983
11 ENDING FUND BALANCE $0 $0 $338,236 $338,236 $338,500
This Monthly Financial Report was presented to the Little Rock
Board of Directors at its meeting on May 29, 2012 23
(Unaudited)
City of Little Rock, Arkansas
Monthly Financial Report
2002 CIP Junior Lien Bonds Debt Service Fund
For the Period Ended January 31, 2012

YTD Variance
YTD Revenues and Favorable Jan 31, 2011
Budget Budget Expenditures (Unfavorable) Unaudited
REVENUES:
1 Property Tax $0 $0 $105,336 $105,336 $111,600
2 Interest Income 0 0 1,172 1,172 4,077
3 Miscellaneous 0 0 0 0 0
4 TOTAL REVENUES 0 0 106,508 106,508 115,677
EXPENDITURES:
5 Debt Service 0 0 0 0 0
6 TOTAL EXPENDITURES 0 0 0 0 0
7 REVENUES OVER (UNDER) EXPENDITURES 0 0 106,508 106,508 115,677
OTHER FINANCING SOURCES (USES):
8 Bond Proceeds 0 0 0 0 0
9 Transfers In 0 0 0 0 0
10 Transfers Out 0 0 0 0 0
REVENUES AND OTHER FINANCING SOURCES OVER (UNDER)
11 EXPENDITURES AND OTHER FINANCING USES 0 0 106,508 106,508 115,677
12 BEGINNING FUND BALANCE 0 0 11,735,403 11,735,403 11,271,067
13 ENDING FUND BALANCE $0 $0 $11,841,911 $11,841,911 $11,386,744
This Monthly Financial Report was presented to the Little Rock
Board of Directors at its meeting on May 29, 2012 24
For the Period Ended January 31, 2012
(Unaudited)
City of Little Rock, Arkansas
Monthly Financial Report
2004 Improvement Bonds Debt Service Fund

YTD Variance
YTD Revenues and Favorable Jan 31, 2011
Budget Budget Expenditures (Unfavorable) Unaudited
REVENUES:
1 Property Tax $0 $0 $31,923 $31,923 $33,825
2 Interest Income 0 0 34 34 43
3 TOTAL REVENUES 0 0 31,957 31,957 33,868
EXPENDITURES:
4 Debt Service 0 0 0 0 0
5 TOTAL EXPENDITURES 0 0 0 0 0
6 REVENUES OVER (UNDER) EXPENDITURES 0 0 31,957 31,957 33,868
OTHER FINANCING SOURCES (USES):
7 Bond Proceeds 0 0 0 0 0
8 Transfers In 0 0 0 0 0
9 Transfers Out 0 0 0 0 0
REVENUES AND OTHER FINANCING SOURCES OVER (UNDER)
10 EXPENDITURES AND OTHER FINANCING USES 0 0 31,957 31,957 33,868
11 BEGINNING FUND BALANCE 0 0 2,240,369 2,240,369 2,076,186
12 ENDING FUND BALANCE $0 $0 $2,272,326 $2,272,326 $2,110,054
This Monthly Financial Report was presented to the Little Rock
Board of Directors at its meeting on May 29, 2012 25
(Unaudited)
City of Little Rock, Arkansas
Monthly Financial Report
2004 Library Improvement Bonds Debt Service Fund
For the Period Ended January 31, 2012

YTD Variance
YTD Revenues and Favorable Jan 31, 2011
Budget Budget Expenditures (Unfavorable) Unaudited
REVENUES:
Property Tax $0 $0 $29,160 $29,160 $30,607
Interest Income 0 0 386 386 1,008
TOTAL REVENUES 0 0 29,546 29,546 31,615
EXPENDITURES:
Debt Service 0 0 0 0 0
TOTAL EXPENDITURES 0 0 0 0 0
REVENUES OVER (UNDER) EXPENDITURES 0 0 29,546 29,546 31,615
OTHER FINANCING SOURCES (USES):
Bond Proceeds 0 0 0 0 0
Transfers In 0 0 0 0 0
Transfers Out 0 0 0 0 0
REVENUES AND OTHER FINANCING SOURCES OVER (UNDER)
EXPENDITURES AND OTHER FINANCING USES 0 0 29,546 29,546 31,615
BEGINNING FUND BALANCE 0 0 4,907,781 4,907,781 3,268,869
ENDING FUND BALANCE $0 $0 $4,937,327 $4,937,327 $3,300,484
This Monthly Financial Report was presented to the Little Rock
Board of Directors at its meeting on May 29, 2012 26
(Unaudited)
City of Little Rock, Arkansas
Monthly Financial Report
2008 & 2009 Library Improvement Bonds Debt Service Fund
For the Period Ended January 31, 2012
YTD Variance
YTD Revenues and Favorable Jan 31, 2011
Budget Budget Expenditures (Unfavorable) Unaudited
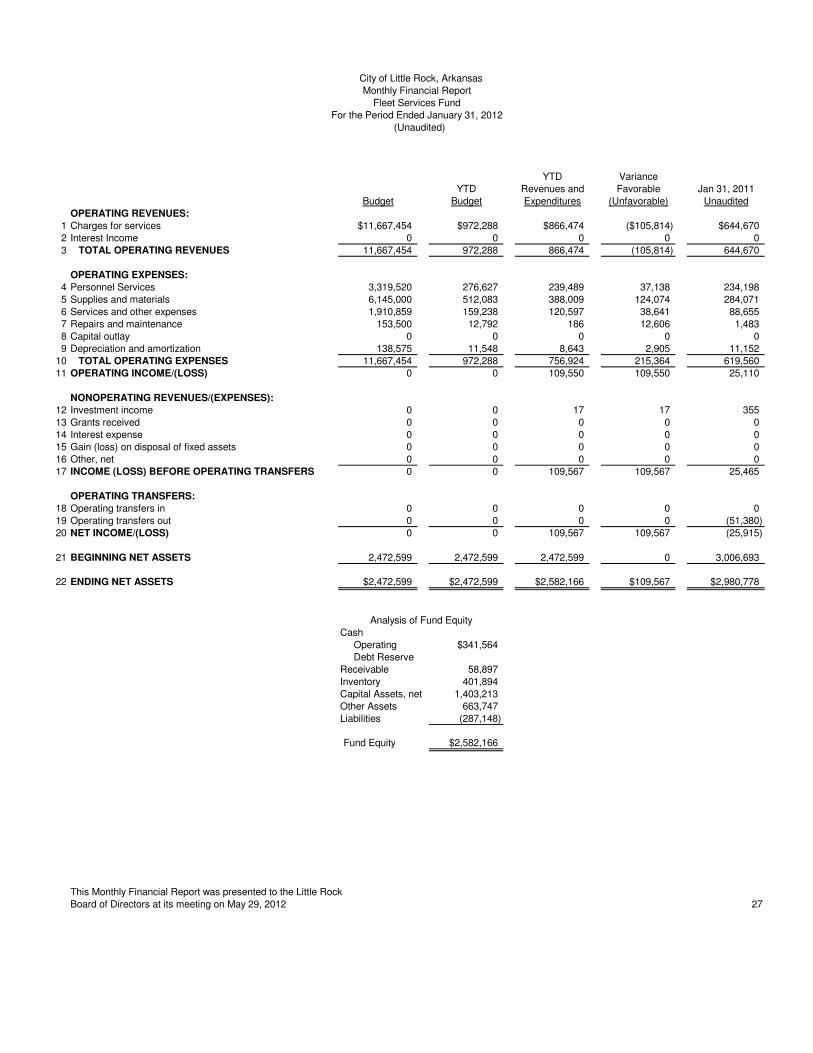
OPERATING REVENUES:
1 Charges for services $11,667,454 $972,288 $866,474 ($105,814) $644,670
2 Interest Income 0 0 0 0 0
3 TOTAL OPERATING REVENUES 11,667,454 972,288 866,474 (105,814) 644,670
OPERATING EXPENSES:
4 Personnel Services 3,319,520 276,627 239,489 37,138 234,198
5 Supplies and materials 6,145,000 512,083 388,009 124,074 284,071
6 Services and other expenses 1,910,859 159,238 120,597 38,641 88,655
7 Repairs and maintenance 153,500 12,792 186 12,606 1,483
8 Capital outlay 0 0 0 0 0
9 Depreciation and amortization 138,575 11,548 8,643 2,905 11,152
10 TOTAL OPERATING EXPENSES 11,667,454 972,288 756,924 215,364 619,560
11 OPERATING INCOME/(LOSS) 0 0 109,550 109,550 25,110
NONOPERATING REVENUES/(EXPENSES):
12 Investment income 0 0 17 17 355
13 Grants received 0 0 0 0 0
14 Interest expense 0 0 0 0 0
15 Gain (loss) on disposal of fixed assets 0 0 0 0 0
16 Other, net 0 0 0 0 0
17 INCOME (LOSS) BEFORE OPERATING TRANSFERS 0 0 109,567 109,567 25,465
OPERATING TRANSFERS:
18 Operating transfers in 0 0 0 0 0
19 Operating transfers out 0 0 0 0 (51,380)
20 NET INCOME/(LOSS) 0 0 109,567 109,567 (25,915)
21 BEGINNING NET ASSETS 2,472,599 2,472,599 2,472,599 0 3,006,693
22 ENDING NET ASSETS $2,472,599 $2,472,599 $2,582,166 $109,567 $2,980,778
Cash
Operating $341,564
Debt Reserve
Receivable 58,897
Inventory 401,894
Capital Assets, net 1,403,213
Other Assets 663,747
Liabilities (287,148)
Fund Equity $2,582,166
This Monthly Financial Report was presented to the Little Rock
Board of Directors at its meeting on May 29, 2012 27
Analysis of Fund Equity
(Unaudited)
City of Little Rock, Arkansas
Monthly Financial Report
Fleet Services Fund
For the Period Ended January 31, 2012

YTD Variance
YTD Revenues and Favorable Jan 31, 2011
Budget Budget Expenditures (Unfavorable) Unaudited
OPERATING REVENUES:
1 Charges for services $1,326,100 $110,508 $111,700 $1,192 $106,048
2 Other 0 0 0 0 0
3 TOTAL OPERATING REVENUES 1,326,100 110,508 111,700 1,192 106,048
OPERATING EXPENSES:
4 Personnel Services 707,388 58,949 51,079 7,871 50,736
5 Supplies and materials 42,584 3,549 4,774 (1,225) 3,790
6 Services and other expenses 535,500 44,625 41,675 2,950 43,104
7 Repairs and maintenance 19,828 1,652 870 782 751
8 Capital outlay 0 0 0 0 0
9 Depreciation and amortization 20,800 1,733 1,743 (10) 1,726
10 TOTAL OPERATING EXPENSES 1,326,100 110,508 100,141 10,368 100,107
11 OPERATING INCOME/(LOSS) 0 0 11,559 11,559 5,942
NONOPERATING REVENUES/(EXPENSES):
12 Investment income 0 0 0 0 0
13 Grants received 0 0 0 0 0
14 Interest expense 0 0 0 0 0
15 Gain (loss) on disposal of fixed assets 0 0 0 0 0
16 Other, net 0 0 0 0 0
17 INCOME (LOSS) BEFORE OPERATING TRANSFERS 0 0 11,559 11,559 5,942
OPERATING TRANSFERS:
18 Operating transfers in 0 0 0 0 0
19 Operating transfers out 0 0 0 0 0
20 NET INCOME/(LOSS) 0 0 11,559 11,559 5,942
21 BEGINNING NET ASSETS (789,269) (789,269) (789,269) 0 (883,235)
22 ENDING NET ASSETS ($789,269) ($789,269) ($777,710) $11,559 ($877,293)
Cash
Operating $11,759
Debt Reserve
Receivable -
Inventory
Capital Assets, net 188,036
Other Assets
Liabilities (977,505)
Fund Equity ($777,710)
This Monthly Financial Report was presented to the Little Rock
Board of Directors at its meeting on May 29, 2012 28
Analysis of Fund Equity
(Unaudited)
City of Little Rock, Arkansas
Monthly Financial Report
Vehicle Storage Facility Fund
For the Period Ended January 31, 2012
YTD Variance
YTD Revenues and Favorable Jan 31, 2011
Budget Budget Expenditures (Unfavorable) Unaudited
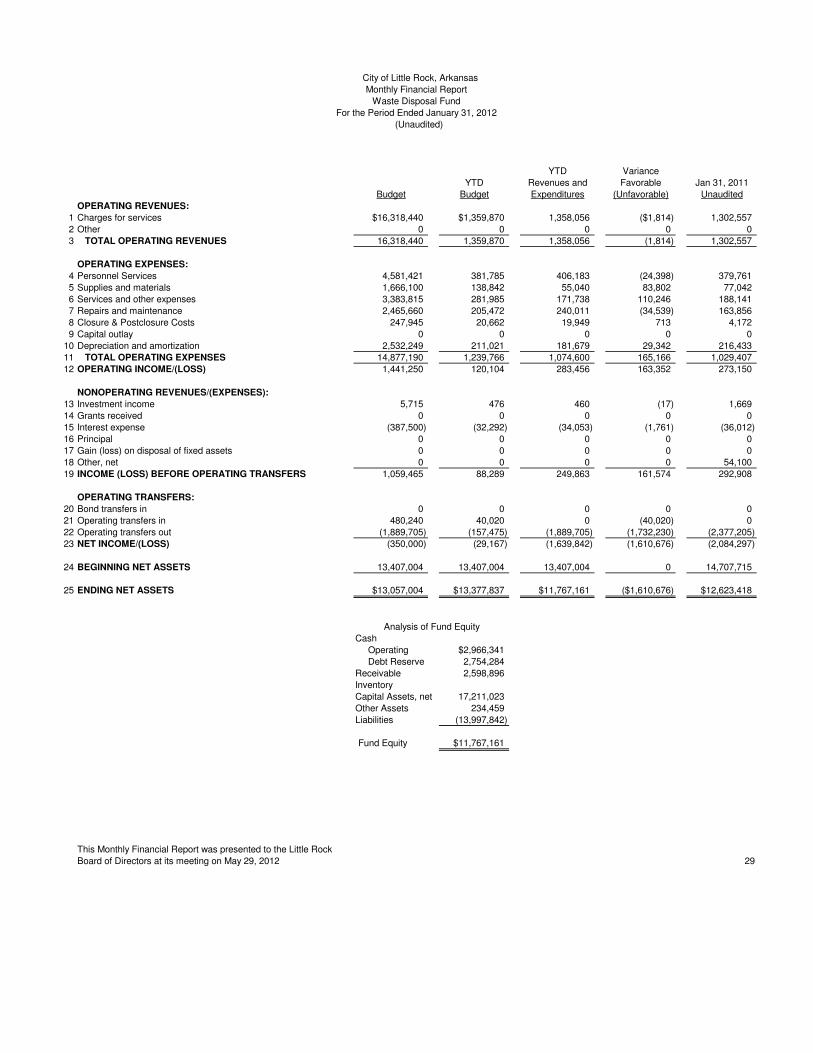
OPERATING REVENUES:
1 Charges for services $16,318,440 $1,359,870 1,358,056 ($1,814) 1,302,557
2 Other 0 0 0 0 0
3 TOTAL OPERATING REVENUES 16,318,440 1,359,870 1,358,056 (1,814) 1,302,557
OPERATING EXPENSES:
4 Personnel Services 4,581,421 381,785 406,183 (24,398) 379,761
5 Supplies and materials 1,666,100 138,842 55,040 83,802 77,042
6 Services and other expenses 3,383,815 281,985 171,738 110,246 188,141
7 Repairs and maintenance 2,465,660 205,472 240,011 (34,539) 163,856
8 Closure & Postclosure Costs 247,945 20,662 19,949 713 4,172
9 Capital outlay 0 0 0 0 0
10 Depreciation and amortization 2,532,249 211,021 181,679 29,342 216,433
11 TOTAL OPERATING EXPENSES 14,877,190 1,239,766 1,074,600 165,166 1,029,407
12 OPERATING INCOME/(LOSS) 1,441,250 120,104 283,456 163,352 273,150
NONOPERATING REVENUES/(EXPENSES):
13 Investment income 5,715 476 460 (17) 1,669
14 Grants received 0 0 0 0 0
15 Interest expense (387,500) (32,292) (34,053) (1,761) (36,012)
16 Principal 0 0 0 0 0
17 Gain (loss) on disposal of fixed assets 0 0 0 0 0
18 Other, net 0 0 0 0 54,100
19 INCOME (LOSS) BEFORE OPERATING TRANSFERS 1,059,465 88,289 249,863 161,574 292,908
OPERATING TRANSFERS:
20 Bond transfers in 0 0 0 0 0
21 Operating transfers in 480,240 40,020 0 (40,020) 0
22 Operating transfers out (1,889,705) (157,475) (1,889,705) (1,732,230) (2,377,205)
23 NET INCOME/(LOSS) (350,000) (29,167) (1,639,842) (1,610,676) (2,084,297)
24 BEGINNING NET ASSETS 13,407,004 13,407,004 13,407,004 0 14,707,715
25 ENDING NET ASSETS $13,057,004 $13,377,837 $11,767,161 ($1,610,676) $12,623,418
Cash
Operating $2,966,341
Debt Reserve 2,754,284
Receivable 2,598,896
Inventory
Capital Assets, net 17,211,023
Other Assets 234,459
Liabilities (13,997,842)
Fund Equity $11,767,161
This Monthly Financial Report was presented to the Little Rock
Board of Directors at its meeting on May 29, 2012 29
Analysis of Fund Equity
(Unaudited)
City of Little Rock, Arkansas
Monthly Financial Report
Waste Disposal Fund
For the Period Ended January 31, 2012

YTD Variance
YTD Revenues and Favorable Jan 31, 2011
Budget Budget Expenditures (Unfavorable) Unaudited
OPERATING REVENUES:
1 Charges for services $563,880 $46,990 $22,081 ($24,909) $15,374
2 Other 0 0 0 0 0
3 TOTAL OPERATING REVENUES 563,880 46,990 22,081 (24,909) 15,374
OPERATING EXPENSES:
4 Personnel Services 469,780 39,148 28,963 10,185 21,784
5 Supplies and materials 25,000 2,083 2,535 (452) 1,509
6 Services and other expenses 526,100 43,842 26,235 17,607 33,318
7 Repairs and maintenance 43,000 3,583 6,466 (2,883) 331
8 Capital outlay 0 0 0 0 0
9 Depreciation and amortization 100,300 8,358 8,047 311 8,356
10 TOTAL OPERATING EXPENSES 1,164,180 97,015 72,246 24,769 65,298
11 OPERATING INCOME/(LOSS) (600,300) (50,025) (50,165) (140) (49,924)
NONOPERATING REVENUES/(EXPENSES):
12 Investment income 0 0 0 0 0
13 Contributions 250,000 20,833 20,833 (0) 20,833
14 Interest expense 0 0 0 0 0
15 Principal 0 0 0 0 0
16 Gain (loss) on disposal of fixed assets 0 0 0 0 0
17 Other, net 0 0 0 0 0
18 INCOME (LOSS) BEFORE OPERATING TRANSFERS (350,300) (29,192) (29,332) (140) (29,091)
OPERATING TRANSFERS:
19 Operating transfers in 250,000 20,833 20,833 (0) 20,833
20 Operating transfers out 0 0 0 0 0
21 NET INCOME/(LOSS) (100,300) (8,358) (8,499) (140) (8,258)
22 BEGINNING NET ASSETS 2,327,783 2,327,783 2,327,783 0 2,419,510
23 ENDING NET ASSETS $2,227,483 $2,319,425 $2,319,285 ($140) $2,411,252
Cash
Operating $18,035
Debt Reserve
Receivable 25,762
Inventory 0
Capital Assets, net 4,846,342
Other Assets 6,219
Liabilities (2,577,073)
Fund Equity $2,319,285
This Monthly Financial Report was presented to the Little Rock
Board of Directors at its meeting on May 29, 2012 30
Analysis of Fund Equity
(Unaudited)
City of Little Rock, Arkansas
Monthly Financial Report
Rivermarket Fund
For the Period Ended January 31, 2012
YTD Variance
YTD Revenues and Favorable Jan 31, 2011
Budget Budget Expenditures (Unfavorable) Unaudited
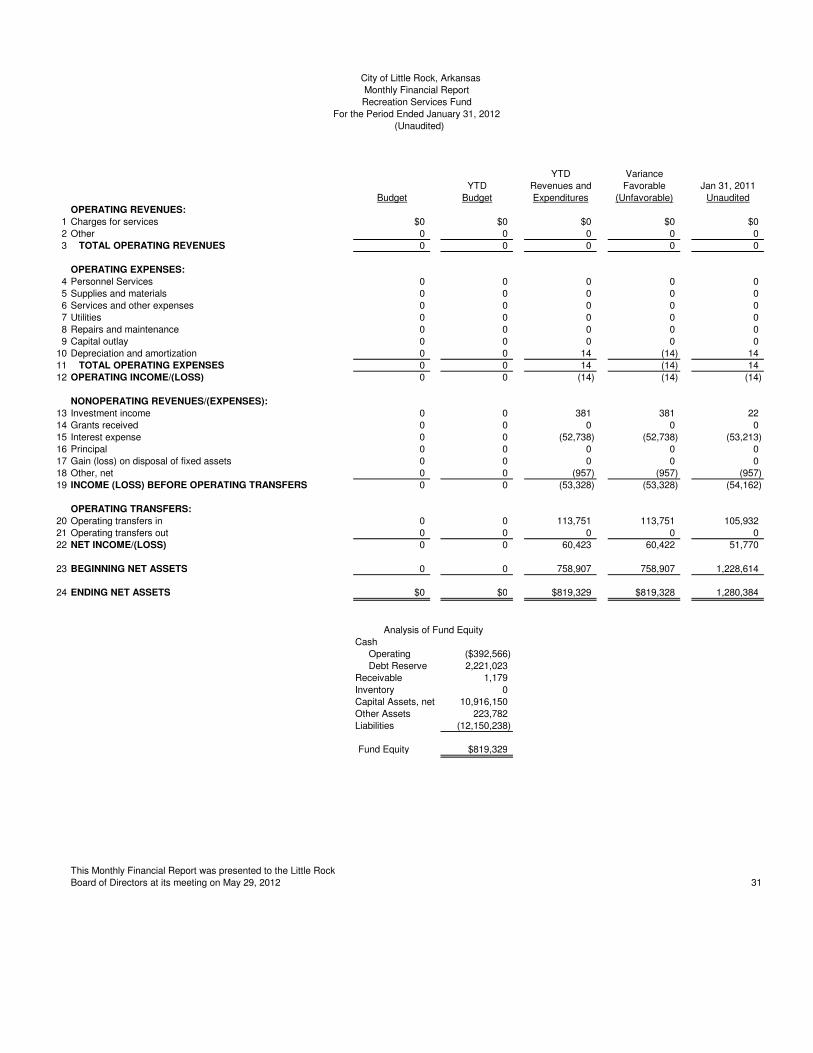
OPERATING REVENUES:
1 Charges for services $0 $0 $0 $0 $0
2 Other 0 0 0 0 0
3 TOTAL OPERATING REVENUES 0 0 0 0 0
OPERATING EXPENSES:
4 Personnel Services 0 0 0 0 0
5 Supplies and materials 0 0 0 0 0
6 Services and other expenses 0 0 0 0 0
7 Utilities 0 0 0 0 0
8 Repairs and maintenance 0 0 0 0 0
9 Capital outlay 0 0 0 0 0
10 Depreciation and amortization 0 0 14 (14) 14
11 TOTAL OPERATING EXPENSES 0 0 14 (14) 14
12 OPERATING INCOME/(LOSS) 0 0 (14) (14) (14)
NONOPERATING REVENUES/(EXPENSES):
13 Investment income 0 0 381 381 22
14 Grants received 0 0 0 0 0
15 Interest expense 0 0 (52,738) (52,738) (53,213)
16 Principal 0 0 0 0 0
17 Gain (loss) on disposal of fixed assets 0 0 0 0 0
18 Other, net 0 0 (957) (957) (957)
19 INCOME (LOSS) BEFORE OPERATING TRANSFERS 0 0 (53,328) (53,328) (54,162)
OPERATING TRANSFERS:
20 Operating transfers in 0 0 113,751 113,751 105,932
21 Operating transfers out 0 0 0 0 0
22 NET INCOME/(LOSS) 0 0 60,423 60,422 51,770
23 BEGINNING NET ASSETS 0 0 758,907 758,907 1,228,614
24 ENDING NET ASSETS $0 $0 $819,329 $819,328 1,280,384
Cash
Operating ($392,566)
Debt Reserve 2,221,023
Receivable 1,179
Inventory 0
Capital Assets, net 10,916,150
Other Assets 223,782
Liabilities (12,150,238)
Fund Equity $819,329
This Monthly Financial Report was presented to the Little Rock
Board of Directors at its meeting on May 29, 2012 31
Analysis of Fund Equity
(Unaudited)
City of Little Rock, Arkansas
Monthly Financial Report
Recreation Services Fund
For the Period Ended January 31, 2012

YTD Variance
YTD Revenues and Favorable Jan 31, 2011
Budget Budget Expenditures (Unfavorable) Unaudited
OPERATING REVENUES:
1 Charges for services $3,263,000 $271,917 $63,454 ($208,463) $54,033
2 Other 0 0 0 0 0
3 TOTAL OPERATING REVENUES 3,263,000 271,917 63,454 (208,463) 54,033
OPERATING EXPENSES:
4 Personnel Services 2,864,049 238,671 203,562 35,109 186,880
5 Supplies and materials 935,108 77,926 27,180 50,746 22,616
6 Services and other expenses 1,196,727 99,727 20,722 79,005 11,713
7 Repairs and maintenance 613,823 51,152 7,606 43,546 14,778
8 Capital outlay 0 0 0 0 0
9 Depreciation and amortization 473,400 39,450 41,098 (1,648) 35,874
10 TOTAL OPERATING EXPENSES 6,083,107 506,926 300,168 206,757 271,861
11 OPERATING INCOME/(LOSS) (2,820,107) (235,009) (236,714) (1,705) (217,828)
NONOPERATING REVENUES/(EXPENSES):
12 Investment income 0 0 0 0 0
13 Grants received 0 0 0 0 0
14 Interest expense 0 0 0 0 0
15 Principal 0 0 0 0 0
16 Gain (loss) on disposal of fixed assets 0 0 0 0 0
17 Other, net 0 0 0 0 0
18 INCOME (LOSS) BEFORE OPERATING TRANSFERS (2,820,107) (235,009) (236,714) (1,705) (217,828)
OPERATING TRANSFERS:
19 Operating transfers in 3,081,304 256,775 708,775 452,000 592,005
20 Operating transfers out (501,197) (41,766) (71,560) (29,793) (62,139)
21 NET INCOME/(LOSS) (240,000) (20,000) 400,501 420,501 312,037
22 BEGINNING NET ASSETS 7,046,854 7,046,854 7,046,854 0 5,044,814
23 ENDING NET ASSETS $6,806,854 $7,026,854 $7,447,355 $420,501 $5,356,851
Cash
Operating $389,512
Debt Reserve 0
Receivable 0
Inventory 101,583
Capital Assets, net 11,140,366
Other Assets 0
Liabilities (4,184,106)
Fund Equity $7,447,355
This Monthly Financial Report was presented to the Little Rock
Board of Directors at its meeting on May 29, 2012 32
Analysis of Fund Equity
(Unaudited)
City of Little Rock, Arkansas
Monthly Financial Report
Zoo Fund
For the Period Ended January 31, 2012

YTD Variance
YTD Revenues and Favorable Jan 31, 2011
Budget Budget Expenditures (Unfavorable) Unaudited
REVENUES:
1 Charges for services $0 $0 $0 $0 $0
2 Miscellaneous 0 0 1,979 1,979 12,658
3 TOTAL REVENUES 0 0 1,979 1,979 12,658
EXPENDITURES:
4 Zoo 0 0 4,210 (4,210) 31,085
5 TOTAL EXPENDITURES 0 0 4,210 (4,210) 31,085
6 REVENUES OVER (UNDER) EXPENDITURES 0 0 (2,231) (2,231) (18,427)
OTHER FINANCING SOURCES (USES):
7 Interest income 0 0 128 128 0
8 Transfers In 0 0 0 0 0
9 Transfers Out 0 0 0 0 0
REVENUES AND OTHER FINANCING SOURCES OVER (UNDER)
10 EXPENDITURES AND OTHER FINANCING USES 0 0 (2,103) (2,103) (18,427)
11 BEGINNING FUND BALANCE 0 0 1,302,836 1,302,836 2,011,445
12 ENDING FUND BALANCE (Note 1) $0 $0 $1,300,733 $1,300,733 $1,993,018
Note 1: As of January 31, 2012, the fund balance is composed of 25 projects.
This Monthly Financial Report was presented to the Little Rock
Board of Directors at its meeting on May 29, 2012 33
(Unaudited)
City of Little Rock, Arkansas
Monthly Financial Report
Zoo Special Projects Fund
For the Period Ended January 31, 2012

YTD Variance
YTD Revenues and Favorable Jan 31, 2011
Budget Budget Expenditures (Unfavorable) Unaudited
OPERATING REVENUES:
1 Charges for services $1,611,580 $134,298 $61,902 ($72,396) $47,513
2 Other 0 0 0 0 0
3 TOTAL OPERATING REVENUES 1,611,580 134,298 61,902 (72,396) 47,513
OPERATING EXPENSES:
4 Personnel Services 1,165,807 97,151 100,865 (3,715) 93,264
5 Supplies and materials 180,312 15,026 6,614 8,412 1,384
6 Services and other expenses 504,083 42,007 6,313 35,694 6,354
7 Repairs and maintenance 249,679 20,807 14,537 6,270 5,773
8 Capital outlay 0 0 - 0 -
9 Depreciation and amortization 94,100 7,842 7,188 654 7,845
10 TOTAL OPERATING EXPENSES 2,193,981 182,832 135,517 47,315 114,620
11 OPERATING INCOME/(LOSS) (582,401) (48,533) (73,615) (25,081) (67,107)
NONOPERATING REVENUES/(EXPENSES):
12 Investment income 0 0 0 0 34
13 Grants received 0 0 0 0 0
14 Interest expense (10,000) (833) 0 833 0
15 Principal 0 0 0 0 0
16 Gain (loss) on disposal of fixed assets 0 0 0 0 0
17 Other, net 0 0 0 0 0
18 INCOME (LOSS) BEFORE OPERATING TRANSFERS (592,401) (49,367) (73,615) (24,248) (67,073)
OPERATING TRANSFERS:
19 Operating transfers in 1,164,602 97,050 97,050 (0) 89,729
20 Operating transfers out (666,301) (55,525) (66,122) (10,597) (52,664)
21 NET INCOME/(LOSS) (94,100) (7,842) (42,687) (34,845) (30,008)
22 BEGINNING NET ASSETS (2,270,205) (2,270,205) (2,270,205) 0 (1,890,324)
23 ENDING NET ASSETS ($2,364,305) ($2,278,046) ($2,312,892) ($34,845) ($1,920,331)
Cash
Operating ($79,787)
Debt Reserve
Receivable
Inventory 24,155
Capital Assets, net 3,202,964
Other Assets
Liabilities (5,460,223)
Fund Equity ($2,312,892)
This Monthly Financial Report was presented to the Little Rock
Board of Directors at its meeting on May 29, 2012 34
Analysis of Fund Equity
City of Little Rock, Arkansas
(Unaudited)
For the Period Ended January 31, 2012
Golf Course Fund
Monthly Financial Report
YTD Variance
YTD Revenues and Favorable Jan 31, 2011
Budget Budget Expenditures (Unfavorable) Unaudited
OPERATING REVENUES:
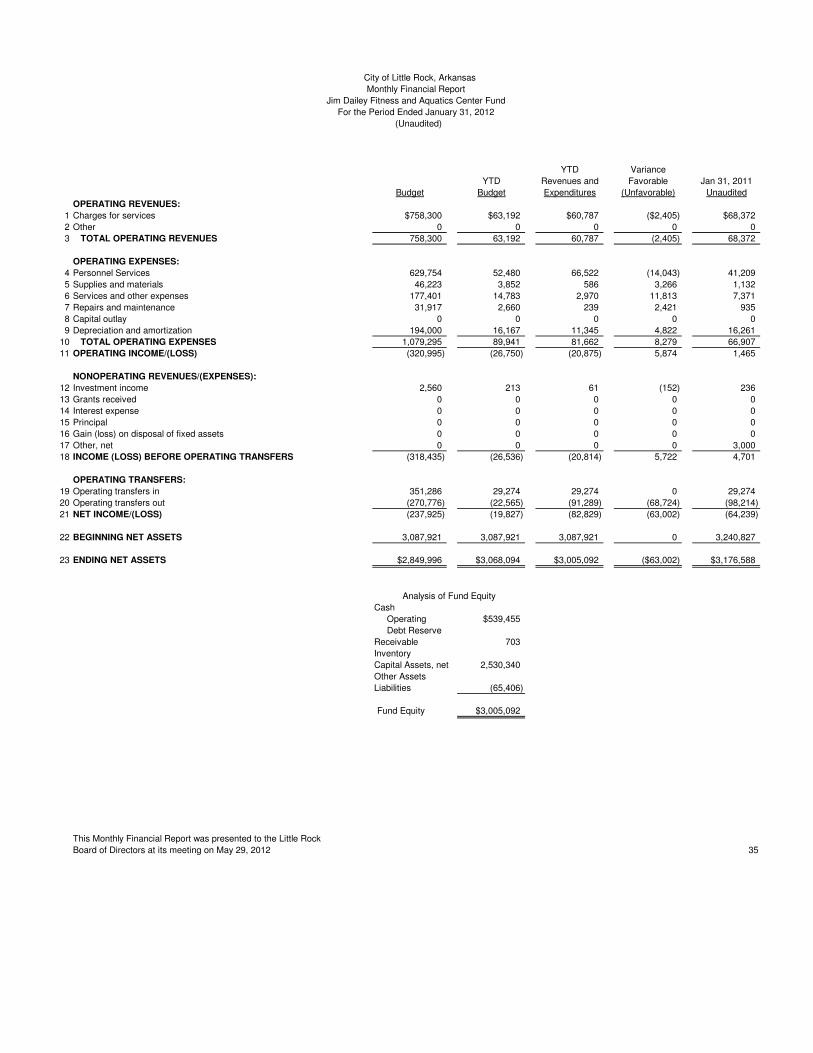
1 Charges for services $758,300 $63,192 $60,787 ($2,405) $68,372
2 Other 0 0 0 0 0
3 TOTAL OPERATING REVENUES 758,300 63,192 60,787 (2,405) 68,372
OPERATING EXPENSES:
4 Personnel Services 629,754 52,480 66,522 (14,043) 41,209
5 Supplies and materials 46,223 3,852 586 3,266 1,132
6 Services and other expenses 177,401 14,783 2,970 11,813 7,371
7 Repairs and maintenance 31,917 2,660 239 2,421 935
8 Capital outlay 0 0 0 0 0
9 Depreciation and amortization 194,000 16,167 11,345 4,822 16,261
10 TOTAL OPERATING EXPENSES 1,079,295 89,941 81,662 8,279 66,907
11 OPERATING INCOME/(LOSS) (320,995) (26,750) (20,875) 5,874 1,465
NONOPERATING REVENUES/(EXPENSES):
12 Investment income 2,560 213 61 (152) 236
13 Grants received 0 0 0 0 0
14 Interest expense 0 0 0 0 0
15 Principal 0 0 0 0 0
16 Gain (loss) on disposal of fixed assets 0 0 0 0 0
17 Other, net 0 0 0 0 3,000
18 INCOME (LOSS) BEFORE OPERATING TRANSFERS (318,435) (26,536) (20,814) 5,722 4,701
OPERATING TRANSFERS:
19 Operating transfers in 351,286 29,274 29,274 0 29,274
20 Operating transfers out (270,776) (22,565) (91,289) (68,724) (98,214)
21 NET INCOME/(LOSS) (237,925) (19,827) (82,829) (63,002) (64,239)
22 BEGINNING NET ASSETS 3,087,921 3,087,921 3,087,921 0 3,240,827
23 ENDING NET ASSETS $2,849,996 $3,068,094 $3,005,092 ($63,002) $3,176,588
Cash
Operating $539,455
Debt Reserve
Receivable 703
Inventory
Capital Assets, net 2,530,340
Other Assets
Liabilities (65,406)
Fund Equity $3,005,092
This Monthly Financial Report was presented to the Little Rock
Board of Directors at its meeting on May 29, 2012 35
Analysis of Fund Equity
(Unaudited)
City of Little Rock, Arkansas
Monthly Financial Report
Jim Dailey Fitness and Aquatics Center Fund
For the Period Ended January 31, 2012
YTD Variance
YTD Revenues and Favorable Jan 31, 2011
Budget Budget Expenditures (Unfavorable) Unaudited
OPERATING REVENUES:
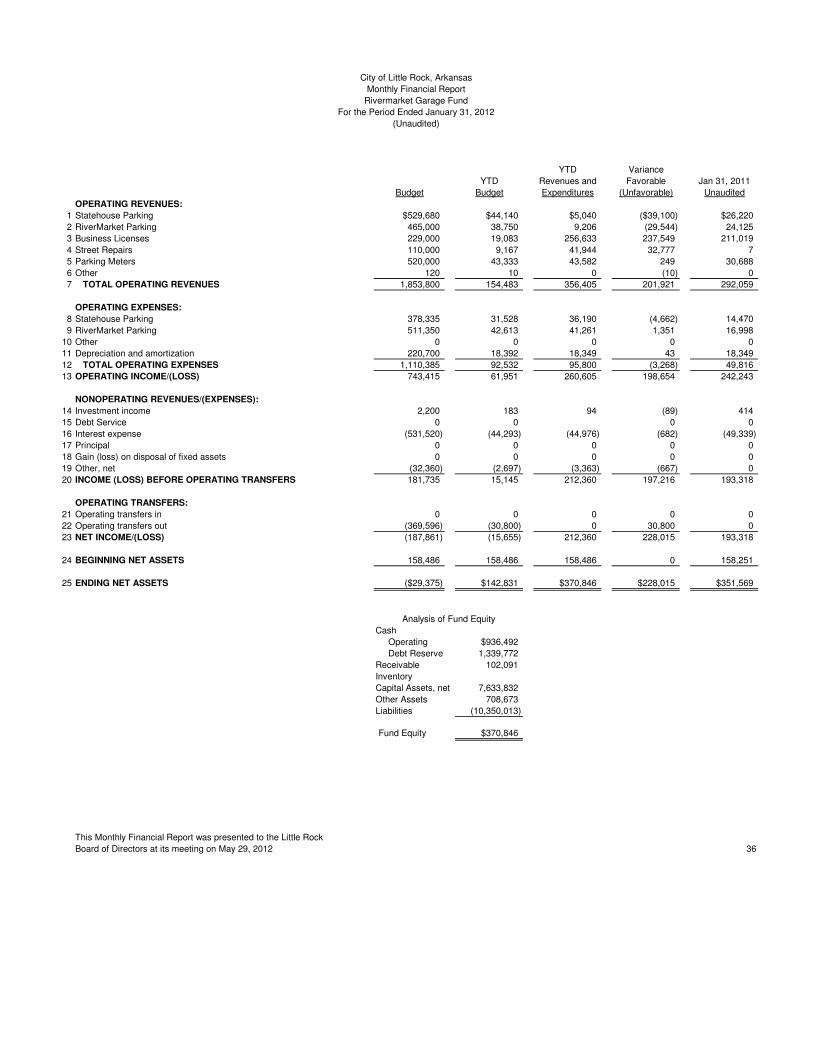
1 Statehouse Parking $529,680 $44,140 $5,040 ($39,100) $26,220
2 RiverMarket Parking 465,000 38,750 9,206 (29,544) 24,125
3 Business Licenses 229,000 19,083 256,633 237,549 211,019
4 Street Repairs 110,000 9,167 41,944 32,777 7
5 Parking Meters 520,000 43,333 43,582 249 30,688
6 Other 120 10 0 (10) 0
7 TOTAL OPERATING REVENUES 1,853,800 154,483 356,405 201,921 292,059
OPERATING EXPENSES:
8 Statehouse Parking 378,335 31,528 36,190 (4,662) 14,470
9 RiverMarket Parking 511,350 42,613 41,261 1,351 16,998
10 Other 0 0 0 0 0
11 Depreciation and amortization 220,700 18,392 18,349 43 18,349
12 TOTAL OPERATING EXPENSES 1,110,385 92,532 95,800 (3,268) 49,816
13 OPERATING INCOME/(LOSS) 743,415 61,951 260,605 198,654 242,243
NONOPERATING REVENUES/(EXPENSES):
14 Investment income 2,200 183 94 (89) 414
15 Debt Service 0 0 0 0
16 Interest expense (531,520) (44,293) (44,976) (682) (49,339)
17 Principal 0 0 0 0 0
18 Gain (loss) on disposal of fixed assets 0 0 0 0 0
19 Other, net (32,360) (2,697) (3,363) (667) 0
20 INCOME (LOSS) BEFORE OPERATING TRANSFERS 181,735 15,145 212,360 197,216 193,318
OPERATING TRANSFERS:
21 Operating transfers in 0 0 0 0 0
22 Operating transfers out (369,596) (30,800) 0 30,800 0
23 NET INCOME/(LOSS) (187,861) (15,655) 212,360 228,015 193,318
24 BEGINNING NET ASSETS 158,486 158,486 158,486 0 158,251
25 ENDING NET ASSETS ($29,375) $142,831 $370,846 $228,015 $351,569
Cash
Operating $936,492
Debt Reserve 1,339,772
Receivable 102,091
Inventory
Capital Assets, net 7,633,832
Other Assets 708,673
Liabilities (10,350,013)
Fund Equity $370,846
This Monthly Financial Report was presented to the Little Rock
Board of Directors at its meeting on May 29, 2012 36
Analysis of Fund Equity
(Unaudited)
City of Little Rock, Arkansas
Monthly Financial Report
Rivermarket Garage Fund
For the Period Ended January 31, 2012

YTD Variance
YTD Revenues and Favorable Jan 31, 2011
Budget Budget Expenditures (Unfavorable) Unaudited
ADDITIONS:
Contributions:
1 Employer $0 $0 $2,116 $2,116 $2,937
2 Plan members 0 0 2,116 2,116 2,937
3 General property taxes 0 0 65,973 65,973 83,621
4 State insurance turnback and guarantee fund 0 0 0 0 0
5 Other 0 0 144,905 144,905 67,679
6 Total Contributions 0 0 215,110 215,110 157,173
Investment income (loss):
7 Net increase (decrease) in fair value of investments 0 0 1,163,309 1,163,309 290,393
8 Interest and dividends 0 0 70,284 70,284 58,495
9 0 0 1,233,594 1,233,594 348,888
10 Less investment expense 0 0 (51,622) (51,622) (61,128)
11 Net investment income (loss) 0 0 1,181,971 1,181,971 287,760
12 TOTAL ADDITIONS 0 0 1,397,082 1,397,082 444,933
DEDUCTIONS:
13 Benefits paid directly to participants 0 0 919,882 (919,882) 747,687
14 Administrative expenses 0 0 3,798 (3,798) 13,420
15 TOTAL DEDUCTIONS 0 0 923,680 (923,680) 761,107
16 NET INCREASE (DECREASE) 0 0 473,402 473,402 (316,174)
17 NET ASSETS HELD IN TRUST FOR PENSION BENEFITS, BEGINNING 0 0 48,606,375 48,606,375 52,742,686
18 NET ASSETS HELD IN TRUST FOR PENSION BENEFITS, ENDING $0 $0 $49,079,777 $49,079,777 $52,426,512
Note 1: The net assets include $ 23,869,607 held in the DROP (deferred retirement option
program) account.
This Monthly Financial Report was presented to the Little Rock
Board of Directors at its meeting on May 29, 2012 37
(Unaudited)
City of Little Rock, Arkansas
Monthly Financial Report
Police Pension and Relief Fund
For the Period Ended January 31, 2012

YTD Variance
YTD Revenues and Favorable Jan 31, 2011
Budget Budget Expenditures (Unfavorable) Unaudited
ADDITIONS:
Contributions:
1 Employer $0 $0 $6,309 $6,309 $8,356
2 Plan members 0 0 6,309 6,309 8,356
3 General property taxes 0 0 65,973 65,973 83,621
4 State insurance turnback and guarantee fund 0 0 0 0 0
5 Other 0 0 41,667 41,667 0
6 Total Contributions 0 0 120,257 120,257 100,332
Investment income (loss):
7 Net increase (decrease) in fair value of investments 0 0 1,994,925 1,994,925 472,050
8 Interest and dividends 0 0 102,343 102,343 93,584
9 0 0 2,097,268 2,097,268 565,634
10 Less investment expense 0 0 (80,450) (80,450) (88,550)
11 Net investment income (loss) 0 0 2,016,818 2,016,818 477,083
12 TOTAL ADDITIONS 0 0 2,137,075 2,137,075 577,416
DEDUCTIONS:
13 Benefits paid directly to participants 0 0 833,712 (833,712) 972,205
14 Administrative expenses 0 0 2,323 (2,323) 2,241
15 0 0 836,036 (836,036) 974,446
16 NET INCREASE (DECREASE) 0 0 1,301,039 1,301,039 (397,031)
17 NET ASSETS HELD IN TRUST FOR PENSION BENEFITS, BEGINNING 0 0 70,545,311 70,545,311 76,938,413
18 NET ASSETS HELD IN TRUST FOR PENSION BENEFITS, ENDING $0 $0 $71,846,351 $71,846,351 $76,541,383
Note 1: The net assets include $11,278,547 held in the DROP (deferred retirement option
program) account.
This Monthly Financial Report was presented to the Little Rock
Board of Directors at its meeting on May 29, 2012 38
(Unaudited)
City of Little Rock, Arkansas
Monthly Financial Report
Fire Pension and Relief Fund
For the Period Ended January 31, 2012

YTD Variance
YTD Revenues and Favorable Jan 31, 2011
Budget Budget Expenditures (Unfavorable) Unaudited
ADDITIONS:
Contributions:
1 Employer $0 $0 $0 $0 $415,391
2 Plan members 0 0 28,850 28,850 0
3 General property taxes 0 0 0 0 0
4 State insurance turnback and guarantee fund 0 0 0 0 0
5 Other 0 0 0 0 0
6 Total Contributions 0 0 28,850 28,850 415,391
Investment income (loss):
7 Net increase (decrease) in fair value of investments 0 0 255,367 255,367 137,645
8 Interest and dividends 0 0 11,723 11,723 11,038
9 0 0 267,090 267,090 148,683
10 Less investment expense 0 0 (11,449) (11,449) (10,526)
11 Net investment income (loss) 0 0 255,642 255,642 138,157
12 TOTAL ADDITIONS 0 0 284,492 284,492 553,548
DEDUCTIONS:
13 Benefits paid directly to participants 0 0 150,321 (150,321) 128,185
14 Administrative expenses 0 0 0 0 0
15 TOTAL DEDUCTIONS 0 0 150,321 (150,321) 128,185
16 NET INCREASE (DECREASE) 0 0 134,170 134,170 425,363
17 NET ASSETS HELD IN TRUST FOR PENSION BENEFITS, BEGINNING 0 0 9,158,879 9,158,879 8,437,622
18 NET ASSETS HELD IN TRUST FOR PENSION BENEFITS, ENDING $0 $0 $9,293,049 $9,293,049 $8,862,985
This Monthly Financial Report was presented to the Little Rock
Board of Directors at its meeting on May 29, 2012 39
(Unaudited)
For the Period Ended January 31, 2012
City of Little Rock, Arkansas
Monthly Financial Report
Non-Uniform Defined Benefit Fund

YTD Variance
YTD Revenues and Favorable Jan 31, 2011
Budget Budget Expenditures (Unfavorable) Unaudited
ADDITIONS:
Contributions:
1 Employer $0 $0 $121,183 $121,183 $94,995
2 Plan members 0 0 174,665 174,665 125,066
3 General property taxes 0 0 0 0 0
4 State insurance turnback and guarantee fund 0 0 0 0 0
5 Other 0 0 0 0 0
6 Total Contributions 0 0 295,848 295,848 220,061
Investment income (loss):
7 Net increase (decrease) in fair value of investments 0 0 945,312 945,312 563,180
8 Interest and dividends 0 0 46,882 46,882 55,567
9 0 0 992,194 992,194 618,747
10 Less investment expense 0 0 (44,137) (44,137) (45,692)
11 Net investment income (loss) 0 0 948,057 948,057 573,056
12 TOTAL ADDITIONS 0 0 1,243,905 1,243,905 793,117
DEDUCTIONS:
13 Benefits paid directly to participants 0 0 0 0 693,454
14 Administrative expenses 0 0 0 0 0
15 TOTAL DEDUCTIONS 0 0 0 0 693,454
16 NET INCREASE (DECREASE) 0 0 1,243,905 1,243,905 99,663
17 NET ASSETS HELD IN TRUST FOR PENSION BENEFITS, BEGINNING 0 0 35,309,535 35,309,535 36,605,772
18 NET ASSETS HELD IN TRUST FOR PENSION BENEFITS, ENDING $0 $0 $36,553,440 $36,553,440 $36,705,435
This Monthly Financial Report was presented to the Little Rock
Board of Directors at its meeting on May 29, 2012 40
City of Little Rock, Arkansas
(Unaudited)
For the Period Ended January 31, 2012
Non-Uniform Defined Contribution Fund
Monthly Financial Report

YTD Variance
YTD Revenues and Favorable Jan 31, 2011
Budget Budget Expenditures (Unfavorable) Unaudited
ADDITIONS:
Contributions:
1 Employer $0 $0 $0 $0 $0
2 Plan members 0 0 0 0 0
3 General property taxes 0 0 0 0 0
4 State insurance turnback and guarantee fund 0 0 0 0 0
5 Other 0 0 0 0 0
6 Total Contributions 0 0 0 0 0
Investment income (loss):
7 Net increase (decrease) in fair value of investments 0 0 0 0 0
8 Interest and dividends 0 0 0 0 0
9 0 0 0 0 0
10 Less investment expense 0 0 0 0 0
11 Net investment income (loss) 0 0 0 0 0
12 TOTAL ADDITIONS 0 0 0 0 0
DEDUCTIONS:
13 Benefits paid directly to participants 0 0 - 0 0
14 Administrative expenses 0 0 0 0 0
15 TOTAL DEDUCTIONS 0 0 0 0 0
16 NET INCREASE (DECREASE) 0 0 0 0 0
17 NET ASSETS HELD IN TRUST FOR PENSION BENEFITS, BEGINNING 0 0 7,033,795 7,033,795 6,501,895
18 NET ASSETS HELD IN TRUST FOR PENSION BENEFITS, ENDING $0 $0 $7,033,795 $7,033,795 $6,501,895
This Monthly Financial Report was presented to the Little Rock
Board of Directors at its meeting on May 29, 2012 41
(Unaudited)
City of Little Rock, Arkansas
Monthly Financial Report
401 (a) Pension Fund
For the Period Ended January 31, 2012

City of Little Rock, Arkansas
Monthly Financial Report
Definitions
For the Period Ended January 31, 2012
(Unaudited)
Accrual Basis of Accounting means a Basis of Accounting that recognizes the financial effect of
transactions, events and interfund activities when they occur, regardless of the timing of related cash
flows.
Revenue(s) means: (1) Increases in the net current assets of a Governmental Fund Type from other
than expenditure refunds and residual equity transfers, but does not include any general long-term debt
proceeds and operating transfers in - which are classified as "other financing sources" -- unless these
constitute a reservation of fund balances for encumbrances carried forward from the prior year and the
expenditure for which the fund balance was created has also been carried forward; or (2) Increases in
the net total assets of a Proprietary Fund Type from other than expense refunds, capital contributions
and residual equity transfers, but does not include operating transfer in which are classified separately
from revenues unless these constitute a reservation of fund balances for encumbrances carried
forward from the prior year and the expense for which the fund balance was created has also been
carried forward.
Expenditures means decreases in net financial resources under the current financial resources
measurement focus, and pertains to payment of normal operating payments and encumbrances.
Expenditures are measured in governmental fund accounting.
Expenses mean the cost of doing business in a proprietary organization, and can be either outflows or
the using up of assets - cost expiration - such as the depreciation of fixed assets.
Fund Balance means the difference between assets and liabilities reported in the governmental fund.
The Fund Balance is the excess of revenue or expenditures that has accumulated since the inception
of the fund.
Note: The financials reports for all funds are prepared using the accrual basis of accounting.
42

Accounts Payable, Bonds Payable and Other Payables
For the Period Ended January 31, 2012
Accounts Wages and Benefits Other Deferred Revenue Bonds Total Payables
Fund Payable Payable Payables Revenues Payable Total Encumbrances
General 107,821 6,937,768 1,143,490 26,096,225 0 34,285,304 61,319
General - Special Projects 3,799 322,975 326,774 130,805
Seized Money 67,671 67,671 32,174
Street 21,226 5,112,699 5,133,925 82,894
Street - Special Projects 0 0
Special Projects 14,260 4,328 18,587 360,311
Infrastructure 0 11,693
911 662,117 662,117 6,387
CDBG 6,859 721,753 728,612 515,753
HIPP 23,180 23,180 83,891
NHSP 0 0
Grants 55,361 2,581,440 2,561,894 5,198,695 2,405,938
1988 Capital Improvement 0 0
1995 Capital Improvement 0 0
1998 Capital Improvement - Infrastructure 3,465 3,465 11,195
2009 Capital Improvements 7,804 84,116 91,920 151,982
Issuance and Reserve Fund 0 0
2008 Library Improvement Bonds 0 0
Short Term Financing Capital Improvements 0 2,128,285
2012-2021 Capital Project Fund 0 8,136,042
2009 Parks & Rec Cap Improvement 0 0
Infrastructure Debt Service 0 0
2002 CIP Jr. Lien Bonds 0 0
2004 Improvement Bonds Debt Service Fund 11,669,018 11,669,018 0
2004 Library Improvement Bonds Debt Service 7,062,027 7,062,027 0
2008 Library Improvement Bonds Debt Service 3,198,159 3,198,159 0
Fleet 37,978 249,170 287,148 0
Vehicle Storage Facility 3,474 923,180 50,851 977,505 0
Waste Disposal 2,656 4,680,186 9,315,000 13,997,842 0
Rivermarket 46,550 2,530,522 2,577,073 0
Recreation Services 590,238 11,560,000 12,150,238 0
Zoo 163,553 4,020,552 4,184,106 0
Zoo Special Projects Fund 680 680 4,210
Golf 19,030 5,432,076 9,116 5,460,223 0
Jim Dailey Fitness and Aquatics Center 2,192 63,214 65,406 0
Rivermarket Garage Fund 41,545 428,467 9,880,000 10,350,013 0
Police Pension 995 9,685 10,680 0
Fire Pension (203) 13,782 13,580 0
Non-Uniform Defined Benefit 0 0
Non-Uniform Defined Contribution 0 0
401 (a) Pensions 0 0
Accounts Payable Clearing Fund 729,406 729,406 0
Totals 1,226,116 6,938,560 23,837,919 56,515,758 30,755,000 119,273,353 14,122,879
43

PRINCIPAL PRINCIPAL BONDS PRINCIPAL INTEREST
ORIGINAL MATURITY INTEREST BALANCE BONDS PAID IN RETIRED BALANCE PAID IN
GENERAL OBLIGATION DEBT TRUSTEE AMOUNT DATE RATE AT 12/31/11 ISSUED 2012 2012 AT 01/31/2012 2012
-
2004 Limited Tax Capital Improvement Regions Bank (Paying Agent & Registrar) $70,635,000 4/1/2016 3.75% - 4.00% $14,430,000 $0 $0 $0 $14,430,000 $0
2004 Library Refunding Bonds-Series A & B Metropolitan Bank 25,000,000 3/1/2022 2.00% - 4.35% 9,220,000 0 0 0 9,220,000 0
2008 Library Construction and Improvement Bonds Metropolitan Bank 4,000,000 3/1/2028 3,495,000 0 0 0 3,495,000 0
2009 Library Construction and Improvement Bonds Metropolitan Bank 28,000,000 3/1/2028 3.00% - 5.00% 25,880,000 0 0 0 25,880,000 0
REVENUE BONDS
2007 Infrastruture Refunding Metropolitan Bank 13,350,000 10/1/2019 4.00% - 5.00% 9,460,000 0 0 0 9,460,000 0
2002 Junior Lien Revenue Bonds Metropolitan Bank 3,630,000 10/1/2018 3.50% - 4.65% 1,890,000 0 0 0 1,890,000 0
2009A Parks & Rec Revenue Bonds Bank of the Ozarks 7,830,000 1/1/2039 2.00% - 5.50% 7,385,000 0 130,000 0 7,255,000 185,273
2003 Capital Improvement and Refunding-Parking Projects Metropolitan Bank 11,855,000 7/1/2028 1.50% - 5.30% 9,880,000 0 0 0 9,880,000 249,273
2007 Waste Disposal Revenue Bond Citizens Bank 3,400,000 5/1/2022 5.30% - 5.87% 2,745,000 0 0 0 2,745,000 0
2009B Parks & Rec Bank of the Ozarks 12,120,000 1/1/2039 2.00% - 5.375% 11,770,000 0 210,000 0 11,560,000 295,140
2010 Waste Disposal Revenue Bonds BancorpSouth 6,570,000 5/1/2016 1.90% - 3.77% 6,570,000 0 0 0 6,570,000 0
TEMPORARY NOTE
6th 2006 Temporary Note Bank of America 6,550,000 4/25/2011 3.86% 0 0 0 0 0 0
7th 2007 Temporary Note Suntrust 5,919,000 5/1/2012 3.79% 1,273,494 0 0 0 1,273,494 0
8th 2007 Temporary Note Bank of America 1,372,000 7/19/2012 6.24% 308,554 0 0 0 308,554 0
9th 2008 Temporary Note Bank of America 4,991,500 9/25/2013 4.69% 2,134,800 0 0 0 2,134,800 0
10th 2011 Temporary Note Pinnacle Public Finance 4,600,000 12/22/2016 1.75% 4,600,000 0 0 0 4,600,000 0
Grand Total $209,822,500 $111,041,847 $0 $340,000 $0 $110,701,847 $729,685
44
SUMMARY OF BOND INDEBTEDNESS
For the month ended January 31, 2012