reverse engineering static content and dynamic behaviour ... · reverse engineering static content...
TRANSCRIPT

ForJu
ryEva
luatio
n
FACULDADE DE ENGENHARIA DA UNIVERSIDADE DO PORTO
Reverse Engineering Static Content andDynamic Behaviour of E-Commerce
Websites for Fun and Profit
João Pedro Matos Teixeira Dias
Master in Informatics and Computing Engineering
Supervisor: Hugo Sereno Ferreira, PhD
Co-supervisor: Rui Gonçalves
June 27, 2016

Reverse Engineering Static Content and DynamicBehaviour of E-Commerce Websites for Fun and Profit
João Pedro Matos Teixeira Dias
Master in Informatics and Computing Engineering
Approved in oral examination by the committee:
Chair:External Examiner:Supervisor:
June 27, 2016


Abstract
Nowadays electronic commerce websites are one of the main transaction tools between on-linemerchants and consumers or businesses. These e-commerce websites rely heavily on summarizingand analyzing the behaviour of customers, making an effort to influence user actions towards theoptimisation of success metrics such as CTR (Click through Rate), CPC (Cost per Conversion),Basket and Lifetime Value and User Engagement. Knowledge extraction from the existing e-commerce websites datasets, using data mining and machine learning techniques, has been greatlyinfluencing the Internet marketing activities.
When faced with a new e-commerce website, the machine learning practitioner starts a webmining process by collecting historical and real-time data of the website and analyzing/transform-ing this data in order to be capable of extracting information about the website structure and con-tent and its users’ behaviour. Only after this process the data scientists are able to build relevantmodels and algorithms to enhance marketing activities.
This is an expensive process in resources and time since it will always depend on the conditionin which the data is presented to the data scientist, since data with more quality (i.e. no incompletedata) will make the data scientist work easier and faster. On the other hand, in most of the cases,data scientists would usually resort to tracking domain-specific events throughout a user’s visit tothe website in order to fulfill the objective of discovering the users’ behaviour and, for this, it isnecessary to perform code modifications to the pages themselves, that will result in a larger risk ofnot capturing all the relevant information by not enabling tracking mechanisms in certain pages.For example, we may not know a priori that a visit to a Delivery Conditions page is relevant to theprediction of a user’s willingness to buy and therefore would not enable tracking on those pages.
Within this problem context, the proposed solution consists in a methodology capable of ex-tracting and combining information about a e-commerce website through a process of web mining,comprehending the structure as well as the content of the website pages, relying mostly on identi-fying dynamic content and semantic information in predefined locations, complemented with thecapability of, using the user’s access logs, extracting more accurate models to predict the users fu-ture behaviour. This allows for the creation of a data model representing an e-commerce websiteand its archetypical users that can be useful, for example, in simulation systems.
i

ii

Resumo
Atualmente os websites de comércio eletrónico são uma das ferramentas principais para a realiza-ção de transações entre comerciantes online e consumidores ou empresas. Estes websites apoiam-se fortemente na sumarização e análise dos hábitos de navegação dos consumidores, de forma ainfluenciar as suas ações no website com o intuito de otimizar métricas de sucesso como o CTR(Click through Rate), CPC (Cost per Conversion), Basket e Lifetime Value e User Engagement. Autilização de técnicas de data mining e machine learning na extração de conhecimento a partir dosconjuntos de dados existentes nos websites de comércio eletrónico tem vindo a ter uma crescenteinfluência nas campanhas de marketing realizadas na Internet.
Quando o provedor de serviços de machine learning se deparada com um novo website decomércio eletrónico, inicia um processo de web mining, fazendo recolha de dados, tanto históricoscomo em tempo real, do website e analisando/transformando estes dados de forma a tornar osmesmos utilizáveis para fins de extração de informação tanto sobre a estrutura e conteúdo de umwebsite assim como dos hábitos de navegação dos seus utilizadores típicos. Apenas após esteprocesso é que os data scientists são capazes de desenvolver modelos relevantes e algoritmos paramelhorar e otimizar as atividades de marketing online.
Este processo é, na sua generalidade, moroso em tempo e recursos, dependendo sempre dacondição em que os dados são apresentados ao data scientist. Dados com mais qualidade (p.ex.dados completos), facilitam o trabalho dos data scientists e tornam o mesmo mais rápido. Poroutro lado, na generalidade dos casos, os data scientists tem de recorrer a técnicas de monitor-ização de eventos específicos ao domínio do website de forma a atingir o objetivo de conhecer oshábitos dos utlizadores, tornando-se necessário a realização de modificações ao código fonte dowebsite para a captura desses mesmos eventos, aumentando assim o risco de não capturar toda ainformação relevante por não ativar os mecanismos de monitorização em todas as páginas do web-site. Por exemplo, podemos não ter conhecimento a priori que uma visita à página de Condiçõesde Entrega é relevante para prever o desejo de um dado consumidor efetuar uma compra e, destaforma, os mecanismos de monitorização nessas páginas podem não ser ativados.
No contexto desta problemática, a solução proposta consiste numa metodologia capaz de ex-trair e combinar a informação sobre um dado website de comércio eletrónico através de um pro-cesso de web mining, compreendendo a estrutura de páginas de um website, assim como do con-teúdo das mesmas, baseando-se para isso na identificação de conteúdo dinâmico das páginas assimcomo informação semântica recolhida de locais predefinidos. Adicionalmente esta informação écomplementada, usando dados presente nos registos de acesso de utilizadores, com modelos pred-itivos do futuro comportamento dos utilizadores no website. Torna-se assim possível a apresen-tação de um modelo de dados representando a informação sobre um dado website de comércioeletrónico e os seus utilizadores arquetípicos, podendo posteriormente estes dados serem utiliza-dos, por exemplo, em sistemas de simulação.
iii

iv

Acknowledgements
Prima facie, I want to thank my supervisor Hugo Sereno Ferreira for all the shared knowledge andorientation given during the realization of this dissertation.
I am also grateful to my co-supervisor, Rui Gonçalves, for all the feedback given as well as alltechnical insights on Scala and e-commerce world.
I would like to thank all the people at ShiftForward for welcoming me and for the precioushelp given many times during my research, always providing me with what I needed. Also, I wantto thank all the people and friends from NuIEEE UP (IEEE Student Branch of Universidade doPorto) for all support and all the help provided.
Last but not least, I want to express my gratitude to all my friends and family, for the constantsupport and motivation, without which I would not be able to make this accomplishment.
João Pedro Matos Teixeira Dias
v

vi

“Part of the inhumanity of the computer is that, once it is competently programmed and workingsmoothly, it is completely honest.”
Isaac Asimov
vii

viii

Contents
1 Introduction 11.1 Motivation . . . . . . . . . . . . . . . . . . . . . . . . . . . . . . . . . . . . . . 11.2 Aim and Goals . . . . . . . . . . . . . . . . . . . . . . . . . . . . . . . . . . . 21.3 Expected Contributions . . . . . . . . . . . . . . . . . . . . . . . . . . . . . . . 21.4 Structure of this Dissertation . . . . . . . . . . . . . . . . . . . . . . . . . . . . 3
2 Literature Review 52.1 E-commerce Overview . . . . . . . . . . . . . . . . . . . . . . . . . . . . . . . 5
2.1.1 E-commerce Metrics . . . . . . . . . . . . . . . . . . . . . . . . . . . . 62.1.2 Recommendation Systems . . . . . . . . . . . . . . . . . . . . . . . . . 62.1.3 E-commerce websites structure overview . . . . . . . . . . . . . . . . . 7
2.2 Web Mining . . . . . . . . . . . . . . . . . . . . . . . . . . . . . . . . . . . . . 82.2.1 Web Mining Taxonomy . . . . . . . . . . . . . . . . . . . . . . . . . . 92.2.2 Data Collection and Preprocessing . . . . . . . . . . . . . . . . . . . . . 122.2.3 Web Data Extraction . . . . . . . . . . . . . . . . . . . . . . . . . . . . 182.2.4 Pattern Discovery and Analysis . . . . . . . . . . . . . . . . . . . . . . 20
2.3 User Profiling . . . . . . . . . . . . . . . . . . . . . . . . . . . . . . . . . . . . 292.3.1 User Profile Representation . . . . . . . . . . . . . . . . . . . . . . . . 292.3.2 User Profile Construction . . . . . . . . . . . . . . . . . . . . . . . . . . 32
2.4 Conclusion . . . . . . . . . . . . . . . . . . . . . . . . . . . . . . . . . . . . . 34
3 Problem Statement 353.1 Goal Statement . . . . . . . . . . . . . . . . . . . . . . . . . . . . . . . . . . . 363.2 Issue Analysis and Target Conditions . . . . . . . . . . . . . . . . . . . . . . . . 363.3 Conclusion . . . . . . . . . . . . . . . . . . . . . . . . . . . . . . . . . . . . . 37
4 High-level Overview 394.1 High-level Process Overview . . . . . . . . . . . . . . . . . . . . . . . . . . . . 404.2 Data Collection and Processing . . . . . . . . . . . . . . . . . . . . . . . . . . . 42
4.2.1 Website Structure Mining . . . . . . . . . . . . . . . . . . . . . . . . . 424.2.2 Website Pages Content Mining . . . . . . . . . . . . . . . . . . . . . . . 434.2.3 Website Usage Mining . . . . . . . . . . . . . . . . . . . . . . . . . . . 45
4.3 Website Data Crossing . . . . . . . . . . . . . . . . . . . . . . . . . . . . . . . 474.3.1 Website’s Category Tree . . . . . . . . . . . . . . . . . . . . . . . . . . 474.3.2 Keyword-based User Profiles . . . . . . . . . . . . . . . . . . . . . . . . 48
4.4 Pattern Discovery and Analysis . . . . . . . . . . . . . . . . . . . . . . . . . . . 484.4.1 Keyword-based User Profiles Clustering . . . . . . . . . . . . . . . . . . 484.4.2 Session Type Based Clustering . . . . . . . . . . . . . . . . . . . . . . . 49
ix

CONTENTS
4.5 Website Information Model . . . . . . . . . . . . . . . . . . . . . . . . . . . . . 494.6 Conclusion . . . . . . . . . . . . . . . . . . . . . . . . . . . . . . . . . . . . . 50
5 Implementation Details 535.1 Desiderata . . . . . . . . . . . . . . . . . . . . . . . . . . . . . . . . . . . . . . 535.2 Overview . . . . . . . . . . . . . . . . . . . . . . . . . . . . . . . . . . . . . . 54
5.2.1 Website Pages Data Collection . . . . . . . . . . . . . . . . . . . . . . . 555.2.2 Website Logs Data Collection . . . . . . . . . . . . . . . . . . . . . . . 56
5.3 Limitations . . . . . . . . . . . . . . . . . . . . . . . . . . . . . . . . . . . . . 575.4 Conclusion . . . . . . . . . . . . . . . . . . . . . . . . . . . . . . . . . . . . . 58
6 Evaluation 596.1 Data Sources Analysis and Description . . . . . . . . . . . . . . . . . . . . . . . 606.2 Experimental Parameters and Configurations . . . . . . . . . . . . . . . . . . . 606.3 Experimental Results . . . . . . . . . . . . . . . . . . . . . . . . . . . . . . . . 61
6.3.1 Niche Dedicated E-commerce Website . . . . . . . . . . . . . . . . . . . 616.3.2 General Purpose E-commerce Website . . . . . . . . . . . . . . . . . . . 64
6.4 Conclusion . . . . . . . . . . . . . . . . . . . . . . . . . . . . . . . . . . . . . 65
7 Conclusion 677.1 Main Contributions . . . . . . . . . . . . . . . . . . . . . . . . . . . . . . . . . 687.2 Further Work . . . . . . . . . . . . . . . . . . . . . . . . . . . . . . . . . . . . 69
References 71
A Additional Visualizations of Experiments 77
x

List of Figures
2.1 Common simplified e-commerce website map [Coo00]. . . . . . . . . . . . . . . 82.2 Web mining process overview [MC10]. . . . . . . . . . . . . . . . . . . . . . . 92.3 Web mining taxonomy [SA13]. . . . . . . . . . . . . . . . . . . . . . . . . . . . 102.4 Web Graph example of a website with 3 pages (nodes) and 4 links (edges). . . . . 112.5 Google Analytics functional scheme [Cut10]. . . . . . . . . . . . . . . . . . . . 152.6 Flow of a basic sequential Web crawler [PSM04]. . . . . . . . . . . . . . . . . . 162.7 Sample type tree of a generic product page [Liu11]. . . . . . . . . . . . . . . . . 202.8 Sample EC tree of a generic product HTML page [Liu11]. . . . . . . . . . . . . 202.9 Example of an SVM classification with the best plane which maximizes the margin. 262.10 Example of a user navigational trails [Sin04]. . . . . . . . . . . . . . . . . . . . 272.11 An example of modelling navigational trails in an aggregate tree. . . . . . . . . . 282.12 An example of a user profile based on semantic networks. . . . . . . . . . . . . . 312.13 An excerpt of a concept-based user profile [GSCM07]. . . . . . . . . . . . . . . 32
4.1 A representation of the data flow thought the designed process, with respectivemajor stages identified. . . . . . . . . . . . . . . . . . . . . . . . . . . . . . . . 41
4.2 An example of a website’s category tree. . . . . . . . . . . . . . . . . . . . . . . 474.3 A representation of the website information meta-model. . . . . . . . . . . . . . 50
5.1 A representation of the data flow, operations and outputs. . . . . . . . . . . . . . 54
6.1 Chart representing the crawling of the Niche Dedicated E-commerce Website, con-sidering the crawling time in seconds, pages visited and frontier size. . . . . . . . 62
6.2 Chart representing the number of pages by page type on the Niche Dedicated E-commerce Website . . . . . . . . . . . . . . . . . . . . . . . . . . . . . . . . . . 63
6.3 Chart representing the number of pages by page type on the General PurposeE-commerce Website . . . . . . . . . . . . . . . . . . . . . . . . . . . . . . . . 65
A.1 Visualization of the Niche Dedicated E-commerce Website category tree. . . . . . 78A.2 Visualization of the Niche Dedicated E-commerce Website web graph. . . . . . . 79A.3 Visualization of the General Purpose E-commerce Website category tree. . . . . . 80
xi

LIST OF FIGURES
xii
List of Tables
2.1 Example of a pageview transaction matrix. . . . . . . . . . . . . . . . . . . . . . 222.2 Example of a market basket transactions. . . . . . . . . . . . . . . . . . . . . . . 232.3 Frequency of occurrence of each transaction [Sin04]. . . . . . . . . . . . . . . . 272.4 An example of a keyword-based user profile. . . . . . . . . . . . . . . . . . . . 29
4.1 Summary of the used data sources, applied techniques and outcomes. . . . . . . . 40
6.1 Session original characteristics. . . . . . . . . . . . . . . . . . . . . . . . . . . . 636.2 Input synthetic user data. . . . . . . . . . . . . . . . . . . . . . . . . . . . . . . 636.3 Output user profile information. . . . . . . . . . . . . . . . . . . . . . . . . . . 646.4 Output user clusters after clustering by session characterisation. . . . . . . . . . 656.5 Output user average interests after clustering by preferences. . . . . . . . . . . . 66
xiii

LIST OF TABLES
xiv

Abbreviations
B2B Business-to-businessB2C Business-to-consumerCR Conversion rateCSP Contiguous Sequential PatternCSS Cascading Style SheetsCTR Click-through rateDOM Document Object ModelE-commerce Electronic CommerceEDA Exploratory Data AnalysisGATC Google Analytics Tracking CodeHTML HyperText Markup LanguageJSON JavaScript Object NotationkNN k-Nearest-NeighbourPOC Proof of ConceptSVM Supported Vector MachinesURL Uniform Resource LocatorW3C World Wide Web ConsortiumWCM Web content miningWSM Web structure miningWUM Web usage miningWWW World Wide WebXML eXtensible Markup Language
xv


Chapter 1
Introduction2
Nowadays, thanks to the development of electronic commerce (e-commerce), a great percentage
of the most basic of economic transactions - the buying and selling of goods - take place over4
electronic networks, mostly the Internet. This is a constantly growing business and it is expected
that the number of e-commerce transactions will reach 38.5 billion in 2015 [Sta16].6
When a user enters on an e-commerce website marketing and advertising mechanisms are
put in place, trying to influence the user behaviour to improve sales and increase profits. These8
mechanisms rely heavily on summarizing and analysing the behaviour of costumers. Data mining
and machine learning techniques have been applied towards the development of these mechanisms,10
making a great significance in Internet marketing activities, and improving e-commerce sales and
profits.12
There are a considerable number of companies today who develop and provide tools and mech-
anisms to e-commerce business owners in order to make them capable of improving their sales and14
take better data-driven decisions (i.e. marketing decisions). These tools are used with the objec-
tive to track and learn costumers habits, being the most of the times complemented with automatic16
recommendation systems. This makes e-commerce business owners more capable of doing more
precise target marketing and advertisement, with, for example, recommending the most interesting18
product for each visitor, increasing overall sales, and profits.
1.1 Motivation20
When faced with a new e-commerce website, the machine learning practitioner typically spends
a great amount of time collecting and analysing the static and dynamic data of the website. This22
process is essential to extract useful information about the website’s structure, content, and its
users’ behaviour. Only after this process, the machine learning partitioner becomes able to build24
relevant models and algorithms to enhance online marketing activities. This is a great challenge
because of the heterogeneous nature of the data, the semi-structured or unstructured way that data26
is presented and the data existent is so vast that we can easily get overwhelmed by it [ZS08].
1
Introduction
The process of extracting information from a website’s structure, content and users is mostly
a repetitive and semi-automated task, which is reflected in the necessity of allocating dedicated 2
resources to it. In some cases, there is a need of analysing and track the website for a certain
period of time after it comes to the hands of machine learning practitioner for data collection 4
proposes, implying a waste of time. Besides that, there is a great risk of relevant knowledge that
may exist between data sources pass unnoticed. Improving this process to an automatic one can 6
bring some advantages, including the reduce of costs, as well as, the risks of information losses.
1.2 Aim and Goals 8
The aim of this dissertation is to develop a process capable of, given an e-commerce website,
extracting useful information from its structure, content and its typical users’ behaviour using 10
state of the art techniques and methods, returning a consistent model representing the website
content, relations between pages and its archetypical users. This has the objective of reducing the 12
time and resources required to analyse an e-commerce website on the machine learning end. It
is also an objective improve the extraction of knowledge, making possible establish relationships 14
between a given website structure, content and usage, becoming the website more clear to the data
scientist. 16
The expected final result of the present work is a functional prototype of a tool, as the process’s
proof of concept, capable of, applying already researched techniques, extract useful information 18
from a website. The tool developed is aimed to be ready (as it is or with little changes) to be used
by a data scientist in order to get a grasp of the site’s layout and its users’, aiming to make the data 20
collection and information extract task more efficient, easy and concise.
1.3 Expected Contributions 22
We propose a study of a new process for extracting and representing the information present on
a given e-commerce website. The website pages and the connections between them are mapped 24
into a data structure, as well the navigational habits of its users. This process will consist of a all-
in-one approach, trying to mitigate possible data relationships losses from the typical, a partially 26
separate, tasks used to retrieve this data.
The contributions of this dissertation can be summarized in the following points: 28
1. An all-in-one approach to extract information from an e-commerce website content, struc-
ture and its archetypical users; 30
2. A concise representation of this information in a consistent and adaptable model, in order
to make the knowledge access and retrieval more direct and easy; 32
3. Mitigate possible flaws when collecting data, establishing relationships and connections
between data sources that could otherwise pass unnoticed to the data scientist. 34
2

Introduction
1.4 Structure of this Dissertation
In Chapter 2, it’s provided a contextualization on e-commerce area and background review of2
the related work in web mining and user profiling fields, going through web mining taxonomy,
user profiling techniques, e-commerce peculiarities and the importance success metrics on e-4
commerce. The problem addressed in this dissertation is detailed in Chapter 3, presenting the
major challenges but also possible solutions for those challenges.6
Chapter 4 presents an high-level overview of the process to, on one hand, retrieve a website
static content and place it into a structured representation, and, on the other hand, discover the8
website’s archetypical users through the representation of statistical models, user flows and usage
patterns. Some details of the implementation realized are presented in Chapter 5. An evaluation10
of the process realized, including some results from techniques applied is made in Chapter 6. At
last, some closing remarks and further work are presented in Chapter 7.12
3

Introduction
4

Chapter 2
Literature Review2
This chapter provides an overview of previous research on the area of extracting, analysing and
modelling structure and content from e-commerce websites, but also, user profiling techniques to4
find and retrieve archetypical users on this websites, in this case, known as typical costumers.
Firstly, it is done a contextualization on e-commerce in Section 2.1. The current research on6
mining the web, known as Web Mining is presented and analysed in Section 2.2. User profiling
research and techniques are covered in Section 2.3. At last, some conclusions over the current8
state of the art are presented in Section 2.4.
2.1 E-commerce Overview10
E-commerce has become an essential tool for small and large businesses worldwide, not only as a
tool of selling goods directly to consumers (B2C) or to other businesses (B2B) but also as a way12
of engaging them [EK08].
“Electronic commerce is the process of buying, selling, transferring, or exchanging14
products, services, and/or information via computer networks, including the Internet.”
[TK11]16
E-commerce is one of the innovations with most impact over the consumer habits, mostly due
to his unique features. E-commerce benefits of its ubiquity nature, since it works over the WWW,18
it is available everywhere at any time, through desktops, mobiles, and tablets. Besides that, the
richness of information presented to the user make e-commerce a great bridge between merchants20
and customers [Hyd05].
When talking about e-commerce business is obligatory to mention Amazon1 and eBay2, which22
were among the first Internet companies to make available electronic transactions to the users.
But, as of today, this kind of transactions are available everywhere on the WWW, even through24
1http://www.amazon.com/2http://ebay.com/
5
Literature Review
social networks like Facebook3. Associated with this, it’s increasingly common that marketing
and advertising campaigns run over the Internet too [Moh12]. 2
E-commerce companies commonly resort to the Web personalization techniques as a way of
doing target marketing over its visitors based on each visitor individual characteristics with the 4
goal of improving the likelihood of a visitor generate profit [Hyd05].
2.1.1 E-commerce Metrics 6
For a long time now, business community knows how to measure performance on traditional com-
merce based on the number of sales and profit and what to expect from clients paying attention to 8
metrics like Costumer Lifetime Value and Costumer Engagement. When talking about the Internet,
there is a need of using metrics beyond the traditional ones, called e-metrics, with the propose of 10
measuring a website success and improving its performance. Basic concepts like page views and
unique visitors are already used by almost every website, but more advanced metrics that take into 12
account the loyalty of a visitor, or typical users habits, are now becoming an essential practice to
increase the user engagement [SC00]. 14
In e-commerce websites, besides the common metrics used to measure a website performance,
including bounce rate (users that visit one page and jump off the website), there are some unique 16
metrics that can give us a better and more direct overview of the online business performance, as
follows: 18
• Conversion rate that is given by the number of buyers (or paying customers) over the total
number of website users; 20
• Click-through rate stands for the ratio between the users who click on a specific link to the
total number of page visitors; 22
• Costumer retention is the measure that shows the ability of a website retain customers over
the long term [Gef02]; 24
• Shopping cart abandonment rate that gives the number of times in which an item was added
to the shopping cart but the order was not completed. 26
Peska et al. [PV12] consider Conversion rate and Click-through rate as the primary metrics
when validating recommendation systems present in a website. An overview of recommendation 28
systems and its impact is detailed in 2.1.2.
2.1.2 Recommendation Systems 30
E-commerce is a very convenient way for people do their shopping. However, on one hand, it
is sometimes a difficult task for customers to select a valuable item over the great number of 32
various products available on a website. On the other hand, most of the e-commerce websites
3http://facebook.com/
6

Literature Review
depend on this personalization capabilities to show the user more targeted products and advertises,
improving the sales and profits. Here is where the personalization capabilities of a website for2
each customer become essential, giving the user suggestions on products, refining search results
and targeting advertises. Recommendation mechanisms goal is to influence user actions towards4
the optimisation of success e-metrics, maintaining the customer satisfaction.
A recommender system usually depends on a three-step process, starting with data retrieval,6
normally resorting to Web mining techniques, where we get to know the user preferences by
analysing static content and user behaviour data, followed by computing and validating the rec-8
ommendation using proper techniques and finalizing by presenting the recommendation results to
the customer [WHF07].10
As Wei et al. [WHF07] suggests, the typical recommendation mechanisms are split into three
approaches: collaborative filtering, content-based filtering, and hybrid.12
Collaborative filtering is one of the most widely adopted and successful recommendation ap-
proach technique. This technique bases itself on building a customer preference model based on14
their previous iterations, thus distancing itself from techniques that are based on intrinsic consumer
and product characteristics [ZDH07].16
Content-based recommendation systems are systems that, by analysing items description and
details, identify items that fit in the user particular interests based on their user profile. A user18
profile can contain a number of different types of information, but it should contain a model of
user preferences - description of items that the user expressed interest about - and a history of the20
user’s interactions with the website, this can include information like what other items the user has
viewed [PB07].22
Additionally, as pointed by Wei et al. [WHF07], there is a third type of recommendation
mechanism which consists in a hybrid filtering approach. This approach has combined both the24
collaborative filtering as the content-based recommendation methods. There is various approach
when combining this two methods but they can mostly be classified into three methods. One26
of them consists of introducing some component or feature of one approach into the other one,
as designed by Melville et al. [MMN01]. Another one consists of combining the result of the28
recommendation of each approach into a single recommendation, as proposed by Claypool et al.
[CMG+99]. At last, another approach is to present a comprehensive and unique model depending30
on other information. One example of this method is presented by Popescul et al. [PUPL01],
where is used a probabilistic model technique.32
2.1.3 E-commerce websites structure overview
Despite the heterogeneity of the Web, where every website is unique, there exists a common34
structure on e-commerce websites, due to their purpose of displaying products to a costumer,
giving them the possibility of navigating between different products and make purchases. This36
design and structural followed guidelines by the websites owners help the user to easily adapt
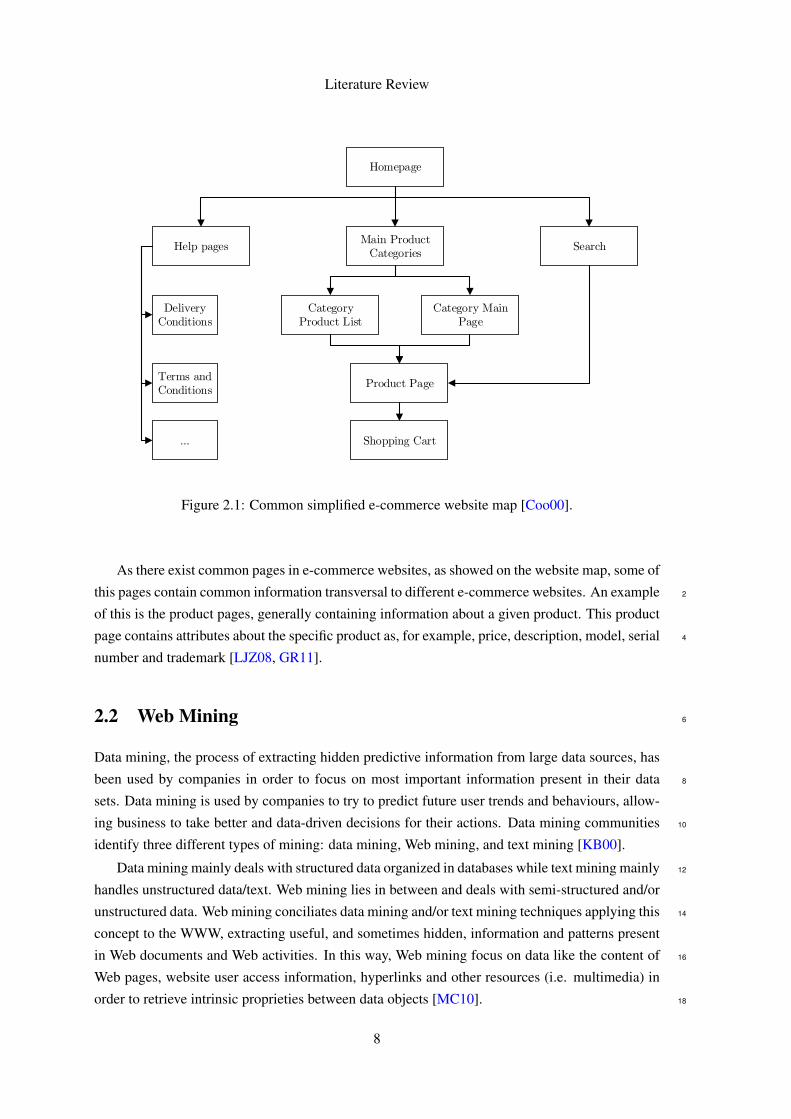
to any e-commerce website, enhancing the overall user experience [Pur11]. The common pages38
existent on a website are present in the Figure 2.1, as a website map.
7
Literature Review
Homepage
Help pagesMain Product
CategoriesSearch
Category Product List
Category Main Page
Product Page
Shopping Cart
Terms and Conditions
Delivery Conditions
...
Figure 2.1: Common simplified e-commerce website map [Coo00].
As there exist common pages in e-commerce websites, as showed on the website map, some of
this pages contain common information transversal to different e-commerce websites. An example 2
of this is the product pages, generally containing information about a given product. This product
page contains attributes about the specific product as, for example, price, description, model, serial 4
number and trademark [LJZ08, GR11].
2.2 Web Mining 6
Data mining, the process of extracting hidden predictive information from large data sources, has
been used by companies in order to focus on most important information present in their data 8
sets. Data mining is used by companies to try to predict future user trends and behaviours, allow-
ing business to take better and data-driven decisions for their actions. Data mining communities 10
identify three different types of mining: data mining, Web mining, and text mining [KB00].
Data mining mainly deals with structured data organized in databases while text mining mainly 12
handles unstructured data/text. Web mining lies in between and deals with semi-structured and/or
unstructured data. Web mining conciliates data mining and/or text mining techniques applying this 14
concept to the WWW, extracting useful, and sometimes hidden, information and patterns present
in Web documents and Web activities. In this way, Web mining focus on data like the content of 16
Web pages, website user access information, hyperlinks and other resources (i.e. multimedia) in
order to retrieve intrinsic proprieties between data objects [MC10]. 18
8
Literature Review
The WWW is a massive, explosive, diverse, dynamic, constantly growing and mostly un-
structured data repository, which delivers an incredible amount of information, increases also the2
complexity of dealing with the information from the perspective of the data scientist [KS10]. Due
to this complexity, Web mining data present some challenges [CG05]:4
• The Web is huge and Web pages are semi-structured or lack of structure at all;
• Web information tends to be diversity in meaning with lots of sources and ambiguity;6
• The degree of quality of the information extracted;
• The reliability of knowledge retrieved from the information extracted.8
Preprocessing Pattern discovery Pattern analysis
Clean and preprocess data
1010011
0101010
1010101
1010111
01
Useful patterns, rulesand statistics
Rules, Patterns and Statistics
Resource discovery
All website files Website pages, structure and usage log files
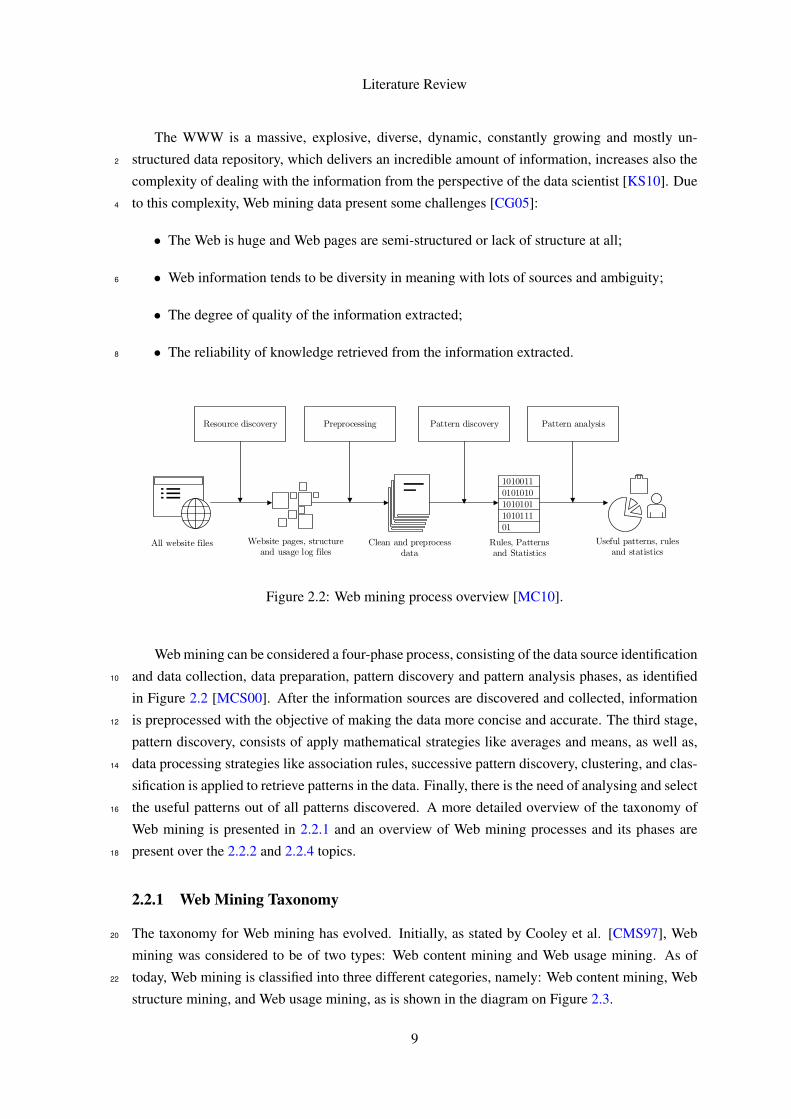
Figure 2.2: Web mining process overview [MC10].
Web mining can be considered a four-phase process, consisting of the data source identification
and data collection, data preparation, pattern discovery and pattern analysis phases, as identified10
in Figure 2.2 [MCS00]. After the information sources are discovered and collected, information
is preprocessed with the objective of making the data more concise and accurate. The third stage,12
pattern discovery, consists of apply mathematical strategies like averages and means, as well as,
data processing strategies like association rules, successive pattern discovery, clustering, and clas-14
sification is applied to retrieve patterns in the data. Finally, there is the need of analysing and select
the useful patterns out of all patterns discovered. A more detailed overview of the taxonomy of16
Web mining is presented in 2.2.1 and an overview of Web mining processes and its phases are
present over the 2.2.2 and 2.2.4 topics.18
2.2.1 Web Mining Taxonomy
The taxonomy for Web mining has evolved. Initially, as stated by Cooley et al. [CMS97], Web20
mining was considered to be of two types: Web content mining and Web usage mining. As of
today, Web mining is classified into three different categories, namely: Web content mining, Web22
structure mining, and Web usage mining, as is shown in the diagram on Figure 2.3.
9

Literature Review
Web Mining
Web Content MiningWeb Structure
MiningWeb Usage Mining
Text and multimedia documents
Hyperlink structureWeb log records
Figure 2.3: Web mining taxonomy [SA13].
As mentioned by Patel et al. [PCP11], Web mining is split into categories that symbolize
the different emphasis and different ways of obtaining information, although the differences be- 2
tween them are narrowing since the categories are all interconnected [KS10]. In Web content
mining knowledge is automatically retrieve from Web pages content, as analysed in 2.2.1.1. In 4
Web structure mining useful information is extracted from hyperlinks, showing how pages are
interconnected one with another, which is presented in 2.2.1.3. Finally, Web usage mining helps 6
define the behaviour of visitors and classify them into groups, as shown in 2.2.1.2.
2.2.1.1 Web Content Mining 8
Web content mining (WCM) is concerned with the retrieval of information from a website and its
Web pages, usually HTML documents. This consists on transforming the original data into more 10
structured forms, indexing the information to retrieve it more easily and quickly. This content can
be text, image, audio, video, meta-data, hyperlinks and other multimedia resources. As referred by 12
Johnson et al. [JK12], as the WWW grown, the information available on it increased, becoming
difficult for users to retrieve useful information from the massive amounts of content, making 14
impracticable the extraction of knowledge from this data sources manually.
2.2.1.2 Web Usage Mining 16
In Web usage mining (WUM) the main objective is to find user access patterns from Web us-
age logs. Generally, all visitor’s actions are recorded as log files for various proposes including 18
user behaviour analysis, the comparison between expected and actual website usage, the website
performance and adjustment of the website with respect to the users’ interests [PCP11]. 20
As referred by Patel et al. [PCP11], there are mainly two data sources used for Web usage
mining. Web Server Data consists of the data contained in the Web server logs, the result of the 22
10

Literature Review
user interaction with the website. This log files may contain useful information characterising the
users’ behaviour on the website. These log files normally contain data like IP addresses, page2
references, and access time of the user. The other data source is Application Level Data which
consists of records of various kinds of events in an application, such as mouse clicks.4
2.2.1.3 Web Structure Mining
Web structure mining (WSM) is the technique of analysing the structure of the hyperlinks within6
the Web itself. This technique takes advantage of analysing the website pages as a directed labelled
graph whose nodes are the documents or pages and the edges are the hyperlinks between them8
[Für02]. This hyperlinks can be in-links, out-links, and co-citation (two pages that are both linked
to by the same page).10
Page C
Page B
Page A
Figure 2.4: Web Graph example of a website with 3 pages (nodes) and 4 links (edges).
This directed graph structure on the Web is called as Web Graph. A graph, as defined by David
et al. [DJ10], is a way of specifying relationships between a collection of items, where exists a set12
of items called nodes with certain pairs of this objects connected by links called edges. A graph G
consists of two sets V and E, where the set V is a finite, non-empty set of vertices, that in this case14
are the Web pages, and the set E is a set of pairs of vertices being these pairs called edges, that
here are the hyperlinks between pages. The notation V(G) and E(G) represent the sets of vertices16
and edges, respectively of graph G. The Web is considered a directed graph which consists of a
set of nodes, as defined before, together with a set of directed edges, where each directed edge is18
a link from one node to another, with the direction being important, like the example present in
Figure 2.4 [Rav10].20
Although Web structure mining is a relatively new research field, link analysis is an old re-
search area [SA13]. The constantly growing interest in Web mining has resulted from the growth22
of research in structure analysis. The efforts in structure analysis research culminated into the
creation of a new area called Link Mining [Get03]. Link Mining results of the intersection of the24
work in link analysis, Web content mining, relational learning, and inductive logic programming,
as well as graph mining [CG05].26
As suggested by Costa et al. [CG05], there are some tasks of link mining which are applicable
to the WSM, and to Web mining in general, as follows:28
11

Literature Review
• Link-based Classification: focus on the prediction of the category of a Web page, based
on words that occur on the page, links between pages, anchor text, HTML tags and other 2
possible attributes found on the Web page;
• Link-based Cluster Analysis: consists in finding naturally occurring sub-classes. The data 4
is segmented into groups, where similar objects are grouped together, and dissimilar ob-
jects are grouped into different groups. Different than the previous task, link-based cluster 6
analysis is unsupervised and can be used to discover hidden patterns from data;
• Link Type: prediction of the reason of link existence, such as the type of link between two 8
entities or the purpose of a link;
• Link Strength: technique of associating links with weights; 10
• Link Cardinality: used to predict the number of links between objects.
Some of the most known algorithms in Web structure mining area are the PageRank and HITS 12
algorithm. PageRank [PBMW99], used by Google, calculates the importance of Web pages rely-
ing on the linked structure of the Web, giving weights to the Web pages according to the number 14
of inbound and outbound links presented on each page. In HITS concept [Kle99], are identified
two kinds of pages from the Web structure: authorities (pages with good sources of content) and 16
hubs (pages with good sources of links). For a given query, HITS will find authorities and hubs.
2.2.2 Data Collection and Preprocessing 18
The main goal in data collection stage is to gather resources, retrieving data from the website’s
pages and Web usage records (e.g. logs). 20
In one hand, Web pages contain information like text and multimedia that are essential for
Web content mining, as is referred in section 2.2.1.1. On the other hand, the hyperlinks presents 22
in this pages are essential for Web structure mining as mentioned in section 2.2.1.3.
Web log files are another information source which can be from mainly two sources: Applica- 24
tion Level, which can include data retrieved on the server side, the client side and the proxy side,
and Web Server Level. These logs record the users’ behaviour very clearly, being essential for 26
Web usage mining, as stated in 2.2.1.2.
2.2.2.1 Web Server Logs 28
1 192.168.1.133 - - [26/Jan/2016:15:42:49 -0700] "GET /informatica/ HTTP/1.1" 200 30
1895 "-" "Mozilla/5.0 (Windows NT 10.0; Win64; x64; rv:43.0) Firefox/43.0"
2 192.168.1.110 - - [26/Jan/2016:15:42:50 +0000] "GET /escritorio/ HTTP/1.1" 200 843 32
"-" "Mozilla/5.0 (Windows NT 6.3; WOW64) Chrome/47.0.2526.111 Safari/537.36"
3 192.168.1.133 - - [26/Jan/2016:15:43:00 -0700] "GET /informatica/" 200 1895 "-" " 34
Mozilla/5.0 (Windows NT 10.0; Win64; x64; rv:43.0) Gecko/20100101 Firefox/43.0"
12
Literature Review
4 192.168.1.110 - - [26/Jan/2016:15:43:05 +0000] "GET /escritorio/Papelaria/" 200 843
"-" "Mozilla/5.0 (Windows NT 6.3; WOW64) Chrome/47.0.2526.111 Safari/537.36"2
5 192.168.1.187 - - [26/Jan/2016:15:43:11 -0700] "GET /desporto/Garmin-225 HTTP/1.1"
200 6936 "-" "Mozilla/5.0 (Windows NT 10.0; WOW64) Chrome/47.0 Safari/537.36"4
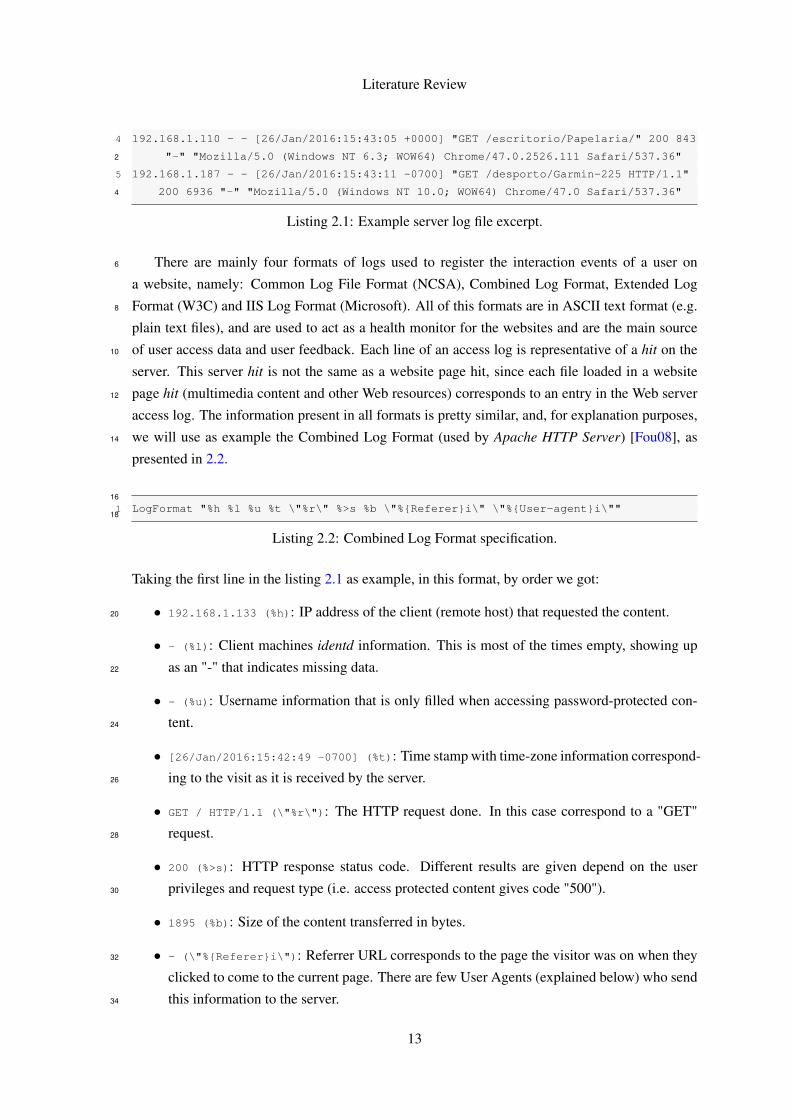
Listing 2.1: Example server log file excerpt.
There are mainly four formats of logs used to register the interaction events of a user on6
a website, namely: Common Log File Format (NCSA), Combined Log Format, Extended Log
Format (W3C) and IIS Log Format (Microsoft). All of this formats are in ASCII text format (e.g.8
plain text files), and are used to act as a health monitor for the websites and are the main source
of user access data and user feedback. Each line of an access log is representative of a hit on the10
server. This server hit is not the same as a website page hit, since each file loaded in a website
page hit (multimedia content and other Web resources) corresponds to an entry in the Web server12
access log. The information present in all formats is pretty similar, and, for explanation purposes,
we will use as example the Combined Log Format (used by Apache HTTP Server) [Fou08], as14
presented in 2.2.
16
1 LogFormat "%h %l %u %t \"%r\" %>s %b \"%{Referer}i\" \"%{User-agent}i\""18
Listing 2.2: Combined Log Format specification.
Taking the first line in the listing 2.1 as example, in this format, by order we got:
• 192.168.1.133 (%h): IP address of the client (remote host) that requested the content.20
• - (%l): Client machines identd information. This is most of the times empty, showing up
as an "-" that indicates missing data.22
• - (%u): Username information that is only filled when accessing password-protected con-
tent.24
• [26/Jan/2016:15:42:49 -0700] (%t): Time stamp with time-zone information correspond-
ing to the visit as it is received by the server.26
• GET / HTTP/1.1 (\"%r\"): The HTTP request done. In this case correspond to a "GET"
request.28
• 200 (%>s): HTTP response status code. Different results are given depend on the user
privileges and request type (i.e. access protected content gives code "500").30
• 1895 (%b): Size of the content transferred in bytes.
• - (\"%{Referer}i\"): Referrer URL corresponds to the page the visitor was on when they32
clicked to come to the current page. There are few User Agents (explained below) who send
this information to the server.34
13

Literature Review
• Mozilla/5.0 (Windows NT 10.0; Win64; x64; rv:43.0)Firefox/43.0 ( \"%{User-agent
}i\"): The User Agent is the representation of whatever software (normally browser) was 2
used to access the content.
Data collected from server logs generally features incomplete, redundant and ambiguous data. 4
For a more efficient process, it is essential to filter this noisy data using preprocessing techniques,
resulting more accurate and concise data. Data preprocessing consists on data cleaning, unique 6
user identification, user session identification, access path supplement and transaction identifica-
tion [MC10]. 8
According to Mobasher et al. [MCS00] and Li Mei et al. [MC10] data cleaning task is usually
site-specific and involves tasks such as merging logs from multiple servers and parsing of the 10
logs. This process consists also on remove Web log redundant and inconsistent data which is not
associated with the useful data, reducing the scope of data objects. After the data cleaning, there is 12
essential to do user identification in order to identify the unique users. This can be obtained using
cookie technology, user identification techniques or heuristic rules. 14
User session identification consists of dividing each user’s access information into separate
sessions. This can be archived using time-out estimation approach which means that when the 16
time interval between the page requests exceeds a specified value that user has started a new
session [MCS00, CD10]. 18
Due to the widespread use of the page caching technology, the users’ access path can some-
times be incomplete. To compensate this, path completion technique is used to add the missing 20
requests to the user session information. This technique can resort to the website topology in order
to complete the missing paths [MC10, CD10]. 22
In the context of classifying the user sessions according to their characteristics, the work by
Suchacka et al. [SC13], defines three main characteristics within three levels (short, medium and 24
long), namely:
• session length: number of page requested in the given session; 26
• session duration: the time elapsed from the first page request and the last one;
• mean time per page: the average time that user spends browsing each page in the given 28
session.
The transaction identification is based on the user’s session recognition, and its purpose is to 30
split or combine transactions depending on the demand of data mining tasks in order to make it
appropriate for the specific data mining analysis that we want to archive [MC10]. 32
2.2.2.2 Application Layer Tracking
Additionally to the Web server access logs, there exists information retrieved at the application 34
level, sometimes through logs too, but with the objective to record more information about the
user interaction with the website. This is accomplished generally resorting to tracking domain- 36
specific events throughout the user’s visit to the website, using built-in tracking scripts on the Web
14

Literature Review
pages (page-tagging) and, sometimes, resorting also to the use of HTTP cookies. One of the most
used tools for this kind of data retrieval is Google Analytics4 [Cut10], but there are others like2
Piwik5, Yahoo! Web Analytics6 and Clicky7.
Web Server
Google Analytics server
UserLog File
Processing Engine
Visitor s browser
ga.js
Cookies Google Analytics
Dashboard
Database
Figure 2.5: Google Analytics functional scheme [Cut10].
Using as example the Google Analytics process [Cut10], as shown in Figure 2.5, starts by4
the placing of a JavaScript snippet (page tag) in the Web pages that we want to track (Google
Analytics Tracking Code - ga.js). The data collection starts when the user requests a page from a6
certain Web server, and the browser processes the response data. In this phase, the browser may
contact also other servers that may contain parts of the requested page, like multimedia resources8
and scripts (as is the case of ga.js).
Once GATC is loaded it starts identifies attributes of the visitor and her browsing environment,10
such as how many times that user as visited the website, where he came from, his operating system,
his Web browser, among other information. After collecting this base data, the GATC sets or12
updates a number of first-party cookies where it stores information about the user. After this steps
the data collected is sent to Google with the information that a visitor has viewed a certain page on14
the website and additional data like events, pageview duration, and others that can be selected in
Google Analytics configurations dashboard, including specific add-ons for e-commerce websites.16
When Google Analytics server receives the data it stores the data in, for example, a logfile. Each
line in this file contains numerous attributes of the information sent to Google, including:18
• When the data was collected (date and time);
• Where the visitor came from (i.e. referring website or search engine);20
• How many times the visitor has been to the site (number of visits);4http://analytics.google.com/5http://piwik.org/6http://Web.analytics.yahoo.com/7http://clicky.com/
15

Literature Review
• Where the visitor is located (geographic location);
• Who the visitor is (IP address). 2
After storing the information in logfiles, the data collection process is complete. Now the
process continues on the Google Analytics processing engine which parses and interpreters the 4
logfile. During processing, each line in the logfile is split into pieces, one piece for each attribute
of the entry in the file. Google Analytics turns each piece of data into a data element called a 6
field. Later on, the fields are transformed into dimensions. For example, the IP address becomes
the Visitor IP field and the city that the visitor is visiting from becomes the Visitor City field 8
and the City dimension. This transformation is needed since Google Analytics will use fields to
manipulate the data and dimensions to build the reports using pattern discovery techniques, as 10
presented in 2.2.4. After this processes the data is saved in a database and if a user requests a
report, the appropriate data is retrieved from the database and sent to the browser. 12
2.2.2.3 Web Crawlers
When collecting data from a given website pages and structure, the most common approach is the 14
use of Web crawlers. A Web crawler is a program that, given one or more base URLs, downloads
the Web pages associated with these URLs, extracts any hyperlinks contained in them that have 16
not been found before, and recursively continues to download the Web pages identified by these
hyperlinks [Naj09]. 18
In practice, retrieving the content of a single Web page is an easy and fast process. Here is a
simple crawler that uses the command-line tool wget: 20
1 wget -r --html-extension --convert-links --mirror --progress=bar --no-verbose --no- 22
parent --tries=5 -level=5 $http://example.com/24
Start
Initialize frontier with seed URLs
Check for termination
Pick URL from frontier
Fetch pageParse Page and
Information Storage
Add URLs to frontier
[done]
[no URL]
Crawling Loop
End
Figure 2.6: Flow of a basic sequential Web crawler [PSM04].
The basic concepts of a sequential Web crawler are shown in Figure 2.6 [PSM04]. The crawler
maintains a list of unvisited URLs known as the frontier. This list is initialized with seed URLs 26
16

Literature Review
(one or more). In each crawling loop the program chooses the next page to crawl from the frontier
list, fetch the corresponding content and parses it, in order to retrieve URLs and store all the2
information/content needed. Finally, the new and unvisited URLs are added to the frontier. The
process can finish when a certain number of pages has been crawled or when the frontier is empty.4
As suggested in section 2.2.1.3, the Web can be seen as a large graph with pages as its nodes
and hyperlinks as its edges. Because of this, Web crawling can be considered as a graph search6
problem.
One of the most important components of the crawler is the frontier, the to-do list of a crawler,8
that contains the URLs of unvisited pages. In graph search terminology, the frontier is an open list
of unexpanded (unvisited) nodes. The frontier can be implemented as a FIFO queue, resulting in a10
breadth-first crawler, that can be used to blindly crawl the Web. In this case, the next URL comes
from the head of the queue and new URLs found is added to the queue tail. The main problem12
with this approach is that we need to resort to linear search in order to find out if a newly extracted
URL is already on the frontier, and, in certain cases, this can be a costly operation. On alternative14
approach to the frontier is the use of an hash-table [PSM04].
Other alternative consists on implementing the frontier as a priority queue, resulting in a pref-16
erential crawler, also known as a best-first crawler. The priority queue may be a dynamic array
that is always kept sorted by the estimated score of unvisited URLs. At each step, the best URL is18
picked from the head of the queue. Every time a page is fetched, the URLs are extracted from it
and scored based on some heuristic. Sometimes, a crawler may encounter a spider trap that leads20
it to a large number of different URLs that refer to the same page. One way to reduce the impact of
this problem is to limit the number of pages that the crawler accesses from a given page [PSM04].22
After choosing the best approach to dealing with the frontier, we need to fetch the HTML
page corresponding to each URL, using an HTTP client, sending an HTTP request for a page and24
reading the response. After the page being fetched, we need to parse its content to extract informa-
tion that will be used to fill the frontier. Parsing may imply simple URL extraction, following the26
W3C standard for declaring links in web documents [Con], or more complex processes, tidying
up the HTML content in order to analyse the HTML tag tree. Parsing might also involve steps to28
convert the extracted URL to a canonical form, remove stop-words from the page’s content and
stem the remaining words. The process of identifying HTML tags for declaring links in a given30
HTML document, including the associated attribute-value pairs, is known as URL extraction and
canonicalization [PSM04].32
The most important component on URL extraction and canonicalization as well as in other
types of information extraction from HTML pages is the of the parser to be able of dealing with34
messy markup and be resilient to errors. It is important to consider besides the normal than ASCII
text, it is also common to run across Unicode URLs and content. Additionally, it is common to36
find spider traps that look like the dynamic content but are actually an infinite generation of links
[Liu11].38
After retrieving the HTML content, we are now able to navigate through the page and the
DOM tree to find specific parts of the page that are important or relevant, and converting then that40
17
Literature Review
information into a structured form, like JSON or another formal data schema, enabling us then to
storage it in some kind database [Mat12]. 2
Due to the growth of the World Wide Web, websites have now a tremendous amount of pages,
being this situation even more common in e-commerce websites due to the large catalogue of 4
categories and products. So, it becomes a hard task to crawl this sites in a reasonable time-
frame [Yua09]. In response to this problem, some alternatives as been presented, as the one from 6
Yuan [Yua09], that proposes a multi-threading web crawler for e-commerce websites. Another
approach, as proposed by Micarelli et al. [MG07], that consists of developing a focused crawler 8
that only retrieve documents that fit into a certain topic of interest, reducing the computational and
network requirements. 10
2.2.3 Web Data Extraction
The data present in the website’s page content is mostly semi-structured and/or unstructured data. 12
This results in the need of making this Web pages the more human readable and user-friendly
possible, and not so machine understandable. In order to understand and retrieve the useful infor- 14
mation from this pages and transform it into structured data formats, it is needed the use of certain
automatic techniques to extract, interpret and present the data, being this process called web data 16
extraction [PE11].
A Web page content is normally embedded in HTML and formatted using CSS. The purpose 18
of HTML is to structure the content, but this structure is totally dependent on the website’s author,
so there is no standard structural design for e-commerce websites or any other website, being the 20
structure irregular for each website and, sometimes, between website’s pages [KFT14]. Also, as
today, websites do not only contain static HTML, but also dynamic content that appears differently 22
to different users and interactive elements like forms, making the extraction process even more
complex [PE11]. 24
The web data extraction process is accomplished by the use of wrappers. While every web-
site uses its own way of build and display content to the user, the structure is relatively similar 26
on all pages of a kind on a website [Liu11, PE11]. For example, every product page on a given
e-commerce website has a certain degree of similarity between them. For this reason, a wrap- 28
per designed for a page should work on all pages of that kind. Liu [Liu11] lists three different
approaches to generating wrappers, namely: 30
• Manual approach;
• Wrapper induction; 32
• Automatic extraction.
2.2.3.1 Manual Approach 34
The manual approach consists of observing a page and the respective source code, with a human
trying to find some patterns in similar pages and writing then a program to extract the target 36
18

Literature Review
data from those pages. This process has become simpler due to the appearing of several pattern
specification languages, allowing the programmer to more easily define the fields to extract data2
from [Liu11].
The most common approach when manually extraction information from pages is using se-4
lectors [KFT14, PE11]. A selector is an expression which is able to describe a single or a list of
items on a document, in this case, HTML documents. There are mainly tree types of selectors6
used when wrapping web content [PE11], namely:
• XPath expressions: Extract a data value using an XPath expression. XPath expressions8
are used in lots of existent wrapper systems, but due to the increase of complexity of the
websites it has become less useful than before [KFT14].10
• CSS selectors: This enable the extraction of data values from HTML documents navigating
through the page’s DOM tree. This is much less complicated of write than XPath expres-12
sions, but they are nearly as expressive [KFT14].
• Regular Expressions: Regular expression enables us to extract data from strings, doing14
string matching. This is useful when the information that we want to extract is mixed with
other text, or, when we can’t build the DOM tree from the HTML, which can happen, for16
example when the HTML code does not follow any standard [KFT14, PE11]
Taking use of the selectors, we are capable of specifying the locations of the specific data18
that we want to extract on4 a given type of page, and transform the data into structured an easily
accessible data.20
2.2.3.2 Wrapper Induction
Wrapper induction is a supervised learning approach to extract information from web pages, being22
a semi-automatic approach. The human is responsible for creating a template, often by browsing
a website and recording his actions, and proceed to the labelling of data records. After the manual24
process of labelling some data records, using this set of labelled training examples, the wrapper
generation tool generalises the rules and applies them to similarly formatted pages. This can still26
be a very time-consuming task, especially if there is a lot of differently structured pages in the
website [Liu11]. Another common problem is that, since the web is dynamic, the content and28
structure of the pages of a given website can change and it is needed to adapt and re-train the
wrapper [PE11].30
In this category of wrappers, the first phase consists of extract data from a page, building a tree
representation of the same. A sample of the type tree for a product page is given on Figure 2.7. A32
page can be seen as a sequence of tokens S(e.g. words, numbers and HTML tags). The extraction
is archived using a tree structure called embedded catalogue tree (EC tree), as shown in Figure34
2.8, which models the data embedded in an HTML page. The tree root is the document containing
the whole token sequence S of the page, and the content of each child node is a subsequence of its36
19

Literature Review
Tuple: Product
String: Name Tuple: Details
String: Model Double: PriceString:
Description
Figure 2.7: Sample type tree of a generic prod-uct page [Liu11].
Page
Name Details
Model Price Description
Figure 2.8: Sample EC tree of a generic prod-uct HTML page [Liu11].
parent node. For extracting the data, the wrapper uses the EC description and a set of extraction
rules [Liu11]. 2
The second phase consists on to develop the wrapper learning algorithm, responsible for gen-
erating extraction rules. To generate the start rule for a node in the EC tree, some prefix tokens 4
of the node are identified, as the landmarks, that can uniquely identify the beginning of a node.
To generate the end rule for a node, some suffix tokens of the node are identified, as the ending 6
landmarks. To extract useful information from the data records into structured data formats, data
extraction rules are applied to each record [Liu11]. 8
2.2.3.3 Automatic Extraction
Automatic extraction is an unsupervised approach for information extraction from web pages con- 10
tent. Using as input one or more pages, it automatically finds patterns or grammars in it, using
them for extracting data. Since it is human-independent, it can easily scale up to a huge number 12
of pages formats and even different websites [Liu11, PE11]. Automatic extraction is possible be-
cause data records on a website are usually encoded using a very small number of fixed templates, 14
making possible find these templates by mining repeated patterns in multiple data records [Liu11].
One approach to accomplish automatic extraction is through string matching and tree match- 16
ing, that tries to find the encoding template from a set of encoded instances of the same type
[Liu11, ZL05]. In the case of HTML documents, the common way to accomplish this is by de- 18
tecting repeated patterns from the HTML encoding strings, string matching. Tree matching is also
useful since HTML encoding strings also form nested structures due to their nested HTML tags, 20
being this nested structures called DOM trees [Liu11].
2.2.4 Pattern Discovery and Analysis 22
Pattern discovery consists on retrieving effective, novel, potentially, useful and ultimately under-
standable information and knowledge using mining algorithms. The methods for pattern discovery 24
include, among other techniques, exploratory data analysis, classification analysis, association rule
discovery, sequential pattern discovery and cluster analysis. 26
20
Literature Review
The pattern analysis complements the pattern discovery process by focusing on the filter and
choose the most useful and interesting patterns found during the pattern discovery, in order to2
select the most valuable models for the business [MC10].
2.2.4.1 Exploratory Data Analysis4
Exploratory data analysis (EDA) is an approach to analysing data sets with the goal of learning
about its main characteristics, general patterns, and tendencies. EDA generally resorts to methods6
like graphical displays and suitable summaries to get a grasp on the most relevant content of the
data [GHP07]. This allows a deeper overview of the data, retrieve relationships between variables8
and reveal interesting subsets of the data sets.
In order to apply EDA methods, the data is aggregated in measurable variables such as days,10
sessions, visitors or country of origin. The insights on the data, like most visited pages by day,
average view time of a page, the average length of a path through a site, most frequently accessed12
pages, common entry and exit page, can be extracted with the application of typical statistics
methods over the data. Although this analysis can be superficial and let some important knowledge14
undiscovered, the information retrieved can be used for guidance on future work over the data,
improving the efficiency and, possibly, improving the results of the data mining.16
As stated by Gentleman et al. [GHP07], there are essential four themes for EDA, namely
Revelation, Resistance, Residuals and Reexpression. Revelation bases itself on the use of the18
suitable graphical display in order to look for patterns present in the data. Resistance methods
are applied in order to mitigate the problem of extreme observations that can deviate from general20
patterns, making results more insensible to this observations. When fitting data in simple models
such as a line, sometimes the useful knowledge is not fitted in this line but are the residuals that22
show up as deviations from the line drawn. This residuals we often learn about data patterns that
are difficult to see by the initial data displays. Additionally, like mentioned before, sometimes24
there is a need to change the scale of the data or reexpress since the choose measure scale can hide
some of the data patterns.26
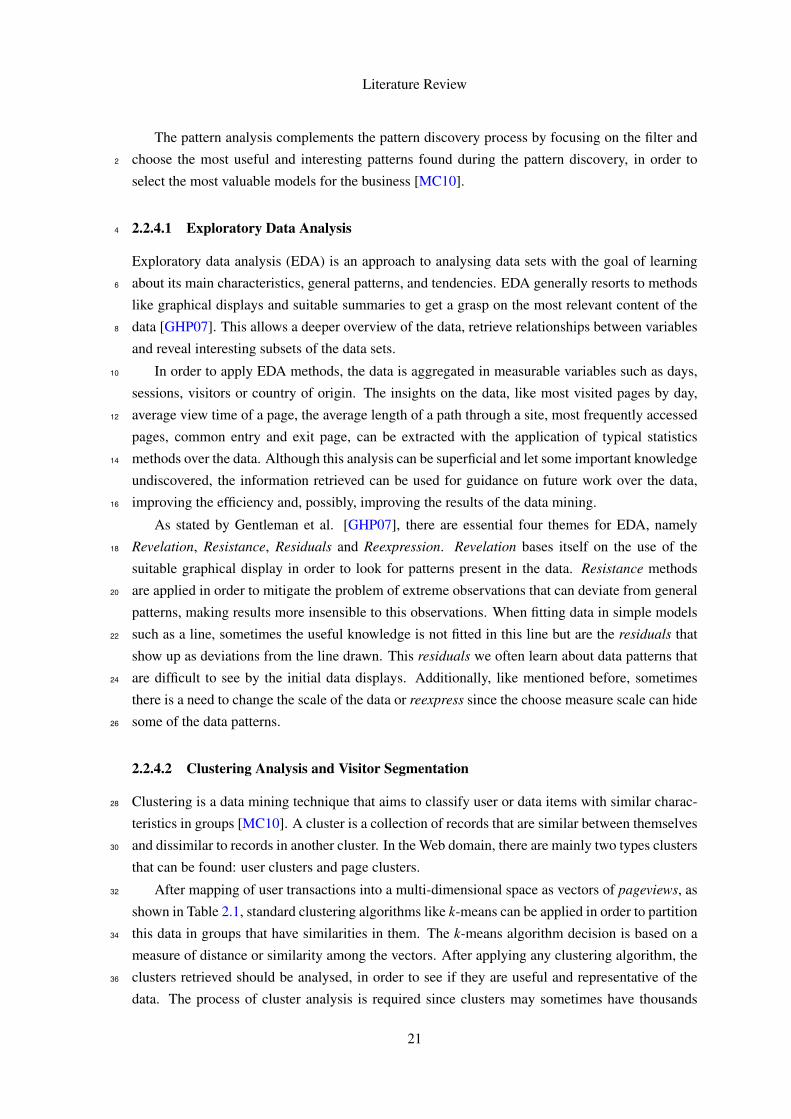
2.2.4.2 Clustering Analysis and Visitor Segmentation
Clustering is a data mining technique that aims to classify user or data items with similar charac-28
teristics in groups [MC10]. A cluster is a collection of records that are similar between themselves
and dissimilar to records in another cluster. In the Web domain, there are mainly two types clusters30
that can be found: user clusters and page clusters.
After mapping of user transactions into a multi-dimensional space as vectors of pageviews, as32
shown in Table 2.1, standard clustering algorithms like k-means can be applied in order to partition
this data in groups that have similarities in them. The k-means algorithm decision is based on a34
measure of distance or similarity among the vectors. After applying any clustering algorithm, the
clusters retrieved should be analysed, in order to see if they are useful and representative of the36
data. The process of cluster analysis is required since clusters may sometimes have thousands
21
Literature Review
Table 2.1: Example of a pageview transaction matrix.
Users /Pages A B C D E Fuser0 27 62 39 0 0 95user1 0 6 60 145 84 0user2 200 0 0 0 0 42user3 3 29 98 14 60 55user4 87 0 32 0 81 62user5 0 2 0 0 62 0user6 27 58 82 24 74 54user7 0 0 0 92 0 75user8 88 20 61 69 45 84user9 48 40 98 47 0 24
of data points and, because of that, is not able to provide an aggregated view of common user
patterns. 2
One straightforward approach to creating an aggregate view of each cluster is to compute the
centroid (or the mean vector) for each cluster. Using the centroid its possible to calculate the 4
distance of each point to its centroid, picking the ones that are most significant in a given cluster,
generally, the ones that are closer to the centroid point. The resulting set of vectors can be viewed 6
as an aggregate user profile, accurately representing the interests or behaviour of a group of users
[Liu11]. 8
One of the most common and used alternatives to k-means algorithm is the DBSCAN (Density-
based Spatial Clustering of Applications with Noise) approach. In this approach, given a set of 10
points in some space, groups points with many nearby neighbours, marking as outliers points that
lie alone in low-density regions (whose nearest neighbours are too far away) [EKSX96]. One of 12
the main advantages compared to the k-means is that DBSCAN does not require one to specify
the number of clusters in the data a priori. 14
When clustering techniques are applied to Web content data, the result may be collections of
pages or products related to the same topic or category. By another side, when cluster algorithms 16
are applied to Web usage data, items that are commonly accessed or purchased together can be
automatically organized into groups [MCS00]. A variety of stochastic methods have been pro- 18
posed for clustering of user transactions, and more generally for user profiling. Research done on
this methods shows that mixture models are capable of capture more complex and dynamic user 20
behaviour, the result of the interaction with large and very dynamic websites. This data can be
too complex to be modelled using basic probability distributions such as a normal distribution. 22
Essentially, each user can have different types of behaviour corresponding to different tasks, and
each behaviour can be modelled by a different distribution [Liu11]. 24
Mixture models, such as the mixture of Markov models, assume that there exists k types of
user behaviour (or k user clusters) in the data, and each user session is assumed to be generated 26
by a generative process that models the probability distribution of the observed variables as well
22

Literature Review
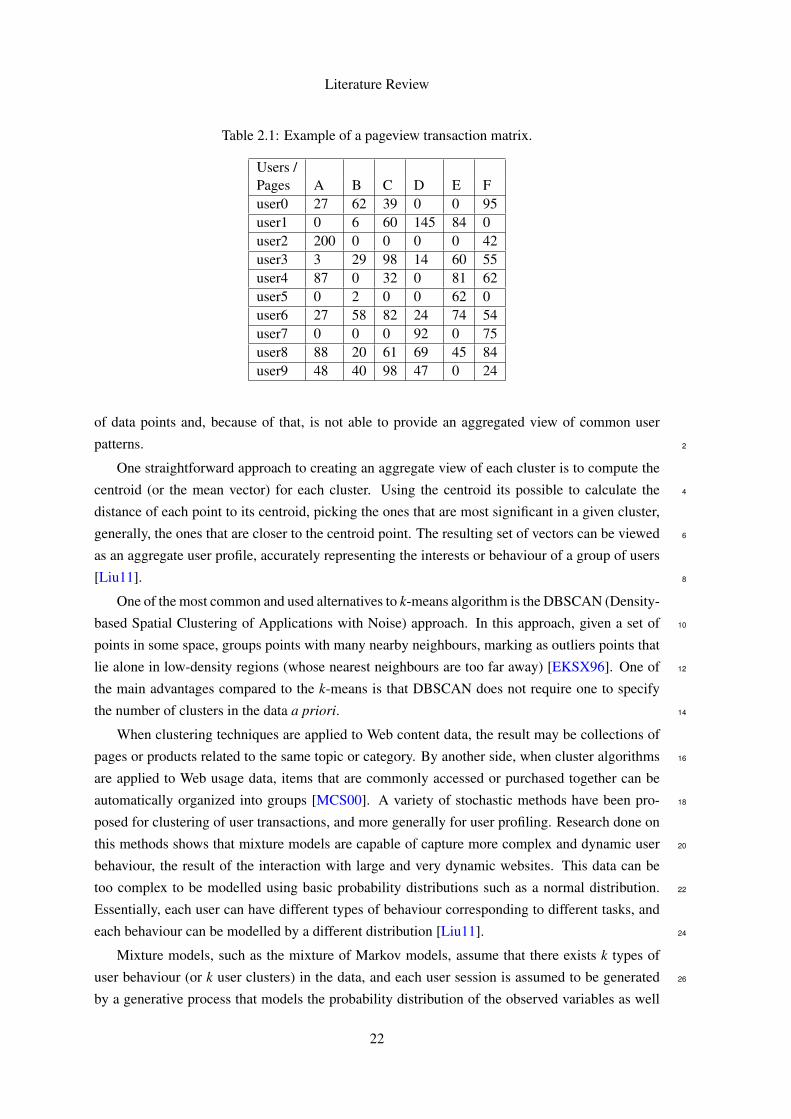
as the hidden variables. Initially, a user cluster is chosen with some probability. Then, the user
session is generated from a Markov model with parameters specific to that user cluster. A Markov2
model is a stochastic model used on modelling randomly changing systems, where it is assumed
that future states depend only on the actual state and not on the sequence of events that preceded4
it. After this, it is used the Expectation–Maximization8 algorithm, to learn the proportion of users
assigned to each cluster as well as the parameters of each Markov model [CHM+00]. The resultant6
user models are very flexible. For example, a mixture of first-order Markov models is capable
of probabilistically cluster user sessions, based on similarities in navigation behaviour and, also,8
characterise each type of user behaviour, thus capturing popular navigation paths or characteristics
of each user cluster.10
2.2.4.3 Association and Correlation Analysis
Association rule discovery and statistical correlation analysis are useful for finding groups of items12
that are purchased together or set of pages that are commonly accessed. This enables websites
to provide effective cross-sale product recommendations or, even, improve the organization of14
content disposition and structure of the website, towards the reflection of typical user actions.
Statistical correlation is a technique which tells us if two variables are related. Each two16
random variables, or two datasets, related between themselves are considered statistical dependent.
Statistical correlation analysis consists of the analysis of any broad class of statistical relationships18
involving dependence. Formally, dependence refers to any situation in which two random variables
are not probabilistic independent. There are several correlation coefficients, often denoted ρ or20
r, measuring the degree of correlation. The most common of these is the Pearson correlation
coefficient, which is sensitive only to a linear relationship between two variables [Exp09].22
Table 2.2: Example of a market basket transactions.
TID Items1 {Milk,Bread}2 {Bread,Diapers,Beer,Eggs}3 {Milk,Diapers,Beer,Cola}4 {Bread,Milk,Diapers,Beer}5 {Bread,Milk,Diapers,Cola}
Association analysis is an approach for discovering interesting relationships hidden in large
data sets. The relations retrieved can be represented in association rule or frequent item sets. For24
instance, by the transactions sample shown in Table 2.2 we can retrieve the rule {Beer,Bread}⇒{Milk}, that states that there is a strong relation between customers who buys bread, milk and beer26
since many customers who buy beer and bread also buy milk [TSK05].
8The expectation–maximization (EM) algorithm is an iterative method for finding maximum likelihood or maxi-mum a posteriori (MAP) estimates of parameters in statistical models, where the model depends on unobserved latentvariables [B+98].
23

Literature Review
As stated by Mei et al. [MC10], in Web domain, the association rules discovery is princi-
pally important revealing interesting rules from the access information logs, finding the inter- 2
relationship by analysing the potential linkages between users access to Web pages.
Formally, let I = {i1, i2, ..., id} be the set of all items in the market basket data, and T = 4
{t1, t2, ..., tN} be the set of all transactions. Each transaction t is represented as a binary vector,
with t[k] = 1 if t bought the item, I[k] = 0 otherwise. Let X be a set of some items in I. We say that 6
transaction t satisfies X if for all items Ik in X, t[k] = 1.
An association rule is express in the form X→ Y[sup,con f ], where X and Y are set of items, 8
sup is the support of the itemset X∪Y, representing the probability that X and Y occur together in
a transaction, and conf is the confidence of the rule, defined by sup(X ∪Y )/sup(X), representing 10
the conditional probability that Y occurs in a transaction given that X has occurred in that same
transaction. Another parameter of interest is the lift, measures the performance of an association 12
rule at predicting or classifying cases as having an enhanced response, measured against a random
choice targeting model. Lift is a value that indicate us information about the increase in probability 14
of the consequent (Y) given the antecedent (X).
One of the most common approaches for association discovery is the a priori algorithm, which 16
consists, firstly, on identifying the frequent individual items in a dataset and, then, trying to extend
them to larger itemsets as long as the itemsets appear sufficiently often. The frequent itemsets 18
determined by the algorithm are used to determine association rules, based on their confidence
and support levels [Liu11]. 20
2.2.4.4 Classification and Prediction
Classification consists on mapping a data item into one of the sets of predefined categories. In 22
the Web domain, this consists mainly on attributing a user profile into one of the established
categories of users [MC10]. To be able to do this, it is necessary to extract and select the features 24
that best describe the proprieties for each class or category. Classification can be archived by
using a set of supervised learning algorithms, such as decision trees, Naive Bayesian, k-nearest 26
neighbour and Supported Vector Machines. Additionally, it is possible to use previous known
clusters and association rules for classification of new users [Liu11]. Normally this is used, as 28
shown previously in section 2.2.4.2 and 2.2.4.3, as base classes for the classification algorithms.
For example, a classification model can be built to classify users according to their tendency to 30
buy or not, taking into account features such as users’ demographic characteristics, as well their
typical navigational patterns. 32
One of the most important applications of classification and prediction techniques in the Web
domain is in collaborative filtering technique. This technique is an essential component of many 34
recommendation systems, as presented in 2.1.2. Most recommendation systems that use collabo-
rative filtering are based on k-Nearest-Neighbour classification algorithm, using this algorithm to 36
predict user ratings or purchase intentions, by measuring the correlations between a current (target)
user’s profile (which may be a set of item ratings or a set of items visited or purchased) and past 38
24

Literature Review
user profiles. This enables us to find users in the dataset with similar interests and characteristics
[HKTR04].2
The k-Nearest-Neighbour (kNN) classification algorithm bases itself on comparisons between
the recorded activity for a given user and the historical records T of other users, searching for4
the top k users who have similar interests. The kNN algorithm measures the similarity between
the given user active session u and each past transaction vector v (where v ∈ T ). The top k most6
similar transactions to u are considered to be the neighbourhood for the session u [Pet09]. Once
proximities are calculated, the most similar users are selected, being this information used to8
recommend items that were not already accessed or purchased by the active user u.
Decision tree induction technique consists of the generation of a decision tree, performing clas-10
sification on the given data using it. A decision tree is a tree in which each non-leaf node denotes a
test on an attribute of cases, each branch corresponds to an outcome of the test, and each leaf node12
denotes a class prediction [CKK02] and is the result of a process of categorization and generali-
sation of a given set of data. A typical data record comes in the form (x,Y ) = (x1,x2,x3, ...,xk,Y ).14
The dependent variable, Y, is the target variable that we are trying to classify. The vector x is
composed of the input variables, x1 until xn, that are used for that classification. Sometimes, the16
tree learning process can create over-complex trees that do not generalise well from the training
data, resulting in the overfitting of the tree. To avoid this problem it is common to use pruning18
techniques, capable of reducing the size of the tree by removing parts of the tree that provide a
little power to classify instances.20
Another technique for classification is Naive Bayesian. This technique bases itself on Bayes’
theorem. Naive Bayes classification can predict a class membership probabilities, such as the22
probability that a given record belongs to a particular class. Let X = x1,x2, ...,xn be a sample,
whose components represent values made on a set of n attributes. In Bayesian terms, X is consid-24
ered an evidence. Let H be some hypothesis, such as that the data X belongs to a specific class C.
For classification proposes, the objective is to find probability that sample X belongs to class C,26
given that we know the attribute description of X [Leu07].
Supported Vector Machines (SVM) is another supervised learning algorithm, useful for recog-28
nizing subtle patterns in complex datasets. This algorithm performs discriminative classification,
learning by example, to predict the classifications of previously unseen data. The approach, as de-30
scribed by Bennett et al. [BC00], is systematic, reproducible, and properly motivated by statistical
learning theory. Training involves optimisation of a convex cost function in such way that there are32
no false local minima to complicate the learning process. SVM bases itself over three fundamental
principals: margins, duality and kernels. This technique can be used for simple linear classifica-34
tions and easily extend for more complex tasks. SVM method tries to maximize the distance, or
margin, between the support planes for each class, in order to find the plane furthest from both36
sets, known as the hyperplane, as shown in Figure 2.9. To accomplish this, the support planes are
pushed apart until they bump into a small number of data points from each class, known as sup-38
port vectors, as highlighted in Figure 2.9. Duality is the mathematical programming concept which
states that the supported vectors found when maximizing the margin between parallel supporting40
25

Literature Review
Figure 2.9: Example of an SVM classification with the best plane which maximizes the margin.
planes are the same ones found when using the bisecting method to find the closest points in the
convex hull approach. Kernels method are part of SVM as they use of kernel functions, which 2
enable SVM to operate in a high-dimensional, implicit feature space without ever computing the
coordinates of the data in that space, but rather by simply computing the inner products between 4
all the pairs of data in the feature space. This operation is often computationally cheaper, being
known as kernel trick. SVM principal advantages are the modularity and being almost immune to 6
the curse of dimensionality and overfitting.
2.2.4.5 Sequential and Navigational Patterns Analysis 8
The sequential and navigational patterns analysis attempt to find inter-session patterns. It consists
of patterns such as the presence of a set of items being followed by another item in a time-ordered 10
set of sessions, giving us the causation relations between data. Other examples of temporal anal-
ysis that can be made include trend analysis, change point detection or similarity analysis. In the 12
Web context, these techniques are employed to capture the Web page trails that are often visited
by users, in the order that they were visited. 14
Sequential patterns are sequences of items that frequently occur in a sufficiently large pro-
portion of sequential transactions. Formally, a sequence 〈s1s2. . . sn〉 occurs in a transaction t = 16
〈p1, p2, ..., pm〉 (where n ≤ m) if there exist n positive integers 1 < a1 < a2 < ... < an ≤ m, and
si = pai for all i. We say that 〈cs1,cs2. . . csn〉 is a contiguous sequence in t if there is an integer 18
0≤ b≤m−n, and csi = pb+i for all i = 1 to n. Contiguous sequential patterns (CSP) are patterns
where each pair of adjacent items, si and si+1, must appear consecutively in a transaction t which 20
supports the pattern. The CSP patterns are used to capture frequent navigational paths among user
26
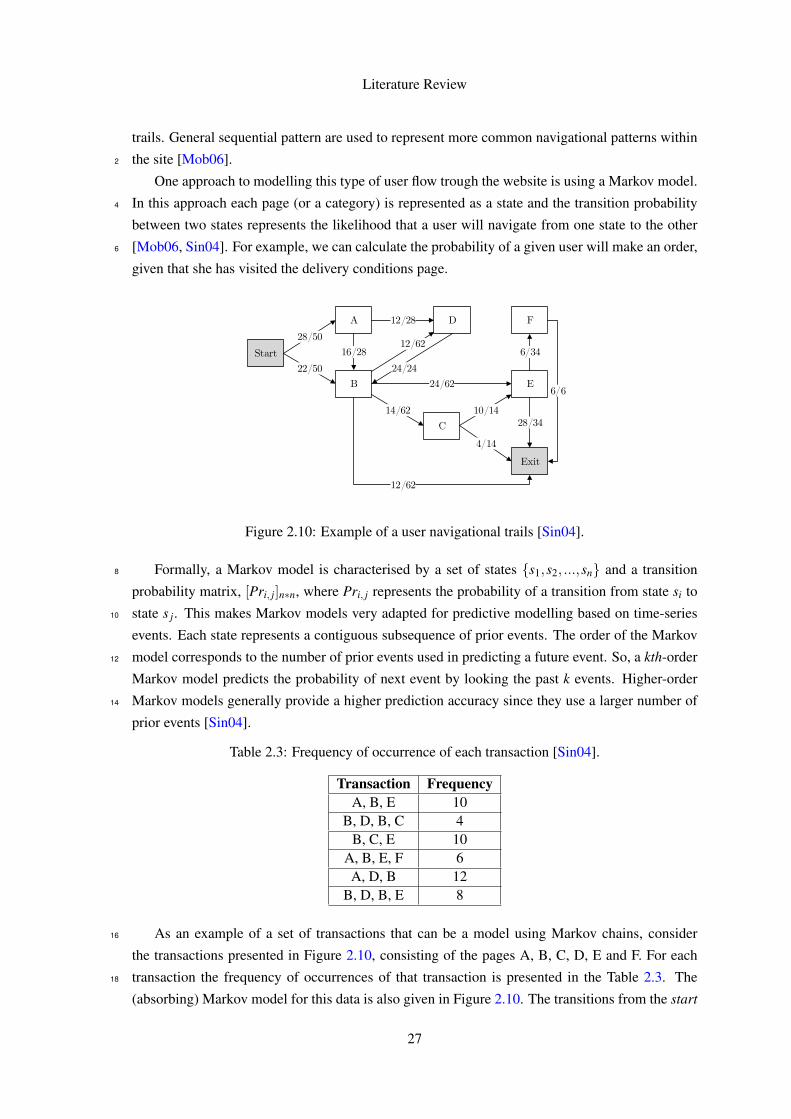
Literature Review
trails. General sequential pattern are used to represent more common navigational patterns within
the site [Mob06].2
One approach to modelling this type of user flow trough the website is using a Markov model.
In this approach each page (or a category) is represented as a state and the transition probability4
between two states represents the likelihood that a user will navigate from one state to the other
[Mob06, Sin04]. For example, we can calculate the probability of a given user will make an order,6
given that she has visited the delivery conditions page.
Start
Exit
A
B
C
D
E
F
28/50
22/50
16/28
12/28
12/62
24/24
24/62
6/34
6/6
28/3414/62
4/14
10/14
12/62
Figure 2.10: Example of a user navigational trails [Sin04].
Formally, a Markov model is characterised by a set of states {s1,s2, ...,sn} and a transition8
probability matrix, [Pri, j]n∗n, where Pri, j represents the probability of a transition from state si to
state s j. This makes Markov models very adapted for predictive modelling based on time-series10
events. Each state represents a contiguous subsequence of prior events. The order of the Markov
model corresponds to the number of prior events used in predicting a future event. So, a kth-order12
Markov model predicts the probability of next event by looking the past k events. Higher-order
Markov models generally provide a higher prediction accuracy since they use a larger number of14
prior events [Sin04].
Table 2.3: Frequency of occurrence of each transaction [Sin04].
Transaction FrequencyA, B, E 10
B, D, B, C 4B, C, E 10
A, B, E, F 6A, D, B 12
B, D, B, E 8
As an example of a set of transactions that can be a model using Markov chains, consider16
the transactions presented in Figure 2.10, consisting of the pages A, B, C, D, E and F. For each
transaction the frequency of occurrences of that transaction is presented in the Table 2.3. The18
(absorbing) Markov model for this data is also given in Figure 2.10. The transitions from the start
27
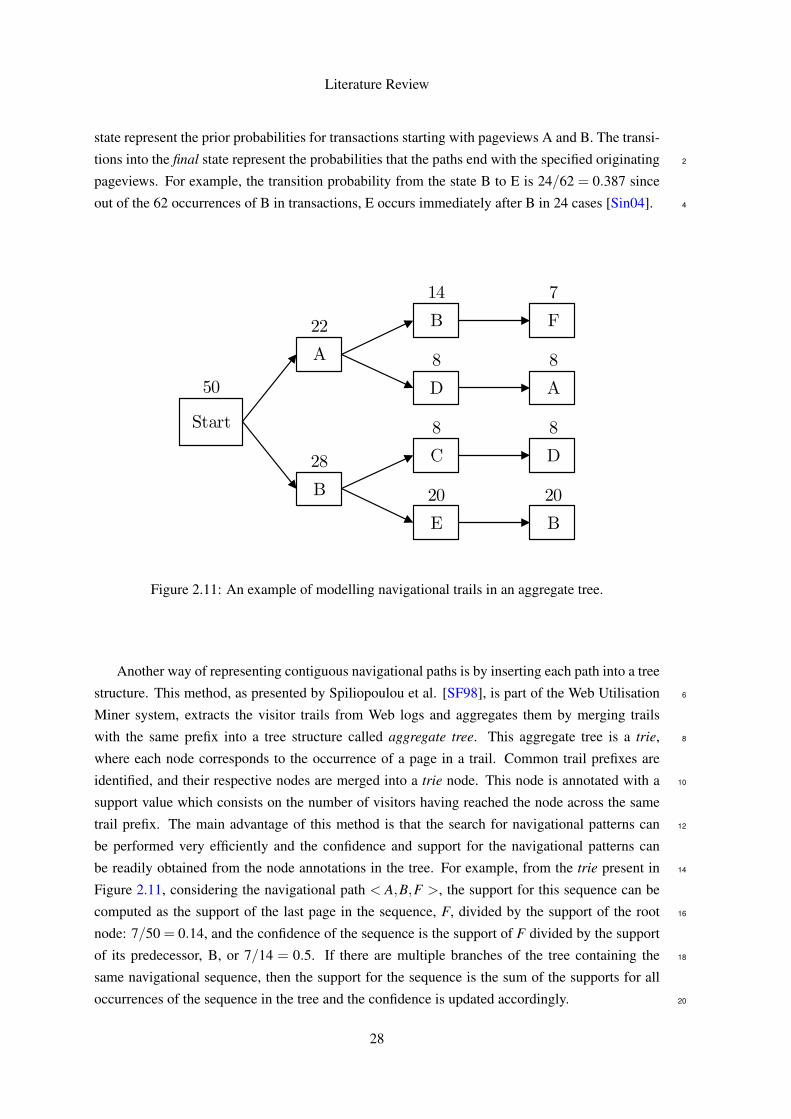
Literature Review
state represent the prior probabilities for transactions starting with pageviews A and B. The transi-
tions into the final state represent the probabilities that the paths end with the specified originating 2
pageviews. For example, the transition probability from the state B to E is 24/62 = 0.387 since
out of the 62 occurrences of B in transactions, E occurs immediately after B in 24 cases [Sin04]. 4
A
B
C
D
E
F
B
Start
B
A
D
22
28
14
8 8
7
8
20 20
8
50
Figure 2.11: An example of modelling navigational trails in an aggregate tree.
Another way of representing contiguous navigational paths is by inserting each path into a tree
structure. This method, as presented by Spiliopoulou et al. [SF98], is part of the Web Utilisation 6
Miner system, extracts the visitor trails from Web logs and aggregates them by merging trails
with the same prefix into a tree structure called aggregate tree. This aggregate tree is a trie, 8
where each node corresponds to the occurrence of a page in a trail. Common trail prefixes are
identified, and their respective nodes are merged into a trie node. This node is annotated with a 10
support value which consists on the number of visitors having reached the node across the same
trail prefix. The main advantage of this method is that the search for navigational patterns can 12
be performed very efficiently and the confidence and support for the navigational patterns can
be readily obtained from the node annotations in the tree. For example, from the trie present in 14
Figure 2.11, considering the navigational path < A,B,F >, the support for this sequence can be
computed as the support of the last page in the sequence, F, divided by the support of the root 16
node: 7/50 = 0.14, and the confidence of the sequence is the support of F divided by the support
of its predecessor, B, or 7/14 = 0.5. If there are multiple branches of the tree containing the 18
same navigational sequence, then the support for the sequence is the sum of the supports for all
occurrences of the sequence in the tree and the confidence is updated accordingly. 20
28
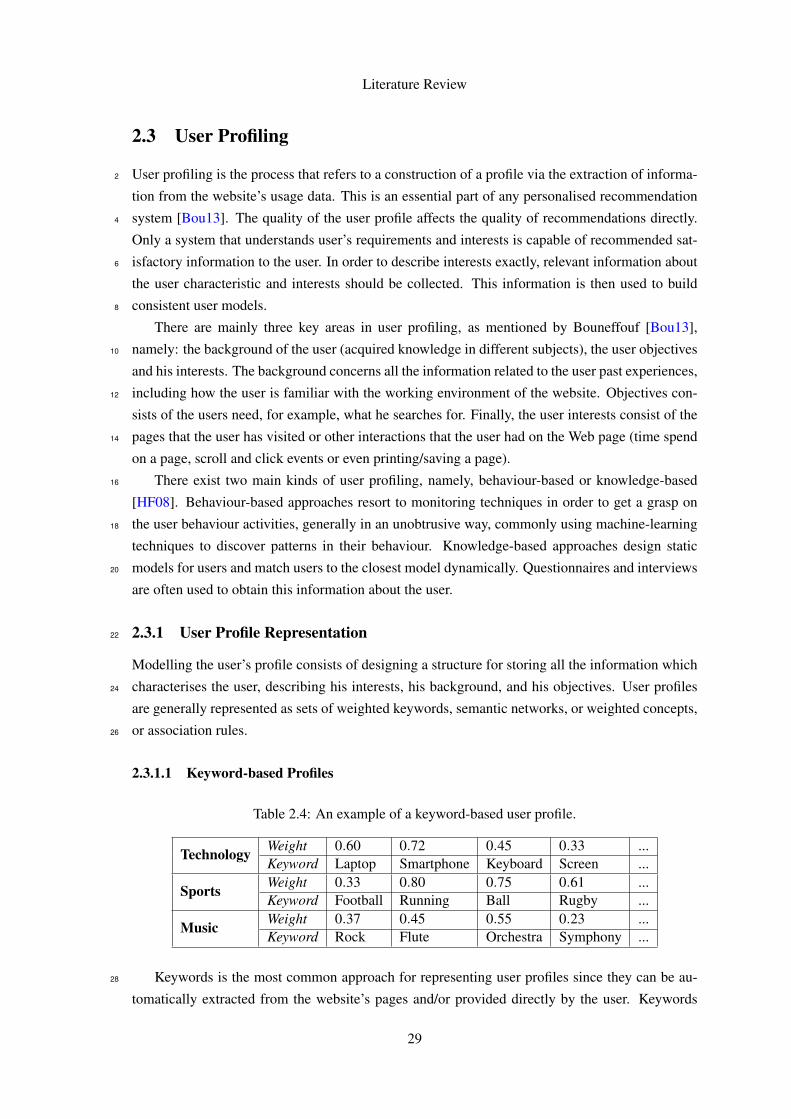
Literature Review
2.3 User Profiling
User profiling is the process that refers to a construction of a profile via the extraction of informa-2
tion from the website’s usage data. This is an essential part of any personalised recommendation
system [Bou13]. The quality of the user profile affects the quality of recommendations directly.4
Only a system that understands user’s requirements and interests is capable of recommended sat-
isfactory information to the user. In order to describe interests exactly, relevant information about6
the user characteristic and interests should be collected. This information is then used to build
consistent user models.8
There are mainly three key areas in user profiling, as mentioned by Bouneffouf [Bou13],
namely: the background of the user (acquired knowledge in different subjects), the user objectives10
and his interests. The background concerns all the information related to the user past experiences,
including how the user is familiar with the working environment of the website. Objectives con-12
sists of the users need, for example, what he searches for. Finally, the user interests consist of the
pages that the user has visited or other interactions that the user had on the Web page (time spend14
on a page, scroll and click events or even printing/saving a page).
There exist two main kinds of user profiling, namely, behaviour-based or knowledge-based16
[HF08]. Behaviour-based approaches resort to monitoring techniques in order to get a grasp on
the user behaviour activities, generally in an unobtrusive way, commonly using machine-learning18
techniques to discover patterns in their behaviour. Knowledge-based approaches design static
models for users and match users to the closest model dynamically. Questionnaires and interviews20
are often used to obtain this information about the user.
2.3.1 User Profile Representation22
Modelling the user’s profile consists of designing a structure for storing all the information which
characterises the user, describing his interests, his background, and his objectives. User profiles24
are generally represented as sets of weighted keywords, semantic networks, or weighted concepts,
or association rules.26
2.3.1.1 Keyword-based Profiles
Table 2.4: An example of a keyword-based user profile.
Technology Weight 0.60 0.72 0.45 0.33 ...Keyword Laptop Smartphone Keyboard Screen ...
Sports Weight 0.33 0.80 0.75 0.61 ...Keyword Football Running Ball Rugby ...
Music Weight 0.37 0.45 0.55 0.23 ...Keyword Rock Flute Orchestra Symphony ...
Keywords is the most common approach for representing user profiles since they can be au-28
tomatically extracted from the website’s pages and/or provided directly by the user. Keywords
29

Literature Review
have generally associated weights, that consists of numerical representations of the keyword im-
portance in the user profile. Each keyword can represent a topic of interest, and this keyword can 2
be grouped into categories in order to reflect a more standard representation of the user’s interests.
An example of a weight keyword-based user profile is given in Table 2.4. 4
One of the used techniques to give weights to keywords is the use of tf*idf weighting scheme.
In this schema, each profile is represented in the form of a keyword vector, and the retrieved Web 6
pages by the system, e.g. in response to a search, are converted to similar weighted keyword
vector. Created vectors are then compared to the profile using the cosine formula, and only the 8
corresponding pages for those vectors that are closest to the profile are then passed on to the user
[TPSA07]. 10
Besides the simplicity of implementation of keyword-based profiles, the use of several vec-
tors to represent the profile permits to take into account the different interests and their evolution 12
through time. On another side, the default version of this representation is in the lacks of struc-
ture and semantic (no connexion between terms). Additionally, one of the main drawbacks in 14
keyword-based profiles is that many words have multiple meanings (polysemy) which can con-
duct to inaccurate profiles since the keywords in the profile are ambiguous [GSCM07]. 16
2.3.1.2 Ontologies Representation
An ontology, as specified by Middleton et al. [MSDR04], is a conceptualisation of a domain into 18
a human-understandable, but the machine-readable format, representation of entities, attributes,
relationships, and axioms. Ontologies can, for example, be a rich conceptualisation of the work- 20
ing domain of an e-commerce website, representing the main concepts and relationships of the
customers activities. These relationships could represent isolated information, such as a customer 22
last purchased item, or, they could represent an activity, such as the set of visited pages on a ses-
sion. Ontologies are, in this way, used to refer to the classification structure and instances within 24
a knowledge base.
Ontology-based user-profiling approaches have been used to take advantage of the knowledge 26
contained in ontologies, instead of attempting user-profile acquisition. This representation, as
stated by Godoy et al. [GA05], allows overcoming the limitations of the connexion representation, 28
presenting the user’s profile in the form of a concepts hierarchy. Each class in the hierarchy
represents the knowledge of an area interesting to the user. The relationship (generalisation / 30
specification) between the elements of the hierarchy reflects a more realistic interest of the user.
This approach has also some problems related to the heterogeneity and diversity of the user’s 32
interests (i.e. users may have different perceptions of the same concept, which leads to inaccurate
representations). 34
2.3.1.3 Semantic Network Profiles
Semantic network profiles, as presented by Bouneffouf [Bou13], appears as a representation solu- 36
tion capable of address the polysemy problem present in some representations. In this approach,
30
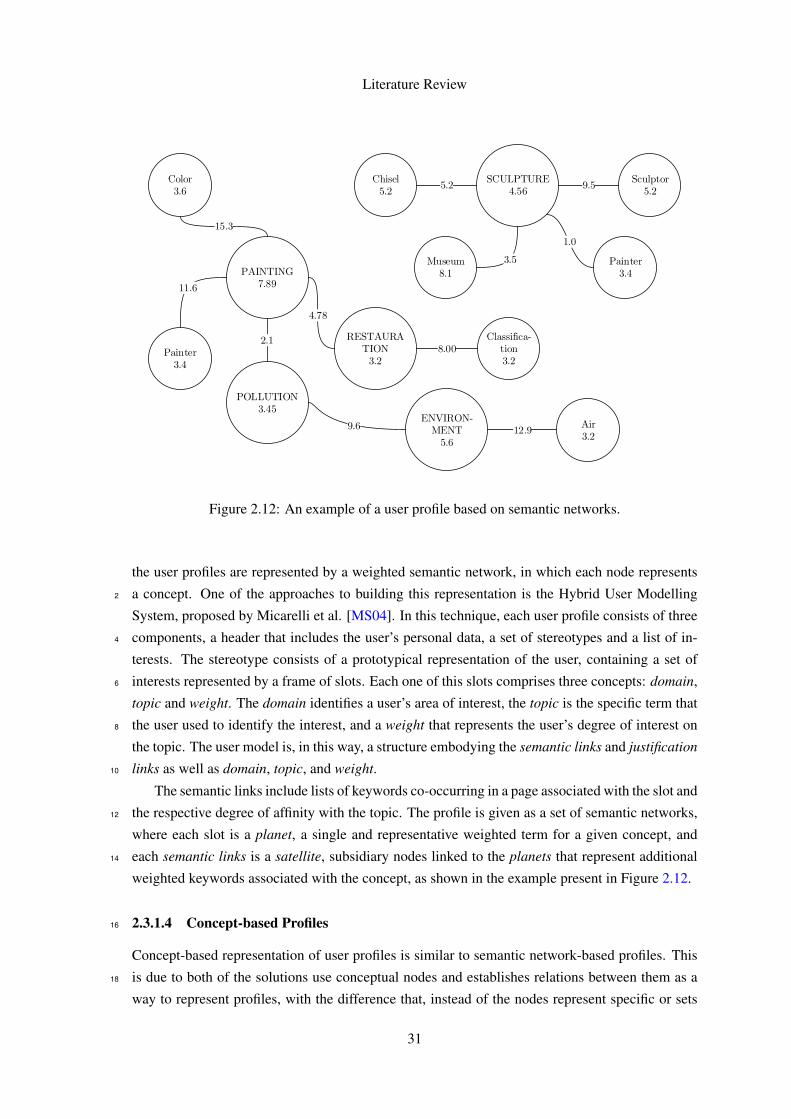
Literature Review
Painter3.4
PAINTING7.89
Color3.6
POLLUTION3.45
ENVIRON-MENT5.6
Air3.2
RESTAURATION3.2
Classifica-tion3.2
SCULPTURE4.56
Museum8.1
Painter3.4
Chisel5.2
11.6
2.1
9.6 12.9
4.78
8.00
5.2
15.3
3.5
1.0
Sculptor5.2
9.5
Figure 2.12: An example of a user profile based on semantic networks.
the user profiles are represented by a weighted semantic network, in which each node represents
a concept. One of the approaches to building this representation is the Hybrid User Modelling2
System, proposed by Micarelli et al. [MS04]. In this technique, each user profile consists of three
components, a header that includes the user’s personal data, a set of stereotypes and a list of in-4
terests. The stereotype consists of a prototypical representation of the user, containing a set of
interests represented by a frame of slots. Each one of this slots comprises three concepts: domain,6
topic and weight. The domain identifies a user’s area of interest, the topic is the specific term that
the user used to identify the interest, and a weight that represents the user’s degree of interest on8
the topic. The user model is, in this way, a structure embodying the semantic links and justification
links as well as domain, topic, and weight.10
The semantic links include lists of keywords co-occurring in a page associated with the slot and
the respective degree of affinity with the topic. The profile is given as a set of semantic networks,12
where each slot is a planet, a single and representative weighted term for a given concept, and
each semantic links is a satellite, subsidiary nodes linked to the planets that represent additional14
weighted keywords associated with the concept, as shown in the example present in Figure 2.12.
2.3.1.4 Concept-based Profiles16
Concept-based representation of user profiles is similar to semantic network-based profiles. This
is due to both of the solutions use conceptual nodes and establishes relations between them as a18
way to represent profiles, with the difference that, instead of the nodes represent specific or sets
31

Literature Review
of related words, in concept-based profiles, the concepts are abstract topics interesting to the user.
Besides this similarity, this representation also uses ideas from keyword-based profiles in the way 2
that its used a vector of weight features, but instead of features being used to represent keywords
are used to represent concepts [GSCM07]. 4
Home
Homemaking0.05
Entertainment0.01
Cooking0.49
Videos0.1
Lessons0.3
Figure 2.13: An excerpt of a concept-based user profile [GSCM07].
An approach to representing this kind of profiles is the use a hierarchical view of concepts, as
referred by Gauch et al. [GSCM07], since it enables the system to make generalisations, easily 6
adapt levels of the scheme and dynamically change. The most simple concept hierarchy based
profiles are built from reference taxonomy or thesaurus. More complex ones are created using 8
reference ontologies, where relationships between concepts are explicit specified, resulting in a
richer profile, containing information about a wide variety of different relationships. An example 10
of this approach is given on Figure 2.13.
2.3.2 User Profile Construction 12
User profiles are constructed from information sources using a variety of techniques based on
machine learning or information retrieval, trying to build a profile which is the closest reflection of 14
the user interests and characteristics. Depending on the user profile representation picked, different
approaches are needed in order to build them. Sometimes this become an even complicated task, 16
since, on one side, users may not be sure in his own interests, and, on the other side, often the user
does not want or even can’t do efforts in order to create its profile [Bou13]. 18
The most simplistic approach for building the user profile is to explicit ask the user for key-
words representative of his interests. This approach depends totally on the user because if he is not 20
32

Literature Review
familiar with the system or the vocabulary used, it becomes a difficult task providing the proper
keywords representative of his interests. One improvement to this technique is, as the same time2
that the user is navigating trough pages, suggesting keywords that may match the user interest,
being incumbent upon the user the choose on whatever keywords are more interesting to them.4
Additionally, we got the machine learning approach which is, in the majority of the cases the most
appropriated solution, since, most of the times, is not reasonable to ask a user a set of keywords6
describing his preferences, but instead observing the user’s behaviour through his interactions with
the website in order to learn his profile [Bou13].8
Depending on the representation picked to mirror the user profile, there are different neces-
sities for constructing them. In keyword-based profiles, the user profiles are initially created by10
extracting keywords representative of the website’s pages that the user visited and then it’s taken
into consideration the most important keywords in each page, attributing to them a corresponding12
weight. The simplest approach to keyword-based profiles is the construction of a single keyword
profile for each user. But, generally, is a better approach use multiple keyword profiles for each14
user, one per interest area, resulting a more accurate picture of the user. Using as an example a
user with the interest in Sports and Cooking. If a single keyword vector is used it will point to the16
middle of this two different topics, given a user which is interested in athletes who cook or people
who cook for Football games, but if instead is used a pair of vectors as representation, this two18
interest will be independent, representing the user more accurately [GSCM07].
Semantic network-based profiles are typically built by collecting explicit positive or negative20
feedback from users. As in the case of keyword-based profiles, the profile is built using keywords
that are extracted from the user-rated pages. The main difference is that every keyword is added to22
a network of nodes, in which each node can represent an individual word or, in some approaches,
a particular concept, and its associated words [GSCM07].24
In ontologies representation, the user profiles are created by automatically and implicitly
analysing the user navigation habits. A profile is essentially the reference ontology whose con-26
cepts have weights indicating the perceived user interest in each of them. The pages that the user
visits are automatically classified into the concepts, contained in the reference ontology and the re-28
sults of the classification are accumulated. By this process, the concepts in the reference ontology
receive weights based on the amount of related information the user has browsed [GA05].30
Concept-based profiles differ from semantic network profiles in the way that they describe the
profiles in terms of pre-existing concepts, instead of modelling the concepts as part of the user32
profile itself. Although, this profiles still depend on some way to determine which concepts fits in
a certain user based on their feedback. This information can be collected from user feedback on34
pre-classified pages, or, instead, by collecting feedback on a wide variety of pages and then apply
text classification techniques to find the concepts present in each page [GSCM07].36
33

Literature Review
2.4 Conclusion
From the literature review, several conclusions could be made. E-commerce is a relatively new 2
field (as the Internet itself), but is increasing its impact, with an ascendant number of transactions
and values every year. E-commerce site owners in order to increase profits and number of sales 4
resort to Web personalization for each user, using target marketing and recommendation systems.
Here, data mining appears as a crucial component, where techniques have been applied to the Web 6
in order to understand the structure and content of the Web, as well the user behaviour. This focus
of data mining resulted in the creation of a sub-area inside the data mining called Web mining, 8
which itself splits into three different, but sill connected areas, namely: Web content mining, Web
structure mining, and Web usage mining. 10
Different data mining techniques and processes have been applied, and adapted, in order to
meet the necessities of Web mining, and new tools for data collecting were born, like crawlers. 12
Problems associated with Web mining also show up, with solutions been discovered and applied,
for example, the path completion technique applied to incomplete navigational paths. Also, well- 14
known processes of pattern discovery have been applied to the Web, like association rule mining,
and new were born, like navigational pattern analysis. 16
In order to map archetypical website users, through profiles, various representation showed up
as the result of research in the area, each one more adapted to specific cases and with different 18
degrees of complexity. Although, there is a lack of research for the cases when we want to collect
and represent all the website data, not only the users but also the pages content and structure, 20
establishing relationships between all the different data sources. In this context, we think there is
the lack of an established process or guidelines for getting a grasp on the e-commerce website, and 22
a possible process and guidelines for this described in chapter 4, as a possible solution to mitigate
this lack of literature. 24
34

Chapter 3
Problem Statement2
E-commerce has a great role in our economy, as it can be seen by a large number of economic
transactions that happen everyday over e-commerce websites [Sta16]. In this context, the e-4
commerce websites owners use diverse techniques to influence the user actions over the website,
improving sales and increasing profits. Generally, the website’s owners resort to companies that6
provide machine learning services to make an analysis on the website, including the archetypi-
cal users analysis, and to develop models and algorithms that enhance the website’s marketing8
campaigns.
When the machine learner partitioner is confronted with a new, and previously unknown, e-10
commerce website, the data scientists need to go through the website, understanding not only the
business but also how the site is built, pages are interconnected and how the content is present to12
the user. They also need to analyse the logs from any event record system that the website may
have enabled, to understand how the users navigate the website, discovering usage patterns and14
habits. In some, but less common, cases, the data scientists even need to enable a tracking system
on the website, to discover user access patterns and common navigational trails.16
The process of pattern discovering and analysis applied to websites and its users are known
as Web mining [Liu11], and it consists on analysing a website structure (Web structure mining),18
pages content (Web content mining) and usage data (Web usage mining). This process gives the
machine learning partitioner the early knowledge needed to develop any strategy to increase the20
website’s owner profits. By creating a process capable of applying the Web mining most common
techniques to an e-commerce website, we can potentially reduce the time and resources needed at22
an early stage by the service providers. This can also reduce the risk of some data relations and
pattern going unnoticed that could have an important role on the data scientists final output.24
This chapter presents in the Section 3.1 an enumeration of the principal goals of this disser-
tation. In Section 3.2 are stated the principal difficulties and problems that we face, and, are also26
presented solutions accordantly to the literature review. At last, some conclusions are given in
Section 3.3.28
35
Problem Statement
3.1 Goal Statement
The dissertation principal goal is to get a grasp on the e-commerce website, the comprehending 2
structure as well as the pages content, and about the website’s users. This principal goal can be
broken down into smaller objectives as it follows: 4
1. Collect the website structure, representing the pages and interconnections, as a directed
graph; 6
2. Extract relevant information from the website’s pages and categorise them into pre-defined
types; 8
3. Gather information about the websites users:
• Identify different users and sessions, including information about navigational user 10
flow on the website;
• Determine the users preferences and most visited page types; 12
• Characterise user sessions by established metrics;
4. Cross different information sources in order to find patterns and enrich the existent data; 14
5. Discover the website’s archetypical users;
6. A consistent model representing all the website information designed to be easily adaptable. 16
We consider that the data scientist after having this information in his possession is able to
provide more refined models and algorithms to the e-commerce site owner. 18
3.2 Issue Analysis and Target Conditions
The goal of this dissertation embraces some challenges, especially in the area of the web data 20
mining. Due to the web heterogeneity, every website has unique characteristics depending on
the website’s designers and authors. But, since every e-commerce websites have a common tar- 22
get purpose of listing and selling goods to customers, these websites have some similarities in
organization and content available [Pur11]. 24
The area of web mining is an already well-studied field, and Liu [Liu11] makes a deep
overview in the area, presenting the common strategies when mining the web as well as com- 26
mon problems and possible solutions.
Following the dissertation goals, the first challenge that we face is how to collect the website 28
pages and structure, due to the dimensions of some websites. In this case, the typical approach is
via a crawler, that can work differently depending on the final objectives of the crawling task as 30
defined by Pant et al. [PSM04].
The next objective is to extract useful information from pages and categorise the pages taking 32
into account this information. To accomplish this task the process consists of using a wrapper
36
Problem Statement
capable of extracting the information, and different approaches can be used when to design a
wrapper, as presented by Eckerstorfer et al. [PE11].2
At last, we got to understand the website’s users. For this, we need to preprocessing the usage
data, extracting individual users and sessions [CD10], discovering patterns like navigational flows,4
preferences and typical visited pages. After the extraction being complete, we may proceed to its
analysis and finish with the extraction of the website’s archetypical users [Liu11]. An essential6
component on characterising sessions by its attributes is presented by Suchacka et al. [SC13].
The resultant model should represent all the collected and processed data and be easily adapt-8
able for new information or new data crossing tasks. By this, the main challenge here is to design
a model in a way that is capable of giving a representative overview of the website, being this in-10
formation model useful for any future data mining or machine learning task, including simulations
of the users interaction with the website [Dua16].12
3.3 Conclusion
This chapter approaches the main goals of this dissertation, detailing the objectives and challenges,14
and gives a contextualization of this objectives with the information collected in the literature
review. It was noticed that large part of the challenges here addressed were already approached16
in past research and solutions developed. By this way, the approach realized in this dissertation
to accomplish the main goals, as detailed in Chapter 4, reflect some of the well-studied solutions18
developed by other authors.
The problem here addressed can facilitate the data scientists task when faced with a new e-20
commerce website, giving, in a structured flow, that extracts the useful information about the
website and users. This can be really useful when a new website is presented to the machine22
learning practitioner and want to quickly get a grasp of the website structure, content and users.
37

Problem Statement
38

Chapter 4
High-level Overview2
The process of collecting information about an e-commerce website content, structure and it’s
users, known as web mining, is an essential task in the area of machine learning services providers.4
This is especially important when providing machine learning services to e-commerce companies.
Before being capable of providing any service, the providers must have completed the task of re-6
verse engineering the e-commerce website, in order to get a grasp on the website, and be capable of
developing consistent models and algorithms for it. Commonly, for each website, the data scientist8
will go trough a process of analysing the website and selecting best way of retrieve information
from each source, adapting techniques and picking certain methodologies. This makes the data10
collection and processing task becomes more complex, costly in time and resources, increasing
also the risk of relationships between different sources pass unnoticed.12
In order to improve the process, this dissertation proposes to incorporate the usage of well-
known Web Mining techniques into a proper and consistent all-in-one process. By taking in ac-14
count the need of retrieve content from the website pages, relationships between them and knowl-
edge about the archetypical users, different approaches were picked for each information source,16
and a proper information data model developed. Taking into account the diversity of e-commerce
websites, each one with its peculiarities, the sequence of steps was designed to be not only applied18
to one certain type or a specific website, but be able to operate over any e-commerce website,
dealing with the different structures, content or formats that it may have.20
Besides the data collection from a variety of sources and dealing with different formats, the
process intends to be capable of establishing connections between all the information sources22
trying to complement what is, sometimes, incomplete data, and highlighting relationships between
information sources that otherwise could be lost. A summary of the data sources and techniques24
applied as well as the final results are present in Table 4.1.
Some choices have been made during the development of this process, simplifying some of26
the tasks in it, due to the application of more complex approaches, like the use of machine learning
techniques for classifying the website pages, fall outside the scope of this dissertation. Anyway,28
this technique can still be used as they simply integrate into the process.
This chapter provides an high-level overview of the developed process in Section 4.1. It’s30
39
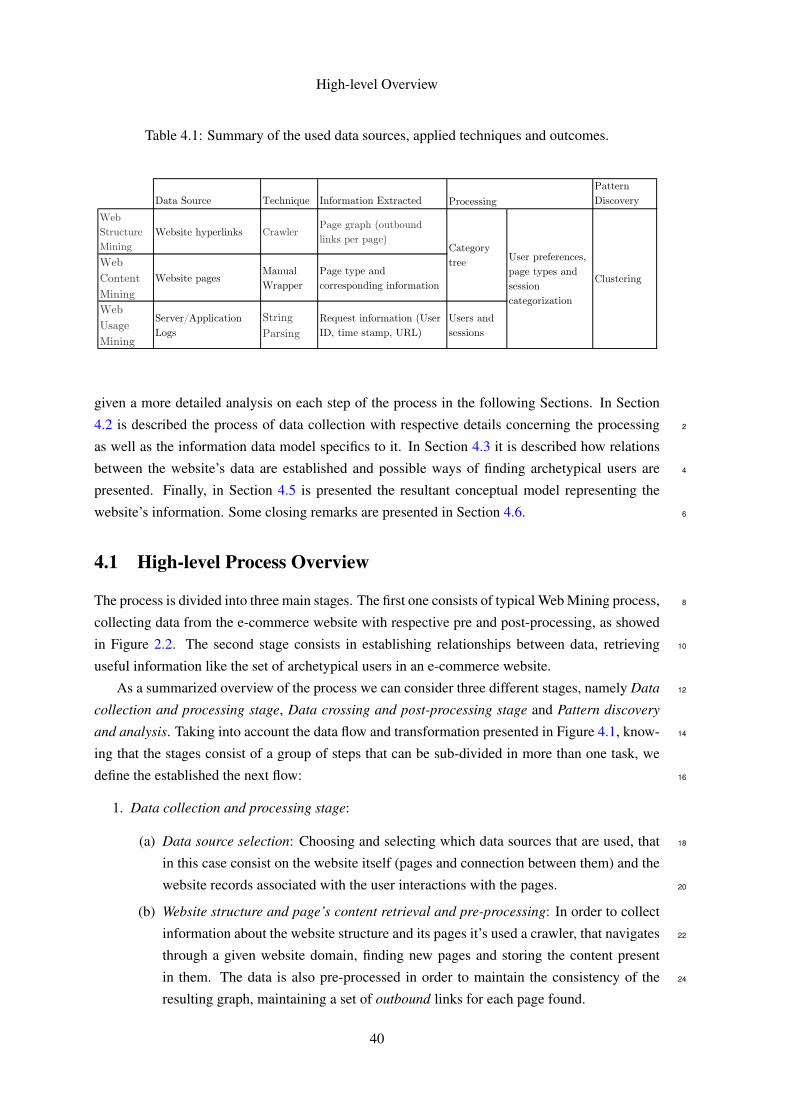
High-level Overview
Table 4.1: Summary of the used data sources, applied techniques and outcomes.
Data Source Technique Information Extracted
Pattern
Discovery
Web
Structure
Mining
Website hyperlinks CrawlerPage graph (outbound
links per page)
Web
Content
Mining
Website pagesManual
Wrapper
Page type and
corresponding information
Web
Usage
Mining
Server/Application
Logs
String
Parsing
Request information (User
ID, time stamp, URL)
Users and
sessions
Processing
Category
treeUser preferences,
page types and
session
categorization
Clustering
given a more detailed analysis on each step of the process in the following Sections. In Section
4.2 is described the process of data collection with respective details concerning the processing 2
as well as the information data model specifics to it. In Section 4.3 it is described how relations
between the website’s data are established and possible ways of finding archetypical users are 4
presented. Finally, in Section 4.5 is presented the resultant conceptual model representing the
website’s information. Some closing remarks are presented in Section 4.6. 6
4.1 High-level Process Overview
The process is divided into three main stages. The first one consists of typical Web Mining process, 8
collecting data from the e-commerce website with respective pre and post-processing, as showed
in Figure 2.2. The second stage consists in establishing relationships between data, retrieving 10
useful information like the set of archetypical users in an e-commerce website.
As a summarized overview of the process we can consider three different stages, namely Data 12
collection and processing stage, Data crossing and post-processing stage and Pattern discovery
and analysis. Taking into account the data flow and transformation presented in Figure 4.1, know- 14
ing that the stages consist of a group of steps that can be sub-divided in more than one task, we
define the established the next flow: 16
1. Data collection and processing stage:
(a) Data source selection: Choosing and selecting which data sources that are used, that 18
in this case consist on the website itself (pages and connection between them) and the
website records associated with the user interactions with the pages. 20
(b) Website structure and page’s content retrieval and pre-processing: In order to collect
information about the website structure and its pages it’s used a crawler, that navigates 22
through a given website domain, finding new pages and storing the content present
in them. The data is also pre-processed in order to maintain the consistency of the 24
resulting graph, maintaining a set of outbound links for each page found.
40

High-level Overview
Web Structure Mining
Web Content Mining
Web Usage Mining
Keyword-Based User Profile
Website Category Tree
Session Type Clustering
Keyword-based Profile Clustering
Stage 1
Stage 3
Stage 2
Figure 4.1: A representation of the data flow thought the designed process, with respective majorstages identified.
(c) Website usage log collecting and pre-processing: During this step, the usage records,
originating from the server or application layer are parsed into a predefined structure,2
and pre-processed in order to remove noise like inconsistent entries in the records or
invalid traffic like the generated by search motors bots.4
(d) Website page post-processing: For each found page of the website the HTML code of
the pages is processed in order to classify the page as to their type, and then, depending6
on the type different fields are extracted like, for example, price and product name.
Another information like if the page has dynamic content is also detected.8
(e) Website usage data post-processing: The usage records are interpreted and different
unique users are identified. User sessions are identified and split as well.10
(f) Data representation and storage: At the end of this stage, the data is stored in an
adaptive model, representing the website structure graph, the page’s information and12
the users data.
2. Data crossing and post-processing stage:14
(a) Usage and page content data crossing: In order to enhance the information present
in user profiles, information originating from the website’s pages post-processing is16
crossed with the usage flow (pages visited by a user), making possible the extraction
41

High-level Overview
of data relative to the types of pages visited as well as the categories of present in the
product pages visited, making possible the building of keyword-based user profiles. 2
(b) User session post-processing: Due to the variety of session types, with different char-
acteristics like length, number of visited pages and/or mean time per page, it’s possible 4
to classify each session as a certain type and then generalise this information to the user
itself, making possible distinguish, for example, users with a typical greater number 6
of visited pages by session from the users that have smaller number of page visited.
(c) Data representation and storage: Finalizing this stage, we store the data corresponding 8
to the category tree of the website and the keyword-based user profiles into an adaptive
model. 10
3. Pattern discovery and analysis:
(a) Archetypical user profile building: Since the user profiles are richer now, containing 12
not only information from the usage logs due to the data crossing, it is possible to
construct archetypical user profiles, in this case using clustering techniques. 14
(b) Data representation and storage: Finalizing this stage, the data generated from the
clustering process is stored in an adaptive data model. 16
4.2 Data Collection and Processing
Data collection consists of gathering the information present on the data sources selected. Since 18
we have two main and different data sources, different techniques and approaches are needed in
order to retrieve the information present in this sources. 20
The data, consisting of the website structure, content and usage data, after being collected
needed to be processed. This consists, firstly, of cleaning the data, removing noise or useless 22
data and transform the data into more structured forms extracting and enhance the most relevant
information. Then, we got to categorise the information into pre-defined types or categories. 24
Only after this process, we are able to make more advanced tasks, like, for example, crossing
data from different sources in order to find unknown or hidden patterns in the data. 26
4.2.1 Website Structure Mining
The first step on data collection from an e-commerce website consists of finding the pages that are 28
part of the website and the relations established between different pages. This goes accordantly
to the directed graph nature of any website, being each page a node and the hyperlinks between 30
different pages the edges. For this task, it is used a crawler, as presented back in Section 2.2.2.
Firstly, with the purpose of retrieving the structure of a given website, it is used the crawler 32
as mention before. It is given to this crawler a base URL corresponding to the homepage of the
website and it downloads the page associated with URL. Following the standard for declaring 34
hyperlinks in an HTML page [Con], it is extracted the list of outbound links from the page.
42

High-level Overview
Since the hyperlinks are used to link to other Web resources beyond another HTML pages,
this outbound must be filtered before being added to the frontier of the crawler, removing links to2
another resource beyond the pages, like images and other multimedia resources. Another detail
is that the outbound should be limited to the website domain, and hyperlinks to outside domains4
should be removed.
Another task that is needed before the adding the new hyperlinks to the frontier is the URL6
canonicalization process, making the hyperlinks uniformed [PSM04]. This consists of several
tasks, and the following ones were applied, namely:8
• Transforming relative URL into absolute ones;
• Removing URL fragment identifiers since they just point to different parts of the same page;10
• Remove website-specific URL query parameters that don’t change the page present to the
user, and by this, does not present any different hyperlinks.12
After the outbound of a given page is filtered and uniformed, the URLs not yet visited by the
crawler are added to the crawler’s frontier, and using this frontier as a queue, the crawler consumes14
the queue until there are no more new URLs to visit.
Depending on the website dimensions, this stage should take in account possible performance16
issues, and optimisations should be implemented, as, for example, parallel crawling [Yua09] and
frontier reordering with prioritization [MG07]. This particularity fall out of the scope of this18
dissertation but are easily integrated into this process.
4.2.2 Website Pages Content Mining20
Each website has, due to the heterogeneity of the web, different ways of presenting information
to the user. Besides that, each page of a given website generally presents different information22
within a particular structure. There are several techniques for extracting useful information from
each website’s page. The most common consists, on one hand, machine learning techniques with24
predicting algorithms used to classify the pages [Liu11], and, on another hand, static content
analysis techniques consisting of extract information from predefined locations in order to classify26
the page [Liu11, PE11].
In the context of this dissertation, the manual approach was applied to extract information from28
predefined locations, but this mechanism can be easily changed by another and more advanced
technique of classification.30
4.2.2.1 Information Retrieval and Pre-processing
The website’s page content is retrieved using an HTTP client, that makes an HTTP request for the32
page and reads the response [PSM04]. After the page is fetched, we are ready to proceeding on
page classification through information extraction from specific parts of the HTML file [PE11].34
43

High-level Overview
Firstly we need to define what are the common page types on an e-commerce website and
what information can be extracted depending on each type. For this purpose it was chosen a set of 2
common page types in e-commerce websites [Coo00], as it follows:
• Generic Page: Includes all the pages with generic information, like, for example, pages with 4
delivery conditions or terms of service.
• Product List Page: This page type comprehends all pages where are the present list of 6
products to the user, like, for example when making a search or seeing all the product of a
given category. 8
• Product Page: Consists of website’s pages that present a specific product to the user, like,
for example, a laptop. 10
• Shopping Cart Page: Are defined by the pages where the user interact with buying opera-
tions, like, for example, the page for managing the selected products for purchase. 12
Page type identification can be done either by using machine learning techniques or by the
help of a heuristic. In this case, we take advantage of URL structure by retrieving information 14
from pre-defined places and by classifying them based on those places. The type page distinction
is, in this way, made by taking advantage of CSS selectors and/or regular expressions [PE11]. The 16
CSS selectors allow us to select elements in an HTML file by using specific HTML patterns, in a
similar way to what regular expressions do. The presence of certain human pre-defined patterns in 18
a website’s page allow us to classify the page into one of the presented page types, what concludes
the pre-processing phase. 20
In order for a link to be categorised as Product Page, it must have present one or more of
the following components: product description, classification by users, comment section, unique 22
price tag, product title and/or product reference. For the Product List Page type the page must
contain a list of different products, and, in most times contain some kind of pagination navigation 24
functionality. The Cart Page type is identified by containing one or, in most cases, more than one
of the following: total price tag, the list of products, paying and check-out buttons. At last, any 26
page that does not fall into one of the previous is classified into Generic Page type, but can be
also detected a presence of certain keywords in the page text using regular expressions, like, for 28
example, "Terms and Conditions", "Customer Services" or "Delivery Options".
4.2.2.2 Information Post-processing 30
After completing the information collection and pre-processing phases, we are now able to extract
specific page information depending on what page type it falls into. Depending on the e-commerce 32
website that we are dealing with, the information that we are capable of extracting can vary. For
any page type there is common information that can be extract, namely, information if the page 34
has dynamic parts like, for example, suggested products sections, and also, information if the page
has a link to the shopping cart page. 36
44

High-level Overview
For pages that fall into the Product Page type, we can, generally, extract the following infor-
mation about a product [GR11]:2
• Name: Any product page has a title or name associated with the product presented to the
user.4
• Category and Sub-categories: Mostly of the product pages has a breadcrumb trail with the
product category and sub-categories. This is presented to the user as a navigational aid on6
the website.
• Price and Concurrency: Associated with any product there is one or more prices (i.e. in the8
case of price discount) and its concurrency.
• Description: The product description.10
• User Classification: Some e-commerce websites have the functionality of giving ratings or
classifications for products and this information can be extracted also.12
In the case of Product List Page type we can usually extract the categories of the product
presented, using the breadcrumb trail present on those pages. Finally in Generic Page types we14
can extract the title of the page that describes the information presented. Cart Page type of pages
does not give us any extra information that we can extract beyond being a page that displays16
shopping cart related information.
4.2.3 Website Usage Mining18
The interaction of the users on a given e-commerce website is recorded in the form of logs. This
information present in this logs as well as the format is different depending on the layer that these20
interaction events are recorded and the technologies used [PCP11]. The objective of this process
is to be able of dealing with this differences, and a set of essential fields were picked, being this22
one common to all log formats and origin layer.
Within this, the essential information for identifying different users, sessions, and navigational24
flow is extracted from the logs into a standard format. Then using this uniformed information it is
possible to split the records by user, and then split by sessions [MCS00].26
4.2.3.1 Information Retrieval and Pre-processing
The website’s usage logs are the result of the user interaction in the website during a time span that28
can correspond to, for example, the visits and iterations of all users on a website during a month.
The user navigation through the website can be recorded at the application layer, using, for30
example, JavaScript snippets on all the website’s pages, or/and they can also be recorded at server
layer when the HTTP requests reach the server. On one hand, data captured at the application32
layer is generally more rich in information and is stored using more advanced data formats like,
for example, JSON or XML. On the other hand, data collected at the server layer corresponds only34
45

High-level Overview
to the information present on each HTTP request, being more poor and simple, usually stored in
plain text files on the server [Mih09]. 2
Due to the differences in how the events are recorded in the two layers and the different infor-
mation present in them [PCP11], it was set a set of fields commons to all the logs format analysed. 4
By pre-processing each entry of the log files, it is created a new entry consisting of the following
fields: 6
• User identifier: An unique identifier associated to each user request.
• Time stamp: A time stamp identifying the date and time of a user request. 8
• Request URL: The visited page by the user.
4.2.3.2 Information Post-processing 10
After pre-processing the log data into a uniformed entries, we are now able to identify unique
users using the User identifier field of each entry, as well as the different user sessions using the 12
Time stamp data and, also, the website’s pages visited by the user. With this information, we are
capable of building a user profile that corresponds to the sessions of a certain user. 14
A new session starts when a certain user makes the first request to one of the website’s pages.
This session lasts from that moment until the last request made is a pre-defined time distant from 16
a new request. Each session has now information that includes:
• User navigational trail: Refer to the sequence of website’s pages that a user visits during a 18
session [MCS00]. Can be useful for Sequential and Navigational pattern analysis as showed
in Section 2.2.4. 20
• Session duration: Corresponds to the total time that a user session lasts [SC13].
• Session length: Corresponds to the total of visited pages by the user on that session [SC13]. 22
• Mean time per page: Refers to the mean time that the user spends on each page during a
session [SC13]. 24
In addition to the information extracted from each session, the user profile now has information
about the total of page views of a user across all sessions, average session time and average mean 26
time per page.
After the extraction of this fields, the users sessions are analysed and categorized, using the 28
three basic characteristics determined by Suchacka et al. [SC13], namely, session length, session
duration, mean time per page, and classify this characteristics into three different degrees, namely, 30
short, medium and long. This categorization is based on the interval of values of certain parameters
as showed in equations 4.1, 4.2, 4.3, using the values intervals proposed by Suchacka et al. [SC13]. 32
session length =
short, if number of requests = 1
medium, if number of requests ∈ [2,13]
long, if number of requests ≥ 14
(4.1)
46
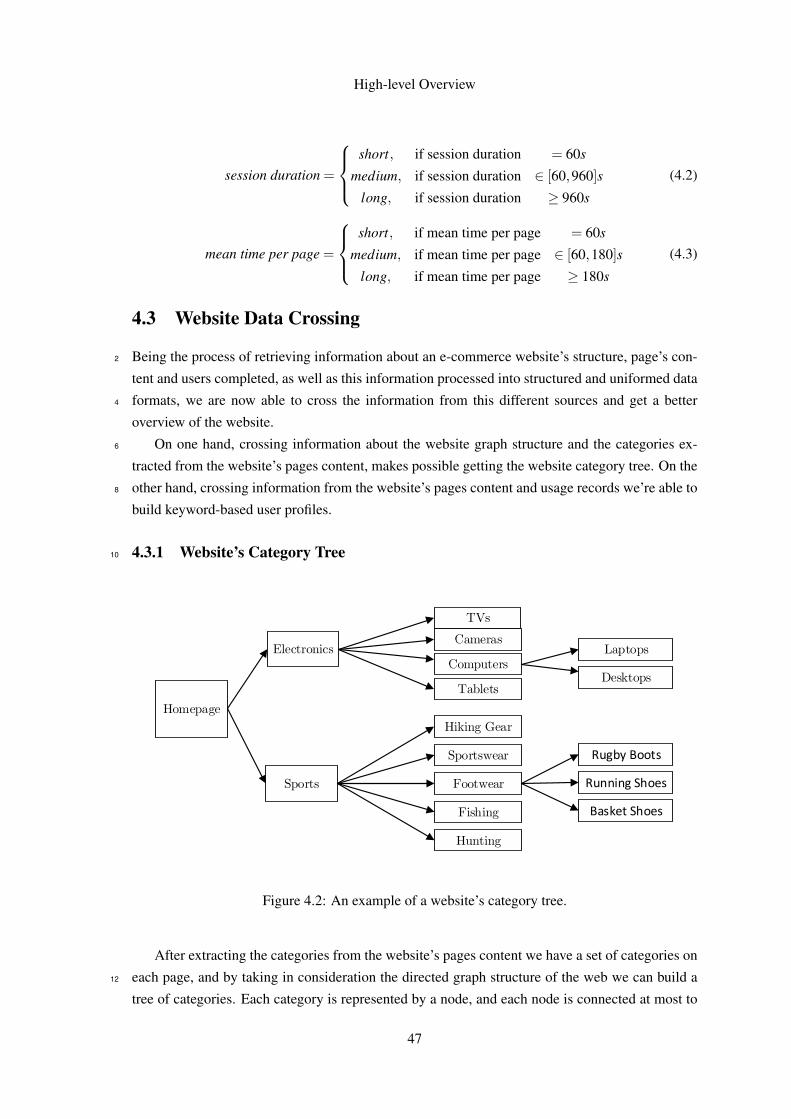
High-level Overview
session duration =
short, if session duration = 60s
medium, if session duration ∈ [60,960]s
long, if session duration ≥ 960s
(4.2)
mean time per page =
short, if mean time per page = 60s
medium, if mean time per page ∈ [60,180]s
long, if mean time per page ≥ 180s
(4.3)
4.3 Website Data Crossing
Being the process of retrieving information about an e-commerce website’s structure, page’s con-2
tent and users completed, as well as this information processed into structured and uniformed data
formats, we are now able to cross the information from this different sources and get a better4
overview of the website.
On one hand, crossing information about the website graph structure and the categories ex-6
tracted from the website’s pages content, makes possible getting the website category tree. On the
other hand, crossing information from the website’s pages content and usage records we’re able to8
build keyword-based user profiles.
4.3.1 Website’s Category Tree10
Homepage
Sports
ElectronicsCameras
TVs
Hiking Gear
Computers
Tablets
Sportswear
Footwear
Fishing
Hunting
Laptops
Desktops
Rugby Boots
Running Shoes
Basket Shoes
Figure 4.2: An example of a website’s category tree.
After extracting the categories from the website’s pages content we have a set of categories on
each page, and by taking in consideration the directed graph structure of the web we can build a12
tree of categories. Each category is represented by a node, and each node is connected at most to
47

High-level Overview
one parent node, that corresponds to a more generic category, and can have an undefined number
of children nodes that correspond to more specific categories. An example of a website’s category 2
tree is presented in Figure 4.2.
4.3.2 Keyword-based User Profiles 4
Using the information extracted from the website’s pages content, namely the product category
information, we are now able to build keyword-based user profiles, in which the categories are the 6
keywords representative of the users preferences on the website. It is associated with each category
with an affinity level (percentage) that represents the number of page views on pages of a certain 8
category (e.g. Electronics)over the total page views of the user across all sessions, as expressed in
equation 4.4. 10
P(Electronics) =∑
Session(n)Session(i=1) ∑PageView[Electronics](i)
∑Session(n)Session(i=1) ∑PageViews(i)
(4.4)
In addition to the preferences information, it is also added to the user the ratio of page types
visited. Finding what types of pages the users visit can help to distinguish the buyer users from the 12
non-buyers. For example, visiting pages of the type Shopping Cart Page can indicate that the user
is more willing to buy on that website. This consists of establishing a probability of visit a page 14
of a certain type (e.g. Shopping Cart Page) over the total user page views, as showed in equation
4.5. 16
P(Shopping Cart Page) =∑
Session(n)Session(i=1) ∑PageView[Shopping Cart Page](i)
∑Session(n)Session(i=1) ∑PageViews(i)
(4.5)
With this information, we have now preferences and page types information associated with
each user profile, characterising the user and its typical behaviour on the website. 18
4.4 Pattern Discovery and Analysis
After the collection and treatment of the data, as well as data crossing processes, we are now able 20
to build more accurate behavioural profiles on the website users, finding the website’s archetypical
users. For this propose, from the options presented in Section 2.2.4, it was applied clustering using 22
the k-means algorithm, over the data.
4.4.1 Keyword-based User Profiles Clustering 24
One of the approaches for building archetypical user models was based on using the preferences
information present on the built keyword-based profiles. Due to the great diversity of e-commerce 26
websites, this preferences can have more or less granularity and this can be or not a problem.
For this purpose, we can use the extracted website category tree to build profiles with pre-defined 28
48

High-level Overview
levels of granularity. For example, there is a lot of sub-categories under the informatics category,
e.g. laptops, and there are sub-categories under the laptops sub-category, e.g. laptops with an 17in2
screen, and, depending on the website and the generalisation that we want to archive, it becomes
useful to define the level of granularity that we want in the preferences before proceeding to apply4
clustering algorithms to the data, aggregating sub-categories into upper-level categories.
After choosing and setting up the granularity level that we want in the categories, and being6
this our clustering variables, we can now apply the k-means algorithm to find similar users and
group them into clusters [MC10, Liu11].8
At the end of this step, we can extract the centroids of each cluster that represent the prefer-
ences of the users in each cluster. In the eventuality of new data, we can easily predict in what10
cluster the user belongs to. It is also counted the number of users in each cluster, that can be used
to determine the relevance of a cluster in the total of website’s visitors. In this case, the session12
categorization information is calculated as the average of all the users in the cluster.
4.4.2 Session Type Based Clustering14
This approach consists on using the session based categorization model developed by Suchacka
et al. [SC13], and, using as clustering variables the session length, session duration, mean time16
per page, we can group the users applying the k-means clustering algorithm over this variables
[MC10, Liu11].18
The result of this clustering step will be clusters of user with similar sessions, e.g. users that
have long session length with short mean time per page and medium session duration. It is also20
preserved the number of users in each cluster, that can be used to determine the relevance of
certain session types over the total visitors of the website. In this case, the preference information22
is calculated as the average of all preferences of the users in the cluster.
4.5 Website Information Model24
The final output of this dissertation consists of an information data model representing the web-
site’s structure, content, and archetypical users. A conceptual model for this is presented in Figure26
4.3.
The website category tree is defined as a relation of categories and sub-categories, in each28
sub-category can belong at most to one upper-level category. A page in this model is identified
with a unique ID and a URL that is also unique, the HTML content of the page. From this page30
exists a set of outbound pages that link to other pages, representing this way the directed graph
corresponding to the website’s structure. Makes also part of this concept the information about32
dynamic parts on the page, if the page has the connection to the cart page and product information
like category, price and product name.34
A user contains a unique ID that represents it, a collection of sessions, preferences and typical
page types, total user page views, average session time, average number of page views by session36
49

High-level Overview
and average mean time per page. A session by itself contains the user navigational trail of visited
pages, the session duration, mean time per page and total page views on the session. The prefer- 2
ences are represented by a category and an affinity value, and for the typical page, types visited
the same concept is applied. 4
At last, the archetypical users contains information about the total users in that cluster, prefer-
ences of that user group, an average of the typical page types visited by the users in the cluster, as 6
well as the session categorization information (session time, page views by session and mean time
per page). 8
Page
Category
URLHTML Content
1..* 0..*Page TypeIs DynamicNumber of Dynamic Parts
ID
Page Type
Type: Product List Page, Product Page, Cart Page, Generic Page
Outbound Pages
0..*
1..*
[Opt] Category[Opt] Price[Opt] Product Name
Has link to Cart PageUser
Sessions
Session
Trail
Preference
Category
Preferences
Affinity
1
0..* 1
1..*
1..* 0..*
DurationMean Time Per PageTotal Page Views
Total Page ViewsAverage Session TimeAverage Page Views by SessionAverage Mean Time Per Page
Typical Page Types
Typical Page Type
Page TypeAffinity
1 0..*
1..*
0..*
1
0..*
Achetypical User
Preferences
Total Page ViewsSession Time CategoryPage Views by Session CategoryMean Time Per Page Category
Typical Page Types
1
1..*
[Opt] Page Title
User Count
ID
0..*0..*Page
0..1 1..*Category
Figure 4.3: A representation of the website information meta-model.
4.6 Conclusion
This chapter presented an high-level overview of the guidelines for extracting and structuring 10
information from an e-commerce website, as a chain process. This extraction process involves
data from the pages content, website’s structure, and its usage records. There are applied different 12
50

High-level Overview
techniques of extracting information from each data source due to their uniqueness. Besides the
extraction and structuring component, it needs to processing this information and also to cross the2
information from the different sources, with the final objective of finding patterns and connections
between the data to enhance process’s output.4
The explained approach and guidelines presented on this chapter is considered innovative in
the area of providing machine learning services to e-commerce website owners. The defined6
process details a clear workflow for the extraction of information, restructuring of collected data,
with special attention on data crossing and user behaviour modelling for e-commerce websites. It8
is important to state that this approach is a concept that shows the advantages of using data mining
techniques, especially web mining techniques, as a facilitator to data scientists when analysing a10
new and previously unknown e-commerce website. The steps here detailed were mostly described
for a generic scenario, but the proof-of-concept and experiments were conducted under simpler12
scenarios. As described, some extensions or modifications may be needed to use this approach
for more heavy and complicated scenarios. Chapter 5 addresses some implementation details and14
chapter 6 details the conducted experiments and the results obtained.
51

High-level Overview
52
Chapter 5
Implementation Details2
This chapter covers some implementation details on the developed proof-of-concept in the con-
text of this dissertation, with the objective of demonstrating its feasibility and applicability. The4
POC implementation architecture, technologies used and design patterns applied are here detailed.
These implementation decisions were made taking into account the objective of the tool be easily6
adaptable and scalable if needed.
The process described in the previous chapter was implemented using the Scala programming8
language (v2.11.8) [Ode16] and using the open source build tool SBT (v0.13.11) [Har16]. Due to
the heterogeneity of e-commerce websites and the available information change between them, it10
was chosen a NoSQL database system, in this case, MongoDB (v3.2.4) [Mon16], that allows us
to quickly make modifications and adapt/rewrite the documents stored in the database.12
5.1 Desiderata
In the context of the development of the proof-of-concept, some base requirements were taken14
into account, since these functionalities are essential for the validation of the process and model
proposed in this dissertation. The proof-of-concept requirements as it follows:16
1. Collect the data present on the website and usage records;
2. Transform the collected data into structured data formats, containing all the relationships18
and essential information;
3. Establish new relationships between the different data sources (website structure, content,20
and usage records);
4. Categorise the website’s pages by page type and category.22
5. Extract the website’s category tree;
6. Identify unique users and sessions;24
53

Implementation Details
7. Create keyword-based profiles by crossing information from the website and users naviga-
tional trail; 2
8. Categorise the sessions into pre-defined types;
9. Identify archetypical website users trough clustering (with preferences and sessions infor- 4
mation);
10. A coherent representation of the website structure, content and users as an information 6
model.
5.2 Overview 8
The implementation was based on the software pattern principle pipes and filters. In this way, the
implementation consists of a chain of process arranged such as the output of each element of the 10
chain is the input of the next one. This chain model process is presented in Figure 5.1.
Crawler
Manual Wrapper
Log Parsing
E-commerce Website
Server/Application Usage Logs
Website Graph
Pages Types and Extracted
Information
Page Categorization and
Information Extraction
User Identification and Session Split
Category Tree Extraction
Pages and Outbound URLs
Users and Sessions
Users, Sessions, Session
Classification and Preferences
Session Classification
Pattern Discovery and
Analysis
Archetypical Users
Config.File
Website Structure
Website Category Tree
Figure 5.1: A representation of the data flow, operations and outputs.
Analysing the process presented in Figure 5.1 in depth, we firstly have our data sources, con- 12
sisting of the e-commerce website itself and the usage logs associated with it. On one hand,
we have the website that is generally built using common web technologies, namely: HTML, 14
JavaScript, and CSS, and may also contain some multimedia elements like images and video. On
the other hand, we got the logs associated with the website. These logs contain information about 16
the requests or events associated with the interaction of the user with the website. If the data is
captured at the server layer, this logs contains information about the HTTP requests of the user as 18
54

Implementation Details
he navigates between website’s pages and consists of plain text files where each entry corresponds
to a request. If the data is captured at the application layer, this logs contains richer data about the2
interaction of the user, containing not only information about the pages he visits but also informa-
tion about some dynamic features of the website like, for example, buttons clicked. This data is4
generally in a more structured format like JSON or XML.
5.2.1 Website Pages Data Collection6
For the website data collection, the strategy chosen was the use of a crawler. A configuration
file with the website base URL, parameters to ignore and ignorable file extensions is given. The8
crawler then follows the principle presented in Figure 2.6. It starts by the e-commerce website
homepage and then find the hyperlinks going out of this page. The extraction of the hyperlinks10
is accomplished with the use of the software library jsoup (v1.9.1) [Hed16]. The filtering and
canonicalization of the hyperlinks found are the first challenges that we face. Firstly, the outbound12
URLs are filtered for the website domain, removing links to external pages (i.e. social network
pages) and it is also removed all the links for non-pages, like multimedia elements or style sheets.14
Secondly, we need to uniform the URLs, in this case, the approach consists of:
1. Removing URL fragments since they do not change the content of the page;16
2. Removing certain query parameters (depending on the website) due to some of them does
not bring new content;18
3. Transform all the URL into relative URLs.
The crawler maintains two lists, one with already visited URLs and another with the URLs to20
visit. For each new link found, it is verified if the page is in the already visit or in the to visit list.
If the link is totally new to any list, the link is added to the to visit list. The crawler iterates over22
this list until there is no new link available.
For this task it was used the scala-uri [THE16] Scala library, that enables URL parsing and24
specific modifications (like removing certain parameters). After the crawling stage is complete, we
store in the database each crawled page with the corresponding source code, URL, and outbound26
list, establishing a directed graph with the pages.
After having the source code of the pages of a website, we proceed to the wrapping of this28
context for information extraction. This approach used for this task was manual wrapping, were
a human specifies a priori the locations of the information that he wants to extract (pre-defined30
locations). This is accomplished by providing a configuration file with a set of tuples that contains
the information that we want to extract and the CSS selectors or regular expressions that specify32
where this information is located (i.e. price => div>#price ). For the extraction itself it is once
again used the jsoup (v1.9.1) [Hed16] library, that builds up the DOM tree and enables the direct34
use of CSS selectors.
To categorise the pages into the pre-defined types (Generic Page, Product Page, Product List36
Page and Cart Page), a simplistic approach was used. By the presence of some HTML tags and
55

Implementation Details
attributes specific to each page type, we give pages a type. As an example, the page type Product
Page is defined by the presence of information like price, product description, model, and serial 2
number. This is based on the a priori human-defined configurations. The information extracted
is stored in a model that is specific for each page type, since that the information we are able to 4
extract is page type dependant. This variety of the stored information for different pages justify
the choice of a NoSQL database technology, that lets us adapt the information storage model on 6
the fly for each page.
The categories for each page of the type Product Page or Product List Page is extracted from 8
the breadcrumbs (navigational aid) present on the pages. The information present in the bread-
crumbs can be more or less complete, being common that these breadcrumbs contain the path 10
from the homepage, categories, and sub-categories until the current page level. Then, we can eas-
ily reverse engineering these paths to obtain the website category tree, finding common nodes and 12
respective leafs. When this is not possible, we got to look to the extracted page graph and see the
previous page’s categories, as they are connected, to build the tree. 14
5.2.2 Website Logs Data Collection
Another chain in our implementation deals with the website log files. A different approach is used 16
in the parsing step depending on the format and encoding of the logs. A set of required fields
for extraction for every entry was selected (User identifier, Time stamp and Request URL). For 18
extracting this information from plain text log files, some input forms the human is needed in
the configuration file, namely, the delimiter character and the position where each information is 20
present in the line. With this input we can extract the required information doing a simple string
parse. When extracting the same information from JSON log files there is the need of the human 22
to specify the data keys. With this information, and using any JSON parsing library (in the case
play-json v2.5.2 [Lig16] was used), we can easily extract the required values. For dealing with the 24
different date time formats, it is required to the human to specify the date format, being also used
an auxiliary Scala library, nscala-time (v2.10.0) [Yos16]. 26
The next step in dealing with the usage data consists on to identify and split sessions. The first
task is given since the request from the same user have a unique ID representing them. The princi- 28
pal difficulty consists on split the different sessions. A common heuristic was used, consisting of,
as stated in the previous chapter, recording the time from the last request, and if there is no activity 30
of the user in the following time span (specified in the configuration file), a session ends. A new
one starts when receiving a new request from the same user. For dealing with the time variables 32
nscala-time (v2.10.0) [Yos16] library was fundamental, since it simplifies the operations with time
variables. 34
After having a user and his sessions, we got information about the pages that a user visit on
a session and the time spent on that session (session duration). Crossing the information of the 36
pages visited with the extracted information from the website’s pages content allow us to get the
information about the page types that the user visited, and also discover information about user 38
preferences (by crossing the pages visited with the extracted pages category). Another component
56
Implementation Details
consists on to categorise the user sessions as specified in the previous chapter, and here we can
simply extract the session length by counting the pages visited on the session and the mean time per2
page by diving the number of pages visited on the session by the session duration. The intervals
that specify how sessions are categorise as short, medium and long are specified by the human in4
the configuration file.
The last step consists on discovering and analysing patterns in the user data, with the objective6
of finding the website’s archetypical users. For this purpose it was applying clustering over the
user data, using the k-means algorithm. There were two clustering approaches applied, one based8
on the users preferences and the other based on the session characterisation. To accomplish this,
it was used the Apache Spark MLlib (v1.6.1) [Zah16] that provides various machine learning and10
data mining algorithms, including the k-means. Additionally, some human-specified parameters
are needed, namely:12
• Number of clusters: The number of clusters that is considered to exist on the website a
priori;14
• Minimum number of users on cluster: A parameter that makes a filter on the clustering
results, presenting only the ones with more than the minimum number of users as output;16
• the maximum number of iterations: This k-means parameter specifies the number of itera-
tions realized until convergence.18
A problem that we faced was that due to the user preferences are built only using the most
specific product category level, we got too much granularity. For generalising this preferences20
into major, and more generic, categories it becomes useful the previously built website category
tree, enabling us to establish a common profundity level to all users preferences information.22
After the completion of this stage, the archetypical users found are stored in two collections,
one corresponding to the users clustered by session characterisation and another resulting from the24
clustering by preference.
5.3 Limitations26
This implementation consists of a proof-of-concept of the process and guidelines presented as part
of the previous chapter 4. For this POC various simplifications were made, as some more advanced28
components can be applied at some of the stages of the process, they were considered out of the
scope of this dissertation.30
The Scala programming language enables us to easily implement concurrency safely, taking
advantage of the actor system and other functionalities, but this was partly disregarded when the32
implementation of this POC, but this would be a major advantage especially in the crawling task.
Another detail of this implementation is that we can only make clustering of a limited number34
of users, due to the limited resources existent on personal computers, and we may obtain better and
more satisfying results when applying clustering algorithms over a larger number of users. Also,36
57

Implementation Details
other clustering algorithms beyond the k-means could have experimented and results compared, in
order to pick the one which gives better results. 2
5.4 Conclusion
This chapter gives a more detailed vision over choices made on the implementation of the high- 4
level process presented in the previous chapter. The technologies used are presented and the
choices justified. It is also enumerated the additional libraries used and the scenarios for which 6
they are used. This is supposed to be a proof-of-concept and simplifications were made, towards
a more vertical implementation of functionalities, and this resulted in some limitations that are 8
presented.
At last, we consider this proof-of-concept capable of demonstrating the applicability of the 10
designed process in the context of this dissertation. When the machine learner service providers
are confronted with a new website, they need to do a similar process before being able to develop 12
rich models and algorithms to improve the user engagement on e-commerce websites. This early-
stage process can be totally, or at least partially, optimized, as demonstrated. 14
58

Chapter 6
Evaluation2
In contemplation of the process presented in Chapter 4 and the implementation detailed in Chapter
5, it was proceeded to carry out an evaluation of the process itself. This was done in order to eval-4
uate the reliability, feasibility, and applicability of the designed process under different scenarios.
To conduct this evaluation process, two distinct e-commerce websites were taken as example6
input, reflecting two different markets and users. It is essential to evaluate how the process behaves
under different circumstances, so these websites were picked since they vary in structure, content8
and usage logging system.
One of the experiments is based on a general purpose e-commerce website, aggregating prod-10
ucts from a lot of different categories and, by this, there are no target users for such website. Here
becomes important comprehend how the content is disposed on the website, and find out the most12
visited categories or product in order to enhance the marketing activities in this areas. On another
side, can be also useful to find the less visited categories/products and make them more visible14
and/or attractive.
The other experiment was based on an e-commerce website dedicated to a niche market, in the16
case the gaming industry enthusiasts, reflecting a very specific part of the market, with specialised
tastes. Here it is also useful for the data scientist understand how data is distributed on the website,18
and finding the most specialised preferences of its users.
In any of the selected experimental cases, the data collected and patterns found can be very20
useful when modelling and developing new models and algorithms to improve the user engage-
ment on the website, possibly increasing sales and profits. This data can be used with the objective22
of, for example, creation or improvement of the recommendation system in place.
In Section 6.1 is given a more detailed description of the experimental data sources, followed24
by the specification of the experimental variables and configurations in Section 6.2. The final
results are presented and analysed in Section 6.3 and some closing remarks are given in 6.4.26
59
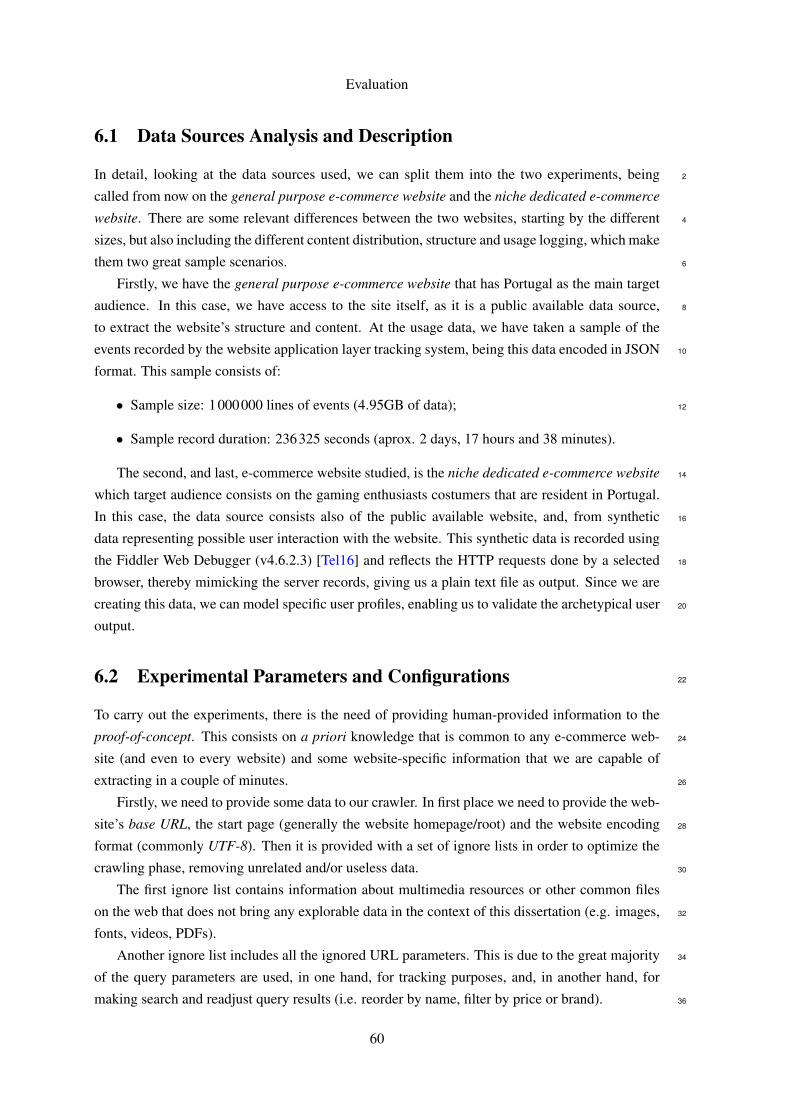
Evaluation
6.1 Data Sources Analysis and Description
In detail, looking at the data sources used, we can split them into the two experiments, being 2
called from now on the general purpose e-commerce website and the niche dedicated e-commerce
website. There are some relevant differences between the two websites, starting by the different 4
sizes, but also including the different content distribution, structure and usage logging, which make
them two great sample scenarios. 6
Firstly, we have the general purpose e-commerce website that has Portugal as the main target
audience. In this case, we have access to the site itself, as it is a public available data source, 8
to extract the website’s structure and content. At the usage data, we have taken a sample of the
events recorded by the website application layer tracking system, being this data encoded in JSON 10
format. This sample consists of:
• Sample size: 1000000 lines of events (4.95GB of data); 12
• Sample record duration: 236325 seconds (aprox. 2 days, 17 hours and 38 minutes).
The second, and last, e-commerce website studied, is the niche dedicated e-commerce website 14
which target audience consists on the gaming enthusiasts costumers that are resident in Portugal.
In this case, the data source consists also of the public available website, and, from synthetic 16
data representing possible user interaction with the website. This synthetic data is recorded using
the Fiddler Web Debugger (v4.6.2.3) [Tel16] and reflects the HTTP requests done by a selected 18
browser, thereby mimicking the server records, giving us a plain text file as output. Since we are
creating this data, we can model specific user profiles, enabling us to validate the archetypical user 20
output.
6.2 Experimental Parameters and Configurations 22
To carry out the experiments, there is the need of providing human-provided information to the
proof-of-concept. This consists on a priori knowledge that is common to any e-commerce web- 24
site (and even to every website) and some website-specific information that we are capable of
extracting in a couple of minutes. 26
Firstly, we need to provide some data to our crawler. In first place we need to provide the web-
site’s base URL, the start page (generally the website homepage/root) and the website encoding 28
format (commonly UTF-8). Then it is provided with a set of ignore lists in order to optimize the
crawling phase, removing unrelated and/or useless data. 30
The first ignore list contains information about multimedia resources or other common files
on the web that does not bring any explorable data in the context of this dissertation (e.g. images, 32
fonts, videos, PDFs).
Another ignore list includes all the ignored URL parameters. This is due to the great majority 34
of the query parameters are used, in one hand, for tracking purposes, and, in another hand, for
making search and readjust query results (i.e. reorder by name, filter by price or brand). 36
60

Evaluation
Finally, the last ignore list contains a list of keywords that, when present in the URL, the
URL is ignored. Examples of this are, for example, the website’s associated blog, social networks2
connections or other links that point to pages that are considered irrelevant.
In the page content extraction and categorization phase, as it is used a manual wrapper to4
extract the content, it is needed to pass, in the case, a list of CSS selectors, from where the infor-
mation we want to extract is present, and from which it is made the categorization of pages into6
the pre-defined types.
In the current experiment the needed fields were the page category (or/and subcategories)8
(i.e. ul.breadcrumb li:not(:first-child)), product price (i.e. div#price), product name (i.e.
h1.product-title), a product list unique identifier (i.e. .products.view-grid), a dynamic part10
identifier (i.e. div#popular-products") and a cart page identifier (i.e. div#sc-active-cart #sc
-saved-cart). Using this extracted fields we can now categorise the different pages types, for12
example, a page with a price tag is Product Page type.
At the usage analysis stage, there are two configurations that we need to provide, describing14
the log file encoding format (plain text or JSON), as this format diverges between logs. Another
configuration need for any kind of log is the date format string, for example, yyyy-MM-dd’T’HH:mm16
:ss.SSS’Z’.
In the case of plain text files containing information about HTTP requests, we need to pro-18
vide the delimiter character, commonly the tab (\t), and the position where each required field is
present in each event line (the index value). As we want to extract the User identifier, Time stamp20
and Request URL, we need to provide the index of this elements. A detail in this component is that
the logs captured at server layer represent each request HTTP made to the server, not only pages22
but also the other resources like multimedia. Again, as it is needed in the crawler, we need to pass
a list of ignored file extensions in order to filter this logs. For application layer logs, we just need24
to pass the key from where we want to extract the data, since, due to the key-value standard of
JSON files.26
At last, we need to split our session, being set a threshold of 30 minutes from the last request
to create a new session for the given user. To categorise our sessions the default values were used,28
as present in equations 4.1, 4.2 and 4.3.
For the clustering step, we used the per default number of 20 clusters, 20 maximum iterations30
and set a minimum threshold of 20 users to the cluster be considered.
6.3 Experimental Results32
6.3.1 Niche Dedicated E-commerce Website
Applying the crawler on the Niche Dedicated E-commerce Website, we got web graph consisting34
of:
• Total of website’s pages crawled (web graph nodes): 2687 pages;36
• Total of valid links found (web graph edges): 361344 links.
61

Evaluation
The crawling process takes approximately 20 minutes and 38 seconds, and a visualization
of the crawling process, with the frontier count and visited pages count is showed in the chart 2
on Figure 6.1. We can notice that at the beginning of the crawling we have a lot of new links
discovered, but this tends to decrease as we process new pages, until there exist no more new links 4
to visit.
0
150
300
450
600
750
900
1050
1200
1350
1500
1650
1800
1950
2100
2250
2400
2550
2700
0 34 67 100
132
162
192
221
251
281
309
340
369
399
430
460
491
520
551
582
615
644
675
708
737
767
797
827
858
889
920
950
982
1012
1043
1075
1105
1135
1166
1196
1225
Num
ber
of P
ages
Elapsed Time (seconds)
Frontier Visited Pages
Figure 6.1: Chart representing the crawling of the Niche Dedicated E-commerce Website, consid-ering the crawling time in seconds, pages visited and frontier size.
After wrapping the page content, we categorized each page into the pre-defined page types. 6
This information is shown in the chart present in Figure 6.2.
Crossing the information from pages types and website structure we got the category tree with: 8
• Number of base categories: 25;
• Total number of subcategories: 103. 10
As mentioned before, on this website we do not have access to the usage records, and, due
to that, we used synthetic data to validate the user component of the process. To realize this 12
evaluation, we defined a navigate flow and analysing the records, compared this flow with the
archetypical user found. 14
The details about the synthetic data correspond to one user and three sessions. We can’t
proceed to cluster over this data set because of the sample be this small, but we can construct a 16
62

Evaluation
Generic Page Product List Page Product Page Cart Page
Page's Count 39 897 1750 1
0
200
400
600
800
1000
1200
1400
1600
1800
2000
Figure 6.2: Chart representing the number of pages by page type on the Niche Dedicated E-commerce Website
user profile and compare them to the initial interaction on the site. The original data consist of a
total of 49 visited pages. The two first sessions had a medium session length and session duration2
and the third had a large session length. Every sessions is considered to have a short mean time
per page. This data values are shown in Table 6.1.4
Table 6.1: Session original characteristics.
Mean time per page Session length Session durationSession 1 6s 10 70sSession 2 6s 10 70sSession 3 9s 29 261s
Synthetic data of the pages types visited by the user during his navigation through the website’s
pages is presented in Table 6.2a. The count of the pages visited by category by the user during his6
navigation through the website’s Product Pages and Product List Pages is presented in 6.2b.
Table 6.2: Input synthetic user data.
(a) Page types visited information.
Type Page viewsGeneric Page 2Product List Page 27Product Page 16Shopping Cart Page 4
(b) Categories visited information.
Category Page viewsComputadores 7Portáteis 18Cartões de Memória 5Motherboards 5Teclados / Ratos 8
The resulting user profile page types information, as percentages, is presented in Table 6.3a8
and the resulting user profile categories information, as percentages also, is shown in Table 6.3b.
63

Evaluation
Table 6.3: Output user profile information.
(a) Page types visited information.
Type Page views (%)Generic Page 4.1%Product List Page 55.1%Product Page 32.7%Shopping Cart Page 8.2%
(b) Categories visited information.
Category Page views (%)Computadores 16.3%Portáteis 41.9%Cartões de Memória 11.6%Motherboards 11.6%Teclados / Ratos 18.6%
Resumed (average) session information on the user profile:
• Average Session Time: 133.7 seconds; 2
• Mean time per page: short;
• Session length: medium; 4
• Session duration: medium
As we can see from the input synthetic data, and the resulting data present on the resulting 6
user profile, there is a coherent representation (summary) of the original data.
6.3.2 General Purpose E-commerce Website 8
Applying the crawler on the website, we got web graph consisting of:
• Total of pages crawled (graph nodes): 621303 pages; 10
• Total of valid edges found: 11044225 links.
After wrapping the page content, we categorized each page into the pre-defined page types. 12
This information is shown in the chart present in Figure 6.3.
Crossing the information from pages types and website structure we got the category tree with: 14
• Number of base categories: 14;
• Total number of subcategories: 1618. 16
From the analysed 4.5GB of usage records, we could identify the following data:
• Unique users: 111141; 18
• User sessions: 135056.
• Average visited pages by user: 4.6; 20
• Average session duration: 125.07s;
• Total page views: 511354 22
64
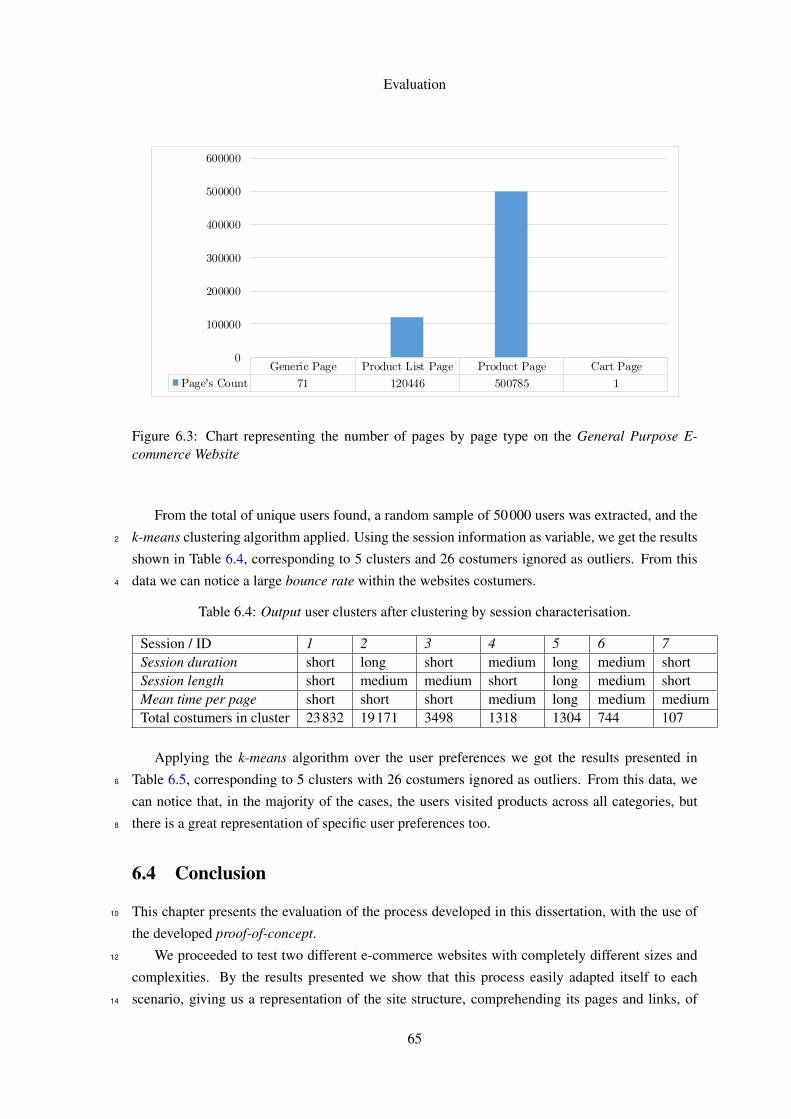
Evaluation
Generic Page Product List Page Product Page Cart Page
Page's Count 71 120446 500785 1
0
100000
200000
300000
400000
500000
600000
Figure 6.3: Chart representing the number of pages by page type on the General Purpose E-commerce Website
From the total of unique users found, a random sample of 50000 users was extracted, and the
k-means clustering algorithm applied. Using the session information as variable, we get the results2
shown in Table 6.4, corresponding to 5 clusters and 26 costumers ignored as outliers. From this
data we can notice a large bounce rate within the websites costumers.4
Table 6.4: Output user clusters after clustering by session characterisation.
Session / ID 1 2 3 4 5 6 7Session duration short long short medium long medium shortSession length short medium medium short long medium shortMean time per page short short short medium long medium mediumTotal costumers in cluster 23832 19171 3498 1318 1304 744 107
Applying the k-means algorithm over the user preferences we got the results presented in
Table 6.5, corresponding to 5 clusters with 26 costumers ignored as outliers. From this data, we6
can notice that, in the majority of the cases, the users visited products across all categories, but
there is a great representation of specific user preferences too.8
6.4 Conclusion
This chapter presents the evaluation of the process developed in this dissertation, with the use of10
the developed proof-of-concept.
We proceeded to test two different e-commerce websites with completely different sizes and12
complexities. By the results presented we show that this process easily adapted itself to each
scenario, giving us a representation of the site structure, comprehending its pages and links, of14
65
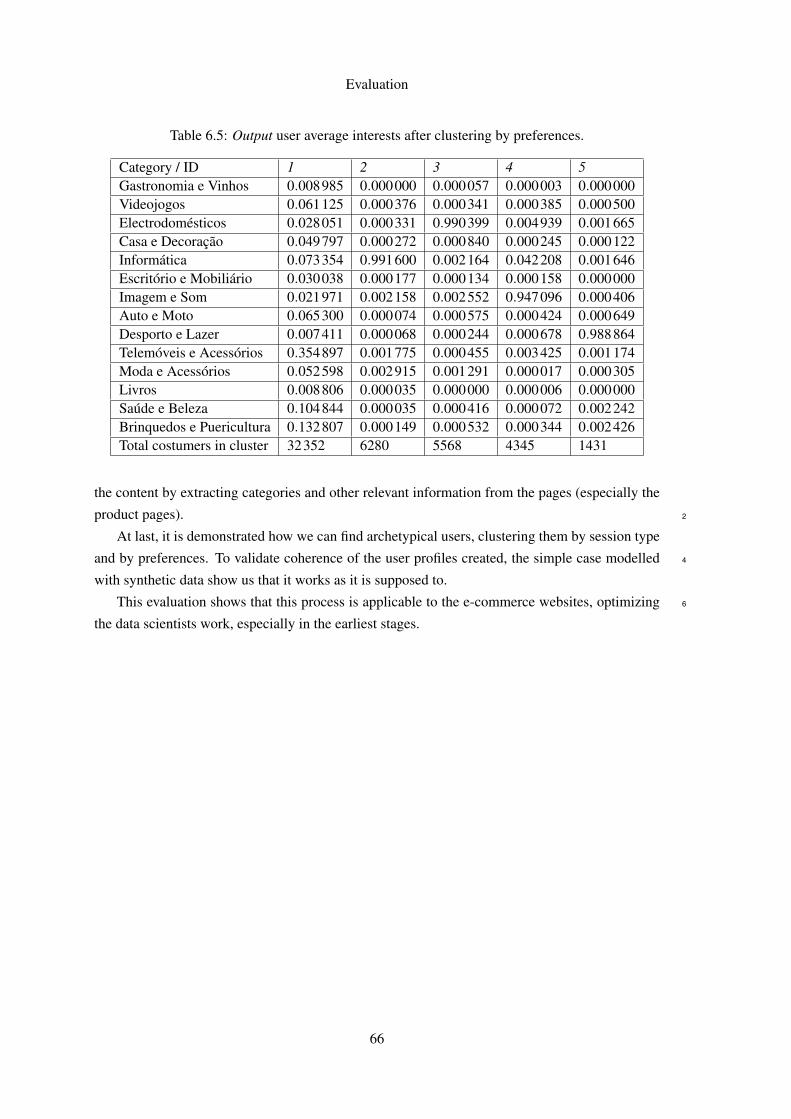
Evaluation
Table 6.5: Output user average interests after clustering by preferences.
Category / ID 1 2 3 4 5Gastronomia e Vinhos 0.008985 0.000000 0.000057 0.000003 0.000000Videojogos 0.061125 0.000376 0.000341 0.000385 0.000500Electrodomésticos 0.028051 0.000331 0.990399 0.004939 0.001665Casa e Decoração 0.049797 0.000272 0.000840 0.000245 0.000122Informática 0.073354 0.991600 0.002164 0.042208 0.001646Escritório e Mobiliário 0.030038 0.000177 0.000134 0.000158 0.000000Imagem e Som 0.021971 0.002158 0.002552 0.947096 0.000406Auto e Moto 0.065300 0.000074 0.000575 0.000424 0.000649Desporto e Lazer 0.007411 0.000068 0.000244 0.000678 0.988864Telemóveis e Acessórios 0.354897 0.001775 0.000455 0.003425 0.001174Moda e Acessórios 0.052598 0.002915 0.001291 0.000017 0.000305Livros 0.008806 0.000035 0.000000 0.000006 0.000000Saúde e Beleza 0.104844 0.000035 0.000416 0.000072 0.002242Brinquedos e Puericultura 0.132807 0.000149 0.000532 0.000344 0.002426Total costumers in cluster 32352 6280 5568 4345 1431
the content by extracting categories and other relevant information from the pages (especially the
product pages). 2
At last, it is demonstrated how we can find archetypical users, clustering them by session type
and by preferences. To validate coherence of the user profiles created, the simple case modelled 4
with synthetic data show us that it works as it is supposed to.
This evaluation shows that this process is applicable to the e-commerce websites, optimizing 6
the data scientists work, especially in the earliest stages.
66

Chapter 7
Conclusion2
From the analysis of the state of the art of research in e-commerce, web mining, and user profiling,
several conclusions could be made. These conclusions essentially defined the process and our4
approach in general.
The e-commerce overview gives us a brief introduction to the area for which we are devel-6
oping our process and model. Special attention was given to the e-metrics generally used on
e-commerce, recommendation systems and typical e-commerce websites and structure. This anal-8
ysis shows us the importance that a consistent data model can have when improving the e-metrics
or developing/testing new recommendation systems.10
Since we were dealing with the web, the data sources are so large and diverse that a new
field was born, called Web Mining. The research on this area becomes crucial when retrieving12
and dealing with the data coming from the e-commerce websites. There are two main sources of
information on the web, the websites, and the usage logs. This applies to e-commerce too, and,14
different techniques exists to retrieve the website’s pages and hyperlinks with the use of crawlers,
extract the pages content trough different wrappers, and, finally, identify users and sessions trough16
different methods.
Finally, it is important to mention that different methods were already researched and validate18
for finding patterns within the data collected, with special attention to the usage data, for which
we can apply user profiling techniques to build and represent user profiles. From this profiles, we20
can apply pattern discovery and analysis techniques to find the website’s archetypical users.
In order to develop an information model representation of an e-commerce website through its22
entire scope (website’s structure, content, and users) we needed to get to know the data we were
dealing with.24
Since the web pages lack of a rigid structure, being the data unstructured or semi-structured,
firstly we needed to retrieve this data and transforming it into structured data. At this stage, it is26
important to conclude that, despite the web being unstructured by default, there are some common
guidelines that almost every e-commerce website follows, that allowed us to design a process28
that works with different e-commerce websites. In the context of this dissertation, for extracting
67

Conclusion
content, a manual wrapper was used, but it can be replaced by another technique without changing
the process chain. 2
Also, the Web Usage Mining techniques that can be employed on a given problem depend
primarily on the available data’s characteristics. Data captured at the application layer is richer 4
than the data from the server logs, since they can capture dynamic events on the page, like when
a user clicks on a button. We proceed to a simplification, in order to be capable of dealing with 6
server layer and application layer logs, filtering the data and only using common data in the two
records. 8
After retrieving and structuring the data, and, in order to develop and enrich the model, we
proceeded to find the connections between the different data collected. These relations are shown 10
in the diagram on fig. 4.3. It is also realized some data crossing between the different sources, in
order to retrieve new data from the existent data. It is an example of this crossing the building of 12
the website’s category tree, using data from the pages and website structure. The flux of data and
crossing details is given on fig. 4.1. 14
In order to get to know the website’s typical users, after proceeding to the collection and pro-
cessing, pattern discovery algorithms were applied to find usage patterns and similar users. In this 16
case, we applied the k-means clustering algorithm to find similar user groups. Other techniques
may be applied to, to get other patterns or user models, and easily integrated into the information 18
model developed.
A functional prototype was developed, which serves as a proof-of-concept of the process and 20
model. However, simplifications and choices were made, not exploring the full potential of the
Web Mining, and much more work can be done in this area, improving the process and final 22
results.
Using the developed POC, we proceed to apply the process to two different e-commerce web- 24
sites and model the resultant data into the theoretical model. The two websites were picked since
they differ on the target market and have completely different sizes (pages and connections). 26
Within the given results, we think that this approach is valid and the model consistent enough
to be applied to other e-commerce websites. The model itself is very adaptable, and new or differ- 28
ent data can easily be integrated or removed.
7.1 Main Contributions 30
Within this dissertation work, we can consider that the application of Web Mining techniques to
the web, and to e-commerce, in order to improve profits, is not new, and a lot of research has been 32
done in this field, principally when dealing with usage data. So, the principal contributions of this
dissertation consists on: 34
• An all-in-one process, including some of the existent research on the Web Mining field, to
collect and structure data from an e-commerce website’s content, structure and users. 36
68
Conclusion
• Crossing of the data collected from diverse sources to find inexplicit relations, enriching the
process output.2
• An information model of the e-commerce website, containing the collected and structured
information, but also containing data resulted from the crossing of different sources and4
pattern discovery tasks. This model is easily adaptable to new data, resulting from crossing
different sources.6
7.2 Further Work
Some further developments can be applied to each of the conceived processes. Starting with the8
crawling step, for each new page, we extract the hyperlinks present on it, without taking into
consideration the relevance of the links on the page. For example, links that are inside complex10
sub-menus are possible less relevant than the links that show in the page header. For this, some
kind of relevance index should be calculated and associated with each link. This can be useful12
when combining the user’s navigational path with the relevance associated with each link, but also
can be used as an improvement in the crawling task.14
Another improvement to the Web Structure Mining process consists on, besides identifying
the dynamic parts on a page (i.e. parts that contain dynamic connections to related products),16
associate a boolean to each link, identifying the same as dynamic or not.
Advancing to the content extraction stage, the manual wrapper approach was used, but there18
is space to experiment with the other approaches, including the wrapper induction and automatic
extraction presented on the literature review. Some of this alternative methods can prove to be a20
better approach retrieving data from the website’s pages.
There was made two data crossings, for retrieving the website’s category tree and to enrich the22
users profiles getting information from the categories that the user visited. Here exists space to ex-
periment with the crossing of data from other sources, for example, getting information about the24
specific products that the user visited can enable us to get knowledge like if a user has preference
over some range of prices or brands.26
At the last stage, in the process of finding the website’s archetypical users, in our approach we
used cluster through the use of the k-means algorithm. Here exists much more space to experiment28
with other clustering algorithms, and other pattern discovery techniques, as enumerated in the
literature review.30
The output information model can be adapted to any of this proposed enhancements, but the
model itself can mature to became more representative of the e-commerce website.32
Furthermore, the process here designed as well as the model can be adaptable to another
website beyond e-commerce ones, getting to know how the web graph of the website is defined,34
how many pages and connections between pages exists, and how the users move and interact with
the website in their sessions.36
69

Conclusion
70

References
[B+98] Jeff A Bilmes et al. A gentle tutorial of the em algorithm and its application to2
parameter estimation for gaussian mixture and hidden markov models. InternationalComputer Science Institute, 4(510):126, 1998.4
[BC00] Kristin P Bennett and Colin Campbell. Support vector machines: hype or hallelujah?ACM SIGKDD Explorations Newsletter, 2(2):1–13, 2000.6
[Bou13] Djallel Bouneffouf. Towards User Profile Modelling in Recommender System. arXivpreprint arXiv:1305.1114, pages 1–5, 2013.8
[CD10] V. Chitraa and Antony Selvdoss Davamani. A Survey on Preprocessing Methodsfor Web Usage Data. International Journal of Computer Science and Information10
Security (IJCSIS), 7(3):78–83, 2010.
[CG05] Jr. Da Costa, M.G. and Zhiguo Gong Zhiguo Gong. Web structure mining: an in-12
troduction. 2005 IEEE International Conference on Information Acquisition, pages590–595, 2005.14
[CHM+00] Igor Cadez, David Heckerman, Christopher Meek, Padhraic Smyth, and StevenWhite. Visualization of navigation patterns on a web site using model-based cluster-16
ing. In Proceedings of the sixth ACM SIGKDD international conference on Knowl-edge discovery and data mining, pages 280–284. ACM, 2000.18
[CKK02] Yoon Ho Cho, Jae Kyeong Kim, and Soung Hie Kim. A personalized recommendersystem based on web usage mining and decision tree induction. Expert Systems with20
Applications, 23(3):329–342, 2002.
[CMG+99] Mark Claypool, Tim Miranda, Anuja Gokhale, Pavel Murnikov, Dmitry Netes, and22
Matthew Sartin. Combining content-based and collaborative filters in an online news-paper. Proceedings of Recommender Systems Workshop at ACM SIGIR, pages 40–48,24
1999.
[CMS97] R Cooley, B Mobasher, and J Srivastava. Web mining: information and pattern dis-26
covery on the World Wide Web. In IEEE International Conference on Tools withArtificial Intelligence, pages 558–567, 1997.28
[Con] "World Wide Web Consortium". "links in html documents - w3c". Available athttps://www.w3.org/TR/html4/struct/links.html, accessed last time30
on June 2016.
[Coo00] Robert Walker Cooley. Web usage mining: discovery and application of interesting32
patterns from web data. PhD thesis, Univeristy of Minnesota, 2000.
71

REFERENCES
[Cut10] Justin Cutroni. Google Analytics, volume 1. O’Reilly Media, Inc., first edition, 2010.
[DJ10] Easley David and Kleinberg Jon. Networks, Crowds, and Markets: Reasoning About 2
a Highly Connected World. Cambridge University Press, New York, NY, USA, 2010.
[Dua16] Duarte Duarte. Framework for Multi-Agent Simulation of User Behaviour in E- 4
Commerce Sites, 2016. To be published.
[EK08] Andreas Eisingerich and Tobias Kretschmer. In e-commerce, more is more. Havard 6
Business Review, 86(3), 2008.
[EKSX96] Martin Ester, Hans P Kriegel, Jorg Sander, and Xiaowei Xu. A Density-Based Al- 8
gorithm for Discovering Clusters in Large Spatial Databases with Noise. Second In-ternational Conference on Knowledge Discovery and Data Mining, pages 226–231, 10
1996.
[Exp09] Explorable.com. Statistical correlation, 2009. Available at https:// 12
explorable.com/statistical-correlation, accessed last time on January2016. 14
[Fou08] The Apache Software Foundation. Apache http server documentation, 2008. Avail-able at http://httpd.apache.org/docs/1.3/logs.html#accesslog, 16
accessed last time on January 2016.
[Für02] Johannes Fürnkranz. Web structure mining: Exploiting the graph structure of the 18
world-wide web. OGAI Journal (Oesterreichische Gesellschaft fuer Artificial Intel-ligence), 21(2):17–26, 2002. 20
[GA05] Daniela Godoy and Analia Amandi. User profiling in personal information agents: asurvey. The Knowledge Engineering Review, 20(04):329, 2005. 22
[Gef02] David Gefen. Customer loyalty in e-commerce. Journal of the association for infor-mation systems, 3(1):2, 2002. 24
[Get03] Lise Getoor. Link mining: a new data mining challenge. ACM SIGKDD ExplorationsNewsletter, 5(1):84–89, 2003. 26
[GHP07] Robert Gentleman, Kurt Hornik, and Giovanni Parmigiani. Use R! Springer, 2007.
[GR11] Ali Ghobadi and Maseud Rahgozar. An ontology-based semantic extraction ap- 28
proach for B2C eCommerce. International Arab Journal of Information Technology,8(2):163–170, 2011. 30
[GSCM07] Susan Gauch, Mirco Speretta, Aravind Chandramouli, and Alessandro Micarelli.User Profiles for Personalized Information Access. The Adaptive Web, 4321:54–89, 32
2007.
[Har16] Harrah, Mark. sbt - The interactive build tool - Documentation. Lightbend, Inc., 34
2016. Available at http://www.scala-sbt.org/documentation.html,version 0.13.11. 36
[Hed16] Hedley, Jonathan. jsoup: Java HTML Parser, 2016. Available at https://jsoup.org, version 1.9.1. 38
72
REFERENCES
[HF08] Siping He and Meiqi Fang. Ontological User Profiling on Personalized Recommen-dation in e-Commerce. 2008 IEEE International Conference on e-Business Engi-2
neering, pages 585–589, 2008.
[HKTR04] Jonathan L. Herlocker, Joseph A. Konstan, Loren G. Terveen, and John T. Riedl.4
Evaluating collaborative filtering recommender systems. ACM Transactions on In-formation Systems (TOIS), 22(1):5–53, 2004.6
[Hyd05] Jim Hydzik. The revolution is just beginning. Total Telecom, page 32, 2005.
[JK12] Faustina Johnson and Santosh Kumar Gupta. Web Content Mining Techniques: A8
Survey. International Journal of Computer Applications, 47(11):44–50, 2012.
[KB00] Raynd Kosala and Hendrik Blockeel. Web mining research: A survey. ACM Sigkdd10
Explorations Newsletter, 2(1):1–15, 2000.
[KFT14] Kei Kanaoka, Yotaro Fujii, and Motomichi Toyama. Ducky: A data extraction sys-12
tem for various structured web documents. In Proceedings of the 18th InternationalDatabase Engineering & Applications Symposium, pages 342–347. ACM, 2014.14
[Kle99] Jon M Kleinberg. Authoritative sources in a hyperlinked environment. Journal of theACM (JACM), 46(5):604–632, 1999.16
[KS10] P Ravi Kumar and Ashutosh K Singh. Web structure mining: Exploring hyper-links and algorithms for information retrieval. American Journal of applied sciences,18
7(6):840, 2010.
[Leu07] K Ming Leung. Naive bayesian classifier. Polytechnic University Department of20
Computer Science/Finance and Risk Engineering, 2007.
[Lig16] Lightbend, Inc. and Zengularity, Inc. ScalaJson. Lightbend, Inc. and Zen-22
gularity, Inc., 2016. Available at https://www.playframework.com/documentation/2.5.x/ScalaJson, version 2.5.2.24
[Liu11] Bing Liu. Web data mining: exploring hyperlinks, contents, and usage data. SpringerScience & Business Media, 2011.26
[LJZ08] Weilong Liu, Fang Jin, and Xin Zhang. Ontology-based user modeling for e-commerce system. In Pervasive Computing and Applications, 2008. ICPCA 2008.28
Third International Conference on, volume 1, pages 260–263. IEEE, 2008.
[Mat12] Kate Matsudaira. Data mining the web via crawling, 2012.30
Available on http://cacm.acm.org/blogs/blog-cacm/153780-data-mining-the-web-via-crawling/fulltext#, accessed32
last time at 28 of January 2016.
[MC10] Li Mei and Feng Cheng. Overview of Web mining technology and its application34
in e-commerce. 2010 2nd International Conference on Computer Engineering andTechnology, 7:V7–277–V7–280, 2010.36
[MCS00] Bamshad Mobasher, Robert Cooley, and Jaideep Srivastava. Automatic personaliza-tion based on Web usage mining. Communications of the ACM, 43(8):142 – 151,38
2000.
73

REFERENCES
[MG07] Alessandro Micarelli and Fabio Gasparetti. Adaptive focused crawling. In The adap-tive web, pages 231–262. Springer, 2007. 2
[Mih09] I Mihai. Web Mining in E-Commerce. Annals of the University of Oradea, EconomicScience Series, 18(4):959–963, 2009. 4
[MMN01] Prem Melville, Raymond J Mooney, and Ramadass Nagarajan. Content-BoostedCollaborative Filtering. Proceedings of the 2001 SIGIR Workshop on Recommender 6
Systems, page 9, 2001.
[Mob06] Bamshad Mobasher. Web usage mining. Web data mining: Exploring hyperlinks, 8
contents and usage data, 12, 2006.
[Moh12] Sanjay Mohapatra. E-commerce strategy: text and cases. Springer Science & Busi- 10
ness Media, 2012.
[Mon16] MongoDb. MongoDB - Documentation. MongoDB, Inc., 2016. Available at http: 12
//docs.mongodb.com, version 3.2.4.
[MS04] Alessandro Micarelli and Filippo Sciarrone. Anatomy and Empirical Evaluation of an 14
Adaptive Web-Based Information Filtering System. User Modeling and UserAdaptedInteraction, 14(2-3):159–200, 2004. 16
[MSDR04] Stuart E Middleton, Nigel R Shadbolt, and David C De Roure. Ontological user pro-filing in recommender systems. ACM Transactions on Information Systems (TOIS), 18
22(1):54–88, 2004.
[Naj09] M Najork. Web crawler architecture. Encyclopedia of Database Systems, pages 3–5, 20
2009.
[Ode16] Odersky, Martin. The Scala Programming Language - Documentation. École Poly- 22
technique Fédérale de Lausanne (EPFL) and Lightbend, Inc., 2016. Available athttp://docs.scala-lang.org, version 2.11.8. 24
[PB07] Michael J. Pazzani and Daniel Billsus. Content-based recommendation systems. Theadaptive web, pages 325–341, 2007. 26
[PBMW99] Lawrence Page, Sergey Brin, Rajeev Motwani, and Terry Winograd. The pagerankcitation ranking: bringing order to the web. 1999. 28
[PCP11] Ketul B Patel, Jignesh A Chauhan, and Jigar D Patel. Web Mining in E-Commerce: Pattern Discovery , Issues and Applications. International Journal of P2P Network 30
Trends and Technology, 1(3):40–45, 2011.
[PE11] Reinhard Pichler and Florian Eckerstorfer. Web data extraction-overview and com- 32
parison of selected state-of-the-art tools. In Wien Seminar at mit Bachelorarbeit,2011. 34
[Pet09] Leif E Peterson. K-nearest neighbor. Scholarpedia, 4(2):1883, 2009.
[PSM04] Gautam Pant, Padmini Srinivasan, and Filippo Menczer. Crawling the Web. Web 36
Dynamics, pages 153—-177, 2004.
74
REFERENCES
[PUPL01] Alexandrin Popescul, Lyle H Ungar, David M Pennock, and Steve Lawrence. Prob-abilistic Models for Unified Collaborative and Content-Based Recommendation in2
Sparse-Data Environments. Artificial Intelligence, 2001:437–444, 2001.
[Pur11] Yenny Purwati. Standard features of e-commerce user interface for the web. Re-4
searchers World, 2(3):77, 2011.
[PV12] Ladislav Peska and Peter Vojtas. Evaluating various implicit factors in e-commerce.6
CEUR Workshop Proceedings, 910(Rue):51–55, 2012.
[Rav10] Ashutosh Kumar Ravi, Kumar and Singh. Web Structure Mining: Exploring Hy-8
perlinks and Algorithms for Information Retrieval. American Journal of AppliedSciences, 7(6):840–845, 2010.10
[SA13] Ahmad Siddiqui and Sultan Aljahdali. Web Mining Techniques in E-Commerce Ap-plications. International Journal of Computer Applications, 69(8):39–43, may 2013.12
[SC00] J Sterne and M Cutler. E-metrics: business metrics for the new economy. URL(consulted March 2005): http://www. emetrics. org/articles/whitepaper. html, 2000.14
[SC13] Grazyna Suchacka and Grzegorz Chodak. Practical aspects of log file analysis fore-commerce. In Computer Networks, pages 562–572. Springer, 2013.16
[SF98] Myra Spiliopoulou and Lukas C Faulstich. Wum: A web utilization miner. In Inter-national Workshop on the Web and Databases, Valencia, Spain. Citeseer, 1998.18
[Sin04] Munindar P Singh. The practical handbook of internet computing. CRC Press, 2004.
[Sta16] Statista. Number of e-commerce transactions worldwide 2011-2015, 2016.20
Available at http://www.statista.com/statistics/369333/number-ecommerce-transactions-worldwide/, accessed last time in22
February 2016.
[Tel16] Telerik by Progress. Fiddler - free web debugging proxy. Progress Software Cor-24
poration, 2016. Available at http://docs.telerik.com/fiddler/, version4.6.2.3.26
[THE16] THE YOOX NET-A-PORTER GROUP. scala-uri. THE YOOX NET-A-PORTER GROUP, 2016. Available at http://github.com/NET-A-PORTER/28
scala-uri#scala-uri, version 0.4.14.
[TK11] Efraim Turban and David King. Overview of electronic commerce. Springer Interna-30
tional Publishing, 2011.
[TPSA07] Sandeep Tata, Jignesh M Patel, Computer Science, and Ann Arbor. Estimating32
the Selectivity of tf-idf based Cosine Similarity Predicates. ACM Sigmod Record,36(4):75–80, 2007.34
[TSK05] Pang-Ning Tan, Michael Steinbach, and Vipin Kumar. Introduction to Data Mining,(First Edition). Addison-Wesley Longman Publishing Co., Inc., Boston, MA, USA,36
2005.
[WHF07] Kangning Wei, Jinghua Huang, and Shaohong Fu. A survey of e-commerce recom-38
mender systems. In Service Systems and Service Management, 2007 InternationalConference on, pages 1–5. IEEE, 2007.40
75
REFERENCES
[Yos16] Yoshida, Kenji and Nakamura, Manabu. nscala-time. Organization for nscala-time,2016. Available at https://github.com/nscala-time/nscala-time, ver- 2
sion 2.10.0.
[Yua09] Wenqing Yuan. Research on prototype framework of a multi-threading web crawler 4
for E-commerce. Proceedings - International Conference on Management and Ser-vice Science, MASS 2009, pages 1–5, 2009. 6
[Zah16] Zaharia, Matei. Apache Spark MLlib. Apache Software Foundation, 2016. Availableat https://spark.apache.org/mllib/, version 1.6.1. 8
[ZDH07] Huang Z., Zeng D., and Chen H. A comparison of collaborative-filtering algorithmsfor ecommerce. IEEE Intelligent Systems, 22(5):68–78, 2007. cited By 89. 10
[ZL05] Yanhong Zhai and Bing Liu. Web data extraction based on partial tree alignment. . . .the 14th international conference on World Wide Web, pages 76–85, 2005. 12
[ZS08] Qingyu Zhang and Richard Segall. Web Mining: a Survey of Current Research, Tech-niques, and Software. International Journal of Information Technology & Decision 14
Making (2008), 07(January), 2008.
76

Appendix A
Additional Visualizations of2
Experiments
The following images are an additional visualization of the data (exploratory data analysis) resul-4
tant from the experiments realized in the context of this dissertation. The images are the result of
the proof-of-concept, with the help of GraphStream1 graph library.6
1GraphStream - A Dynamic Graph Library, 2016. Available at http://graphstream-project.org, version1.3.0.
77

Additional Visualizations of Experiments
Figure A.1: Visualization of the Niche Dedicated E-commerce Website category tree.
78
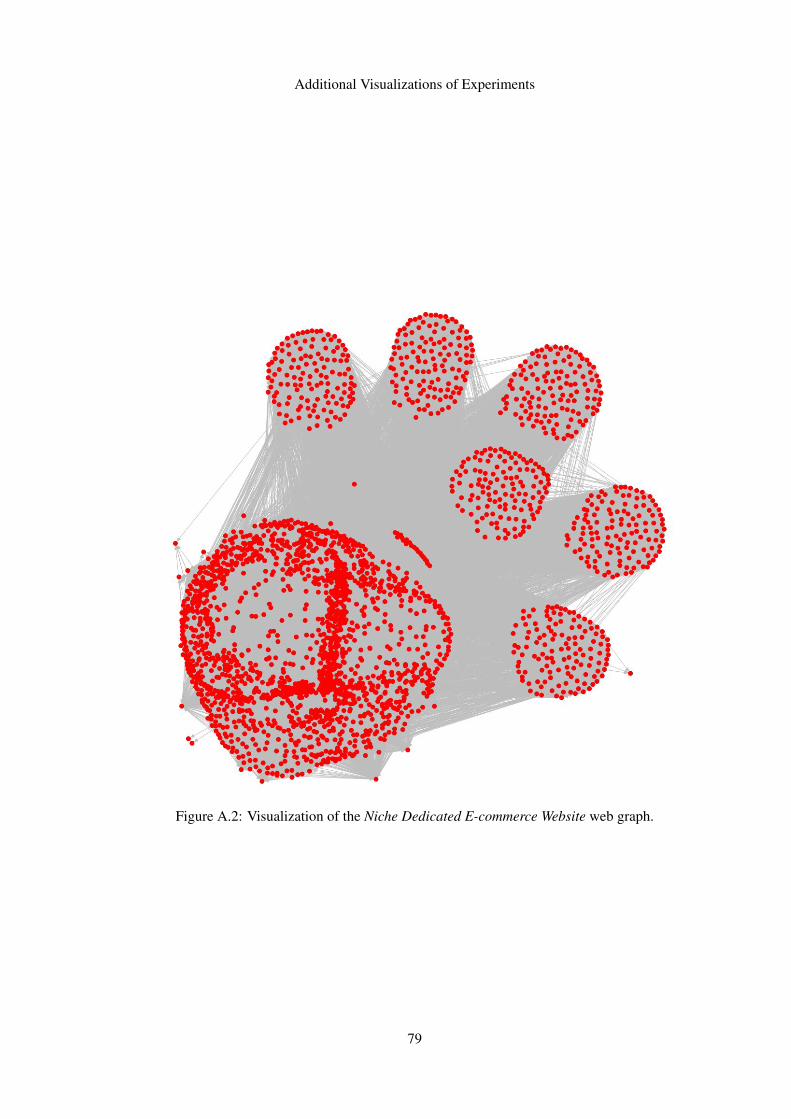
Additional Visualizations of Experiments
Figure A.2: Visualization of the Niche Dedicated E-commerce Website web graph.
79
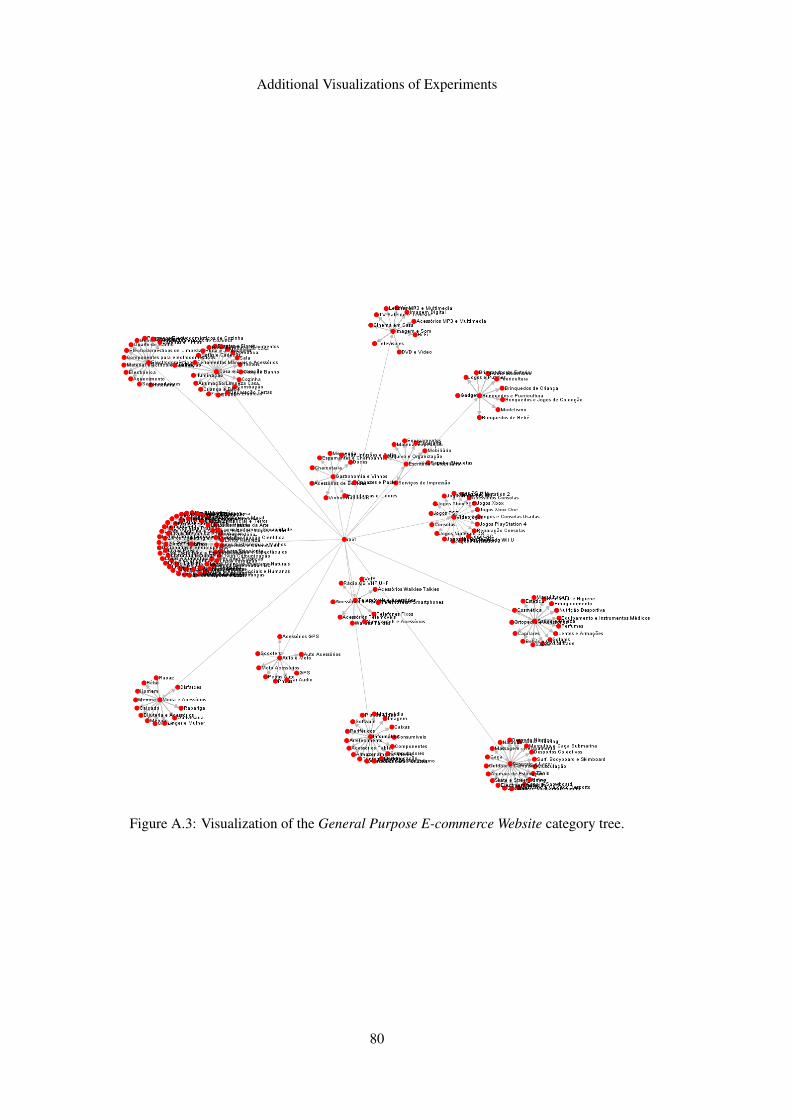
Additional Visualizations of Experiments
Figure A.3: Visualization of the General Purpose E-commerce Website category tree.
80