reverse fdi in europe: an analysis of angola’s ... - cesa
TRANSCRIPT

Carlos Pestana Barros, Bruno Damásio
e João Ricardo Faria
Reverse FDI in Europe: An Analysis of
Angola’s FDI in Portugal
Colecção
Documentos de Trabalho
nº 98
Lisboa 2011

1
O CEsA não confirma nem infirma
quaisquer opiniões expressas pelos autores
nos documentos que edita.

2
Reverse FDI in Europe:
An Analysis of Angola’s FDI in Portugal
Carlos Pestana Barros, Bruno Damásio
e João Ricardo Faria
CEsA
Centre of African and Development Studies
Faculty of Economics and Management
Technical University of Lisbon

3
ABSTRACT
This paper analyses investment from Angola in Portugal. An open economy model with money laundering is
proposed and then tested with a time series Bayesian regression. The result reveals that exports and corruption are
the positive determinants of Angola FDI in Portugal. Policy implications are derived.
KEYWORDS: FDI, Angola, Portugal, corruption and exports.
JEL CLASSIFICATION NUMBERS: F29, O55, F41

4
REVERSE FDI IN EUROPE: AN ANALYSIS OF ANGOLA’S FDI IN PORTUGAL
1. INTRODUCTION
The literature on Foreign Direct Investment (FDI) is large and wide and has examined a number of diverse
issues, among them, to list a few, domestic capital stock (Desai et al, 2005), economic growth (Prasad et al., 2007),
employment protection (Dewit et al., 2009), exports (Helpman et al., 2004), knowledge capital ( Carr et al., 2001),
location choice (Becker et al., 2005), multinational characteristics (Zhang and Markusen, 1999), productivity
spillovers (Barrios and Strobl, 2002), total factor productivity (De Mello, 1999), and technology transfer (Glass and
Saggi, 2002).
This paper contributes to the literature by examining Angola’s FDI in Portugal. This is a new topic in the
literature, since most studies focus on FDI flows from developed countries to poor countries (e.g., De Mello, 1997),
either adopting a micro approach with company data (Alfaro et al, 2010; Gorg, Muhlen and Nunnenkamp, 2010) or
adopting a macro approach with national data (Fernandes and Paunov, 2011). However, the analysis of FDI from
former colonial African countries in the former colonial European ruler has not attracted attention so far.
In our study of Angola’s FDI in Portugal we also assess the impact of corruption. According to IMF Country
Report No. 11/346 from December 2011, Angola’s fiscal accounts have exhibited large residual financing items,
cumulatively equivalent to about US$32 billion (25 percent of GDP) from 2007 to 2010. Angolan authorities put
forward a number of explanations for this unaccounted money; however Human Rights Watch (2011) has identified
a previous major gap in funds, in which more than $4 billion in oil revenues from 1997 through 2002 disappeared,
pointing to mismanagement and suspected corruption. According to the corruption index 2011 from transparency
international [Guardian, 2011] Angola is among the most corrupt countries in the world, ranking 168th in a list of 182
countries.
Theoretically corruption may act as deterrence or as a helping hand for FDI. On the one hand, corruption is
costly for firms (e.g., Murphy et al., 1991), on the other hand, corruption helps firms in the presence of government
failures (e.g., Lui, 1985). Empirically the literature finds evidence that corruption has a negative impact on FDI (e.g.,
Zhao et al., 2003), specifically, Hakkala et al. (2008) find that horizontal investments (sales to the local market) are
deterred by corruption to a larger extent than are vertical investments (which are made to access lower factor costs
for export sales). Egger and Winner (2006) show that the importance of corruption has declined over the years and
that growth of FDI in non-OECD countries is mainly driven by economic growth and change in factor endowments.
In this paper we address the relation between corruption and FDI differently from the above literature. In
our approach corruption is one of the main sources of Angola’s FDI in Portugal. Thus corruption in our theoretical
and empirical framework has the role of causing and stimulating FDI, rather than being an obstacle to FDI.
The motivations for the present research are the following: First, FDI from former colonies in Europe is a
recent event not yet studied and understood. Second, Angola is oil producing African country that is investing heavily
in the former colonial ruler, Portugal. It is rather interesting to analyze Angolan FDI in Portugal since Angola is a poor

5
country, while Portugal is a middle income country, and the flow from capital-scarce country such as Angola to a
relatively richer capital-endowed country as Portugal is an unexpected and curious recent development. Finally,
corruption in Angola is widespread, and as the main Angolan investors in Portugal are related to Angola’s
government officials, based in this motivation we investigate the role of corruption as facilitating these FDI flows.
This paper presents a theoretic model of a commodity producing developing country that invests in the
former colonial ruler. It takes into account money laundering in the open economy framework. Corruption in Angola
is one of the sources of the resources invested abroad, mainly in Portugal. The idea is that corruption in Angola
needs to get out of the country to become legalized. Given the current levels of money laundering monitoring in the
fiscal paradises, illegal money is being invested in real business enterprises, such as the Angolan investment in
Portugal. We test the theoretical model using data from Angola FDI in Portugal with a Bayesian econometrics.
This paper is organised as follows. The next section presents the context of Angola’s FDI in Portugal. The
literature review appears in section three. Then the model is presented in section four, followed by the empirical
methodology in section five, and the test of the model in section six. Concluding remarks are in section seven.
2. ANGOLA FDI IN PORTUGAL
Angola obtained its independence in 1975 after a long war of liberation against the former colonial ruler,
Portugal. However, ideological and ethnic fractionalization ensured that peace did not follow independence, igniting
a brutal, costly civil war that only came to an end in 2002 (Ferreira and Barros, 1998).
Angola changed from a one-party Marxist-Leninist system system ruled by the MPLA, in place since
independence in 1975, to a multiparty democracy based on a new constitution adopted in 1992. In that year the first
parliamentary and presidential elections were held. In the former, the MPLA won an absolute majority. In the latter,
José Eduardo dos Santos, President and the MPLA candidate, won the first round election with more than 49% of the
vote defeating UNITA candidate Jonas Savimbi’s 40%, so that a runoff would have been necessary, but never took
place. The renewal of civil war immediately after the elections, which were considered as fraudulent by UNITA,
created a split situation and the armed forces of the MPLA (now the official armed forces of the Angolan state) and
of UNITA fought each other until the leader of UNITA, Jonas Savimbi, was killed in action, in 2002.
Since the adoption of a new constitution, early in 2010, the politics of Angola takes place in a framework of
a presidential republic, whereby the President of Angola is both head of state and head of government, and of
a multi-party system. Executive power is exercised by the government. The political system adopts the
neopatrimonialism system, with the President of Republic as leader which is common in Africa countries
(Brinkerhoff, 2000). From 2002 to 2010, the system defined by the constitution of 1992 functions in a relatively
normal way. Therefore the semi dictatorial or semi-democratic neopatrimonialist regime exists supported in MPLA
members that dominate the state. The neopatrimonialism is a form of governance in which all power flows directly
from the leader with the blending of the public and private sector. These regimes are autocratic or oligarchic and
exclude the upper and middle classes from power. The leaders of these countries typically enjoy absolute personal
power. Usually, the armies of these countries are loyal to the leader, not the nation (Weber, 1947). Oil rents provide
6
a sufficient fiscal base of the state and thus reduce the necessity of the state to tax citizens. This in turn reduces
political bargaining between state and interest groups, which makes governance more arbitrary, paternalistic and
even predatory. Fourth, the absence of incentives to tax internally weakens the administrative reach of the state,
which results in lower levels of state authority, capacity and legitimacy to intervene in the economy.
Given its exceptional potential wealth thanks to raw materials, particularly oil and diamonds, present-day
Angola, with a democratically-elected government, is well placed to embark upon a process of growth. The country
is currently the world's fourth-largest producer of diamonds and the second-largest producer of oil in Sub-Saharan
Africa, after Nigeria. Output in 2010 reached 590 million barrels, providing 91.94% of Angola's total export revenues.
The present rise of oil prices has boosted the economy's growth to its current 15% annual increase rate. However,
without this rise in the price of oil, growth would decline to small values, which highlights Angola's strong economic
dependency on oil. With the end of the civil war, Angola was in a condition of macro-economic turmoil, with rising
inflation and a devalued national currency (the kwanza). The intervention of the IMF was reinforced in 2000 with the
adoption of a macro-economic stabilization program that has started to achieve its aims. The bank sector is a
potential growth industry financing the present growth rate.
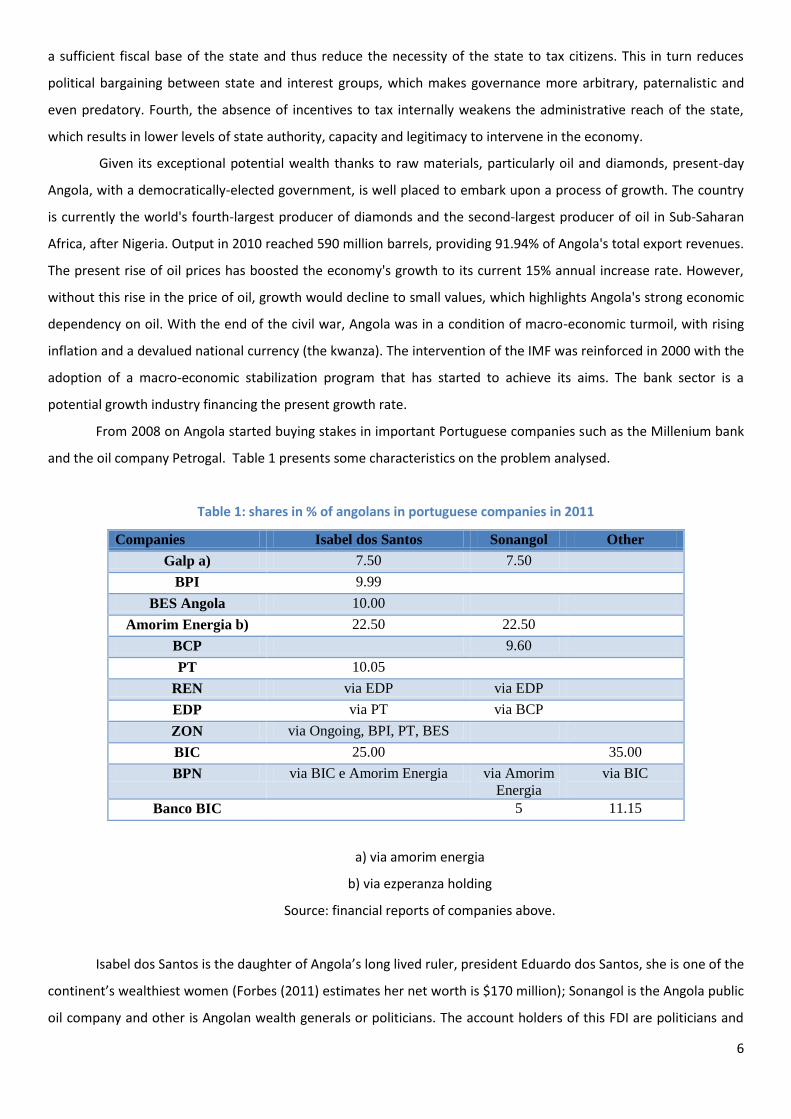
From 2008 on Angola started buying stakes in important Portuguese companies such as the Millenium bank
and the oil company Petrogal. Table 1 presents some characteristics on the problem analysed.
Table 1: shares in % of angolans in portuguese companies in 2011
Companies Isabel dos Santos Sonangol Other
Galp a) 7.50 7.50
BPI 9.99
BES Angola 10.00
Amorim Energia b) 22.50 22.50
BCP 9.60
PT 10.05
REN via EDP via EDP
EDP via PT via BCP
ZON via Ongoing, BPI, PT, BES
BIC 25.00 35.00
BPN via BIC e Amorim Energia via Amorim
Energia
via BIC
Banco BIC 5 11.15
a) via amorim energia
b) via ezperanza holding
Source: financial reports of companies above.
Isabel dos Santos is the daughter of Angola’s long lived ruler, president Eduardo dos Santos, she is one of the
continent’s wealthiest women (Forbes (2011) estimates her net worth is $170 million); Sonangol is the Angola public
oil company and other is Angolan wealth generals or politicians. The account holders of this FDI are politicians and

7
cronies of the rulers of Angola, which suggests that Angola’s political elite capture a big share of the wealth
generated in the country (see appendix 1). The investment is concentrated in banking, oil and information
technologies with many companies quoted in the stock exchange.
3. RELATED LITERATURE
The FDI literature is a trade-based literature that typically focuses on issues such as the interdependence of
FDI and trade in goods and the ensuing industrial structure. For instance, they attempt to explain how a source
country can export both FDI and goods to the same host country. The explanation rests on productivity
heterogeneity within the source country, and differences in setup costs associated with FDI and export of goods. The
trade-based literature on FDI is thus geared towards a firm-level decisions on exports and FDI in the source country
(see Zhang and Markusen, 1999, Carr, Markusen and Maskus, 2001, and Helpman, Melitz and Yeaple, 2004, Razin,
Sadka and Coury, 2003). FDI flows are actually observed only when their profitability exceeds a certain (unobserved)
threshold, taking into account social characteristics such the effect of productivity variables instrumented by capital
per worker and education attainment, financial risks, GDP per capita, population size. These are meaningful variables
for traditional FDI investment but not necessarily for our set up.
Another part of the literature on FDI of our interest relates FDI and corruption (Mauro, 1995; Wei, 1997,
2000; Habib and Zurawicki, 2002; Larrain B. and Tavares, 2004; Al Sadig, 2009; Cole, Elliot and Zhang, 2009). This line
of research finds that corruption lowers investment, and economic growth (e.g., Mauro, 1995, Habib and Zurawicki,
2002). Wei (1997, 2000) finds that corruption deters FDI. Larrain B. and Tavares (2004) found that foreign direct
investment is a robust determinant of corruption. According to Cole, Elliot and Zhang (2009) FDI has a negative
relation with corruption in China intra province relationship, signifying that this relationship is not only observed at
international level but also at a national level.
This brief survey shows that there is consistent research on FDI from developed countries in developing
countries and that corruption has a negative impact in these FDI flows. However, there is no research on reverse
foreign direct investment, i.e., FDI from developing countries in developed countries, which is analysed in this paper.
Moreover, we also assess the role of corruption in developing countries stimulating FDI in rich countries.
4. MODEL
The model introduces Araújo and Moreira (2005) dirty money1 formulation in Faria and Léon-Ledesma
(2005) open economy framework. The representative agent is an Angolan investor with close ties with the Angola’s
political elite as shown in section 2. The open economy model is for a commodity producing, and exporting, country
that makes investments abroad. The representative agent derives utility from the consumption of the domestic good
(c), imported good (c* ), clean real money balances ( 1m ), which captures monetary base, and dirty money ( 2m ). The
1 See, also, Araújo (2006), and for an overview of the literature on money laundering, Masciandaro (2007).

8
illegal origin of 2m can be corruption2. The representative agent produces a single commodity, oil, through a
production given by 1)( RLAY , which in per-capita terms become
1ARy where is the time spent in
the legal, productive sector, A is a vector of exogenous foreign labor and technology and R is the known and fixed
reserves of oil. The exogenous parameter A is associated with foreign investment and foreign technical assistance in
Angola’s oil sector. The agent allocates her savings in foreign bonds (b), which stands as FDI from the country into
the rest of the world, that pay an exogenously given world interest rate (i*).
dtemmzccu t
mmccMax
),(*),( 21
,,*,, 21 ,
subject to
)]()1()1(**[ 21
2
1
11
21 mmxbiccARmmb
(1)
2121 lnln*lnln),(*),( mmccmmzccu (2)
where is the rate of time preference, is the relative price of the foreign good in terms of the domestic
good, i.e., the real exchange rate, and 1x is legal government lump-sum transfers, defined as 11 mx , where is
the exogenous growth rate of money.
Following Araújo and Moreira (2005), the term )1()1( 2
captures the embezzlement of
government transfers given by )1()1( 1
2 x , multiplied by the fraction of government transfers that
escapes anti-money laundering regulation effectiveness given by )1( , where the term 10 is a proxy to the
anti-money laundering regulation effectiveness. The term )1( is the fraction of the agent’s time spent to
deviating illegal government transfers in the form of currency that circulates in the economy as dirty money, 2m .
The parameter 10 is the elasticity between the illegal government transfers and the time allocated to illegal
activity.
The current value Hamiltonian of this problem is:
)]()1()1(**[lnln*lnln 21
2
1
11
21 mmxbiccARmmccH
(3)
where the is the shadow price of private wealth. Optimality conditions are:
00 11 cHC (4)
0*0 1
* cHC (5)
00 11
11
mHm (6)
2 According to Human Rights Watch (2011) “A December 2011 report by the International Monetary Fund revealed that the
government funds were spent or transferred from 2007 through 2010 without being properly documented in the budget. The sum
is equivalent to one-quarter of the country’s Gross Domestic Product (GDP)”.

9
00 11
22
mHm (7)
0])1()1([0 1211 ARH
(8)
*iHb
(9)
The steady-state equilibrium of the model is given by the following equations:
11 c (4’)
1*c (5’)
11
1
m (6’)
11
2
m (7’)
121 )1()1( AR (8’)
*i (9’)
biccAR **1
(10)
)()1()1( 21
2
1 mmx
(11)
This is a block-recursive system of equations. As A, the vector of exogenous foreign labor and technology
given by foreign FDI, aid and technical assistance in the oil sector, and R, the exogenous reserves of oil, are given,
1ARy government
transfers given by )1()1( 1
2 x , which is a proxy for the level of corruption in the country. Then Eqs. (6’),
1m , and 2m . Giv
Eqs. (4’), (5’) determine the steady-state equilibrium values of domestic good c, and imported good c*, finally
equation (10) determines the equilibrium value of foreign bonds b.
It is important to stress that the equilibrium value of foreign bonds b is the endogenous variable of
the empirical model, i.e., the foreign investment of Angola in Portugal. Therefore according to the model Angola’s
investment in Portugal is explained by, among other variables, corruption in Angola, foreign investment and foreign
technical assistance in Angola A, Angola GDP given by its oil production y, and Angolan exports which is a share of y,
and Angola monetary base.

10
5. METHODOLOGY
The model is tested estimating Angola FDI in Portugal with a Bayesian regression model using Bayesian
MCMC. Based in the theoretic model the Angola FDI in Portugal (FDIA) is explained by the (i) Official development
assistance (ODA) Portugal to Angola at constant price (ii) Angola GDP at constant price; (iv) Angola exports (Exports)
at constant price; (v) Total foreign direct investment, net inflows on Angola (FDI); (vi) Money and quasi money M2
(vi) Angola private consumption at constant price. (vii) Angola corruption and (viii) Angola oil production, Vicente
(2010). The variable description and its sources are in the appendix.
The equation to be estimated is:
titOil
itCorrup
itConsump
itM
itFDI
itExports
itGDP
itODA
itFDIA
tFDIA
9872
65
43210
(12)
This linear autoregressive equation is estimated with the Bayesian econometrics (Van der Broeck et al.,
1994).
In classic statistic context, the model parameter has a hypothetical (unknown) true value. Therefore, it is not
considered as a random variable, so it does not have a density. In Bayesian theoretical framework, both variables
and parameters are random vectors. Therefore, for purposes of inference only we are interested in what was
actually observed – Likelihood principle. Conclusively, through the possibility of incorporating not observable
information, we expect to significantly improve the quality of estimates. Because the predictive distribution does not
depend on any parameter we can expose Bayes rule as follows:
| |h y g f y (13)
Where the posterior is proportional to prior distribution times the likelihood distribution. Where, g
is the
prior distribution; |f y
is the population distribution; f y
is the predictive distribution (does not depend on
any parameter); |h y
is the posterior distribution.
Before finding an explicit form of the posterior distribution, we need to specify the prior distribution, i.e., to
materialize our beliefs and convictions. In this vein we chose non informative priors, in the sense that their impact
on posterior is minimal.
In order to complete this section, it is important to clarify that the WinBUGS software (Lunn et al., 2000) will
be used in that task. Prior distributions must be assigned to the parameters. The coefficients (β) follow a non-
informative normal distribution with zero mean and infinite variance9. In the same spirit, a gamma distribution
(0.001, 0.001) is assigned to the white noise variance.

11
6. TESTING THE MODEL
In order to test the model, a data set was organized for the years 2002-2010. Table 2 sumarizes the
characteristics of the data.
Table 2: Characterization of the Variables
Variable Description Mina
Maxb
Mean Std. Dev Expecte
d signs
of the
variable
s
Endogenous variable
FDIA Foreign direct investment of Angola
on Portugal at constant price
2009=100.
0,25 136,02 12,26 31,95
Exogenous variables
ODA Official development assistance from
Portugal to Angola at constant price
2009=100.
-9,85 715,48 50,61 152,58 +
GDP Gross domestic product growth at
constant price 2009=100. -24,70 20,61 5,66 10,18 +
Exp Primary commodities exports at
constant price 2009=100. 2835,4 63268,5 13453,6 16451,3 +
FDI Total foreign direct investment, net
inflows on Angola at constant price
2009=100.
-4,26 40,16 8,27 10,77 +
M2 Money and quasi money (M2) at
constant price 2009=100. 8,48 31,07 14,17 4,91 +
Consum Final consumption expenditure at
constant price 2009=100. 50,92 98,32 72,30 12,92 +
Corrup Control of Corruption index. -1,62 -0,82 -1,19 0,24 +
Oil Energy production in tons 27189 111128 52237 25565 +
1. a Min – Minimum;
b Max – Maximum. Corrup is an estimate (see : www.worldbank.org/wbi/governance), Oil is in
kt of oil, all of restant variables are in 2009 US Milion Dollars
2. Source: ODA and FDI from OECD; all restant variables were taken from World Bank
A Gibbs sampler with data augmentation can be set-up for this model (see Koop et al., 1995, 1997). This
ensures very diffuse prior information.
The results are presented in table 3. From these values it is straightforward to show (using e.g. a t-ratio test)
that the vast majority of parameters are significantly different from zero at a 1% confidence level. Several alternative

12
specification were were also tested using the Deviance Information Criterion (DIC) (Spiegelhalter et al., 2002) but did
not prove to be a better fit.
Based in the results presented in table 3 it is found that the variables that explain Angola FDI in Portugal are
the lagged endogenous variable (FDIA), lagged ODA, lagged exports, lagged total Angola FDI and corruption at one
percent significant level. Furthermore, at five percent significant level two other variables explain Angola FDI in
Portugal, the Angola GDP and Angola Monetary base M2. These results confirm that the sign of each of the
parameters is in line with the theoretical model. For instance, the sign of each of the positive coefficients indicates
that an increase in the associated variable leads to an increase in Angola FDI in Portugal (exports and corruption). A
negative coefficient indicates that the associated variable leads to a decrease in Angola FDI in Portugal (lagged
Angola FDI in Portugal, ODA, GDP and FDI). Private consumption and oil production are statistically insignificants.
The lags were established testing several specification models and using the the Deviance Information Criterion
(DIC), Spiegelhalter et al. (2002), and opting for the best fit.
Table 3: Time Series Data Model Results (dependent variable:FDIA).
Mean SE MC error Ratio t
FDIA t-2 -52,69 5,818 0,2558 -9.056
ODA t-3 -11,1 0,4325 0,003377 -25.664
GDP t-3 -0,9987 0,6127 0,007721 -1.629
Exp t-2 57,77 3,747 0,202 15.417
FDI t-3 -3,687 0,8763 0,03738 -4.207
M2 t-2 1,912 1,095 0,03763 1.746
Cons t-1 -0,7773 0,5746 0,01396 -1.352
Corrup t-4 2,846 0,6049 0,008696 4.704
Oil t-1 2,07 3,703 0,2022 0.559
In bold coefficients significant at 1% and 5%.

13
7. DISCUSSION AND CONCLUSION
This paper is the first to analyze the reverse investment of a former African colony, Angola, in its former
European ruler, Portugal. It presents an open economy theoretical model of reverse FDI in which corruption plays an
important role. A Bayesian model tests the predictions of the theoretical model and shows that exports and
corruption increase Angola FDI in Portugal. Other significant variables that affect negatively Angola’s investment in
Portugal are lagged Angola FDI in Portugal, Portuguese official development assistance (ODA) to Angola, and
Angola’s GDP.
The general conclusion is that exports and corruption are the main determinants of reverse investment of
Angola in Portugal.
As Portugal desperately needs foreign investment due to its current sovereign debt crisis it is not paying
attention to criminal issues related to Angola’s money laundering and corruption. What should the public policy be
in this context? Since Angola’s political elite has benefited from corruption it seems unlike that they would fight
corruption in Angola. Therefore it is the Portuguese government that should minimize corruption practices by
imposing stricter money laundering controls. However, the weak political will displayed in the Portuguese
parliament to restrict corruption in last years combined with financial crisis of public debt that erupted since 2009
and associated need of Portugal for foreign funds, will not result in any sensible ethical FDI policy. More research is
needed to confirm these results and to generalize it to other former colonial countries.

14
8. REFERENCES
Alfaro, L.; Chanda, A.; Kalemli-Ozcan. S. and Sayek. S. (2010) Does foreign investment promote growth?
Exploring the role of financial markets on linkages. Journal of Development Economics, 91, 242-256.
Al-Sadig, A. (2009) The effects of corruption on FDI flows. Cato Journal, 29, 2, 267-294.
Araújo, R.A. (2006) The effects of money laundering and terrorism on capital accumulation and
consumption, Journal of Money Laundering Control 9, 265 – 271.
Araújo, R.A., and T.B. Moreira (2005) An intertemporal model of dirty money, Journal of Money Laundering
Control 8, 260-262.
Becker, S.O., K. Ekholm, R. Jäckie, M. Muendler (2005) Location Choice and Employment Decisions: A
Comparison of German and Swedish Multinationals, Review of World Economics / Weltwirtschaftliches Archiv 141,
4, 693-731
Barrios, Salvador and Eric Strobl (2002) Foreign Direct Investment and Productivity Spillovers: Evidence from
the Spanish Experience , Weltwirtschaftliches Archiv 138, 3, 459-481
Brinkerhoff, Derick W. 2000b. Democratic Governance and Sectoral Policy Reform: Tracing Linkages and
Exploring Synergies. World Development 28(4): 601-615.
Carr, David L., Markusen, James R. and Keith E. Maskus (2001) Estimating the Knowledge-Capital Model of
the Multinational Enterprise, American Economic Review 91, 3, 693-708.
Cole, M.A.; Elliot, R.J.R. and Zhang, J. (2009) Corruption, governance and FDI location in China: A province-
level analysis. Journal of Development Studies, 45, 9, 1494-1512,
De Mello Jr., Luiz (1997) Foreign Direct Investment in Developing Countries and Growth: A Selective Survey,
Journal of Development Studies 34, 1, 1-34.
De Mello Jr., Luiz (1999) Foreign Direct Investment-Led Growth: Evidence from Time Series and Panel Data,
Oxford Economic Papers, Symposium on Trade, Technology, and Growth, 51, 1, 133-151.
Desai, M.A., C. Fritz Foley, J. R. Hines Jr. (2005) Foreign Direct Investment and the Domestic Capital Stock ,
American Economic Review Papers and Proceedings 95, 33-38.
Dewit, G., H. Görg, C. Montagna (2009) Should I Stay or Should I Go? Foreign Direct Investment,
Employment Protection and Domestic Anchorage, Review of World Economics / Weltwirtschaftliches Archiv 145, 1,
93-110
Egger, P. and Winner, H. (2006) How Corruption Influences Foreign Direct Investment: A Panel Data Study,
Economic Development and Cultural Change, 54(2), 459-86.
Faria, J. R., and M. Léon-Ledesma (2005) Real exchange rate and employment performance in an open
economy, Research in Economics 59, 67-80.
Fernandes, A.M, and Paunov, C. (2011) Foreign direct investment in services and manufacturing productivity:
Evidence from Chile, Journal of Developing Economics (forthcoming).

15
Ferreira, M.E., Barros, C.P. (1988) From war to economic recovery: peace as a public good in Angola. Defence
and Peace Economics 9, 283–297
Forbes (2011) 10 African millionaires to watch,
http://www.forbes.com/sites/mfonobongnsehe/2011/11/16/10-african-millionaires-to-watch/3/
Glass, A. J., and K. Saggi (2002) Multinational Firms and Technology Transfer, Scandinavian Journal of
Economics 104, 4, 495-513.
Gorg, H.; Muhlen, H. and Nunnenkamp, P. (2010) FDI liberalization, firm heterogeneity and foreign
ownership: German firm decisions in reforming India. Journal of Development Studies, 46,8,1367-1384.
Guardian, The (2011) Corruption index 2011 from Transparency International: find out how countries
compare,
http://www.guardian.co.uk/news/datablog/2011/dec/01/corruption-index-2011-transparency-international
Habib, M. and Zurawicki, L. (2002) Corruption and foreign direct investment. Journal of International
Business Studies, 33, 2, 291-307.
Hakkala, K.N., P. Norbäck, and H. Svaleryd (2008) Asymmetric Effects of Corruption on FDI: Evidence from
Swedish Multinational Firms, The Review of Economics and Statistics 90, 4, 627-642.
Helpman, Elhanan, Marc J. Melitz, and Stephen R. Yeaple (2004) Export Versus FDI with Heterogeneous
Firms, American Economic Review 94, 1, 300-316.
Human Rights Watch (2011) Angola: Explain Missing Government Funds, State Oil Company is Main Focus of
Investigation, Dec. 20th,
http://www.hrw.org/news/2011/12/20/angola-explain-missing-government-funds
IMF (2011) Country Report No. 11/346, December,
http://www.imf.org/external/pubs/ft/scr/2011/cr11346.pdf
Koop, G., Steel, M.F.J., Osiewalski, J. (1995). Posterior analysis of stochastic frontier
models using Gibbs sampling. Computational Statistics 10, 353–373.
Koop, G., Osiewalski, J., Steel, M.F.J. (1997). Bayesian efficiency analysis through
individual effects: hospital cost frontier. Journal of Econometrics 76, 77–105.
Larrain B., F. and Tavares, J. (2004) Does foreign direct investment decreases corruption? Cuadernos de
Economy, 41, 217-230.
Lui, Francis (1985) An Equilibrium Queuing Model of Bribery, Journal of Political Economy 93, 4, 760–81.
Lunn, D.J., Thomas, A., Best, N., and Spiegelhalter, D. (2000) WinBUGS -- a Bayesian modelling
framework:concepts, structure, and extensibility, Statistics and Computing 10, pp. 325—337
Masciandaro, Donato (2007) Economics of money laundering: A primer, Paolo Baffi Centre Bocconi
University Working Paper No. 171.
Mauro, Paolo (1995) Corruption and growth. Quarterly Journal of Economics, 110, 3, 681-712.
Murphy, K. M., A. Shleifer, and R. W. Vishny (1991) The Allocation of Talent: Implications for Growth,
Quarterly Journal of Economics 106, 2, 503–30.

16
Prasad, E.S., Raghuram G. Rajan, Arvind Subramanian (2007) Foreign Capital and Economic Growth,
Brookings Papers on Economic Activity 2007, 1, 153-209.
Razin, A., E. Sadka, and T. Coury (2003) Trade openness, investment instability and terms-of-trade volatility,
Journal of International Economics, 61, 2, 285-306.
Spiegelhalter, D.J., Best, N.G., Carlin, B.P., van der Linde, A., 2002. Bayesian measures of model complexity
and fit (with discussion). Journal of Royal Statistical Society B 64, 583–640.
Van der Broeck, J., Koop, G., Osiewalski, J. and Steel, M. (1994) „Stochastic Frontier Models: A Bayesian
perspective‟. Journal of Econometrics 61, pp. 273-303.
Vicente, P.C. (2010) Does oil corrupt? Evidence from a natural experiment in west Africa. Journal of
Development Economics, 82, 28—38.
Weber, Max. 1947. The Theory of Social and Economic Organization, trans. A. M. Henderson and Talcott
Parsons. New York: Free Press
Wei, S-J. (1997) Why is corruption so much more taxing than tax? Arbitrariness kills. NBER working paper
6255, Cambridge, MA
Wei, S-J. (2000) Natural openness and good government. NBER working paper 7765, Cambridge, MA
Zhang, Kevin Honglin and Markusen, James R. (1999) Vertical Multinationals and Host- Country
Characteristics. Journal of Development Economics 59, 2, pp.22.
Zhao, J.H., S.H. Kim, J. Du (2003) The Impact of Corruption and Transparency on Foreign Direct Investment:
An Empirical Analysis, Management International Review 43, 1, 41-62

17
Appendix 1: Corruption practices in African countries
Country Firms identifying
corruption as a
major constraint (%
of firms) (1)
CPIA
transparency,
accountability,
and
corruption in
the public
sector rating
(1=low to
6=high) (2)
Corruption (%
of managers
surveyed
ranking this as
a major
constraint) (3)
Corruption
Perceptions
Index
(rank) (4)
d)
Control of
Corruption
(estimate) (5)
e)
Algeria 64,33b) 105 -0,49056125
Angola 75,58e) 2,5 28,9e) 168 -1,336625966
Benin 67,82d) 3,5 6,34d) 110 -0,647749739
Botswana 27,36e) 10,12e) 33 0,857274233
Burkina Faso 70,45d) 3,5 9,74d) 98 -0,441572444
Burundi 19,72a) 2 2,25a) 170 -1,122327411
Cameroon 61,28d) 2,5 7,43d) 146 -0,919503465
Cape Verde 29,77d) 4,5 8d) 45 0,699253775
Central
African Rep
2,5 154 -0,824929844
Chad 67,23d) 2 13,53d) 171 -1,385581635
Comoros 2,5 154 -0,752556892
Congo, Dem.
Rep.
72,65e) 2 2,25e) 164 -1,416682527
Congo, Rep. 65,02d) 2,5 8,7d) 154 -1,217178366
Cote d'Ivoire 74,99d) 2,5 7,55d) 146 -1,163169386
Djibouti 2,5 91 -0,259699471
Egypt, Arab
Rep.
45,2c) 8,08c) 98 -0,413353965
Equatorial
Guinea
168 -1,58438277
Eritrea 2 123 -0,332574588
Ethiopia 23,08a) 2,5 2,91a) 116 -0,714705527
Gabon 41,35d) 10,26d) 110 -0,923691717
Gambia, The 9,78a) 2 0,59a) 91 -0,555368581
Ghana 9,86b) 4 0,28b) 62 0,062688688
Guinea 47,66a) 2 3,12a) 164 -1,227307318
Guinea-
Bissau
44,01a) 2,5 7,51a) 154 -1,124156012
Kenya 38,35b) 3 9,59b) 154 -1,1084088
Lesotho 46,71d) 3,5 14,66d) 78 0,143276776
Liberia 31,19d) 3 11,93d) 87 -0,556744713
Libya 146 -1,095462473
Madagascar 42,71d) 2,5 2,5d) 123 -0,246567563
Malawi 12,83d) 3 2,55d) 85 -0,472675739
Mali 24,81e) 3,5 4,3e) 116 -0,689564695
Mauritania 17,1a) 2,5 1,51a) 143 -0,656720749
Mauritius 50,72d) 2,32d) 39 0,744569397

18
Morocco 27,34b) 85 -0,231493431
Mozambique 25,36b) 3 4,13b) 116 -0,410176922
Namibia 19,14a) 9,57a) 56 0,234245427
Niger 83,73a) 2,5 13,8d) 123 -0,655308774
Nigeria 24,7b) 3 1,87b) 134 -1,065162388
Rwanda 4,35a) 3,5 0,83a) 66 0,125711468
S Tome and
Principe
3,5 101 -0,396749811
Senegal 23,84b) 3 3,82b) 105 -0,528762848
Seychelles 49 0,325770729
Sierra Leone 36,87d) 3 8,61d) 134 -0,978212795
Somalia 178 -1,733629455
South Africa 16,87b) 7,09b) 54 0,102688487
Sudan 172 -1,243900918
Swaziland 24,89a) 5,15a) 91 -0,268559333
Sudan 1,5
Tanzania 19,73a) 3 0,48a) 116 -0,418443721
Togo 70,15d) 2 8,98d) 134 -1,079790221
Tunisia 59 0,017381651
Uganda 23,57a) 2,5 2,45a) 127 -0,871080124
Zambia 12,08b) 4,49b) 101 -0,50559727
Zimbabwe 1,5 134 -1,48936138
1) Percentage of firms identifying corruption as a "major" or "very severe" obstacle.
2) Transparency, accountability, and corruption in the public sector assess the extent to which the
executive can be held accountable for its use of funds and for the results of its actions by the electorate
and by the legislature and judiciary, and the extent to which public employees within the executive are
required to account for administrative decisions, use of resources, and results obtained. The three main
dimensions assessed here are the accountability of the executive to oversight institutions and of public
employees for their performance, access of civil society to information on public affairs, and state capture
by narrow vested interests.
3) Is the share of senior managers who ranked corruption as a major or very severe constraint.
4) This is the ranking from the annual Transparency International corruption perceptions index, which
ranks more than 150 countries in terms of perceived levels of corruption, as determined by expert
assessments and opinion surveys. For more information on this indicator, please visit
http://www.transparency.org/policy_research/surveys_indices/cpi the Transparency International page
on the topic.
5) Control of corruption measures the extent to which public power is exercised for private gain,
including petty and grand forms of corruption, as well as “capture” of the state by elites and private
interests. Further documentation and research using the World Governance Indicators (WGI) is
available at www.worldbank.org/wbi/governance.
a) 2006 data
b) 2007 data
c) 2008 data
d) 2009 data
e) 2010 data

19

20
O CEsA
O CEsA é um dos Centros de Estudo do Instituto Superior de Economia e Gestão da
Universidade Técnica de Lisboa, tendo sido criado em 1982.
Reunindo cerca de vinte investigadores, todos docentes do ISEG, é certamente um dos maiores,
senão o maior, Centro de Estudos especializado nas problemáticas do desenvolvimento económico e
social existente em Portugal. Nos seus membros, na maioria doutorados, incluem-se economistas (a
especialidade mais representada), sociólogos e licenciados em direito.
As áreas principais de investigação são a economia do desenvolvimento, a economia
internacional, a sociologia do desenvolvimento, a história africana e as questões sociais do
desenvolvimento; sob o ponto de vista geográfico, são objecto de estudo a África Subsariana, a
América Latina, a Ásia Oriental, do Sul e do Sudeste e o processo de transição sistémica dos países da
Europa de Leste.
Vários membros do CEsA são docentes do Mestrado em Desenvolvimento e Cooperação
Internacional leccionado no ISEG/”Económicas”. Muitos deles têm também experiência de trabalho,
docente e não-docente, em África e na América Latina.
Os autores
CARLOS PESTANA BARROS
ISEG- School of Economics and Management, and CESA, Technical University of Lisbon, Portugal
BRUNO DAMÁSIO
ISEG-School of Economics and Management, and CESA, Technical University of Lisbon, Portugal
JOÃO RICARDO FARIA
MPA Program, University of Texas at El Paso, USA
Apoio
Centro de Estudos sobre África e do Desenvolvimento
Instituto Superior de Economia e Gestão (ISEG/”Económicas”)
da Universidade Técnica de Lisboa
R. Miguel Lupi, 20 1249-078 LISBOA PORTUGAL
Tel: + / 351 / 21 392 59 83 Fax: [...] 21 397 62 71 e-mail: [email protected]
URL: http://www.iseg.utl.pt/cesa