review, analyze and develop benefit cost/return on ...€¦ · investment equations, guidelines and...
TRANSCRIPT

Final Report UF Project #: 4910 45-04-835
Contract No. BD-013
Review, Analyze and Develop Benefit Cost/Return on Investment Equations, Guidelines and Variables
Ralph D. Ellis, Jr., Co-Principal Investigator Janet Degner, Co-Principal Investigator
William O’Brien, Co-Principal Investigator Gibson Peasley, Co-Principal Investigator
Prepared for: The Florida Department of Transportation
By: Department of Civil and Coastal Engineering
University of Florida
March 2003

2
Table of Contents
Introduction....................................................................................................................... 5 The Florida Department of Transportation Research Program....................................... 5
Objectives of This Research Study.................................................................................. 7 Research Approach........................................................................................................... 7
General Considerations................................................................................................... 7 Research Activities ......................................................................................................... 8
CHAPTER TWO FINDINGS........................................................................................ 10 Literature Review and Current Practice Assessment ................................................. 10
Overview....................................................................................................................... 10 Methods Used by Organizations to Determine Whether a Project Should Be Funded 12
Methods Used by Organizations to Determine the Success of a Project After Completion....................................................................................................................... 18
Efforts of Federal Agencies .......................................................................................... 18 Efforts of State Agencies .............................................................................................. 18
Value Created by Non-Viable Solutions and Basic Science Research ....................... 23 Summary of Current Practice........................................................................................ 25
CHAPTER THREE DEVELOPMENT OF A BENEFIT/COST EVALUATION MODEL ........................................................................................................................... 27 Criteria............................................................................................................................. 27 Benefit Categories ........................................................................................................... 27
General .......................................................................................................................... 27 Qualitative Benefits ................................................................................................... 28 Economic Benefits...................................................................................................... 29 Review of the Draft Evaluation Procedure by FDOT Research Coordinators................................................................................................................ 30 CHAPTER FOUR RECOMMENDED BENEFIT/COST ASSESSMENT MODEL........................................................................................................................................... 32 Introduction..................................................................................................................... 32 The Three Phases of Assessment ................................................................................... 32
Phase 1 Research Period ............................................................................................... 32 Phase 2 Implementation Period .................................................................................... 32 Phase 3 Post Implementation Period............................................................................. 33
Selection of Major Benefit Categories........................................................................... 33 Assessment Structure .................................................................................................... 33 Assessing Qualitative Benefits ..................................................................................... 34 Scoring of Qualitative Benefits..................................................................................... 34 Assessing Economic Benefits ....................................................................................... 35 Resource Management.................................................................................................. 40 Implementation Issues .................................................................................................. 40
CHAPTER FIVE CONCLUSIONS AND RECOMMENDATIONS......................... 41 Conclusions...................................................................................................................... 41 Recommendations ........................................................................................................... 41 REFERENCES................................................................................................................ 43 APPENDIX A INITIAL RESEARCH/BENEFIT EVALUATION REPORT ......... 44

3
APPENDIX B FDOT FEED BACK ON DRAFT EVALUATION FORM............... 54 Participant Comments.................................................................................................... 55 Sample Completed Evaluations..................................................................................... 57 APPENDIX C FINAL RECOMMENDED COST/BENEFIT EVALUATION DOCUMENT................................................................................................................... 64 APPENDIX D BENEFIT/COST CALCULATION EXAMPLES ............................. 71 APPENDIX E DISCUSSION OF IMPLEMENTATION ISSUES ............................ 78 APPENDIX F DRAFT TEXT FOR RESEARCH BENEFIT EVALUATION CONTRACT PROVISION............................................................................................ 84

4
List of Figures Figure 1 Distribution of Funding for the FDOT 2002-2003 Fiscal Year Research............ 6 Figure 2 University of Kentucky Model of Step-by-Step Research Process.................... 10 Figure 3. Additional View of Iterations within Steps 2-4 of Kentucky Model ................ 11 Figure 4 Research Evaluation Process.............................................................................. 19 Figure 5 Assessment Form Structure............................................................................... 33 Figure 6 Research Evaluation Process.............................................................................. 39
List of Tables Table 1 Listing of Qualitative and Economic Benefit Categories .................................... 37 Table 2 Example Research Benefit Evaluation Report Summary .................................... 38

5
CHAPTER ONE INTRODUCTION AND RESEARCH APPROACH
Introduction
The Florida Department of Transportation Research Program
The Florida Department of Transportation (FDOT) has for many years supported an active and aggressive research program. The mission of the research program has been to improve and protect Florida’s transportation system through the ethical scientific conduct of research that increases global knowledge of products, processes, and practices; to transfer information; and to encourage the implementation of research results. Research subjects have included a broad range of technical engineering, scientific, and constructability issues. The research has been largely conducted and coordinated by the FDOT Research Center. Research results are published as Final Reports and are distributed throughout the FDOT and are available to interested individuals and organizations. FDOT sponsored research is performed in the following general areas:
• Construction • Environmental Mgt • Geotechnical • ITS • Maintenance • Operations • Planning
• Public Transportation • Roadway Design • Safety • State Materials • Surveying & Mapping • Structures • Traffic Engineering
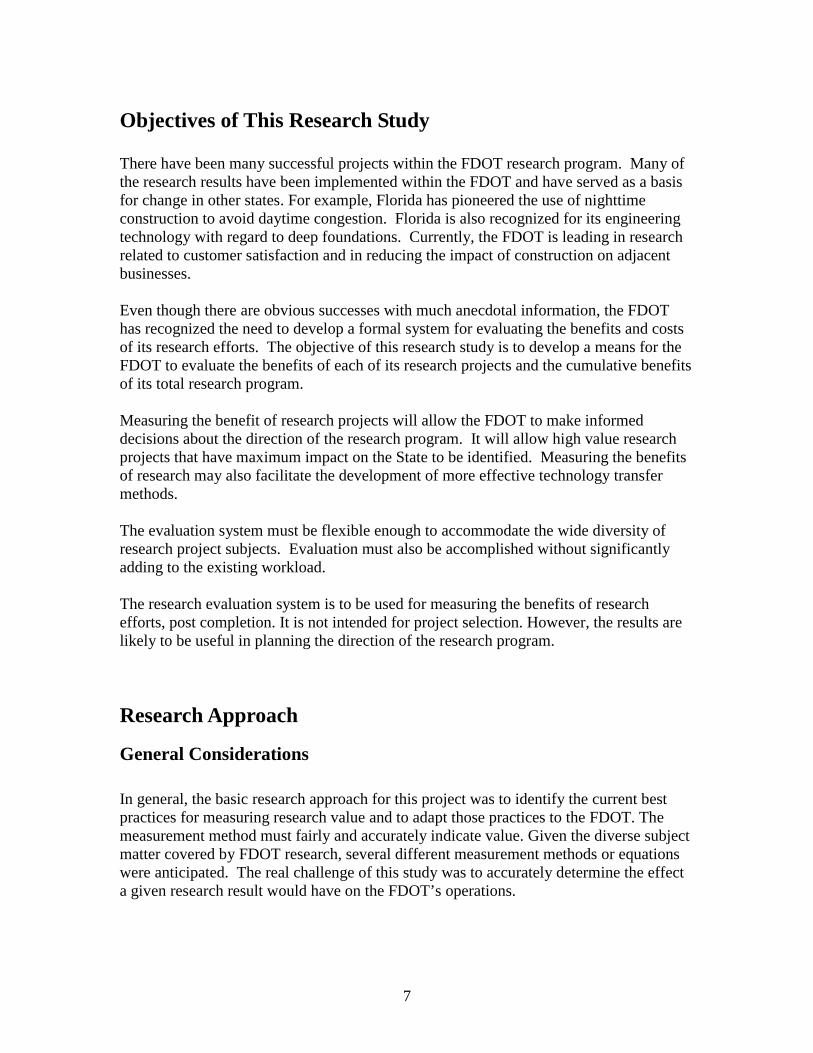
The distribution of research effort for the fiscal year 2002-2003 is represented in Figure 1. The total research effort was funded at $6,924,029. The Materials category received the largest funding share at 34 % of the total funding. Implementation of research results varies considerably depending upon the type of study. For some projects, implementation may consist of simply distributing the information among the appropriate FDOT personnel. On the other hand, some project implementation may require major changes to standards or policies. Training may also be an essential element of implementation.

6
FDOT Research Funding 2002-2003
0
500000
1000000
1500000
2000000
2500000
State M
ateria
ls
Public
Transp
ortati
on ITSTraf
fic Eng
ineeri
ng
Plannin
gEnv
ironm
ental
Mgt
Structu
resGeo
techn
ical
Mainten
ance
Roadw
ay D
esign
Safety
Constr
uctio
nOpe
ration
s
Survey
ing & M
appin
g
Research Category
Fund
ed $
Series1
Figure 1 Distribution of Funding for the FDOT 2002-2003 Fiscal Year Research
7
Objectives of This Research Study There have been many successful projects within the FDOT research program. Many of the research results have been implemented within the FDOT and have served as a basis for change in other states. For example, Florida has pioneered the use of nighttime construction to avoid daytime congestion. Florida is also recognized for its engineering technology with regard to deep foundations. Currently, the FDOT is leading in research related to customer satisfaction and in reducing the impact of construction on adjacent businesses. Even though there are obvious successes with much anecdotal information, the FDOT has recognized the need to develop a formal system for evaluating the benefits and costs of its research efforts. The objective of this research study is to develop a means for the FDOT to evaluate the benefits of each of its research projects and the cumulative benefits of its total research program. Measuring the benefit of research projects will allow the FDOT to make informed decisions about the direction of the research program. It will allow high value research projects that have maximum impact on the State to be identified. Measuring the benefits of research may also facilitate the development of more effective technology transfer methods. The evaluation system must be flexible enough to accommodate the wide diversity of research project subjects. Evaluation must also be accomplished without significantly adding to the existing workload. The research evaluation system is to be used for measuring the benefits of research efforts, post completion. It is not intended for project selection. However, the results are likely to be useful in planning the direction of the research program.
Research Approach
General Considerations
In general, the basic research approach for this project was to identify the current best practices for measuring research value and to adapt those practices to the FDOT. The measurement method must fairly and accurately indicate value. Given the diverse subject matter covered by FDOT research, several different measurement methods or equations were anticipated. The real challenge of this study was to accurately determine the effect a given research result would have on the FDOT’s operations.

8
Research Activities
The research approach involved the following phases: Investigation of Current Practice and Literature A narrowly focused literature search was conducted to seek recent reported developments in measuring the value of research. Additionally, organizations that administer significant research programs were contacted and information about their procedures was obtained. Direct communication with knowledgeable persons within the research organizations is preferred to information gathered through mail out surveys. Email and telephone communication were emphasized. The following is a list of organizations contacted: Other State Highway Agencies Transportation Research Board Federal Highway Administration National Science Foundation U.S. Department of Transportation U.S. Department of Energy Construction Industry Institute U.S. Department of Defense (and branch research offices) Major Research Centers in Canada and Europe The results of this investigation are summarized and presented in the following chapter. Development of Candidate Benefit Measurement Methods Using the information gathered in phase one, the research team developed candidate benefit measurement methods. Input from key FDOT personnel was soughtthrough discussions with the Research Center and with experienced FDOT personnel in the different subject areas. Each different research category was evaluated separately with regard to benefit measurement. In general, measurement methods with the following features were sought:
1. The variables or metrics used must be readily available with the organizational information system.
2. The measurements must be valid. 3. The measurement results must be timely.
The research value measurement issue was reviewed separately with each of the following FDOT research subject areas: Construction Environmental Management Materials and Testing Operations Planning

9
Public Transportation Roadway Design Safety Structures Traffic Operations Where appropriate, unique guidelines and benefit measures were developed for different research subject categories. Review and Testing of Candidate Evaluation Measures Reviews of the candidate measurements were obtained from the FDOT research coordinators in the various functional areas. A joint conference was held with representatives from the functional areas and the FDOT research center staff. . Input from the FDOT functional areas was analyzed, resulting in modifications to the measurement system. A revised measurement assessment protocol was then developed. Each functional area was asked to evaluate two projects as a validation of the measurement process. The completed evaluations were then analyzed and adjustments were made. Preparation of Final Research Report The research activities and results were documented in a Final Report submitted to the FDOT.

10
CHAPTER TWO FINDINGS
Literature Review and Current Practice Assessment
Overview
The literature review for this project included examination of documents from a wide variety of sources. The University of Florida Technology Transfer Center distributed an information request to all of their associate Technology Transfer Centers and other contracts. Numerous responses were received and provided many leads. In addition to reviewing published materials related to research, the research team sent a survey to 27 organizations that fund research. These organizations included private sector (e.g., Alfred P. Sloan Foundation) and public sector (e.g., Army Research Laboratory) organizations. There are many efforts being conducted by a wide variety of organizations to determine how best to spend their research dollars. The process of research itself should be examined first in order to better understand the significance of these review efforts. The following step-by-step model of the research process (Figure 2) was taken from the Kentucky Transportation Center (UK College of Engineering) report, Value of Research: SPR Projects from 1995 to 1999.
Ste-by-Step Research Process
PROBLEMConcerns
IssuesRESEARCH INVESTIGATIONObjectives-Teams -Resources
SOLUTIONFindings
Recommendations
REPORTBriefs
Presentations
WorkshopsGuidelines
SpecificationsTechnical Assistance
IMPLEMENTATION
RESEARCH PROJECT
Figure 2 University of Kentucky Model of Step-by-Step Research Process
The model includes five steps, three of which constitute the body of the research process.

11
Research Investigation
trial hypothesis (Step 2)
Solution Verification
(testing) (Step 3)
Report of viable solutions (Step 4)
Iteration
1. Identification of a problem, concerns or issues 2. Research investigation, formulization and trial of possible solutions 3. Solution, the result of trials in step 2 4. Report, the finds of the investigation are summarized for transmittal to
stakeholders 5. Implementation of report findings by stakeholders
It is worthwhile to look carefully at steps 2, 3, and 4 since this is the actual research process. However the process would not begin without a problem identification (step 1) and would seldom generate easily measurable value without implementation (step 5) Steps 2-4 are more fully described as a repetitive model in figure 3.
Figure 3. Additional View of iterations within steps 2-4 of Kentucky Model It is often the case that the hypothesis is not proven in step 3 of this process. This requires that a new hypothesis be developed (step 2) and the process iterated until a solution that can be implemented is derived (step 4). Most literature focused on two areas of the five steps. There is a large amount of material on how to determine if a project should be funded, which is actual a phase between steps 1 and 2. The literature review found two reports that related to “after the fact” evaluations of project value. These focus on step 5 of the process. Additional information was collect which relates to value generated in steps 2 and 3. It should be noted that steps 2 and 3 do not generate “value” in the normal sense of the word since iterations that produce non-viable solutions cannot be implemented but often provide the basis for future solutions.

12
Methods Used by Organizations to Determine Whether a Project
Should Be Funded
General “Great promise and risk are inherent in the conduct of research. The underlying expectation is that research yields innovative products and practices that will benefit users” (HCHRP Report 382). The problem is how to quantifiably determine the economic return value of a research proposal.
This is challenging, because we do not know how to measure knowledge while it is being generated, and its practical use might not occur until many years after the research occurs and cannot be predicted. For example, today’s global positioning system is the result of research conducted 50 years ago in atomic physics. . . . Since we cannot predict the ultimate practical outcomes of basic research, we must find ways to ensure that the basic research programs that the nation funds generate the kinds of knowledge that have given us great practical benefits in the past. To do that, we must find ways to measure the quality of our current research programs, their contributions to our world leadership in the relevant fields, and their relevance to agency goals and intended users. (Implementing the Government Performance and Results Act for Research: A Status Report)
However, federal and state agencies are becoming aware of the need to evaluate research and are taking adequate steps to establish evaluation criteria for research benefit. The following is a summary of evaluation criteria used by different federal agencies, academic research centers, and state DOTs. The goal is to try to find more effective and efficient methods for evaluating the benefit of research programs.
Efforts of Federal Agencies National Academies Committee on Science, Engineering and Public Policy The Government Performance and Results Act (GPRA), enacted by Congress in 1993, requires that all federal agencies evaluate and report on the results of their activities annually. In 1999, the National Academies Committee on Science, Engineering, and Public Policy (COSEPUP) addressed this issue for research programs in its report, Evaluating Federal Research Programs: Research and the Government Performance and Results Act. That report indicated that federal research programs could be evaluated by a process it called

13
“expert review,” which makes use of three evaluation criteria: quality, relevance, and leadership. 1. Quality
Review of the quality of research via peer review is the most common form of expert review. Peer review is applied throughout the scientific and engineering communities to the work of laboratories and individuals.
2. Relevance
Relevance review is conducted by panels of expert peers who are joined by experts in related fields, potential users of the results of research, and/or other interested members of the public.
3. Leadership
Review of leadership was proposed in the first COSEPUP report as a potentially effective evaluation criterion to test whether research is being performed at the forefront of scientific and technologic knowledge on an international level.
The panel was formed by the National Academy to study how federal agencies that support science and engineering research are responding to GPRA. This panel began its work by examining the GPRA performance reports each federal agency released in March 2000. In sum, the panel determined that it was not possible to provide an “independent assessment” of each agency’s strategic and performance plans. Instead, the panel chose to take a “snapshot” of the current state of affairs; that is, of the level of response to GPRA. The panel ultimately decided to select for review the five agencies that provide the most financial support for federal research programs. The five agencies selected were the National Science Foundation (NSF), National Institute of Health (NIH), Department of Defense (DOD), Department of Energy (DOE), and National Aeronautics and Space Administration (NASA). After a series of focus groups, a workshop, and numerous other communications with agency representatives and oversight bodies, the panel reached the following conclusions: 1. All five agencies have made a good faith effort to develop reporting procedures that
comply with the requirements of GPRA. 2. Some agencies are using the GPRA process to improve their operations. 3. The most effective technique for evaluating research programs is review by panels of
experts using the criteria of quality, relevance, and, when appropriate, leadership. 4. Oversight bodies and some agencies need clearer procedures to validate and verify
agency evaluations. 5. Agencies choose to aggregate their research programs at different levels.
14
6. The development of human resources as an agency objective sometimes does not
receive explicit emphasis or visibility in GPRA plans and reports. 7. Agencies often receive conflicting messages from oversight bodies about the desired
format, content, and procedures to be used in GPRA compliance. 8. Due to timing requirements built into the legal guidelines of GPRA, agencies find that
they must begin work on performance plans before the relevant performance reports are complete.
9. Communication between agencies and oversight groups is not sufficiently regular,
extensive, or collaborative. 10. It is not clear to what extent oversight groups are using GPRA results for
programmatic decisions. On the basis of these observations, the panel offers special recommendations, as follows: 1. Federally supported programs of basic and applied research should be evaluated
regularly through expert review, using the performance indicators of quality, relevance, and, where appropriate, leadership.
2. Agencies should continue to improve their methods of GPRA compliance and to
work toward the goals of greater transparency, more realistic reporting schedules, clear validation and verification of methods, and explicit use of human resources development as an indicator in performance plans and reports.
3. Agencies and oversight bodies should work together as needed to facilitate agencies
integrating their GPRA requirements with their internal planning, budgeting, and reporting processes. In addition, they should work together to adjust the timing of GPRA reporting to capitalize on the value of the planning process.
4. Agencies should strive for effective communication with oversight groups regarding
the implementation of GPRA. For their part, oversight bodies should clarify their expectations and meet more often among themselves to coordinate their messages to agencies.
Much has been learned about the procedures of planning, evaluation, and management in the last several years, and some value will have been gained by the agencies through their own discussion of accountability. However, one key remaining issue is the degree to which oversight groups are using the result of the “result act” for programmatic decision-making. Unless the agency responses to GPRA are useful to Congress in the urgent task of setting priorities and budgeting, the value of the act might not warrant the time and effort it requires of the federal government. But by working more closely than they have

15
in the past, the federal agencies and the oversight bodies can implement the letter and spirit of GPRA in ways that lead to greater efficiency, lower cost, and more-effective research programs that are demonstrably conducted in the national interest. Department of Commerce The U. S. Department of Commerce (DOC) has a normal policy to seek open and full competition for award of discretionary financial assistance awards. Generally, DOC financial assistance is awarded through a merit-based review and selection process whenever possible. The following paragraphs present the current DOC National Institute of Standards and Technology (NIST) approach on how to evaluate and select his applicants for funding . Many NIST programs are supported by separate sections. Each separating unit has its criteria, as addressed in the following. Precision Measurement Grants Program The evaluation criteria to be used in evaluating the abbreviated application proposals and the full proposals follow: 1. The importance of the proposed research – does it have the potential to answer some
currently pressing question or to open up a whole new area of activity? 2. The relationship of the proposed research to NIST’s ongoing work – will it support
one of NIST’s current efforts to develop a new or improved fundamental measurement method or physical standard, or to better understand an important but already existing measurement method or physical standard?
3. The feasibility of the research – is it likely that significant progress can be made in a
three year period with the funds and personnel available? 4. The past accomplishments of the applicant – is the quality of the research previously
carried out by the prospective grantee such that there is a high probability that the proposed research will be successfully carried out?
Each of these factors is given equal weight in the evaluation process. Undergraduate Research Fellowship Program All qualified proposals will be reviewed and ranked by a panel of three NIST scientists appointed by the Program Directors on the basis of the evaluation criteria. 1. Student’s academic ability and commitment to program goals (70%), includes
evaluation of the completed course work; expressed research interest; prior research experience; grade point average in courses relevant to program; career plan; honors and activities.

16
2. Student institution’s commitment to program goals (30%), includes evaluation of institution’s focus on relevant programs; overlap between research interests of the institution of NIST; emphasis on undergraduate hands-on research.
Materials Science and Engineering Laboratory (MSEL) Grants Program. Physics Laboratory Grants Program Chemical Science and Technology Laboratory Grants Program Manufacturing Engineering Laboratory Grants Program The evaluation criteria the technical reviewers use for these grants programs follow: 1. Rationality. The coherence of the applicant’s approach and the extent to which the
proposal effectively addresses scientific and technical issues will be considered. 2. Qualification of Technical Personnel. The professional accomplishments, skills, and
training of the proposal personnel to perform the work in the project will be considered.
3. Resources Availability. The extent to which the proposer has access to the necessary
NIST or other facilities and the overall support to accomplish project objectives will be considered.
4. Technical Merit of Contribution. The potential technical effectiveness of the proposal
and the value it would contribute to the field of material science and engineering and neutron research will be considered.
Each of these factors is given equal weight in the evaluation process. Fire Research Grants Program The technical evaluation criteria includes the following 1. Technical quality of the research (0-35 points) 2. Potential impact of the results (0-25 points) 3. Staff and institution capability to do the work (0-20 points) 4. Match of budget to proposed work (0-20 points) Proposals are evaluated for technical merit based on the above-mentioned evaluation criteria by at least three reviewers. The final approval of selected applicants and award of financial assistance will be made by the NITS Grants Officer.

17
In sum, all of the evaluation criteria used by the current DOC National Institute of Standards and Technology (NIST) is only for the proposal selection stage; there is no further information for measuring the benefit of completed research. US Department of Army, Army Research Laboratory (ARL) The ARL has his own evaluation procedure to conduct research evaluation. 1. The evaluation criteria for proposals include the following:
• The overall scientific and/or technical merits of the proposal
• The potential contributions of the effort to the Army mission and the extent to
which the research effort will contribute to balancing the overall ARL research program
• The proposer’s capabilities, related experience, facilities, techniques, or unique
combinations of these which are integral factors for achieving the proposed objectives
• The qualifications, capabilities, and experience of the proposed principal
investigator (PI), team leader, or other key personnel who are critical to achievement of the proposed objectives
• The proposer’s record of past performance
• The reasonableness and practicality of proposed costs and any fee and the
availability of funds 2. Upon receipt of a proposal, the ARL staff will perform an initial review of its
scientific merit and potential contribution to the Amy mission and also determine if funds are expected to be available for the effort. Proposals not considered to have scientific merit or relevance to the Army’s need or those in areas for which funds are not expected to be available may be declined without further review.
3. Proposals not declined as a result of an initial review will be subjected to peer review
by highly qualified scientists. 4. Each proposal will be evaluated based on the scientific merit and military relevance
of the specific research proposed as it relates to the overall Army program rather than against other proposals for research in the same general area.
Efforts of State Agencies To date, no published information was found indicating a parallel development at the State level, other than the Florida Department of Transportation. However, more state
18
DOTs and research sponsor agencies are realizing the importance of doing such evaluation, although the methods to be used are still being developed.
Methods Used by Organizations to Determine the Success of a Project After Completion
Efforts of Federal Agencies
In an opposite trend, federal agencies seem to be falling behind in consideration of project success measures applied after project completion. Fortunately, some States have been more thorough in this area.
Efforts of State Agencies
The most notable existing efforts to date are from Minnesota, Texas, and Kentucky.
Minnesota Department of Transportation The Minnesota State Department of Transportation conducts evaluation of the benefit of a research project in two phases. The first phase is a formal evaluation procedure. The research close-out memo is completed and signed by two office directors (the requester of the research and the administrator of Mn/DOT’s research program). This close-out memo is completed and signed once the research and implementation are complete. The checklist for the close-out memo covers the following items. • Summary description of the research project, such as explanation of research
problem, research tasks, research time frame, and cost of the project • Summary description of the research results • Summary description of implementation effort, including how to communicate the
results of the research project to people outside the project, and any efforts to apply the research results in the “real world”
• Summary description of the impacts of implementation, concerning the use of the
research results by Mn/DOT or other transportation agencies, the impact of applying the research results in terms of benefits (e.g., cost savings, safety), and the contribution of the research results towards Mn/DOT meeting its strategic objectives
• Summary description of outcome, including research results and their tangible
benefits, whether or not measured, and research knowledge, whether in use, not in use, or not usable

19
The second evaluation phase occurs after the research is completed. The purpose is to try to determine whether the research results are worth implementing and, if they are, how to go about implementing the research results. Implementation issues include the following: • Do the research results solve the problem identified in the initial problem statement
for the project? • Are the results practical for application? • Can implementation of the research results yield benefits such as cost reduction,
increased efficiency, and positive impacts to environment or safety? • In real and measurable terms, what are the costs and benefits of using the findings to
solve the problem? • What is the level of risk associated with realizing the benefits? • How will the implementation be evaluated after the adoption of a new product,
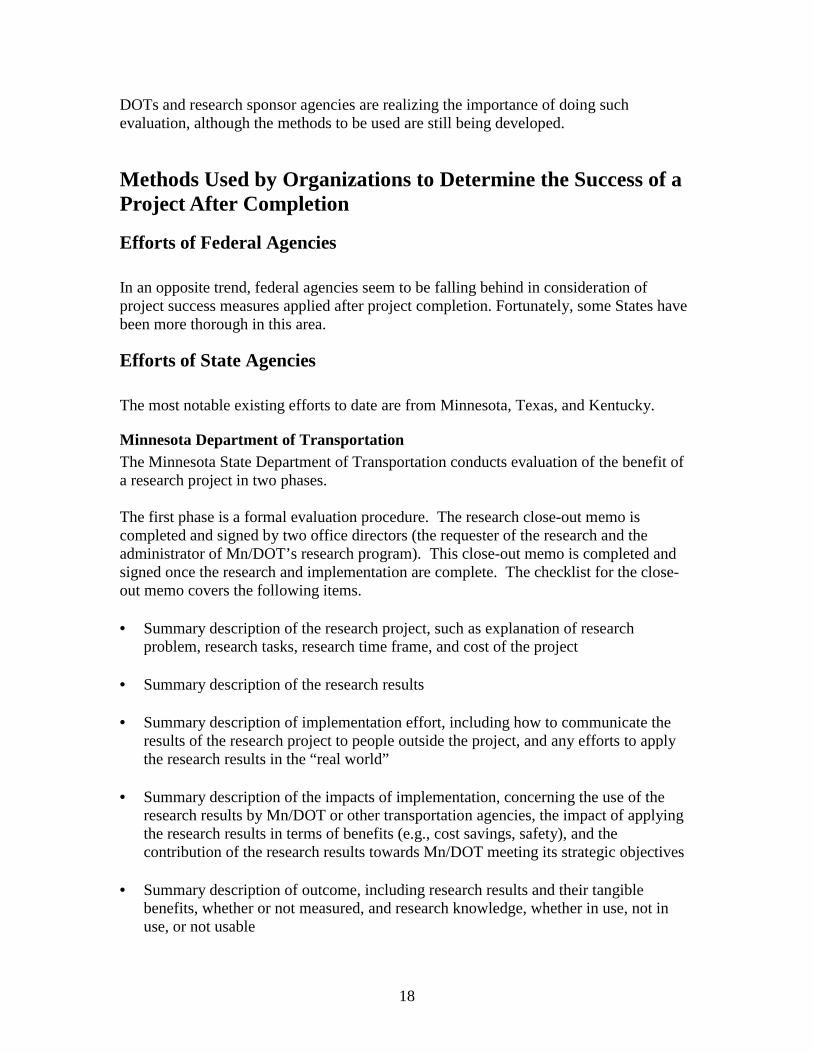
process, or material? Figure 4 shows the research evaluation process used by Mn/DOT.
Figure 4 Research Evaluation Process
Texas Transportation Institute The only publication found that provided a numerical method of evaluating cost/benefit studies for transportation projects is entitled Benefit of Research (research report 1137-1F), by William F. McFarland, 1988. The objectives of this study included the following:
1. Develop techniques for estimating the benefits of research projects. 2. Make estimates of benefits of selected actual research projects. 3. Assist PIs in developing estimates of potential benefits of their research projects.
McFarland’s report provides a wealth of information on the basics of numerical evaluation of benefit-cost ratios. McFarland also provides a rational framework for investigators to evaluate the value generated by their research efforts. Some of the
Propose Research
Conduct Research
Implement Results

20
principle concepts are presented below. McFarland suggests the following steps be used to calculate a benefit–cost ratio: 1. Calculate benefits and costs for a typical implementation situation.
a. Select service life
b. Calculate benefits, usually as benefits to motorists or reductions in department costs
c. Estimate cost to implement this typical project for which benefits are calculated
2. Estimate net benefit per unit (e.g., mile of highway, location, ton, bridge, intersection,
etc.) 3. Estimate the number of units that will be implemented and the time period over which
implementation is expected to take place 4. Determine the cost of the research project and implementation cost 5. Calculate the benefit-cost ratio for the research project by dividing the total actual or
expected benefits by the sum of research and implementation costs The formula suggested to calculate the present worth of benefit for the new research: 1. The formula for calculating the motorist benefits
TPWB = ∑=
N
t 1
PWi,t (VOCt + TCt + ACt)
Where
TPWB = total present worth of motorist benefit for the new research idea in one location where it is implemented, calculate over the analysis period
N = length of the analysis period PWi,t = single payment present worth factor for a discount rate i and year
t , )1(1 i+= t
VOCt = the reduction in vehicle operating costs for the improvement using
the new idea as compared to what the situation would have been without the new idea (the base condition)

21
TCt = the reduction in time costs for the improvement using the new idea as compared to what the situation would have been without the new idea (the base condition)
ACt = the reduction in accident costs for the improvement using the new
research idea as compared to what the situation would have been without the new idea (the base condition)
2. Simplified formula:
TPWB = )(1)(B
ire
nir
−−−
Where
TPWB = total present worth of benefit for the analysis period
n = length of the analysis period
i = annual discount rate
B = annual benefit in year 1
r = y
aLn )( where )(aLn is the natural logarithm of a , and a is the
ratio of benefit in the thy year to benefits in year 1, and y is the future year for which benefits are calculated. The period of the estimate y starts at the beginning of the first year and terminates at the end of the future year
3. Benefit-Cost Ratio:
B/C = TPWB / (TPWCA – TPWCB)
Where B/C = benefit-cost ratio for the improved alternative relative to the base
condition
TPWCA = total present worth of cost for the improvement or “after” alternative
TPWCB = total present worth of cost for the base or existing condition, the
“before” improvement alternative
If 1>CB , the research results should be implemented.

22
4. Net Benefit:
NB = TPWB – (TPWCA – TPWCB)
Where NB is net benefit from implementation of the research results at one location. 5. Benefit-Cost Ratio for Research Study:
The benefit-cost ratio of the project is calculated by dividing the total estimated project benefits by the research and implementation cost, using the following formula.
ICRCNBKNCB
+××=/
Where
B/C = the benefit-cost ratio for a research and implementation
effort
N = the number of “highway units” or “implementation units” for which the research results are implemented
K = an adjustment factor to account for the staged implementation of
the project
NB = the net benefit per “highway unit” or “implementation units” for which the research results are implemented
RC = the cost of the research project
IC = the cost for implementation the results of the research project,
which can be estimated as a given percent of RC
Kentucky Transportation Center In their report Value of Research: SPR Projects from 1995 to 1999, Don Hartman, et al, provide a project by project evaluation of completed projects. The data contained in the report provides research expense, potential savings, and benefit-cost ratios for most projects. The economic data on the potential savings was generated by the PIs and was submitted to Hartman. Hartman had to communicate with the PIs several times to get realistic estimates. Interestingly, one of the projects included in the report was not in the traditional, problem-solution format. In this case, the benefit-cost ratio could not be calculated. Hartman feels that a three-question post project evaluation is appropriate.
23
According to the report, a three-part approach is often used to evaluate research performance:
1. Were the research objectives achieved? 2. Can the benefits be attributed to the solution? 3. Will the solution work in the real world?
However, it is difficult to isolate the benefits of specific research projects because research is intricately related to knowledge in general. It is virtually impossible to attribute a research finding to a single and simple cause. The research result is really a joint product of knowledge in existence at the beginning of the project and knowledge that is learned on the project, and there is no way to separate the influence of these two causal factors.
Value Created by Non-Viable Solutions and Basic Science Research The remaining section covers a more general type of research project, one that does not produce a solution to a problem. Some projects may fail to obtain their objectives, but may still provide value, albeit much harder to evaluate. These projects may provide value in a number of ways:
• They may provide the basis for the next project, such as a project that evaluates only one of several possible solutions.
• They may reveal a non-viable solution and thus prevent further research from being conducted in the area, such as a soil stiffing method that is impractical.
• They may improve some benefit not easily converted to dollars; for example, public art on concrete retaining walls.
The two reports reviewed provide some idea of the attempts being made to improve this type of research effort. The first report is from the field of medicine and provides a macrocosmic view of health care research in general. However, this model could not be used in its current form to evaluate the benefits of transportation research.
“Economic Value of Medical Research” This paper develops an economic framework for evaluating the social benefits of medical research. The paper is organized by the following topics:
1. An economic model for valuing the improvements in health and life expectancy. 2. Estimates of the economic gains associated with past improvements in life
expectancy, as well as prospective estimates of the value of progress against several major categories of disease.
3. A preliminary evaluation and analysis of the returns of medical research.

24
4. A proposal for a more detailed analysis of medical research. The interesting part of the report is the economic framework for valuing improvement to health and longevity. The formula used was developed by Rosen (1988), by assuming that willingness to pay is determined by the expected discounted present value of lifetime utility. Write lifetime discounted utility for a representative individual at age α as
1) ( )∫∞
=α
dtatStltcutHaU ),())(),(()(
In 1) )(tH .is “health”, so we assume that improvements in health raise instantaneous utility from consumption, )(tc , and non-market time, )(tl . ),( αtS is the “discounted survivor function”
2)
−−−= ∫
t
dttSα
ττλαρα )()(exp),(
which reflects both time preference )(ρ and mortality risks via the time-varying instantaneous hazard function )(τλ . If 0=ρ then ),( αtS is just the probability that the agent survives from age α to t . To economize on notation, we do not specify variables that shift the hazard; an obvious factor is health itself, where we expect 'λ H 0)( <τ so that improvements to health reduce the pre-period probability of dying. But it is also reasonable to think of situations in which mortality is changed without improvements in health, as when safety improvements reduce the likelihood of industrial accidents.
The Department of the Environment, Transport and the Regions and the Welsh Office The paper “Evaluating Best Value” is one of a series commissioned by the Department of the Environment, Transport and the Regions and the Welsh Office as part of the program of independent monitoring and evaluation of the pilot program being undertaken by a research team based in the Local Government Center at Warwick Business School (UK). It provides the detail of the methodology by which the Warwick-based research team is evaluating the pilot program. The paper suggests that the aspects of Best Value that are measured depend crucially upon the view that is taken of the intended achievements of the Best Value initiative. A number of common threads, which are selected for evaluation of Best Value, include the following: • Outcomes such as
1. Better service quality
2. Greater community involvement in decision-making in government and, perhaps, in public organizations
25
• Process issues such as
1. Increased efficiency of operation
2. Increased reliability
3. Continuous quality improvement
4. Innovation and adaptiveness in service provision
5. Increased partnership working This paper suggests the need for a methodology that 1. Addresses strategic themes and policy issues, not just operational problems 2. Focuses on the medium and longer term not just the short term 3. Is programmatic rather than exclusive project-based 4. Informs policy formulation rather than simply monitoring policy implementation 5. Is prospective rather than retrospective 6. Feeds findings regularly back into the policy-making process 7. Has an interdisciplinary and interorganizational focus 8. Fosters a dialogue between policy makers, practitioners, and academics
Summary of Current Practice
The literature review showed that there are several ongoing efforts, at state, national, and international levels, to improve research value. However, the choice of how to determine project success is not as simple as computing a benefit-cost ratio. Analysis of the information obtained concerning current practice with regard to evaluating the results of research provides the following observations:
• Considerably more attention has been given to the issue of selecting projects to fund for research than to evaluating the benefits of research.
• Peer or expert review panels appear to be the most common selection protocol.

26
• Reasonably good models have been developed for the quantification of the economic benefit of research, where the research results in a reduction in the cost of providing a facility or in a reduction in the cost of operating a facility. However, other more subjective benefits, such as the quality of use, are not so easily quantified. Further, the question of how to measure the “knowledge” benefit of research remains largely unanswered.
• Clearly, the value of research is composed of directly quantifiable economic
benefits and of other benefits not directly measured in economic terms. Therefore, any system used to evaluate the benefits of research must consider the non-economic benefits as well as the economic benefits.
• Many non-numerical factors must be considered to ensure a balanced and
successful research program that meets customer needs while providing the innovation needed to produce success in the future.

27
CHAPTER THREE DEVELOPMENT OF A BENEFIT/COST EVALUATION MODEL
Criteria The research evaluation process must meet three fundamental requirements. The variables or metrics used must be readily available within the organizational information system. Adding the requirement to generate and collect additional data increases the burden on the organization. Whenever possible, data that already exist within the system should be utilized. The measurements must be valid. The evaluations must provide reasonably precise indicators of performance. The system should include validation of reported information. The measurement process must provide a balanced assessment. Given the diverse nature of the FDOT’s research projects, using a single metric such as cost savings would exclude many important other benefits. Clearly, the evaluation metrics must include both monetary and other, qualitative benefits. The set of benefits should be inclusive rather than exclusive.
Benefit Categories
General A synthesis of best practices and discussions with FDOT researchers and research managers indicated that there are potentially many different benefits derived from research. However, the fundamental division is between qualitative benefits and economic benefits. Several different benefit forms exist within each of these major categories. The development of an evaluation process is facilitated by the use of a categorical structure with regard to benefits. Additionally, the original approach was to customize a unique set of possible benefits for each different FDOT research functional area. These functional areas are listed as follows:
1. Construction 2. Environmental Management 3. Materials and Testing 4. Operations 5. Planning 6. Public Transit

28
7. Roadway Design 8. Safety 9. Structural Engineering 10. Traffic Operations
The objective was to be as inclusive as possible and to provide each functional area with a mechanism to capture the benefits of their research efforts. The initial version of the benefit evaluation form is enclosed as Appendix A.
Qualitative Benefits
Categories Qualitative benefits are those benefits that may not be directly quantifiable in economic terms. Research often produces benefits other than economic value. These benefits relate to the general welfare and quality of our community life. Measuring these benefits is a subjective process. Nevertheless, these are real benefits, and they should be recognized. Therefore, the research team has suggested including qualitative benefits in the project assessment process. The following general categories of qualitative benefits were included in the initial evaluation format:
• Improvements to Knowledge Base • Improvements to FDOT Infrastructure (Organizational and Process Structures) • Improvements to Quality of Life • Improvements to FDOT Management and Policy
It is true that for some of the typically qualitative benefits, models have been developed to quantify the benefits in economic terms. For example, safety benefits are sometimes computed by estimating the cost of accidents that have been avoided. Given a sufficient incentive, we may see economic models developed for qualitative items such as aesthetic beauty. However, this approach seems to miss the point. Many project qualitative research benefits produce value because of the very nature of the benefit itself, whether or not we can devise a way to equate the benefit to money.
Scoring The approach taken by the research team was to consider all benefits as equal in value. The following numerical scale was included in the initial evaluation form.
1 = Project Did Not Meet Expectations 2 = Project Meets Expectations 3 = Project Exceeds Expectations
Evaluation consisted of scoring the project with regard to specific benefit listing in each of the functional areas.
29
Economic Benefits General Approach Generally, the approach is to determine the savings per unit by comparing the cost prior to implementation with the expected cost after implementation. Total savings is estimated by multiplying the unit savings by the estimated total number of units. Future cost savings should be converted to present values using appropriate interest rate values (this rate is the value established and used by the FDOT for all planning calculations). The calculation can be expressed as follows: Estimated Cost/Benefit Ratio = Present Value of Total Savings Present Value of Cost of Research Total Savings = [Savings per Unit x Estimated Number of Units] – Cost of Implementation
Economic Benefit Categories With the initial evaluation format, an attempt was made to provide a customized economic calculation method for each different functional area. The different economic benefit categories that were utilized are as follows: Improved Work Efficiency Research results that offer improvements in organizational productivity. The cost savings generally result from a reduction in labor-hours and/or equipment hours to accomplish an activity. This category is designated for the FDOT and its consultants. Construction contract work activities are included in a separate category. Reduced Material Costs Research results that offer reduced material cost for materials purchased directly by the FDOT. Reduced User Cost Research results that reduce the cost to the transportation user. Reduced Maintenance Cost Research results that reduce the cost to maintain FDOT facilities. Reduced Construction Cost Research results that reduce the cost of construction purchased by the FDOT through its construction procurement system. Reduced Operational Cost Research results that reduce the cost to the FDOT for the operation of its facilities.
30
The general approach for estimating the cost savings is the same regardless of the type of economic benefit. The computational differences arise in the details of pricing the savings per production unit and in estimating the number of future units.
Research Cost The direct cost of research is, in most cases, just the cost of the research contract to the organization performing the research. Less frequently, the FDOT may contribute direct cost support to the research project. Direct cost contributed by the FDOT should be included in the research cost total. The initial evaluation form provided for including the total cost of research in the Benefit / Cost calculation.
Implementation Cost Implementation costs vary depending upon the nature of the research product. The approach initially suggested was that all cost should be estimated and included. Normal FDOT overhead type costs probably should be excluded from the calculation. What we are looking for here is additional direct cost the FDOT incurred to implement the research result.
Review of the Draft Evaluation Procedure by FDOT Research Coordinators
Distribution to FDOT Functional Areas Draft copies of the evaluation forms were distributed to all of the previously noted FDOT functional areas. Managers were asked to comment on the proposed draft evaluation process. Additionally, managers were asked to select two of their previously completed research projects and to perform an evaluation of the projects using the proposed forms.
FDOT Feedback Reaction to the evaluation document was somewhat predictable. In general, most of the FDOT personnel saw the proposed research benefits evaluation process as another work burden, which, of course, it is. Clearly, the case for the need to perform this additional work had not yet been sufficiently made. However, although the feedback provided useful information concerning specific elements of the evaluation form that were unclear or needed editorial correction, no one said that the evaluation process would not work or that it could not be done. One of the more positive comments is repeated here:
Overall, the process that you have outlined appears to be reasonable and logical, although several areas are duplicative and unclear. I believe the approach to be one that the project manager and principal investigator should be able to complete in a reasonable amount of time without undue efforts, unless significant time has passed from the time of the completion of the research project.

31
The biggest weakness of the proposed evaluation format appeared to concern the calculation of the estimated cost/benefits. The respondents had difficulty estimating the cost of future benefits. A listing of comments and examples of completed draft evaluation forms are included in Appendix B of this report.
Conclusions Concerning the Draft Evaluation Format The following conclusions were developed from a review of the FDOT comments and from discussions held in meetings with the FDOT functional area research coordinators.
• The inclusion of both qualitative and economic benefits was acceptable. • The form was too long and too complex. • The respondents need training and additional resources for calculating economic
benefits.

32
CHAPTER FOUR RECOMMENDED BENEFIT/COST ASSESSMENT MODEL
Introduction Acting on the critiques of the draft evaluation process, the research team made revisions to the proposed evaluation process. This chapter presents a discussion of those revisions and the final recommended research benefit assessment process. Note that the recommended Research Benefit Assessment Document is included in Appendix C.
The Three Phases of Assessment
Phase 1 Research Period
The first phase of the evaluation process occurs during the performance of the research project. Researchers must be informed of the requirement to complete a Research Benefits Report so that they can identify potential benefits and collect cost information. This task should be accomplished by making appropriate modifications to the standard research contracts requiring the research contractor to prepare and submit a Research Benefit Evaluation. See appendix F for a draft version of the contract provision. Additionally, appropriate training must be initiated to insure that both FDOT managers and new researchers are capable of performing the required assessments. At the conclusion of a research project, a research benefit assessment will be made by the principal investigator and the FDOT research coordinator. The FDOT research center will review the assessment for validity and accuracy. However, benefit assessments done prior to implementation of research results are only an estimate of potential benefits.
Phase 2 Implementation Period
Of course, implementation is critical. Very little benefit can be achieved without some measure of implementation. Each project should conclude with an implementation plan developed by the Principal Investigator and approved by the FDOT research manager. Implementation plans should contain specific action items including what must be done and when it must be done. Successful implementation also requires the designation of a manager who is responsible for the implementation effort. Accountability is a key ingredient of successful implementation. Implementation is discussed in depth in the next chapter of this report.

33
Phase 3 Post Implementation Period
The true measure of research benefit can only be obtained after implementation. Therefore, it is essential that post-implementation benefit assessment be performed. The exact timing is likely to be dependent upon project specific issues. However, implementation should be complete and a representative amount of production should have occurred.
Selection of Major Benefit Categories
Assessment Structure
The assessment structure was redesigned to provide a simpler, easier to complete document. All qualitative benefit assessments are completed in one section regardless of the functional area. The qualitative benefit categories were refined to a set of common benefits that are potentially applicable to any of the FDOT functional areas. Rather than offer a unique cost/benefit calculation structure for each functional area, an open process was selected. General instructions concerning the cost-benefit estimate principles are provided, and the research team is left to develop a benefit calculation that is appropriate for the specific research product. Figure 5 presents the layout structure of the assessment form.
Figure 5 Assessment Form Structure
Benefit Summary
Economic Benefit Assessment
Qualitative Benefit Assessment
General Project Information
34
Assessing Qualitative Benefits
The revised listing of qualitative benefits includes the following five categories. Level of Knowledge Improving the body of knowledge in key areas of interest. There is an organizational and social benefit acquired when we learn more about the world we live in. Additional knowledge may improve our understanding of technical design issues, leading to gains in safety and reliability. Increased understanding also serves as the foundation for future research developments. Knowledge may also improve the quality of our management and policy decisions. Safety Many research efforts are focused on improving safety. This may involve safety for the users of the transportation systems, for FDOT personnel, and for FDOT contractors. Although reasonably good methods exist for computing the economic benefit of accident reduction, safety remains a key qualitative benefit and is therefore included. Included also in this category are improvements to design methodologies, which increase user safety. Quality of Life Many qualitative factors add to the quality of life of the residents and visitors to Florida. They include improvements to the psychological and physical comfort of the transportation users, to security, and to the aesthetic quality of facilities. Environmental This category of benefits includes all improvements to and protection of the natural environment. Management and Policy This category includes research results, which assist management in providing improved efficiency and effectiveness of organizational management activities, and for more informed policy decisions. For example projects which provide upper organizational management with information on subjects of concern. As a result, managers are able to make better, more informed decisions.
Scoring of Qualitative Benefits
All qualitative benefits are scored on a scale of 1 to 5 (see table below for explanations). 0 = Absolutely no benefit in this category. 1 = There is some slight benefit in this category. 3 = Project is partially successful in providing a positive benefit in this category. 5 = Project clearly provides a strong positive benefit in this category.

35
Recognizing the unavoidable subjective nature of this type of evaluation, a requirement to provide a narrative explanation of the specific benefit is suggested for items scored 3 or higher. This requirement to specifically describe the benefit will serve to improve communications and assist both the researchers and the FDOT research center in understanding the source of the qualitative benefit.
Assessing Economic Benefits
Revised Format The economic evaluation format was revised to request that each research team provide a cost savings calculation appropriate for the specific research product of the study, rather than attempt to provide a customized cost calculation structure for every possible research product. This open-ended approach is believed to be the best way to handle the cost calculation process because of the wide variety of project results and possible economic benefits.
General Approach Generally, the approach is to determine the savings per unit by comparing the cost prior to implementation with the expected cost after implementation. Total savings is estimated by multiplying the unit savings by the estimated total number of units. Future cost savings should be converted to present values using appropriate interest rate values (this rate is the value established and used by the FDOT for all planning calculations). The calculation can be expressed as follows:
Estimated Cost/Benefit Ratio = Present Value of Total Savings Present Value of Cost of Research
Total Savings = [Savings per Unit x Estimated Number of Units] – Cost of Implementation
Cost of Research The research cost should include the following components:
• Direct cost of the research contract to the performing organization • Direct cost of any direct support provided by the FDOT • Indirect cost of project administration by the research c enter
These cost components can be determined by the FDOT research center.
Calculating the Value of Total Savings Step by Step Procedure This calculation includes the following steps:

36
1. Determine the appropriate production unit.
2. Estimate the cost savings for one production unit.
3. Estimate the number of production units for each of the next five years.
4. For each of the next five years, calculate the cost savings and the product of the unit cost savings and the number of estimated units.
5. Determine the present value of each of the total annual savings.
6. Calculate the net total savings by subtracting the total cost of the research project
and its implementation from the total present value of the annual savings. Selecting Appropriate Units Total savings is estimated by multiplying the unit savings by the estimated total number of units. The first step is to determine the appropriate unit of production. For constructed infrastructure items, the unit of production should be the unit currently used for planning and cost estimating purposes (e.g., tons of asphalt, cubic yards of concrete, lineal feet of piling, lineal feet of drainage pipe). Operational cost savings may be equated to appropriate traffic volume measures. For design activities, the number of designs or design calculations can be used as a unit. Estimating the Unit Cost Savings The unit cost savings is estimated by comparing the unit cost prior to implementing the research results with the unit cost after implementing the research results. Performing this comparison requires a detailed estimate of costs. Depending upon the specific subject, the cost estimate may include labor, equipment, and material costs. The best pricing available should be used. Investigators and research coordinators are encouraged to utilize the resources of the FDOT Estimates section when preparing detailed cost estimates. Estimating the Number of Future Units First, the use of a 5 year useful life for the research benefit is recommended unless there is a strong indication that the benefits will have a longer life. Most estimates of future units can be made on the basis of the FDOT five-year work plan. For example: Estimated Units in Year 1 = Units in Current Year x Program Budget for Current Year Program Budget or Year One The same calculation is performed for years two through five. Projecting future units on the basis of planned program growth is a basic estimating tool. If more specific information is available for special items, the more precise information should be used. Obviously, user volumes are estimated using growth models commonly used in transportation planning.

37
Present Value Future and past costs need to be converted to Present Values using the appropriate time value of money factors. The interest rate used should be the rate used for FDOT planning purposes. Example Calculations Representative example calculations are provided in Appendix D. Table 1 provides a listing of the qualitative and economic benefit categories. Table 2 provides an example of the a suggested reporting summary format for research program benefits.
Table 1 Listing of Qualitative and Economic Benefit Categories
Qualitative Benefits Economic Benefits
Improvements to Level of Knowledge Improvements to Safety Improvements to Quality of Life Improvements to Management and Policy Improvements to Environment
Improvements to Work Efficiency Reduced Material Costs Reduced User Costs Reduced Maintenance Costs Reduced Construction Costs Reduced Operational Costs

38
Table 2 Example Research Benefit Evaluation Report Summary
Construction Environmental Geotechnical ITS Maintenance Public
Transportation Total Research Funds ($) $260,000 $420,000 $395,000 $650,000 $300,000 $700,000 Qualitative Benefits Percentage of Total Funding 3.82% 6.17% 5.80% 9.55% 4.41% 10.29% Level of Knowledge 24 45 38 56 24 46Safety 24 40 32 58 22 38Quality of Life 4 48 4 41 18 20Environmental 20 12 4 24 8 14Management and Policy 4 12 45 21 10 10Total Qualitative Contributions Score
80 189 135 232 86 136 Economic Benefits Total Economic Contribution $9,743,750 $5,520,660 $9,001,400 $5,524,800 $6,500,400 $8,902,000
39
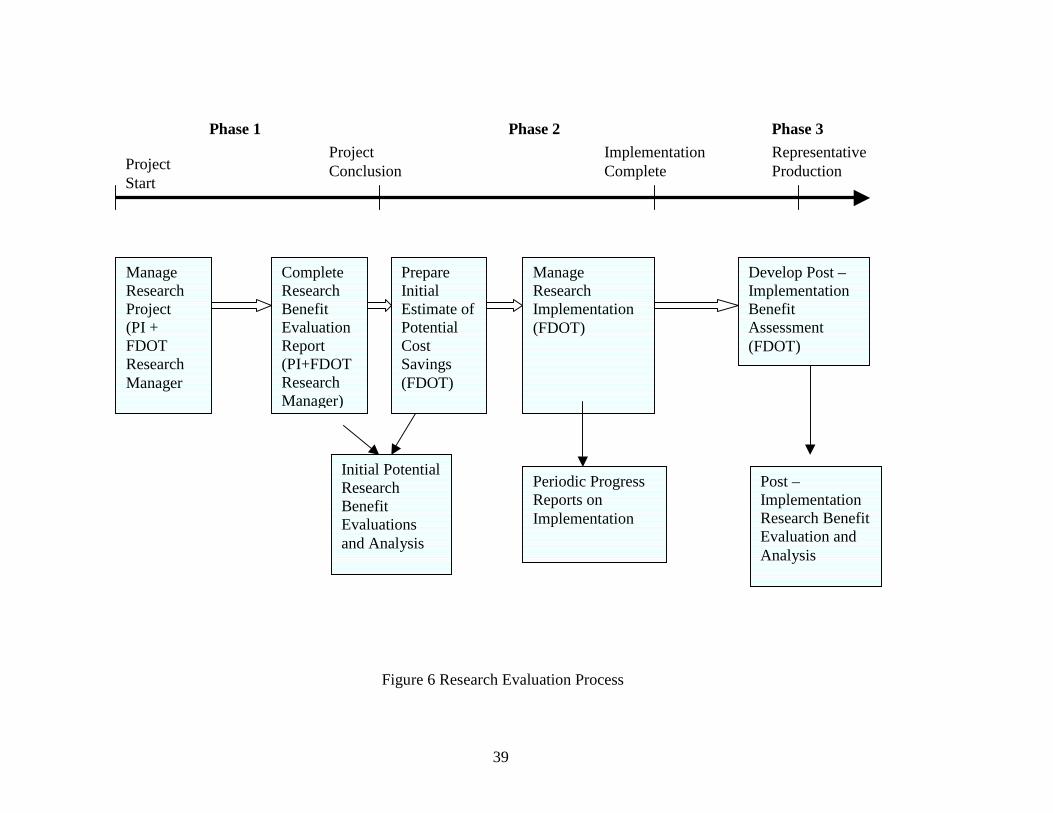
Figure 6 Research Evaluation Process
Complete Research Benefit EvaluationReport (PI+FDOT Research Manager)
Prepare Initial Estimate of Potential Cost Savings (FDOT)
Manage Research Implementation (FDOT)
Develop Post – Implementation Benefit Assessment (FDOT)
Manage Research Project (PI + FDOT Research Manager
Project Start
Project Conclusion
Implementation Complete
Representative Production
Initial Potential Research Benefit Evaluations and Analysis
Post – Implementation Research Benefit Evaluation and Analysis
Periodic Progress Reports on Implementation
Phase 1 Phase 2 Phase 3

40
Resource Management
Developing a system to reliably track and evaluate research costs and benefits will require the allocation of additional FDOT personnel resources. Although some additional reporting can be obtained from the Principal Investigators and FDOT Research Managers, a significant amount of additional work will remain to be accomplished. The key activities requiring additional personnel resources are as follows:
Data Entry Activities Research Implementation Facilitation and Tracking Post Research Implementation Benefit Assessment
Developing a personnel resource staffing plan is beyond the scope of this project. However, it is essential that the requirement be recognized and addressed. The out-sourcing of at least a portion of this activity may be a viable alternative. This option is discussed in a separate document on Implementation.
Implementation Issues
Clearly, little research benefit can be gained without implementation. Therefore, implementation must be considered when developing a research benefits assessment program. Generally, the accepted requirements for implementation success include the following:
• Organizational Support (Including Top Level Support) • Development of an Implementation Action Plan • Assignment of Responsibility and Accountability • Allocation of Required Resources • Assessment of Implementation Progress
Project implementation planning should begin with the project research team’s development of a preliminary implementation plan. This plan should be developed at the conclusion of the project and should be tied to the development of the Research Benefit Assessment. The assumptions used to develop the estimate of future benefits should be supported by specific implementation activity. Additionally, the initial implementation plan will serve to facilitate the post implementation assessment of benefit. Implementation remains a challenge for most research organizations, including the FDOT. Limited availability of resources appears to be one of the main obstacles. Appendix E includes a discussion of implementation issues and suggestions for improving the FDOT’s research implementation efforts.

41
CHAPTER FIVE CONCLUSIONS AND RECOMMENDATIONS
Conclusions Research Benefits and Cost Should be Measured Assessment provides many advantages, including the following:
• Justification and support for future investment • Input into research program planning decisions • Input into project selection decisions • Motivation for improved research performance on projects • Assistance with implementation activities
Research Benefits Can Be Measured Both economic and qualitative benefits can be assessed. A viable assessment document has been developed and is included in this report. Qualitative and Economic Benefits Should be Included in the Benefit Assessment Research projects produce economic benefits and benefits that are not related directly to economic benefit. The best approach is to be inclusive and capture both forms of benefits in the measurement system. The Initial Assessment of Potential Research Benefit Should be Made by the Research Team The research team is most familiar with the subject and the specific research product. The FDOT may provide oversight and support for this activity, but the research team must take the lead in developing both the initial benefit assessment and the implementation plan. Note that in this context, the FDOT research project coordinator is included in the research team. Follow-up Assessments Are Required After Implementation Initial benefit projections can only provide an estimate of the potential benefit. Real benefits can only be measured after implementation. Depending upon available resources, follow-up assessments may be limited to selected projects. Implementation Remains a Critical Factor in Realizing Research Benefits Research benefits are achieved through implementation of results. Implementation must remain a key focus.
Recommendations The research team for this project specifically offers the following recommendations to the FDOT. Adopt on a Trial Basis the Recommended Research Benefit Assessment Process Certainly, improvements are possible. However, the research team recommends that the assessment process outlined in this report be tried on active projects prior to revision decisions.

42
Implement on a Trial Basis the Suggested Research Benefit Assessment Process Include the benefit assessment requirement on selected existing research projects. The research center can introduce this requirement to the existing contracts by scope modification. The suggestion is that this be a formal contract deliverable. Existing projects are recommended so that the results can be obtained earlier. At the conclusion of the trials, review the results and consider appropriate revisions. Implement a Program Wide Research Benefit Assessment Process Based upon the results of the trial implementation, the FDOT should implement a research benefit assessment process for all of its research activities. Develop a Practical Guide for Estimating the Cost of Future Research Benefits What is needed is a practical manual that expands upon the calculation examples provided in this report. The manual should provide information about how to located reliable cost resources within the FDOT and externally. Representative sample calculations and approaches to estimating economic values should be provided for the different research products in each functional area. Develop a Training Program for Researchers and FDOT Personnel An orientation/training program should be developed to insure that the participants have a common understanding of the program and can properly develop the assessments. Support a National Initiative to Implement Research Benefit Assessment in Transportation The FDOT should support efforts to encourage a national initiative to implement research benefits assessments on transportation research. One option is to promote a national initiative by the research centers of state DOTs through the AASHTO organization. Develop a Research Implementation Process Consideration should be given to improving the current research implementation process. The discussion of this issue presented in Appendix E may serve to offer constructive ideas for improvement.

43
REFERENCES
1. McFarland, William F., “Benefits of Research,” Texas Department of Highway and Public Transportation, 1988.
2. “Value of Research: SPR Projects from 1995-1999,” Kentucky Transportation Center, http://www.ktc.uky.edu/Reports/value%20of%20Research.pdf
3. “Implementing the Government Performance and Results Act for Research: A Status Report,” http://books.nap.edu/html/gpra2/
4. “Government Performance and Results Act,” http://books.nap.edu/html/gpra2/appf.pdf
5. Mann, David M., US Department of Army http://www.aro.army.mil/research/arlbaa00/finalarlbaal.htm#PART III
6. Kevin M. Murphy, Robert Topel, “The Economic Value of Medical Research.” 1999 http://gsbwww.uchicago.edu/fac/robert.topel/research/murphy&topel.pdf
7. Martin, Steve, and Davis, Howard, “Evaluating Best Value,” Local Government Centre, University of Warwick, UK 1999, http://www.local.dtlr.gov.uk/research/bestva~1/bvpap3.doc
8. T.K. Bikson, B.T. Harder, "Facilitating the Implementation of Research Findings: A
Summary Report (NCHRP Report 382)," 1996. Additional Contacts for Information: Joyce Brigham, NIST [email protected] Dave Johnson, Minnesota DOT [email protected], David Mann, US Army Research Laboratory [email protected]

44
APPENDIX A INITIAL RESEARCH/BENEFIT EVALUATION REPORT

45
DRAFT
Florida Department of Transportation Research Cost / Benefit Evaluation Report
46
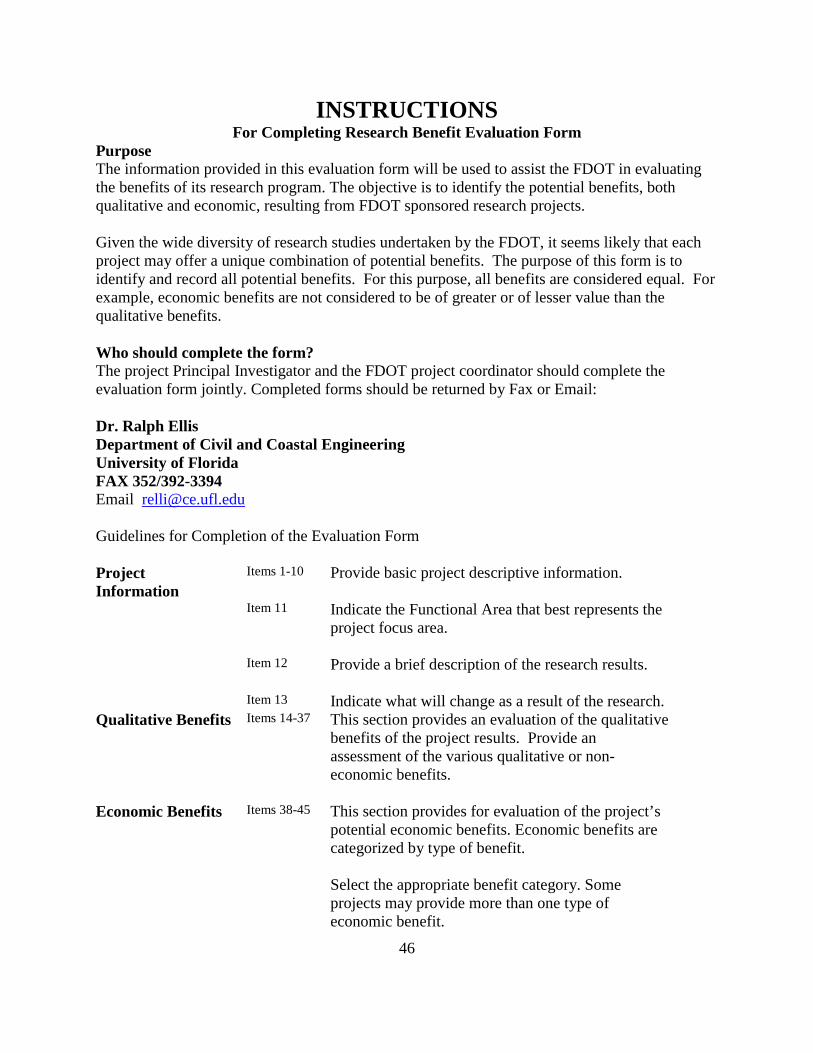
INSTRUCTIONS For Completing Research Benefit Evaluation Form
Purpose The information provided in this evaluation form will be used to assist the FDOT in evaluating the benefits of its research program. The objective is to identify the potential benefits, both qualitative and economic, resulting from FDOT sponsored research projects. Given the wide diversity of research studies undertaken by the FDOT, it seems likely that each project may offer a unique combination of potential benefits. The purpose of this form is to identify and record all potential benefits. For this purpose, all benefits are considered equal. For example, economic benefits are not considered to be of greater or of lesser value than the qualitative benefits. Who should complete the form? The project Principal Investigator and the FDOT project coordinator should complete the evaluation form jointly. Completed forms should be returned by Fax or Email: Dr. Ralph Ellis Department of Civil and Coastal Engineering University of Florida FAX 352/392-3394 Email [email protected] Guidelines for Completion of the Evaluation Form Project Information
Items 1-10 Provide basic project descriptive information.
Item 11 Indicate the Functional Area that best represents the project focus area.
Item 12 Provide a brief description of the research results.
Item 13 Indicate what will change as a result of the research. Qualitative Benefits Items 14-37 This section provides an evaluation of the qualitative
benefits of the project results. Provide an assessment of the various qualitative or non-economic benefits.
Economic Benefits Items 38-45 This section provides for evaluation of the project’s potential economic benefits. Economic benefits are categorized by type of benefit. Select the appropriate benefit category. Some projects may provide more than one type of economic benefit.

47
Note that the research team only needs to estimate the average cost savings for one unit, in current dollars.
Implementation Steps
Item 46 The benefits of research cannot be fully realized without implementation. Appropriate implementation will depend upon the type of project. This section should answer these questions:
• What must be done to implement the results of this research?
• When must it be done?
Definitions Item 40 Unit of Production
Any unit appropriate for measuring the unit of work, such as “Engineering evaluation of test report” or “Design of ---” or “Review of Submittals.”
Item 41 Unit of Measure Any unit appropriate for measuring material quantity.
Item 43 Maintenance Unit Any unit appropriate for measuring maintenance quantities, such as “Lineal Feet of Ditch Line” or “Acres of Mowing.”
Item 45 Operational Unit Any unit appropriate for measuring operational cost, such as “Weight Station,” “Motorist Call Box Systems,” or “Materials Testing Laboratory.”

48
1 Research Project Title
2 FDOT Contract #
3 Principal Investigator
4 Organization
5 FDOT Project Manager
6 Date Project Began
7 Date Project Completed
8 Project Duration In Months
9 Final Research Contract Amount
10 Did the Principal Investigator or FDOT Project Manager change during the project?
! Yes ! No
11 Which FDOT functional area does this research fall under?
! Construction
! Environmental
Management
! Geotechnical
Engineering
! ITS
! Maintenance
Operations
! Public Transportation
! Roadway Design
! Safety
! Materials
! Surveying and Mapping
! Structures
! Planning
! Traffic Engineering
The results of this research can be best described as:
Project Information
12
What has or will change as a result of this research?
13

49
Qualitative and Other Benefits of the Results of this Research Project
14 This project expands the FDOT knowledge base.
15 This project expands the State of Florida knowledge base.
16 This project expands the National knowledge base.
Information Knowledge Base Strongly Agree = 3 Agree = 2 Disagree = 1
17 This project lays the foundation for future research.
18 This project improves the communications network.
19 This project assists in traffic enforcement.
20 This project will aid in planning future infrastructure.
Infrastructure Strongly Agree = 3 Agree = 2 Disagree = 1
21 This project increases facility safety.
22 This project will produce increase the psychological comfort of users.
23 This project will produce an aesthetic improvement.
24 This project will improve transportation accessibility.
Quality of Life Strongly Agree = 3 Agree = 2 Disagree = 1
25 This project will improve the environment.
26 This project will improve specifications or guidelines.
27 This project will improve operational processes.
28 This project will improve management practice.
Management and Policy Strongly Agree = 3 Agree = 2 Disagree = 1
29 This project will improve policy.
30 This project will help to prevent rare but major life threatening accidents.
31 This project will reduce the injuries caused by major natural disasters.
32 This project will reduce the economic impact caused by major natural disasters.
Major Incident Avoidance and Hazard Mitigation Strongly Agree = 3 Agree = 2 Disagree = 1
33 This project will reduce the injuries caused by man-made incidents.

50
34 This project will reduce the economic impact caused by man-made incidents.
35 This project will help to make the design process more efficient.
36 This project will improve our understanding of a design related issue.
Engineering Design Strongly Agree = 3 Agree = 2 Disagree = 1
37 This project will improve the factor of safety of our designs.

51
Estimated Economic Benefits of the Results of this Research Project If the results of this research produce a potential cost savings, complete the estimated savings calculations in the appropriate savings categories (lines 38 – 45).
Cost Savings? 38 Do the results of this research offer potential cost savings? (If the answer is no, skip this section on Cost Savings.)
! Yes
! No
Source of the Savings
39
What is the primary source of the expected cost savings?
! Improved Work Efficiency (for
FDOT and Consultant Personnel)
! Reduced Material Cost (for materials
purchased directly by the FDOT)
! Reduced Maintenance Cost (of
FDOT facilities)
! Reduced Construction Cost (Cost of
FDOT construction contracts)
! Reduced User Cost (Cost to road
users)
! Reduced Accident Cost
If the cost savings can be estimated, provide an estimate of the cost savings per unit in one or more of the following sections.
What is the work activity?
What is the unit of production?
Labor
Grade Hours
Equipment Type Hours
Improved Work Efficiency Cost Savings Resulting from a Reduction in Labor and or Equipment Required for the FDOT and its Consultants to Perform Activities
40
What is the estimated savings in worker hours and equipment hours per unit of production?
Reduced Material Costs
41 What is the material or product?

52
What is the Unit of Measure?
What is the estimated cost savings per unit?
Cost savings resulting from reduced cost of materials or products purchased directly by the FDOT
What is the feature that is responsible for the reduced user cost?
What is the estimated Average Number of Users per Year?
Reduced User Cost
42
What is the estimated Annual Savings in Cost per User
What is the feature that is responsible for reduced maintenance cost?
What is the maintenance unit of measure?
Reduced Maintenance Cost Cost savings resulting from reduced cost of maintenance of FDOT facilities.
43
What is the cost savings per maintenance unit?
Pay Item No. Unit of Measure
Prior Estimated Average Unit Cost
New Estimated Average Unit Cost
Estimated Cost Savings per Unit
Reduced Construction Cost Cost savings resulting from reduced cost of construction pay items included in FDOT construction contracts.
44
What is the Operational Unit? Reduced Operational Cost
45
Estimated Annual Savings per Operational Unit

53
Steps Necessary for Implementation of the Results of this Research Project List the steps necessary for implementation of this research product and provide an estimated target date for accomplishing each step.
46 Implementation Steps Target Dates

54
APPENDIX B FDOT FEED BACK ON DRAFT EVALUATION FORM
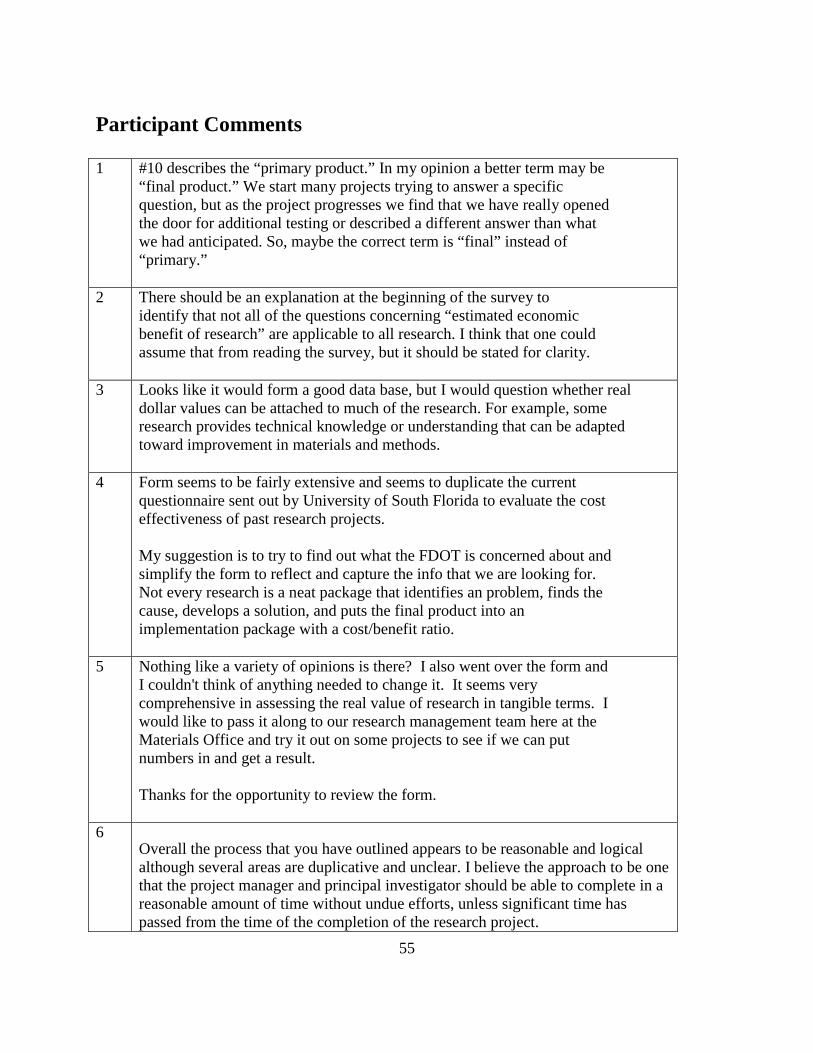
55
Participant Comments 1 #10 describes the “primary product.” In my opinion a better term may be
“final product.” We start many projects trying to answer a specific question, but as the project progresses we find that we have really opened the door for additional testing or described a different answer than what we had anticipated. So, maybe the correct term is “final” instead of “primary.”
2 There should be an explanation at the beginning of the survey to identify that not all of the questions concerning “estimated economic benefit of research” are applicable to all research. I think that one could assume that from reading the survey, but it should be stated for clarity.
3 Looks like it would form a good data base, but I would question whether real dollar values can be attached to much of the research. For example, some research provides technical knowledge or understanding that can be adapted toward improvement in materials and methods.
4 Form seems to be fairly extensive and seems to duplicate the current questionnaire sent out by University of South Florida to evaluate the cost effectiveness of past research projects. My suggestion is to try to find out what the FDOT is concerned about and simplify the form to reflect and capture the info that we are looking for. Not every research is a neat package that identifies an problem, finds the cause, develops a solution, and puts the final product into an implementation package with a cost/benefit ratio.
5 Nothing like a variety of opinions is there? I also went over the form and I couldn't think of anything needed to change it. It seems very comprehensive in assessing the real value of research in tangible terms. I would like to pass it along to our research management team here at the Materials Office and try it out on some projects to see if we can put numbers in and get a result. Thanks for the opportunity to review the form.
6 Overall the process that you have outlined appears to be reasonable and logical although several areas are duplicative and unclear. I believe the approach to be one that the project manager and principal investigator should be able to complete in a reasonable amount of time without undue efforts, unless significant time has passed from the time of the completion of the research project.

56
7
Under item #9 in the form, add a box for "Other" with a line to specify the area. Item 12 is duplicative of information found in # 8 and is not needed.
8 What is meant by the term Installation Costs? This is unclear and will need to be spelled out, either at this point or in the instructions for filling out this form. Item 13, what is meant by a Production Unit?
9 Item 29, what is meant by a Maintenance Unit? Item 36, what is meant by the Operational Unit?
10 The section on Present Worth of Estimated Economic Benefit of the Research should be renamed “Calculation of Present Worth Information” since that is what you have asked to be done.
11 Item 48 duplicates information requested in # 8 and # 12.
12 The numbering in the Other Non-Economic Benefits of Research section duplicates that found in part of the preceding section and appears to need correction.
13 Item 52, It states that “This project will produce increase the psychological comfort of users.” Something’s missing here!
14 Items 62 & 63 request information from lines 44-51. Since the information found in items 44-51 may be different depending on the section you select. See my note above.

57
Sample Completed Evaluations

58

59

60
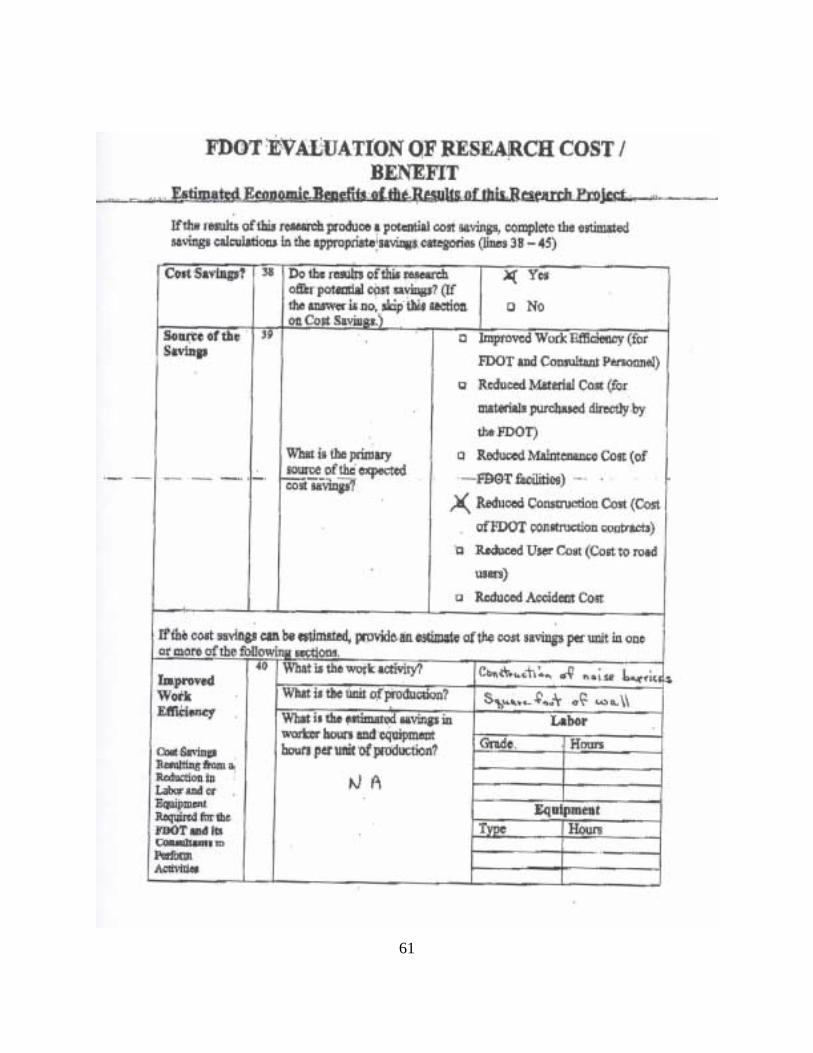
61
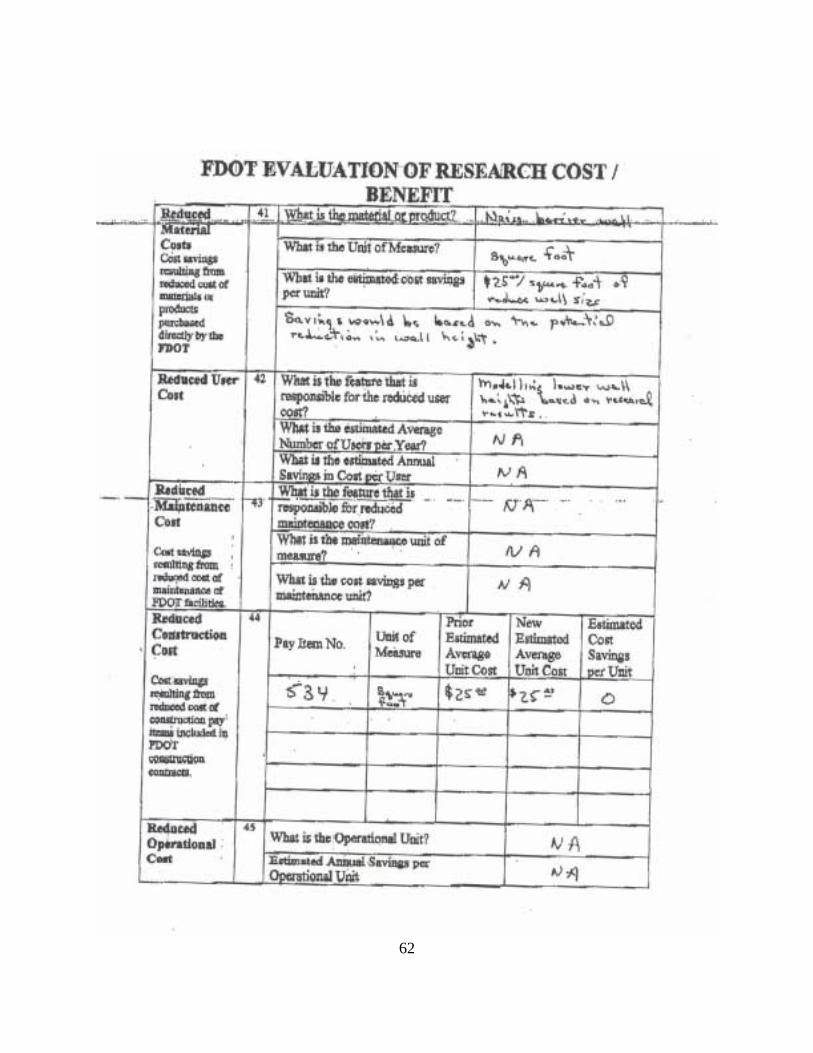
62

63

64
APPENDIX C FINAL RECOMMENDED COST/BENEFIT EVALUATION DOCUMENT
65
Florida Department of Transportation Research
Cost / Benefit Evaluation Report
INSTRUCTIONS
For Completing Research Benefit Evaluation Form Purpose The information provided in this evaluation form will be used to assist the FDOT in evaluating the benefits of its research program. The objective is to identify the potential benefits both qualitative and economic resulting from FDOT sponsored research projects. Given the wide diversity of research studies undertaken by the FDOT, it seems likely that each project may offer a unique combination of potential benefits. The purpose of this form is to identify and record all potential benefits. For this purpose all benefits are considered equal. For example, economic benefits are not considered to be of greater or of lesser value than the qualitative benefits. Who should complete the form? The project Principal Investigator and the FDOT project coordinator should complete the evaluation form jointly. Completed forms are to be submitted to the FDOT Research Center.

66
Research Benefit Assessment Pre-Implementation Step 1: Provide the basic information on the project The research center staff can provide this information. Project Information 1 Research Project
Title
2 FDOT Contract #
3 Principal Investigator
4 Organization
5 Date Project Began
6 Date Project Completed
7 Project Duration In Months
8 Final Research Contract Amount
9 Which FDOT functional area does this research fall under?
! Construction ! Public Transportation ! Environmental Management ! Roadway Design ! Geotechnical Engineering ! Safety ! ITS ! Materials ! Maintenance Operations ! Surveying and Mapping ! Planning ! Structures
! Traffic Engineering
10 The objectives of this research were:
11 The primary product of this research can be best be described as:

67
Step 2: Assess the Qualitative Benefits of the Project The FDOT research coordinator and the principal investigator should make an assessment of Qualitative Benefits jointly. The FDOT research center staff will provide review and oversight. Qualitative Benefits are to be rated on a scale of 0 to 5, using the following guidelines for assigning numeric scores:
0 = Absolutely no benefit in this category. 1 = There is some slight benefit in this category. 3 = Project is partially successful in providing a positive benefit in this category. 5 = Project clearly provides a strong positive benefit in this category.
Note that for each assessment score greater than 3, a specific narrative explanation of the benefit must be provided. Qualitative Benefits Assessment
Benefit Category Score
Level of Knowledge The results of this project, when implemented, will expand the current level of knowledge in this research area. Explanation:
Safety The results of this project, when implemented, will improve the safety of the users of transportation systems and/or DOT or contractor employees. Explanation:
Quality of Life The results of this project, when implemented, will improve the quality of life of visitors and residents of the state. (To include issues such as: aesthetic beauty, convenience, comfort and security) Explanation:

68
Environmental The results of this project, when implemented, will improve the quality of the natural environment. Explanation:
Management and Policy The results of this project, when implemented, will provide for improved management and policy decisions. Explanation:
TOTAL QUALITATIVE BENEFIT SCORE

69
Step 3: Assess the Economic Benefits of the Project Not all successful projects produce an economic benefit. However, for those projects that do produce a positive economic impact, the benefit/cost ratio must be estimated. The FDOT research coordinator and the principal investigator should perform benefit/cost calculations. The FDOT research center staff should provide review and oversight. Notes on Benefit/Cost Calculations: Generally, the approach is to determine the savings per unit by comparing the cost prior to implementation with the expected cost after implementation. Total savings is estimated by multiplying the unit savings by the estimated total number of units. Future cost savings should be converted to present values using appropriate interest rate values (this rate is the value established and used by the FDOT for all planning calculations). The calculation can be expressed as follows: Estimated Cost/Benefit Ratio = Present Value of Total Savings Present Value of Cost of Research Total Savings = [Estimated Savings per Unit x Estimated Number of Units] – Estimated Cost of Implementation Note that the unit measure is whatever is appropriate for the specific research product: e.g., Numbers of Piles Installed, Tons of Asphalt, Lane-Miles of Pavement, Number of Design Calculations. Estimates of future unit quantities can be made by projecting current quantities to future years using FDOT work program estimates, estimates of future usage and demand, and other planning statistics routinely used by the FDOT. Unit cost estimates should be detailed and based upon the best pricing information available. A five year useful life is recommended when estimating future benefits, unless a there is a strong indication that the research benefit will continue for a longer period. Benefit/Cost Calculation: Savings Summary Present value of the cost of the research project
Present value of the estimated cost of implementation Present value of estimated future savings Estimated Benefit/Cost Ratio Provide detailed calculations and appropriate backup documentation supporting the above estimates.

70
Benefit/Cost Calculation:

71
APPENDIX D BENEFIT/COST CALCULATION EXAMPLES
Note that the following cost calculation examples are provided to illustrate the general approach for estimating cost savings resulting from research products. The examples are representative and the pricing is realistic, but has not been completely verified.

72
Example 1 Cost Savings Calculation Functional Area: Materials Description of Research Product: Investigation has resulted in revision to current Superpave Asphalt Pavement material specifications with regard to course aggregates. A revised and more flexible aggregate specification will permit the use of some Florida aggregates and reduce the need for imported materials. Local materials are available at less cost than the imported materials. The result is a predicted savings in the cost of Superpave Asphalt paving. Cost Saving Calculation: Production Unit The production unit of Tons (TNS) was selected because it is the unit most commonly used as a pay item measurement for Superpave asphalt. Development of the Unit Cost Savings The cost savings results from a lower course aggregate price. The price differential is estimated by obtaining estimates of the savings from three FDOT contractor/asphalt suppliers. Estimated Savings per TN of Superpave Asphalt: Contractor A Contractor B Contractor C Average $0.87 $1.03 $0.91 $0.97
Optionally, a more detailed approach would have been to obtain aggregate prices from local and out-of-state mines, and estimates of delivery cost from shippers. The cost difference per TN of batched asphalt could have then been estimated for a typical mix design. Estimating Future Production Quantities Future annual quantities of Superpave asphalt are estimated from the current 5-year work plan. For this estimate, future quantities are assumed to be directly proportional to the planned construction program budget for Florida Interstate Highway System (FIHS). The FIHS was selected rather than the entire construction budget, because Superpave is generally limited to the interstate system and, therefore, more closely correlated with the interstate program budget. Total Superpave Quantity in TNs from Estimates Office for 2002: 79,496,507 TNS Source: http://www11.myflorida.com/estimates Future Superpave Quantities were estimated as follows: Qty (yearN) = Qty(2002) x FIHS Budget(yearN) FIHS Budget(2002)

73
Total FIHS Program Budgets and Estimated Superpave Quantities Year 2002 2003 2004 2005 2006 2007 Budget 1760 909.9 1233.8 1074.8 691.8 630.1 Superpave TNS
79,496,507 41,098,791 55,728,858 48,547,071 31,247,547 28,460,653
Source: http://www11.myflorida.com/programdevelopmentoffice The research team conservatively estimates that only 15% of the total Superpave amount will benefit from the specification change (Only a portion of the total mix categories will be involved, and some of the northernmost projects may elect to continue importing aggregate). Therefore, the estimated future savings are calculated as follows. Note that an interest rate of 5% has been used for converting future savings to present worth. Calculation of Estimated Future Savings (5 year life)
Year 2003 2004 2005 2006 2007
Estimated Total Superpave TNS 41,098,791 55,728,858 48,547,071 31,247,547 28,460,653
Estimated Superpave Affected by Change TNS 6,164,819 8,359,329 7,282,061 4,687,132 4,269,098
Estimated Savings per TN $0.97 $0.97 $0.97 $0.97 $0.97
Estimated Annual Savings $5,979,874 $8,108,549 $7,063,599 $4,546,518 $4,141,025
Present Worth Factor 0.95238 0.90703 0.86384 0.8227 0.78353
Present Value of the Future Savings I = 5%
$5,695,112 $7,354,697 $6,101,819 $3,740,420 $3,244,617
Total Present Value $26,136,667 Benefit / Cost Comparison Benefit $26,136,667 Present Value of Future Savings Cost $180,000. Research Contract Amount

74
Example 2 Cost Savings Calculation Functional Area: Geotechnical Engineering Description of Research Product: This research has developed a wireless system for transmitting driving data of interest from precast concrete piles while they are being driven. Sensors and a transmitting unit are cast into the pile at the plant, thereby eliminating instrumentation and wiring the pile at the project site. Transmitted data is received on a portable computer at the site. Driving and capacity analysis can be made in real time. Currently, the construction contractor is paid to drive the test piles at a higher cost than regular production piles because of the additional time required. The product of this research is a test pile that can be installed at same driving cost as a regular production pile. Cost Saving Calculation: Production Unit The production unit of Lineal Feet (LF) was selected because it is the unit most commonly used as a pay item measurement for piling. Development of Unit Cost Savings Savings result from a lower cost to install the test pile. The current test procedure requires that much of the wiring and instrumentation be assembled with the pile in the driving leads prior to beginning driving. This makes for a process that requires much more time than would be required to drive a standard production pile. Consequently, the unit price charged by the contractor for installation of a test pile is significantly higher than for a standard pile. The contractor’s cost to install a test pile with the new test process is expected to be no different than the cost to install a standard pile. Unit cost savings are developed by estimating the difference in cost between the installation of a normal production pile and the installation cost of a traditional test pile with PDA wiring and instrumentation. The additional cost of the new wireless instrumentation that is cast into the pile is converted into a linear foot price, assuming a 40-foot pile. The 2001 calendar year is selected as the cost baseline because that is the most recent year for which complete pay item cost are available. 2001 Cost Data
Item Quantity of Test Piles Unit Production Pile
Average Unit PriceTest Pile Average
Unit Price Additional Unit Cost
for Test Piles
18" Conc Piling 2,684 LF $45.36 $200.65 $155.2924" Conc. Piling 1,595 LF $47.62 $135.99 $88.37Source: http://www11.myflorida.com/estimates/CES-TRNSPORT/cost01.pdf

75
Estimating Future Production Quantities Future quantities for driven precast piling are estimated from the 5-year work plan. For this estimate, future piling quantities are assumed to be proportional to the total bridge construction budget. As reported above, total quantities for test piling in 2001 were 2,684 LF of 18” piles and 1,595 LF of 24” piles. Future test piling quantities were estimated as follows: Qty (yearN) = Qty(2001) x Budget(yearN) Budget(2001) Estimated Future Test Pile Quantities Year 2001 2002 2003 2004 2005 2006 2007 Budget(Million $) 391.2 356.1 179.3 299.8 181.7 79.7 187.3 18" Test Piles 2684 2443 1230 2057 1247 547 1285 24" Test Piles 1595 1452 731 1222 741 325 764 Source: http://www11.myflorida.com/programdevelopmentoffice/prp%20Attachment%20A.pdf The cost of having the wireless device and instrumentation cast into the pile is estimated to be $350 per pile (based upon actual prototype costs). Assuming a 40-foot pile length, the unit cost is $4.38 per LF, which must be subtracted from the installation unit savings. Future savings are estimated as follows. Note that an interest rate of 5% was used for converting future savings to present worth. Calculation of Estimated Future Savings (5 year life) Year 2003 2004 2005 2006 200718" Test Piles 1230 2057 1247 547 1285Saving per LF $150.91 $150.91 $150.91 $150.91 $150.91 Annual Savings for 18” piles $185,619 $310,422 $188,185 $82,548 $193,91924" Test Piles 731 1222 741 325 764Savings per LF $83.99 $83.99 $83.99 $83.99 $83.99Annual Savings 24" Piles $61,397 $102,636 $62,237 $27,297 $64,168
Total Annual Savings $247,016 $413,058 $250,421 $109,845 $258,088Present Worth Factor 0.95238 0.90703 0.86384 0.8227 0.78353Present Value of Future Savings, I = 5% $235,253.09 $374,655.68 $216,323.99 $90,369.09 $202,219.46
Total Present Value $1,118,821 Benefit / Cost Comparison Benefit $1,118,821. Present Value of Future Savings Cost $265,000. Research Contract Amount

76
Example 3 Cost Savings Calculation Functional Area: Environmental Management Description of Research Product: The results of this study suggest that current noise barrier wall criteria may be modified to provide for a lower wall height that will also meet noise control requirements. Research recommendations indicate that barrier wall heights can be reduced by 1.5 feet. Lower wall heights are expected to result in lower construction cost for new walls. Cost Saving Calculation: Production Unit The production unit of Square Feet of Wall (SF) was selected because it is the common unit used for this pay item. Development of the Unit Cost Savings The expected cost savings result from a reduction in the surface area of the required noise barrier wall per length of wall. A review of typical project designs for 2001 indicates that the average wall height was 16 feet. This average height is used to estimate reduction in area with the implementation of this research product. A 1.5 foot reduction in height results in a 9.4% reduction in total wall area. The average unit cost for noise barrier wall in 2001 was $14.50 per SF. The total quantity in 2001 was 316,550 SF. Estimating Future Quantities Future annual quantities of noise barrier wall are estimated on the basis of the current 5-year work plan. Noise barrier wall quantities are assumed to be directly proportional to the work program combined construction budget for Interstate Highways and Other Arterials. The calculation of estimated future annual savings and total present value of savings are presented in the following table.

77
Total Construction Budget and Estimated Noise Barrier Wall Quantities Year 2001 2002 2003 2004 2005 2006 2007Intrastate Construction Budget 532.3 1760.0 909.9 1233.8 1074.9 691.8 630.1Other Arterials Construction Budget 504.0 989.2 485.6 598.0 561.3 347.0 561.3Combined Budget 1036.3 2749.2 1395.5 1831.8 1636.2 1038.8 1191.4Noise Wall Quantity (SF) 316550 839775 426272 559545 499790 317314 363927Savings in Wall Area SF (9.4%) 40070 52597 46980 29827 34209
Total Annual Savings (at 14.50 per SF) $581,009 $762,660 $681,214 $432,499 $496,033Present Worth Factor 0.95238 0.90703 0.86384 0.8227 0.78353
Present Value of Future Savings I = 5% $553,341 $691,755 $588,460 $355,817 $388,656Total Present Value $2,578,029 Source: http://www11.myflorida.com/programdevelopmentoffice/prp%20Attachment%20A.pdf Benefit / Cost Comparison Benefit $2,578,029 Present Value of Future Savings Cost $135,000. Research Contract Amount

78
APPENDIX E DISCUSSION OF IMPLEMENTATION ISSUES
by Gibson Peaslee
Ms. Janet Degner
Statement of Problem Past federal and state sponsored research and technical papers attempting to improve technology transfer effectiveness have focused on developing tools for estimating research cost/benefit potential or post-research benefit. Occasionally, studies did identify applications where actual distribution and implementation processes could be improved, but these new processes were very costly and did not transfer effectively to projects beyond the specific application. The studies also indicated that research sponsors have various distribution/implementation processes in place, but the success of these processes depends on the sponsor’s perceived market for the outcomes. Ray Griffith, in FHWA’s Ideas on Enhancing T2 Technology Transfer Mandate: A Summary Report (1998), outlined the need for change, stating, “A sponsoring agency must plan for implementation, commit the necessary financial and human resources and collaborate with researchers/developers/users throughout the entire process.” What has been missing is a process with the ability to effectively transfer research results from a very diverse range of projects. Solution The solution is to design a process with flexibility to accommodate diverse distribution, implementation, tracking, and measurement requirements. This report suggests a fundamental methodology needed to create the process flexibility necessary for achieving the desired implementation and measurement outcomes of each research project.
Methodology The methodology that follows provides flexibility to adjust to various required outcomes for the broad research portfolio of Florida Department of Transportation, as well as other research groups. As an integral part of each project, these fundamental process improvements represent an opportunity to maximize distribution, hasten implementation, enhance tracking, and produce objective cost/benefit data. In addition, an important responsibility of publicly funded research is to recognize the cost/benefit outcome of a project when a product, service, or process is non-productive or disadvantageous. The technology transfer obligations in every case must be conducted in the same manner, reporting positive as well as negative outcomes with equal vigor. Knowing when to refrain from investments is a considerable benefit to the public stakeholder.
79
The proposed methodology for achieving these fundamental process improvements consists of the following:
1. Establish a Florida Research Support Service [FRSS]. 2. Integrate a professional Technology Transfer Advisor [TTA] at the beginning of the
research process. 3. Expand and maintain a consistent tracking process tailored to the specific project. For
clarity in this paper, technology transfer will be described as “implementation and cost/benefit” due to the broad interpretation of the term, even among transportation professionals.
1) Establish a Florida Research Support Service (FRSS) – or similar “processing” entity, either within FDOT’s Research Office or at a closely aligned external program. Once established, the FRSS would work under the direction of the FDOT Research Office to become the central processing entity with distribution, implementation, tracking (including surveys), archiving, and reporting responsibilities. The FRSS concept is also a catalyst for resolving secondary professional considerations such as the extent of Project Investigator (PI) and Project Manager (PM) responsibility in the post-project survey and distribution process, and the rising concern over loss of practical field experience in the transportation profession as generations of field-tested professionals retire. FDOT has established a training program that systematically rotates new talent among various FDOT departments and disciplines. The FRSS could tap into this talent pool to assist the PM, the PI, and the researchers by completing project survey and distribution responsibilities, which would provide a substantial process enhancement. By participating in the FRSS tracking process, this young talent would acquire a practical appreciation for field situations that trigger research, gain first-hand understanding of the research solution, and develop an appreciation for hastening implementation. A percentage of each project processed through the FRSS may be apportioned to offset operational costs. Revenues generated by implementation initiatives discussed under process enhancements could further defray FRSS operational expenses. By executing the FRSS concept, the FDOT Research Office would be providing an opportunity to increase the success of post-research tasks. 2) Integrate a professional Technology Transfer Advisor (TTA) at the beginning of the research process – a vital element for process improvement. Traditionally, professional technology transfer practitioners have entered the process at the conclusion or delivery stage of the research project, if at all. A TTA offers a broadened perspective on distribution, tracking, and implementation needs and should be included in the scoping process as early as possible. The TTA will match distribution methods to projects. The TTA could also use press releases and association newsletter articles to promote research findings, and conduct various types of training (live, web based, computer interactive, etc.) and product demonstrations to increase

80
distribution. By assisting in creating a clearly defined post-research process, the TTA will greatly improve the prospects for efficient distribution, tracking, implementation, and cost/benefit measurement. It is understood that resulting changes in regulations and specifications may affect implementation and could result in process delay. 3) Expand and maintain a consistent tracking process – essential to obtain maximum benefit for every delivered project. If this element is missing or applied randomly, any attempt to achieve truly objective outcomes is substantially reduced, which may unfairly influence future research decisions. PIs, PMs, and researchers all have a role in the distribution process as discussed in item #1, but giving a FRSS entity the primary responsibility for carrying out distribution and tracking efforts will greatly enhance the process. Heightened visibility of quality research leads to peer recognition, enhances professional reputation, and attracts superior researchers. Illustrations of Enhancements for Distribution, Implementation, and Tracking Processes To illustrate the versatility of the proposed methodology for distribution, implementation, and tracking process enhancements, research has been divided into two very broad categories based on the type of research results: A) Data Accumulation and Assessment Research and, B) Product Upgrade, Development, Guideline, or Specification Research. A) Data Accumulation and Assessment Research These projects essentially supply data and/or scientific documentation that provide a basis for subsequent research or implementation decisions. In general, the current process relies on the PI and/or PM for distribution and survey responses, while the FDOT Research Office handles federal and state DOT interdepartmental distribution, and electronic posting. This process treats the sponsoring agency almost as the exclusive stakeholder, severely limiting distribution and the potential for a broader professional audience. Follow-up tracking of any external distribution is virtually nonexistent, rendering it extremely difficult to measure accurate short- and long-range value. TTAs are aware of the wider interest in these results and will explore new distribution and tracking efforts, as described below, that will increase the professional benefit of the project and add previously unmeasured value to the research investment.
1. Hard text distribution should be continued, but a more efficient tracking element needs to be added to the process. A distribution notification form circulated by FRSS to the PI, the PM, the FDOT Research Office, and all other distribution lists, is a simple and efficient mechanism for capturing specific information and setting the tracking process in motion. This form would then be routed to FRSS for consistent periodic follow-up. Identifying the information to appear on this report form should be a collective effort between the FDOT Research Office, the FRSS, and the TTA.
2. Electronic distribution offers immediate worldwide access to research outcomes but often
lacks a tracking mechanism. A pop-up screen that provides and requests specific

81
information and that is added to the downloading process would result in data being directly linked by e-mail to FRSS for consistent follow-up. Implementation of this strategy would be relatively simple to accomplish on the FDOT Research Program Internet home page. External sites (TRB, TRIS, Ga Tech, Purdue etc.) may not have the ability or wish to include this feature, but the same outcome can be accomplished if the external site agrees to link directly to the FDOT Research Office site.
3. This category offers the simplest, most cost effective opportunity to expand current
distribution processes, to establish more effective tracking elements or mechanisms, and to measure cost/benefits.
B) Product Upgrade, Discovery, Guideline or Specification Research
1. These projects result in product upgrades, new products, revised and/or established
guidelines, or specifications resulting from need for immediate application. Current distribution processes are similar to those explained under Data Accumulation and Assessment, with the addition of information exchanges such as live workshops and technical sessions. Although the technology transfer element is a part of every FDOT research project, the extent of coverage falls short of the broad exposure opportunity offered by interacting with a FRSS entity and the TTA.
2. This category offers a wide range of additional distribution and implementation
enhancement opportunities listed below. These proven opportunities have been tested in the field with outcomes exceeding expectations. Selecting and integrating these enhancements into the process will require an experienced TTA to tailor the outreach components, a coordinating FRSS entity to oversee the effort and strong management commitment.
3. Determine the implementation and cost/benefit processes that will maximize distribution
and implementation for each type of research outcome. 4. Identify all interested market segments—professional associations representing vendors,
contractors, and consultants, and end-users, including government entities (local, state, national, international).
5. Include municipalities as active participants early in the project whenever practical. This
effort may be facilitated by establishing a statewide Municipal Research Test Site Registration Program, a database of municipalities interested in participating in FDOT-sponsored research, that is promoted and maintained by FRSS. Participating municipalities would provide a real-time testing experience for the researchers, an immediate resource for post-research implementation efforts, and quick cost/benefit return by reaping immediate residual benefits of successful projects. Municipalities represent a sizable, maybe the largest, transportation stakeholder base, but are virtually untapped as a research resource.

82
6. Integrate industrial and professional association representation early in the project development process, whenever practical, to promote professional association and vendor/contractor support for, and experience with, the new technology.
7. A fundamental process introduced by the Florida Local Technical Assistance Program
(LTAP) to better meet contractual implementation and cost/benefit responsibilities is the research Demonstration Showcase that incorporates industry and municipalities. To be effective, Showcases must (1) include the researchers, the participating user agency, and the participating vendor/contractor; and (2) contain a “real-time” demonstration of the technology. With researchers, end-users, and contractor/vendors all participating in the Showcase information exchange process, professional and elected decision-makers gain hands-on experience with new or upgraded technology in a neutral, unbiased, information exchange environment. Integrating Demonstration Showcases in the research process for appropriate projects greatly reduces the time required to move research from state-of-the-art to state-of-the-practice. Properly structured and conducted, Showcases overcome almost every professional barrier to practical implementation.
8. Upon delivery of project conclusions, FRSS will begin the Demonstration Showcase
process by coordinating with researchers and municipal and vendor/contractor representatives to formalize an agenda. The agenda might include such items as the project selection/evaluation process, an overview of the research results, a live implementation demo, and a summary of potential/realized benefits. FRSS will promote the Demonstration Showcase, as directed by sponsoring agency, on a state, regional, or national level; manage the registration process; and co-host the event. At the conclusion of the event, FRSS will publish a summary article and distribute the data as detailed in the project implementation and cost/benefit scope. All Demonstration Showcase information will be archived, distributed, and tracked by the FRSS, along with any resulting implementation so that cost/benefit reports can be produced. Reasonable Demonstration Showcase registration fees help offset the operational costs of the event presentation and FRSS responsibilities.
9. Potential benefits for incorporating the distribution and implementation enhancements
mentioned above can be illustrated by using the FDOT Superpave research project Currently, Superpave is undergoing proprietary testing at a state facility. Basic research costs included the substantial investment for testing equipment required to duplicate various traffic use patterns related to heavily traveled pavements. Once the conclusions are reached, report circulation, workshops, and technical sessions will follow–i.e., the main elements of the current implementation process.
10. If this research project would have integrated a municipality test site with professional
association support early in the process, the following benefits could have been realized: (1) a volunteering municipality would have become a real-time test site receiving a useable, measurable, residual benefit after project completion, (2) contractor/association representatives would have gained experience during the research process, which would have established the foundation for immediate, post-project implementation, and (3) real-
83
time implementation would have provided the research sponsor with immediate external elements for a workshop, technical session, or a demonstration showcase.
11. To date, six Demonstration Showcases have been conducted on diverse disciplines
ranging from Open Graded Emulsified Mix for unpaved roads to a design solution for a Multi-use Bike/Ped trail merging with a heavily traveled highway. More than $104 million in implementation has taken place since January 1998 as a direct result of these Demonstration Showcases, and this figure increases as tracking continues each year. The dollar amount represents municipal implementation only and does not include the original user agency, FDOT or FHWA, purchases. In practice, these Demonstration Showcases have met and overcome every hurdle to the implementation process, and they have provided an efficient tracking process that has delivered easily measured and accurate cost/benefit data.
Conclusion
The methodology outlined in this report successfully illustrates how to develop a pre- and post-project process that results in objective measurement data. Creating a FRSS responsible for carrying out the extension effort and involving a technology transfer practitioner early in the developmental process are fundamental to achieve desired results and overcome barriers. The LTAP provides an experienced nationwide talent resource readily available to handle the FRSS responsibilities. A research sponsor furnishing an efficient and dependable distribution, tracking and implementation process will attract the elite researcher and emerging quality research talent, which would result in a formidable long-term program benefit. Specific enhanced processes have been provided to show how simply new initiatives can be incorporated into the current research process. Once operating, they will move the research program closer to the model relationship in which stakeholders gain according to specific interests.

84
APPENDIX F DRAFT TEXT FOR RESEARCH BENEFIT EVALUATION CONTRACT PROVISION
The following draft language is suggested for a new provision to be added to the current research contract. This additional provision would require the preparation and submission of a research benefit evaluation.
REPORTS
E. A general review of draft interim, final reports and research benefit evaluations is required by the Department to insure compliance with contract ….
H. The Contractor shall submit a Research Benefit Evaluation no later than the ending date of the period of performance. The Research Benefit Evaluation shall include completion of the FDOT Research Cost/Benefit Evaluation Form and submission of supporting documentation, in accordance with the instructions provided with the FDOT Research Cost/Benefit Evaluation Form.