review and analysis of protectionist actions in the textile...
TRANSCRIPT

Review and Analysis of Protectionist Actions
in the Textile & Apparel Industries
Stacey Frederick
College of Textiles
North Carolina State University
and
Gary Gereffi
Department of Sociology
Center on Globalization, Governance & Competitiveness
Duke University
June 28, 2009
Paper prepared for the World Bank and
the Center for Economic Policy Research (CEPR)
(Short version)

Table of Contents
1. Executive Summary .................................................................................................................. 1
2. Introduction ............................................................................................................................... 2
3. Two Perspectives in the Textile and Apparel Protectionist Debate .......................................... 2
4. Protectionist Measures .............................................................................................................. 3
4.1 Tariff Barriers and Trade Remedies ................................................................................... 3
Import Tariff Increases ................................................................................................ 6
Anti-Dumping (AD) Investigations and Measures ...................................................... 6
Countervailing (CV) Duty Actions .............................................................................. 7
Safeguards .................................................................................................................... 7
China Safeguards ......................................................................................................... 7
4.2 Non-Tariff Barriers ............................................................................................................. 8
Trade Procedure Import Barriers ................................................................................. 8
Social and Environmental Compliance ....................................................................... 8
Generalized System of Preferences (GSP) .................................................................. 9
Government Procurement ............................................................................................ 9
4.3 Government Support & Subsidies ...................................................................................... 9
Agricultural Subsidies ............................................................................................... 10
General Subsidies with Textile Provisions ................................................................ 10
Actionable Subsidies ................................................................................................. 10
Recent Government Support and Stimulus Packages ................................................ 11
5. International Trade Patterns .................................................................................................... 11
6. Trends, Conclusions, & Recommendations ............................................................................ 12
7. References ............................................................................................................................... 15
8. Appendix: International Trade Statistics: Tables and Charts ................................................. 16
1
1. Executive Summary
The textile and apparel (T&A) industries have a long history of protectionism, including
the Multifiber Arrangement (MFA) that governed world trade in these products from 1974 to
2004. Protectionist measures in T&A include: tariff barriers, non-tariff barriers, and government
subsidies and support packages. Since the beginning of the current economic crisis (October
2008), a fairly large number of trade-restricting measures in the T&A industries have taken
effect, especially in anti-dumping investigations and safeguards. However, a majority of these
were initiated by only a handful of reporting countries against a small number of exporting
countries. The list of products in question is quite limited, and many of the countries initiating
these trade actions do not play a major role in international T&A trade. From a broader
historical perspective and given the phase out of the MFA quota system by the World Trade
Organization (WTO) in 2005, we are arguably in the most “liberal” period for T&A in more than
three decades.
There have been two broad shifts in the center of gravity of T&A protectionist actions
that have occurred: a shift from developed to developing countries as the initiators of trade
actions; and a shift from the apparel industry to the textile and raw material industries as the
focus of trade-restricting measures. Developed countries appear to have a decreased interest in
trade actions and are opting instead for a greater use of free trade agreements.
There have also been striking shifts in T&A trade patterns over the past decade. The
dismantling of the quota system, marked by the end of MFA in 2005, has fueled a growing
consolidation in the T&A trading system, with China now occupying the central role. While
Chinese apparel imports dominate developed country markets (the United States, Japan, and the
European Union), China’s exports are diversified across all major markets, making it hard for
any single country to combat disputed Chinese trade practices.
There are several additional elements potentially relevant to protectionism in the T&A
arena that merit continued scrutiny. China is the only country with major investments planned
for this industry. In 2009, the Chinese government announced a three-year stimulus package for
T&A intended to bolster textile production, sales and employment. China has provided funds to
encourage T&A enterprises to focus on domestic demand and the cultivation of homegrown
brands that may extend to export markets. The United States has formally accused China in the
WTO of providing illicit export subsidies to all industries, including textiles. Agricultural
subsidies in developed countries (such as price supports by the European Union, the United
States, Japan and South Korea) are also relevant to the T&A supply chain, since this category
includes raw materials (such as cotton, wool, silk, hemp and flax) used in many textile products.
Agricultural subsidies may provide a loophole to textile manufacturers who purchase these raw
materials. Finally, social and environmental compliance, which can be considered a non-tariff
barrier to trade, is emerging as a very important issue for the T&A industries due to the labor
intensity of the apparel industry and the environmental impact of the textile industry (e.g., high
energy usage and waste water). In recent years, the T&A industries have led the way in creating
standards to hold firms and countries accountable for their social and environmental actions. Any
changes in this category should be carefully monitored because relaxing current standards may
trickle down to other industries, and non-compliance could have widespread, long-lasting
repercussions.
2
2. Introduction
This report seeks to analyze the policy responses and trade implications that have
occurred in the textile and apparel (T&A) sectors in response to the current economic crisis. The
T&A industries have a long history of protectionism through the Multi-Fiber Arrangement
(MFA) that governed world trade in textiles and apparel from 1974 to 2004. Therefore, section
three will analyze recent T&A actions from two perspectives: 1) the total protectionist actions
taken in all industries in recent months; and 2) the historical trends in T&A protectionism. The
fourth section categorizes protectionist measures into three groups: tariff barriers and trade
remedies, non-tariff barriers, and government support and subsidies. We provide an overview of
the specific actions recently taken by governments aimed at reviving or protecting their T&A
industries from foreign competition. In the final two sections, trade patterns over time will be
discussed and analyzed, and conclusions and recommendations will be provided.
3. Two Perspectives in the Textile and Apparel Protectionist Debate
Both short-term and long-term perspectives are needed to evaluate protectionist trends in
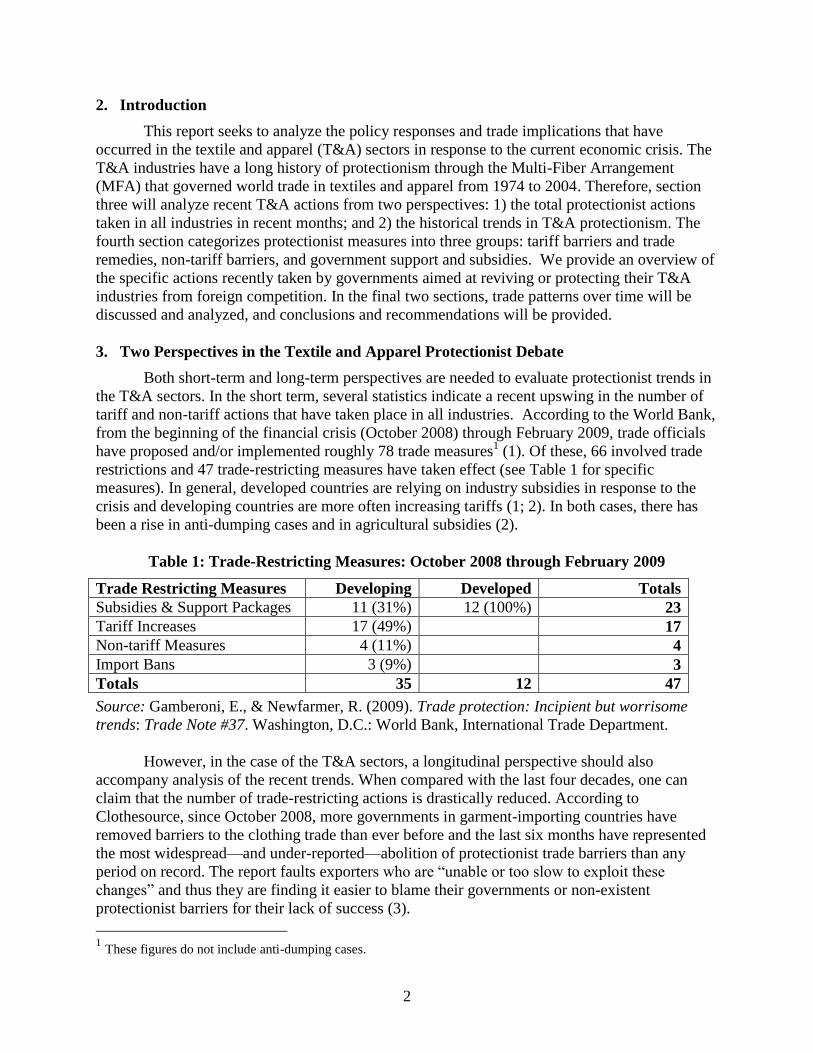
the T&A sectors. In the short term, several statistics indicate a recent upswing in the number of
tariff and non-tariff actions that have taken place in all industries. According to the World Bank,
from the beginning of the financial crisis (October 2008) through February 2009, trade officials
have proposed and/or implemented roughly 78 trade measures1 (1). Of these, 66 involved trade
restrictions and 47 trade-restricting measures have taken effect (see Table 1 for specific
measures). In general, developed countries are relying on industry subsidies in response to the
crisis and developing countries are more often increasing tariffs (1; 2). In both cases, there has
been a rise in anti-dumping cases and in agricultural subsidies (2).
Table 1: Trade-Restricting Measures: October 2008 through February 2009
Trade Restricting Measures Developing Developed Totals
Subsidies & Support Packages 11 (31%) 12 (100%) 23
Tariff Increases 17 (49%) 17
Non-tariff Measures 4 (11%) 4
Import Bans 3 (9%) 3
Totals 35 12 47
Source: Gamberoni, E., & Newfarmer, R. (2009). Trade protection: Incipient but worrisome
trends: Trade Note #37. Washington, D.C.: World Bank, International Trade Department.
However, in the case of the T&A sectors, a longitudinal perspective should also
accompany analysis of the recent trends. When compared with the last four decades, one can
claim that the number of trade-restricting actions is drastically reduced. According to
Clothesource, since October 2008, more governments in garment-importing countries have
removed barriers to the clothing trade than ever before and the last six months have represented
the most widespread—and under-reported—abolition of protectionist trade barriers than any
period on record. The report faults exporters who are “unable or too slow to exploit these
changes” and thus they are finding it easier to blame their governments or non-existent
protectionist barriers for their lack of success (3).
1 These figures do not include anti-dumping cases.
3
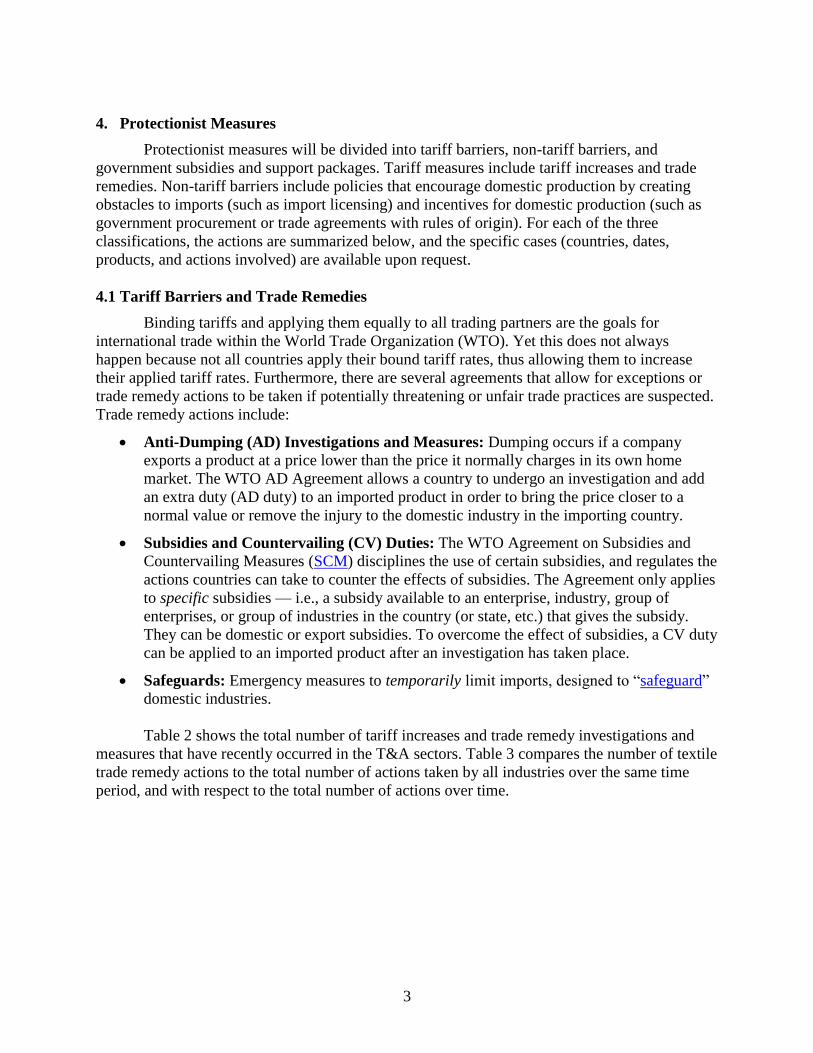
4. Protectionist Measures
Protectionist measures will be divided into tariff barriers, non-tariff barriers, and
government subsidies and support packages. Tariff measures include tariff increases and trade
remedies. Non-tariff barriers include policies that encourage domestic production by creating
obstacles to imports (such as import licensing) and incentives for domestic production (such as
government procurement or trade agreements with rules of origin). For each of the three
classifications, the actions are summarized below, and the specific cases (countries, dates,
products, and actions involved) are available upon request.
4.1 Tariff Barriers and Trade Remedies
Binding tariffs and applying them equally to all trading partners are the goals for
international trade within the World Trade Organization (WTO). Yet this does not always
happen because not all countries apply their bound tariff rates, thus allowing them to increase
their applied tariff rates. Furthermore, there are several agreements that allow for exceptions or
trade remedy actions to be taken if potentially threatening or unfair trade practices are suspected.
Trade remedy actions include:
Anti-Dumping (AD) Investigations and Measures: Dumping occurs if a company
exports a product at a price lower than the price it normally charges in its own home
market. The WTO AD Agreement allows a country to undergo an investigation and add
an extra duty (AD duty) to an imported product in order to bring the price closer to a
normal value or remove the injury to the domestic industry in the importing country.
Subsidies and Countervailing (CV) Duties: The WTO Agreement on Subsidies and
Countervailing Measures (SCM) disciplines the use of certain subsidies, and regulates the
actions countries can take to counter the effects of subsidies. The Agreement only applies
to specific subsidies — i.e., a subsidy available to an enterprise, industry, group of
enterprises, or group of industries in the country (or state, etc.) that gives the subsidy.
They can be domestic or export subsidies. To overcome the effect of subsidies, a CV duty
can be applied to an imported product after an investigation has taken place.
Safeguards: Emergency measures to temporarily limit imports, designed to “safeguard”
domestic industries.
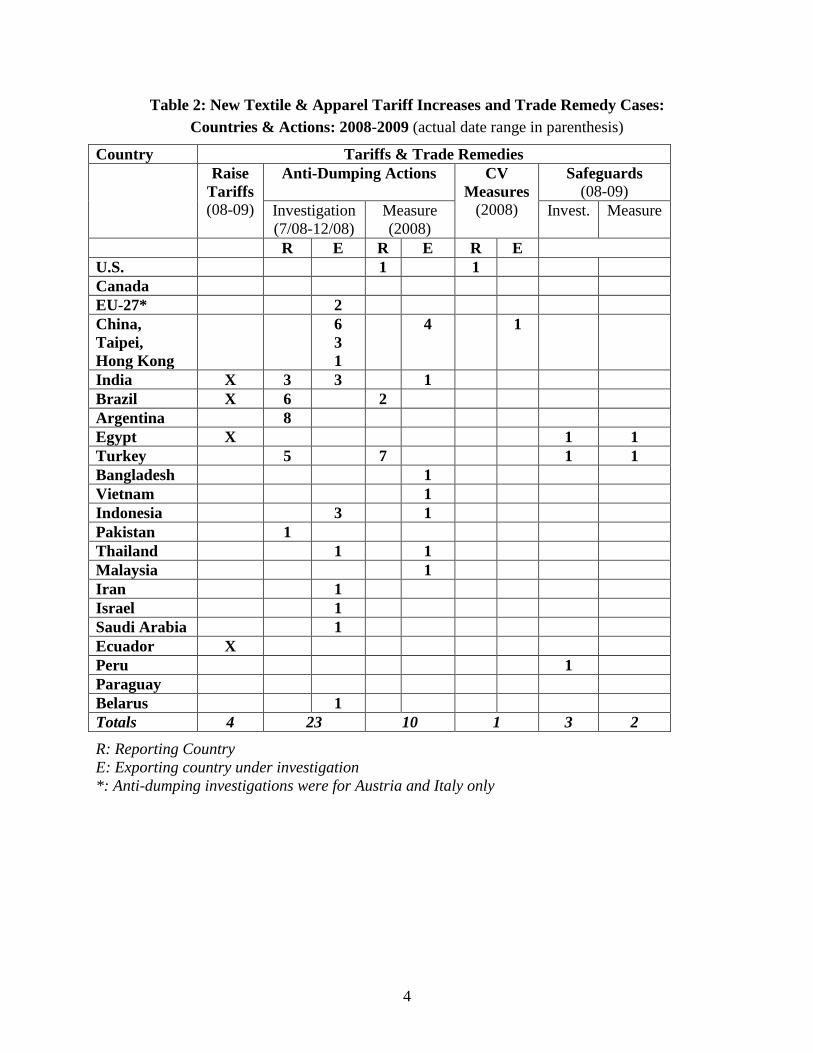
Table 2 shows the total number of tariff increases and trade remedy investigations and
measures that have recently occurred in the T&A sectors. Table 3 compares the number of textile
trade remedy actions to the total number of actions taken by all industries over the same time
period, and with respect to the total number of actions over time.
4
Table 2: New Textile & Apparel Tariff Increases and Trade Remedy Cases:
Countries & Actions: 2008-2009 (actual date range in parenthesis)
Country Tariffs & Trade Remedies
Raise
Tariffs
(08-09)
Anti-Dumping Actions CV
Measures
(2008)
Safeguards
(08-09)
Investigation
(7/08-12/08)
Measure
(2008)
Invest. Measure
R E R E R E
U.S. 1 1
Canada
EU-27* 2
China,
Taipei,
Hong Kong
6
3
1
4 1
India X 3 3 1
Brazil X 6 2
Argentina 8
Egypt X 1 1
Turkey 5 7 1 1
Bangladesh 1
Vietnam 1
Indonesia 3 1
Pakistan 1
Thailand 1 1
Malaysia 1
Iran 1
Israel 1
Saudi Arabia 1
Ecuador X
Peru 1
Paraguay
Belarus 1
Totals 4 23 10 1 3 2
R: Reporting Country
E: Exporting country under investigation
*: Anti-dumping investigations were for Austria and Italy only
5
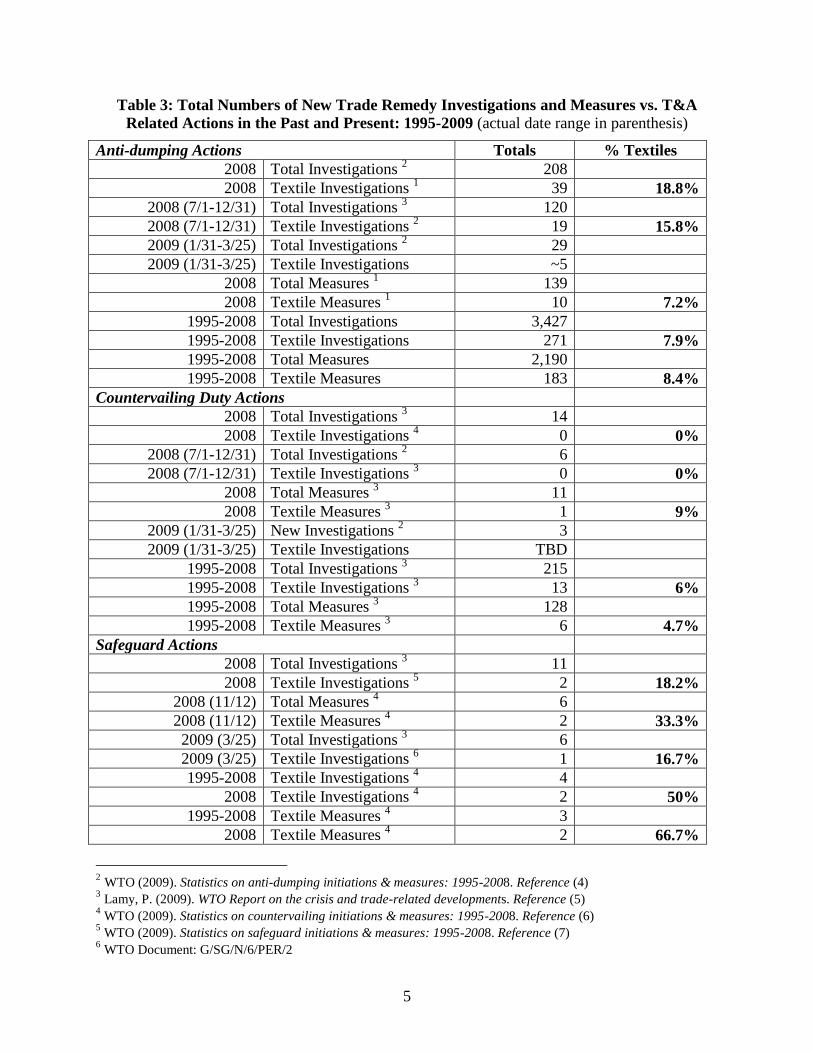
Table 3: Total Numbers of New Trade Remedy Investigations and Measures vs. T&A
Related Actions in the Past and Present: 1995-2009 (actual date range in parenthesis)
Anti-dumping Actions Totals % Textiles
2008 Total Investigations 2 208
2008 Textile Investigations 1 39 18.8%
2008 (7/1-12/31) Total Investigations 3 120
2008 (7/1-12/31) Textile Investigations 2 19 15.8%
2009 (1/31-3/25) Total Investigations 2 29
2009 (1/31-3/25) Textile Investigations ~5
2008 Total Measures 1 139
2008 Textile Measures 1 10 7.2%
1995-2008 Total Investigations 3,427
1995-2008 Textile Investigations 271 7.9%
1995-2008 Total Measures 2,190
1995-2008 Textile Measures 183 8.4%
Countervailing Duty Actions
2008 Total Investigations 3 14
2008 Textile Investigations 4 0 0%
2008 (7/1-12/31) Total Investigations 2 6
2008 (7/1-12/31) Textile Investigations 3 0 0%
2008 Total Measures 3 11
2008 Textile Measures 3 1 9%
2009 (1/31-3/25) New Investigations 2 3
2009 (1/31-3/25) Textile Investigations TBD
1995-2008 Total Investigations 3 215
1995-2008 Textile Investigations 3 13 6%
1995-2008 Total Measures 3 128
1995-2008 Textile Measures 3 6 4.7%
Safeguard Actions
2008 Total Investigations 3 11
2008 Textile Investigations 5 2 18.2%
2008 (11/12) Total Measures 4 6
2008 (11/12) Textile Measures 4 2 33.3%
2009 (3/25) Total Investigations 3 6
2009 (3/25) Textile Investigations 6 1 16.7%
1995-2008 Textile Investigations 4 4
2008 Textile Investigations 4 2 50%
1995-2008 Textile Measures 4 3
2008 Textile Measures 4 2 66.7%
2 WTO (2009). Statistics on anti-dumping initiations & measures: 1995-2008. Reference (4) 3 Lamy, P. (2009). WTO Report on the crisis and trade-related developments. Reference (5)
4 WTO (2009). Statistics on countervailing initiations & measures: 1995-2008. Reference (6)
5 WTO (2009). Statistics on safeguard initiations & measures: 1995-2008. Reference (7)
6 WTO Document: G/SG/N/6/PER/2
6
Import Tariff Increases
There have been four country cases related to increasing tariffs for products in the textile
and apparel sectors. All of these cases are from developing countries (India, Brazil, Ecuador, and
Egypt), primarily targeted at other developing countries. Each concerns textile products (yarn or
fabric) rather than apparel, and they apply to cotton rather than synthetic products.
Anti-Dumping (AD) Investigations and Measures
In 2008, there were 208 AD investigations and 139 AD measures. Of these, 39 (18.8%)
of the investigations and 10 (7.2%) of the measures were in the textile and related articles sector7
(4). According to the WTO report, in the second half of 2008 (July 1-Dec. 31), there were 120
total new AD investigation initiations with 19 related to textiles. Overall, it indicated that the
total number of AD investigations increased by 27% in 2008 compared to 2007 (5).
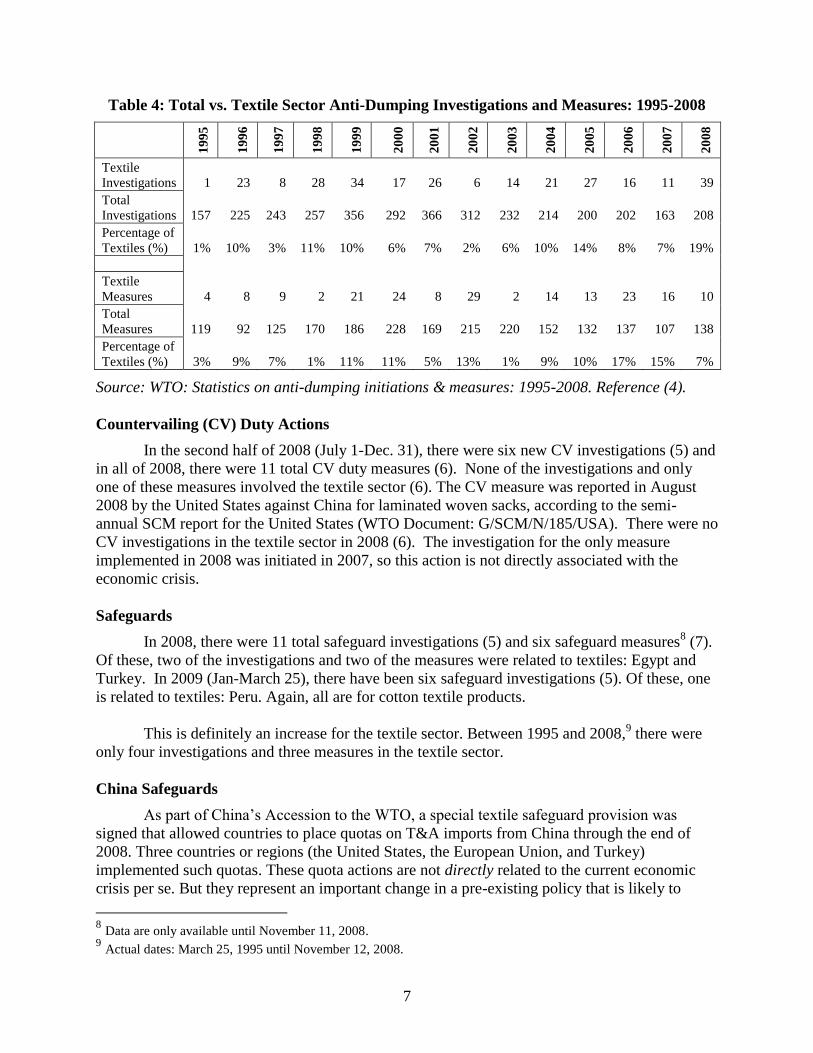
Looking at historical patterns of AD actions, between 1995 and 2008, there were 271 AD
investigations and 183 AD measures in the textiles and related articles sector (4). In Table 4, the
recent trends in AD actions in the T&A industry are compared to historical trends. According to
these data, 2008 represented the highest number of investigations ever reported in one year and
the highest percentage of investigations related to textiles (19%). The total number of
investigations increased by 255% in 2008 compared to 2007. The trend is not as obvious in
textile measures because of the time lapse between carrying out the investigation and imposing a
measure. Therefore, 2009 is likely to see a spike in textile-related AD measures.
Overall, the World Bank report indicated that developing countries accounted for the
majority of investigations (led by India with 29%), and developed countries accounted for the
greatest number of duty impositions (primarily the United States and the European Union) (1).
Yet, this was not entirely the case in the T&A sector. In T&A, all of the investigations and all but
one of the measures were initiated by just five developing countries: Turkey, Brazil, Argentina,
India, and Pakistan (see Table 2). Note that AD actions are only being carried out by a handful of
countries and, like tariff increases, are also entirely for textile products.
7 Textiles and related articles is sector XI in WTO reports.
7
Table 4: Total vs. Textile Sector Anti-Dumping Investigations and Measures: 1995-2008
19
95
19
96
19
97
19
98
19
99
20
00
20
01
20
02
20
03
20
04
20
05
20
06
20
07
20
08
Textile
Investigations 1 23 8 28 34 17 26 6 14 21 27 16 11 39
Total
Investigations 157 225 243 257 356 292 366 312 232 214 200 202 163 208
Percentage of
Textiles (%) 1% 10% 3% 11% 10% 6% 7% 2% 6% 10% 14% 8% 7% 19%
Textile
Measures 4 8 9 2 21 24 8 29 2 14 13 23 16 10
Total
Measures 119 92 125 170 186 228 169 215 220 152 132 137 107 138
Percentage of
Textiles (%) 3% 9% 7% 1% 11% 11% 5% 13% 1% 9% 10% 17% 15% 7%
Source: WTO: Statistics on anti-dumping initiations & measures: 1995-2008. Reference (4).
Countervailing (CV) Duty Actions
In the second half of 2008 (July 1-Dec. 31), there were six new CV investigations (5) and
in all of 2008, there were 11 total CV duty measures (6). None of the investigations and only
one of these measures involved the textile sector (6). The CV measure was reported in August
2008 by the United States against China for laminated woven sacks, according to the semi-
annual SCM report for the United States (WTO Document: G/SCM/N/185/USA). There were no
CV investigations in the textile sector in 2008 (6). The investigation for the only measure
implemented in 2008 was initiated in 2007, so this action is not directly associated with the
economic crisis.
Safeguards
In 2008, there were 11 total safeguard investigations (5) and six safeguard measures8 (7).
Of these, two of the investigations and two of the measures were related to textiles: Egypt and
Turkey. In 2009 (Jan-March 25), there have been six safeguard investigations (5). Of these, one
is related to textiles: Peru. Again, all are for cotton textile products.
This is definitely an increase for the textile sector. Between 1995 and 2008,9 there were
only four investigations and three measures in the textile sector.
China Safeguards
As part of China’s Accession to the WTO, a special textile safeguard provision was
signed that allowed countries to place quotas on T&A imports from China through the end of
2008. Three countries or regions (the United States, the European Union, and Turkey)
implemented such quotas. These quota actions are not directly related to the current economic
crisis per se. But they represent an important change in a pre-existing policy that is likely to
8 Data are only available until November 11, 2008.
9 Actual dates: March 25, 1995 until November 12, 2008.
8
influence future trade patterns and policy responses over the next several months.
4.2 Non-Tariff Barriers
The following non-tariff barriers represent both new and existing actions countries have
in place to either restrict imports or promote domestic consumption. The first barrier relates to
new procedures that are designed to make the international trade process more difficult and thus
restrict imports. The second action, social compliance, is a special case. With the economic crisis
taking a toll on operating margins around the world, firms will be looking for all possible
measures to increase their bottom lines. It will be important to make sure these budget cuts are
not taken at the expense of human health, safety, or the environment.
The final two actions, Generalized System of Preferences and the Government
Procurement Agreement, are both schemes within the WTO designed to encourage international
trade, and participation can actually be seen as a step towards trade liberalization. However, each
country’s participation should be monitored because both programs have mechanisms that can be
used to promote domestic consumption within the scheme.
Trade Procedure Import Barriers
There were two cases of non-automatic import licensing and one case of restricted port
access that included provisions for the T&A sectors (Indonesia & Argentina). At this time,
import procedural hurdles do not seem to be a major method to protect T&A related domestic
industries.
Regarding trade procedures, it is important to keep in mind that the T&A industries are
two of the most complicated sectors even without imposing specified barriers. The number of
materials and configurations that can be combined to create components or final products is
arguably endless. As a result, simply acquiring the knowledge or financial means to navigate
T&A policies and procedures are barriers unto themselves. Any simplification or standardization
of international or national trade processes, labeling, and certification schemes will facilitate
trade and enable developing countries to participate.
Social and Environmental Compliance
Only one instance of reduced social or environmental protection was noted. In China, the
central government has reportedly already relaxed its first workplace-protection requirements
introduced in January 2008 under the Labor Contract Law. In order to help businesses, the
government has permitted local authorities to freeze minimum-wage levels and to reduce or
suspend employers’ social-insurance contributions.
Social and environmental compliance are of the utmost importance for the T&A
industries due to the labor intensity of the apparel industry and the environmental impacts of the
textile industry (i.e., high energy usage and wastewater). In recent years, the T&A industries
have led the way in creating standards to hold firms and countries accountable for their social
and environmental actions. Any changes in this category should be carefully monitored because
relaxing current standards may trickle down to other industries, and non-compliance has the
potential to create the most widespread, long-lasting repercussions.
9
Generalized System of Preferences (GSP)
The GSP is one of the allowable exceptions to the standard, most favored nation (MFN)
tariff that can be granted for developing and least developed countries. This program is important
to the T&A sectors because a large percentage of the gross domestic product and export incomes
of developing countries depends on the apparel (and to a lesser degree, textile) industries.
Currently there are 13 countries that grant GSP preferences: Australia, Belarus, Bulgaria,
Canada, Estonia, EU27, Japan, New Zealand, Norway, Russia, Turkey, Switzerland, and the
United States (8). The United States extends GSP tariff preferences for most products, but it does
not currently extend GSP benefits for most T&A products.10
The country granting GSP benefits chooses the level of the tariff reduction, the countries
that receive the reduction, the rules of origin required, and the products included. In several
ways, the GSP program is similar11
to a free trade or preference agreement, so changes in these
agreements should also be monitored.
There was one new case of modifying the rules of origin requirements to promote
domestic consumption. In 2008, Canada began offering an Outward Processing Remission Order
that further reduces the GSP tariff level for developing countries if they use Canadian textiles to
manufacture apparel exports destined for Canada.
Government Procurement
The WTO has a Government Procurement Agreement (GPA) whose members agree to
apply equal opportunities to all countries for products purchased from each government’s budget
with allowable provisions for domestic production if a country believes national security is an
issue (i.e., military). Currently there are 13 members.12
Increasing the number of countries that
adhere to this agreement may be important for the T&A industries due to the investments
planned for infrastructure developments in several stimulus programs with planned government
spending (see section 4.3 below).
4.3 Government Support & Subsidies
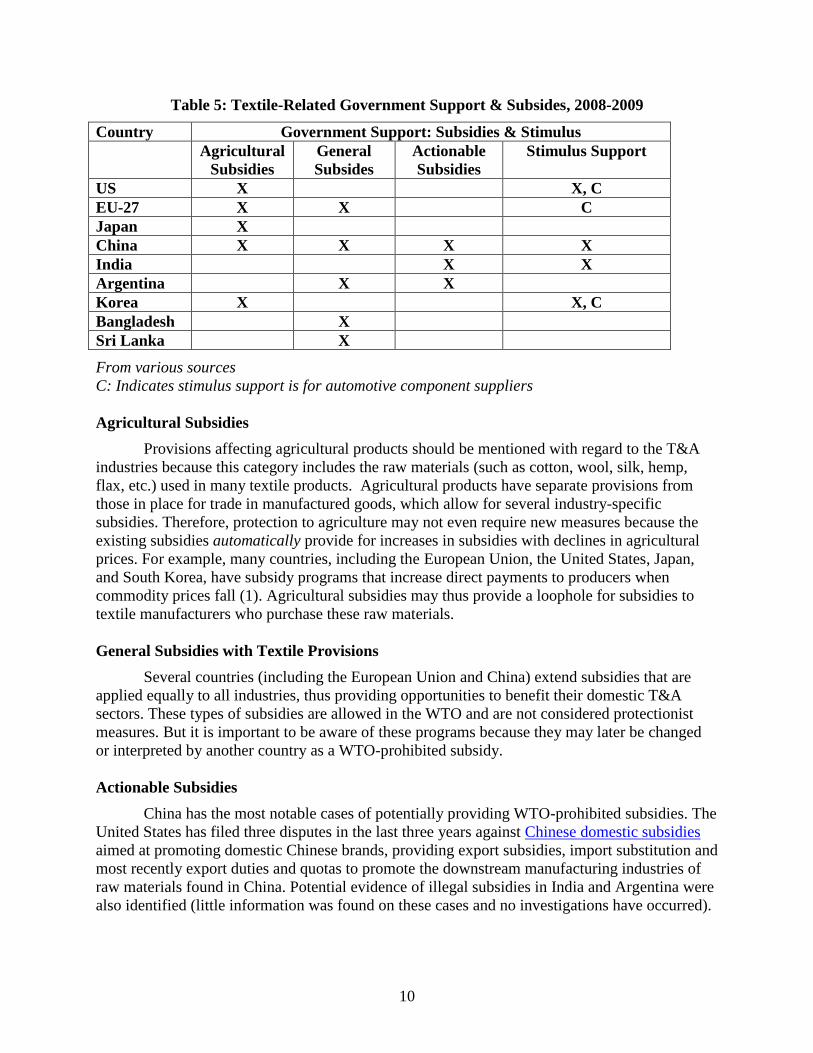
Table 5 and the following section summarize the countries with textile-related
government support, including: agricultural subsidies, general subsidies with textile funding
opportunities, actionable or potentially illegal subsidies, and direct government stimulus funding
for textiles.
10
A few handicrafts receive GSP rates, and the African Growth & Opportunity Act (AGOA) is similar to granting
GSP benefits, although rules of origin and quotas apply. There is a bill pending in U.S. Congress (Tariff Relief
Assistance for Developing Economies Act of 2009) to extend GSP benefits to the 14 least developing countries. 11
The major different is that the GSP program is non-reciprocal. Tariff preferences are unilateral. 12
Members include Canada, EU27, Hong Kong, Iceland, Israel, Japan, Korea, Liechtenstein, the Netherlands with
respect to Aruba, Norway, Singapore, Switzerland, and the United States.
10
Table 5: Textile-Related Government Support & Subsides, 2008-2009
Country Government Support: Subsidies & Stimulus
Agricultural
Subsidies
General
Subsides
Actionable
Subsidies
Stimulus Support
US X X, C
EU-27 X X C
Japan X
China X X X X
India X X
Argentina X X
Korea X X, C
Bangladesh X
Sri Lanka X
From various sources
C: Indicates stimulus support is for automotive component suppliers
Agricultural Subsidies
Provisions affecting agricultural products should be mentioned with regard to the T&A
industries because this category includes the raw materials (such as cotton, wool, silk, hemp,
flax, etc.) used in many textile products. Agricultural products have separate provisions from
those in place for trade in manufactured goods, which allow for several industry-specific
subsidies. Therefore, protection to agriculture may not even require new measures because the
existing subsidies automatically provide for increases in subsidies with declines in agricultural
prices. For example, many countries, including the European Union, the United States, Japan,
and South Korea, have subsidy programs that increase direct payments to producers when
commodity prices fall (1). Agricultural subsidies may thus provide a loophole for subsidies to
textile manufacturers who purchase these raw materials.
General Subsidies with Textile Provisions
Several countries (including the European Union and China) extend subsidies that are
applied equally to all industries, thus providing opportunities to benefit their domestic T&A
sectors. These types of subsidies are allowed in the WTO and are not considered protectionist
measures. But it is important to be aware of these programs because they may later be changed
or interpreted by another country as a WTO-prohibited subsidy.
Actionable Subsidies
China has the most notable cases of potentially providing WTO-prohibited subsidies. The
United States has filed three disputes in the last three years against Chinese domestic subsidies
aimed at promoting domestic Chinese brands, providing export subsidies, import substitution and
most recently export duties and quotas to promote the downstream manufacturing industries of
raw materials found in China. Potential evidence of illegal subsidies in India and Argentina were
also identified (little information was found on these cases and no investigations have occurred).
11
Recent Government Support and Stimulus Packages
Several countries have created stimulus packages that will indirectly assist the textile
sector through government funding allocated for final products that use textiles as a component
such as automobile manufacturing, construction, and infrastructure investments. Three countries,
the United States, Paraguay, and now China, have enacted “buy national” requirements for
government spending under these packages that is likely to have an adverse effect on
international trade. China’s decision to require domestic production is the most notable because
the provision was not originally part of their stimulus package (it was added in May 2009) and
China does not adhere to the GPA. This reversal may spark other countries to follow the trend.
China is also the only significant example of recent government support specifically for
the T&A industry. In 2009, China announced a three-year stimulus package to encourage textile
enterprises to focus on domestic demand, develop rural markets and cultivate homegrown
brands. The general goal is to maintain stable textile production and sales to keep employment.
5. International Trade Patterns
Several important international T&A trade data tables and figures are presented in the
Appendix:
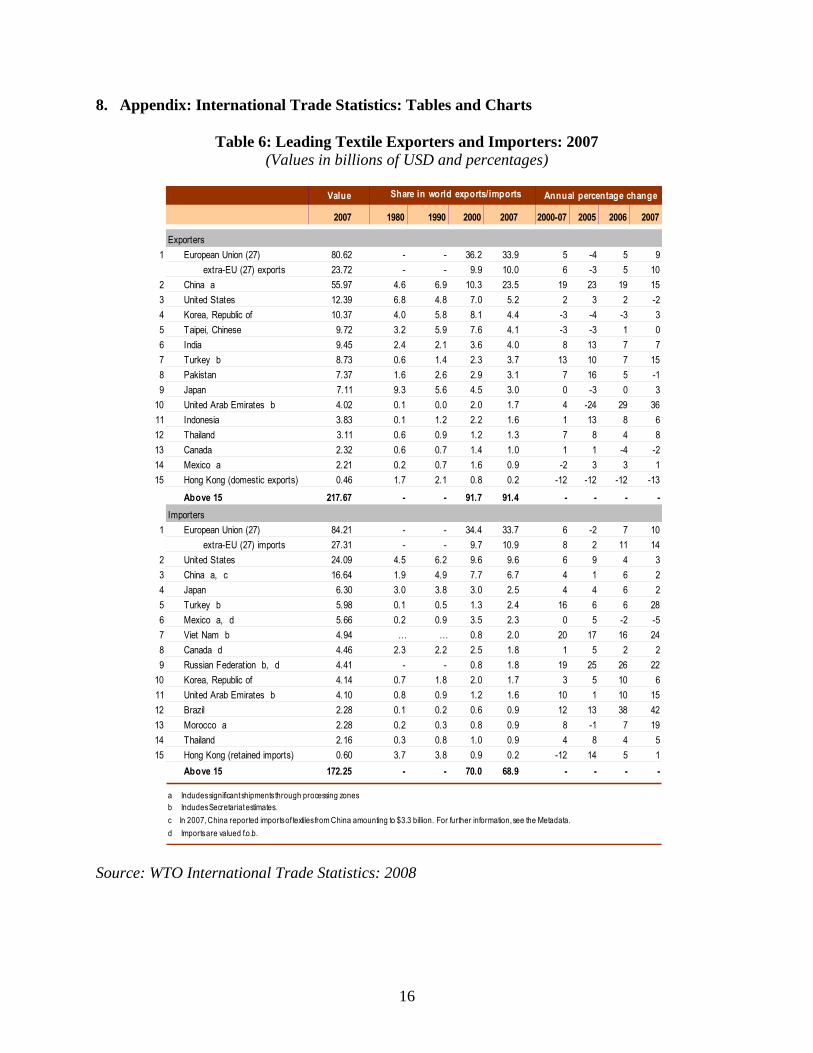
Table 6 lists the leading textile exporting and importing countries in 2007 and how each
country’s percentage of total international textile trade has changed over time
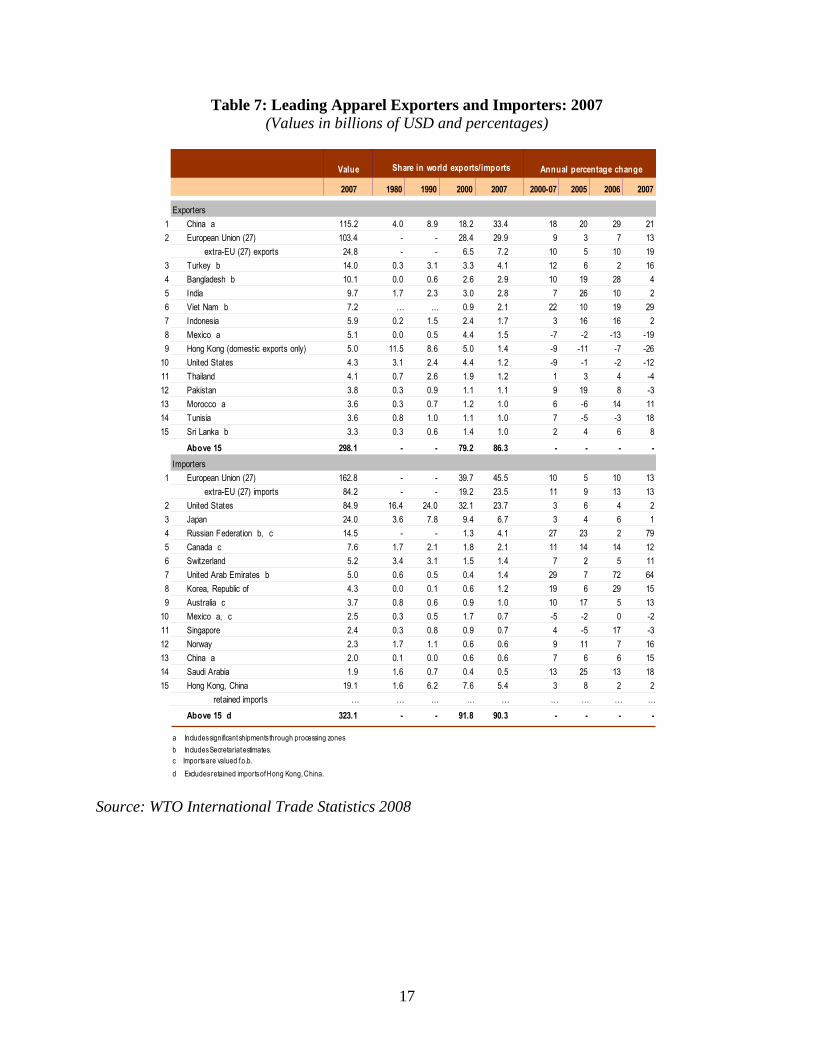
Table 7 provides a similar listing of the leading apparel countries
Table 8 includes only the top 15 T&A exporting countries for 2007
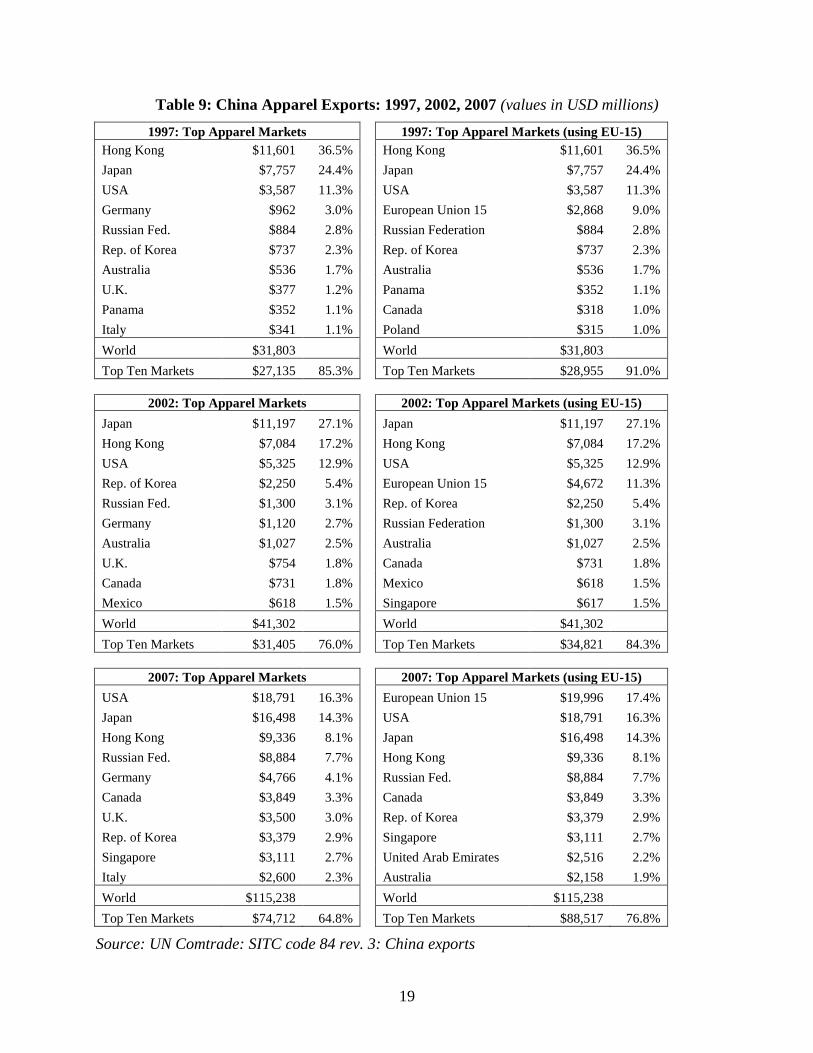
Table 9 includes apparel statistics for China’s top 10 export markets for three years
(1997, 2002, 2007). China is the world’s largest apparel exporter.
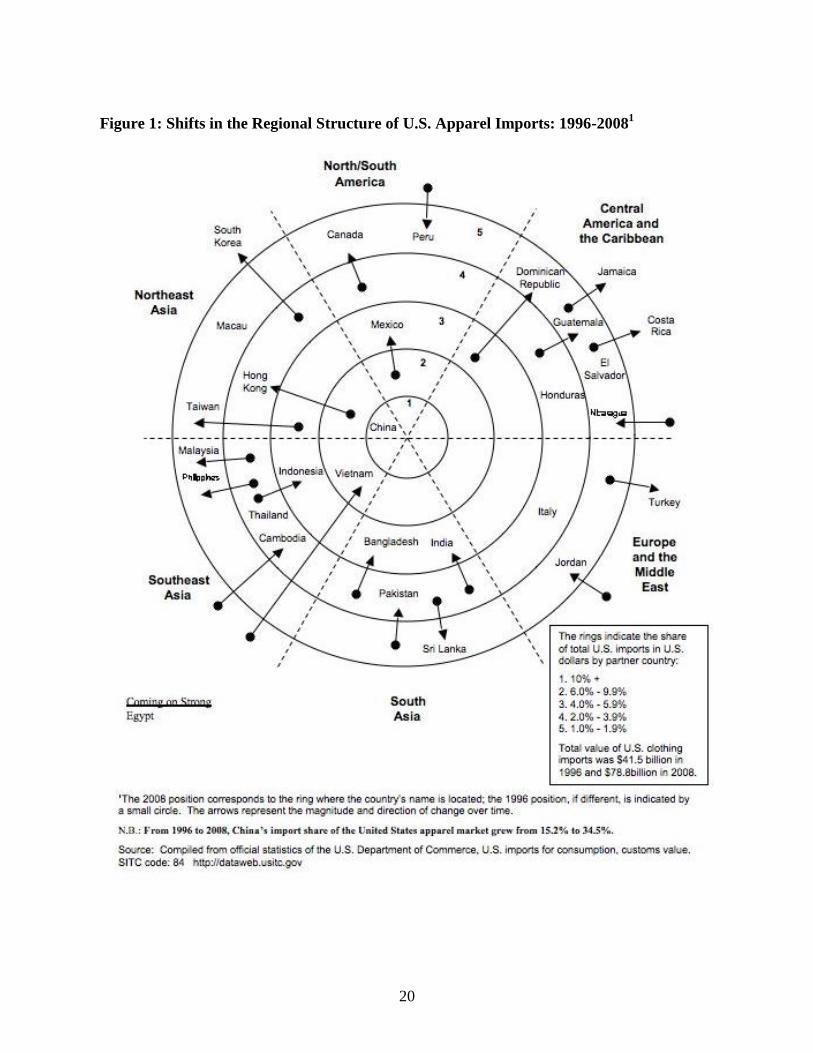
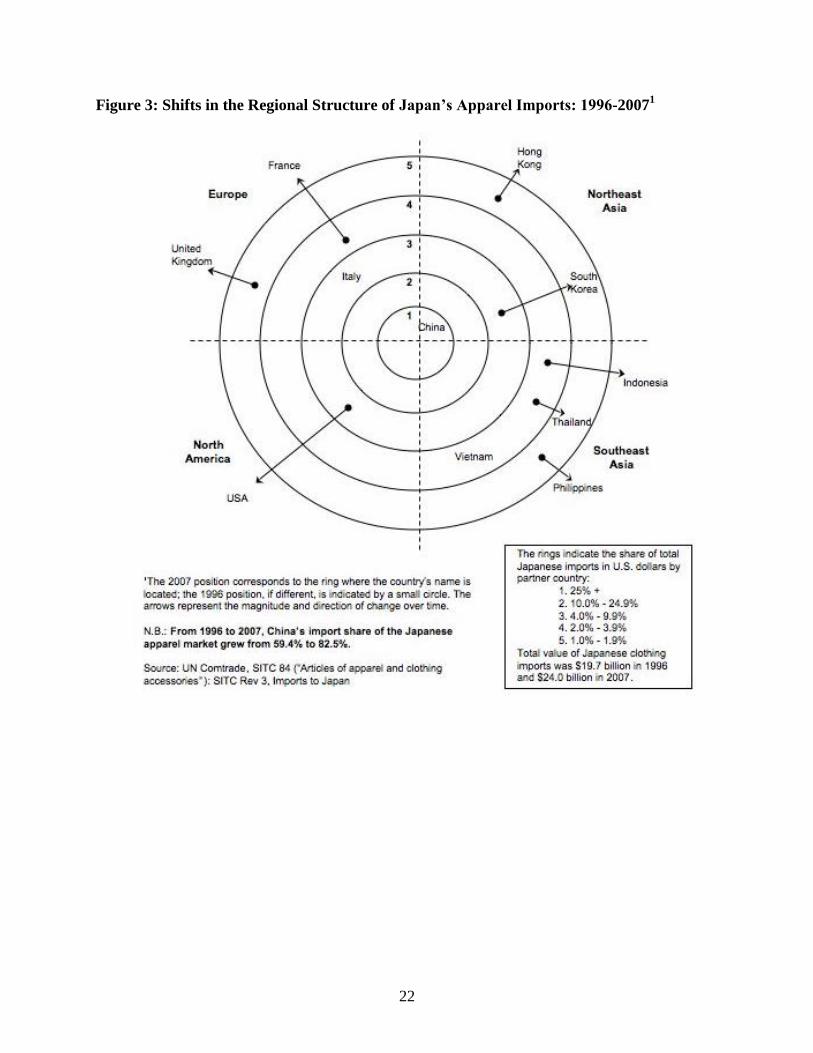
Figures 1-3 depict the regional apparel import patterns for the three largest apparel
importing countries (the United States, EU-15, and Japan)
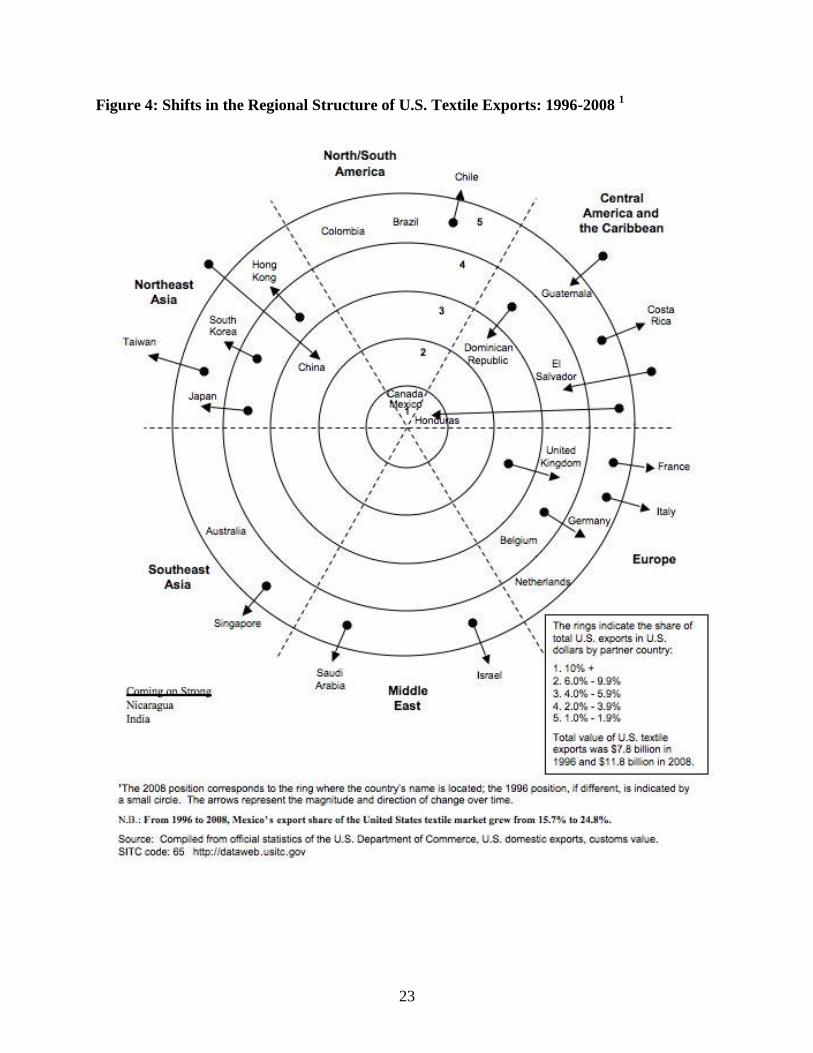
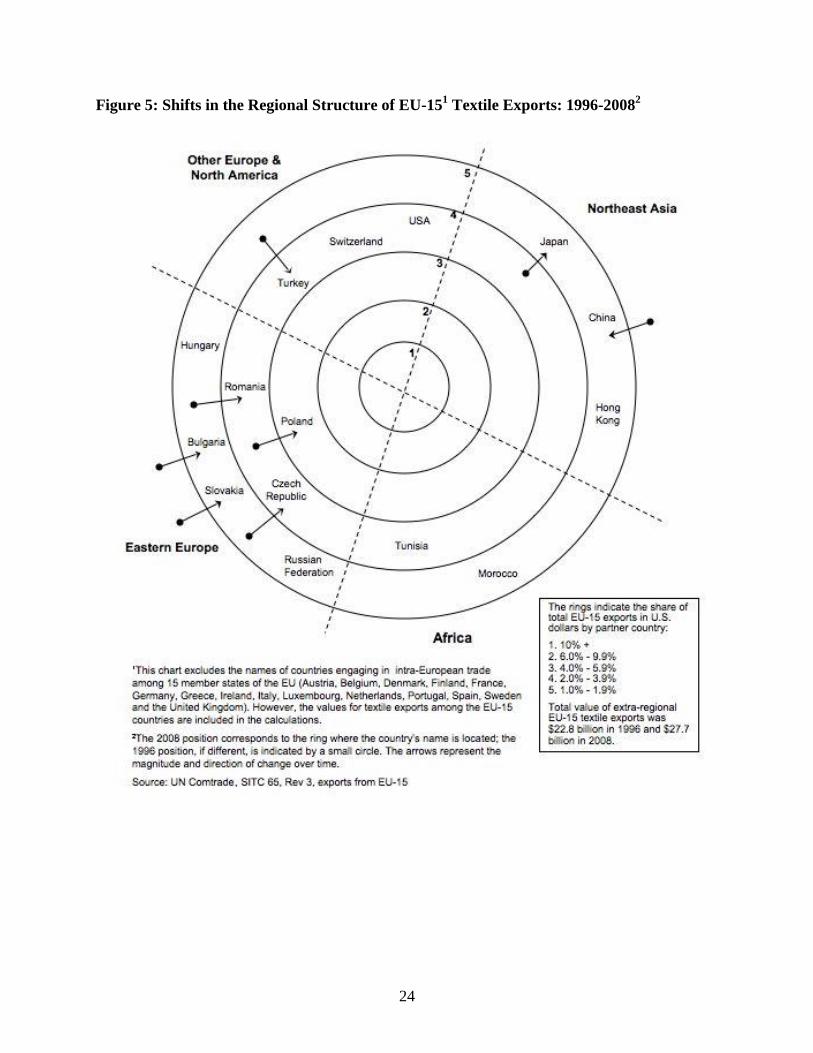
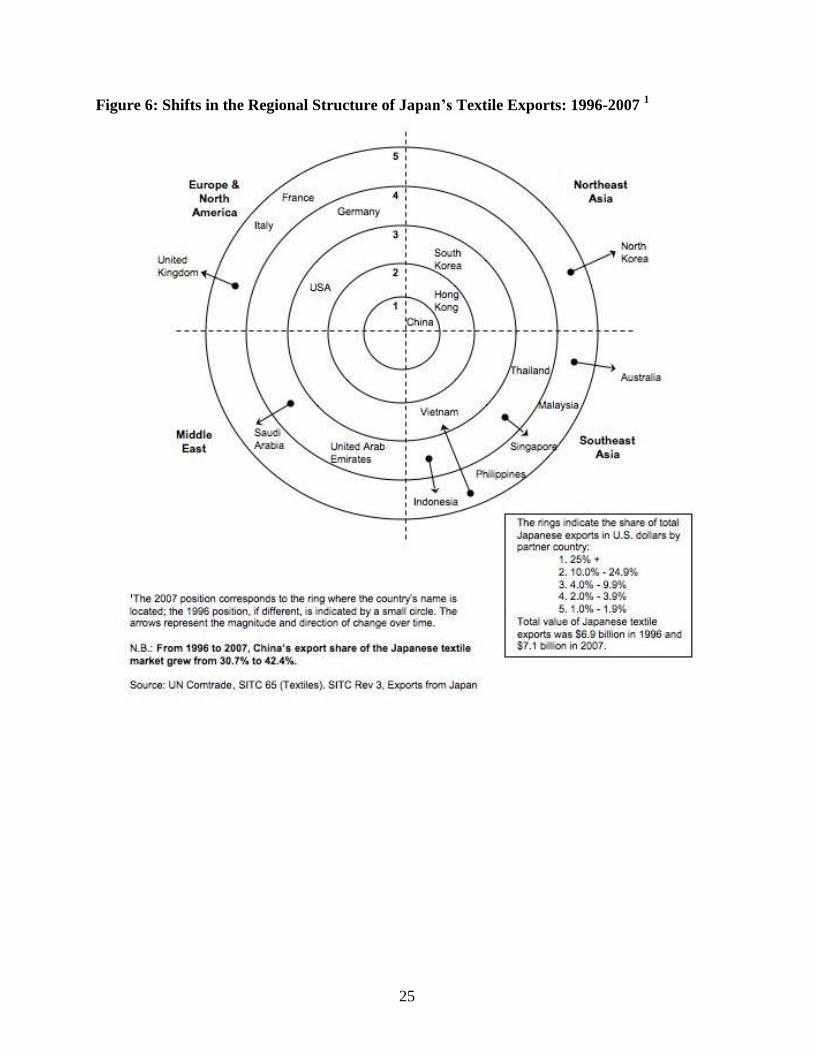
Figures 4-6 depict the changes in textile exports of these three countries.
These trade patterns show the impact of reduced regulations in the T&A sectors,
especially after the removal of quotas. After the MFA quota phase out in 2005, two major trends
occurred in apparel (and to a lesser degree, textile) sourcing. First, the world’s three top apparel
importers (the United States, the European Union, and Japan) all faced a heightened
consolidation of global apparel exports, with China dramatically increasing its share of the
world’s biggest import markets. With no quotas to limit apparel imports following the expiry of
WTO-allowed China safeguards (after 2007 in the European Union and 2008 in the United
States), China has clearly emerged as the leading apparel producer in the world.
Second, China’s impressive pattern of export diversification in apparel means it does not
depend on any specific region to sustain its global market share, unlike the leading apparel
importing countries, which are dependent on China as their key supplier. In 2007, China’s top
apparel export markets were the EU 15 (17.4%), the United States (16.3%), and Japan (14.3%),
which together represent just under one-half (48%) of China’s total apparel exports (see Table
9). By contrast, in 2007, China accounted for 34.5% of apparel imports in the United States,
24.9% in the EU 15, and an astronomical 82% of Japan’s apparel imports (Appendix: Figures 1-
3). Given this striking asymmetry in China’s role in global apparel markets, it might be difficult
12
for one country to combat potentially illegal Chinese subsidies. If allegations of protectionism
are true, several countries may need to join forces to confront the issue.
After consolidation, the other trend is the growing importance of regionalization in T&A
sourcing networks. This is most clearly evident in the European Union’s sourcing patterns, but is
also evident in both the United States and Japan (Appendix: Figures 1-6).
6. Trends, Conclusions, & Recommendations
The overall trends, conclusions and possible recommendations for the future in the T&A
industries can be summarized as follows.
Recent Trends and Conclusions:
Trade Remedies: Overall, the number of textile cases in 2008 was high (especially in AD
investigations and safeguards) with respect to both the number of recent cases and historical
trends. Even though the AD percentages were high, they were initiated by only a handful of
reporting countries against a small number of exporting countries. Furthermore, the list of
products being protected is limited to a relatively small set of textile items. Finally, we should
note that many of the countries initiating actions do not play a significant role in international
textile trade (Appendix: Tables 6 & 7).
Since it can be costly and time consuming to investigate and implement trade remedies or non-
tariff barriers, these measures may be prohibitive for many of the developing countries to
effectively implement. Therefore the magnitude of these measures is likely to be much less than
in the past when developed countries with more money and power were initiating them. When
economic conditions improve, this trend is likely to decrease.
Non-tariff barriers: Imposing new non-tariff barriers does not appear to be a significant trend
compared to the total number of actions for all industries or for the T&A industries. The issue of
social and environmental compliance is likely to grow in importance, and it should be
encouraged as a way to foster social and economic upgrading in developing economies.
Government subsidies and support: In comparison to recent investments for other industries
(such as finance and automotive), the number of textile-specific government support cases is
very low. China is the only country with potentially significant investments planned for the
textile industry, and these should be carefully monitored. Equally important have been changes
to existing, allowable agricultural subsidies. Even though (in most cases) these are not granted
directly to companies in the T&A sectors, subsidizing textile raw materials is a way to legally
protect an important piece of the T&A supply chain. Whereas agricultural subsidies do not
appear to be a significant issue now, they provide a potential loophole to protect and support
manufacturers that purchase domestic cotton or other natural fibers.
Historical Trends and Conclusions:
When recent trends are compared to historical T&A protectionist actions, two shifts in the center
of gravity are evident:
The first shift is from developed to developing countries as the initiators of trade actions.
In the past, the European Union and the United States were the forces promoting and
13
implementing trade-restricting policies. Yet in the most recent actions, developing
countries have been the ones responsible for initiating trade barriers, primarily aimed at
limiting imports from other developing countries. Developed countries are reducing their
trade remedy actions and they are moving toward a greater use of free trade agreements.
The second shift is from protecting the apparel industry to protecting the textile and raw
material industries. Almost all of the recent trade-restricting measures seek to protect
textile rather than apparel producers. In the past, the major apparel-importing countries
(developed economies, such as the European Union and the United States) were the
primary advocates for restrictive trade measures, mainly aimed at protecting the apparel
rather than the textile industry.
Now that these restrictive policies have expired and these countries’ T&A production capacities
are drastically reduced, three new trends can be detected:
Regionalization: Regional sourcing is becoming more important and there are an
increasing number of bilateral and multilateral agreements. Countries that do not actively
pursue such agreements (other than China) will find it difficult to compete in the future.
This trend is expected to intensify with new concerns about protecting the environment.
The European Union is the most notable example of changing its focus from protectionist
policies to developing regional sourcing networks with Eastern and Central Europe. For
instance, in April 2009, the European Union abolished the anti-dumping duty on bed
linens from Pakistan (3), historically one of the most protected products by the European
Union (9), especially from India and Pakistan (10). Furthermore, two more countries
were added to the European Union in 2007, and several other trade partnerships (Euro-
Mediterranean Partnerships), preference schemes (GSP+), and customs unions (Turkey)
have been created.
Focus on China: After all quotas were removed in 2008, China clearly increased its role
as the leading apparel exporter and also as a textile exporter. The quota system actually
encouraged China to develop the capacity to produce every item in the T&A supply chain
(11). Now China is moving up the value chain into higher value activities such as
branding and marketing. In the past, these value-adding activities were seldom the target
of protectionist measures because only a few countries (primarily the United States and
the European Union) had the skills and market power to compete in this arena.
Currently, the United States has switched to monitoring China’s recent investments in
developing domestic brands because this now poses much more of a threat to U.S.
apparel marketers than to pure textile and apparel manufacturers. This trend is similar to
the previous lack of protection directed towards the textile industry. Since textiles are
more complex than apparel, fewer countries had the capacity to integrate backwards from
apparel to textiles, resulting in less competition and fewer protectionist measures.
Diversification: Japan is taking measures to diversify its sources of apparel import
supply in order to move away from its extreme dependence on China. Japan would like
to cut China’s import market share of textiles and apparel to only 50 percent. Japan is
working with factories in Bangladesh as well as Indonesia and other nations within the
Association of Southeast Asian Nations (ASEAN) to take advantage of their free trade
agreement there (12; 13).
14
In summary, compared to the last four decades, the current situation in the T&A industries is
much improved and the environment is more liberal than before. If the comparison is
extended to the early 1970s, when the MFA was introduced, the situation today represents
the most "liberal" period for T&A in several decades. In light of this, we see very few
significant elements of protectionism compared to the past.
General Recommendations:
For the developed economies (the United States, the European Union, and Japan), the
vast majority of apparel production has already moved offshore. Therefore, there is no
domestic apparel industry left to protect. The main emphasis for these economies should
be to strengthen innovation in their T&A sectors, including mass customization
manufacturing, high quality fabrics, and technical textiles for non-traditional products
(such as medical applications, the construction industry, and new textile materials).
Regional sourcing is of growing importance in the T&A industries, and it is being used
extensively by the United States, the European Union, and Japan to reduce their reliance
on apparel imports from China. Rules of origin should be expanded to include regional
trading blocs that include the capability to produce full-package garments.
Encourage relaxed rules of origin to facilitate T&A exports from the least developed
countries, such as those in sub-Saharan Africa. Apparel assembly is the lowest rung on
the textile-apparel supply chain and one of the best ways to stimulate export-oriented
industrialization for many poor nations. A country will develop the capacity to
manufacture garments long before fabric and yarn, and thus in many cases requiring
“double transformation” (in both apparel and textiles) in a country is not feasible.
China is the world’s largest producer of textile and apparel products. While it has been
accused of various alleged trading abuses, such as using export subsidies to unfairly
advantage domestic producers, it is also under great pressure as a result of the recent
economic crisis to stabilize T&A production and sales to maintain employment. China’s
trade actions should be closely monitored, but the country should also be encouraged to
sustain its labor reforms and to continue its investments in the sector aimed at promoting
social as well as economic upgrading.
Social and environmental compliance is emerging as a very important issue for the T&A
industries due to the labor intensity of the apparel industry and the environmental impact
of the textile industry (e.g., high usage of energy and waste water). Many of the leading
global retailers and manufacturers of T&A products are establishing campaigns to create
more sustainable supply chains and products, and they are in a strong position to promote
improvements in labor and environmental conditions in the most important developing
country exporters, such as China, India, Bangladesh, Indonesia, and Pakistan. These
social and environmental efforts should be maintained and strengthened.
15
7. References
(1) Gamberoni, E., & Newfarmer, R. (2009). Trade protection: Incipient but worrisome trends
Trade Note #37. Washington, D.C.: World Bank, International Trade Department.
(2) Baldwin, R., & Evenett, S. (2009). The collapse of global trade, murky protectionism, and
the crisis: Recommendations for the G20. London, UK: Center for Economic Policy
Research (CEPR).
(3) just-style.com (2009). Analysis: Do stimulus packages help the garment trade? Just-Style
Weekly (468). Retrieved from http://www.just-style.com/article.aspx?id=103915&lk=dm
(4) WTO Committee on Anti-dumping Practices. (2009). Statistics on anti-dumping initiations &
measures: 1995-2008. Geneva, Switzerland: World Trade Organization (WTO).
(5) Lamy, P. (2009). Report to the TPRB from the director-general on the financial and
economic crisis and trade-related developments. Switzerland: World Trade Organization
(WTO).
(6) WTO Committee on SCM Practices. (2009). Statistics on countervailing initiations &
measures: 1995-2008. Geneva, Switzerland: World Trade Organization (WTO).
(7) WTO Committee on Safeguards. (2009). Statistics on safeguard initiations & measures:
1995-2008. Geneva, Switzerland: World Trade Organization (WTO).
(8) UNCTAD. (2006). Generalized system of preferences: List of beneficiaries (2nd Revision).
New York, NY: United Nations.
(9) Adhikari, R., & Yamamoto, Y. (2007). The textile and clothing industry: Adjusting to the
post-quota world; included in the Industrial Development for the 21st Century Series.
United Nations Development Program (UNDP).
(10) Adhikari, R., & Weeratunge, C. (2007). Textiles and clothing in South Asia: current status
and future potential. South Asia Economic Journal, 8(2), 171-203.
(11) Gereffi, G. & Memedovic, O. (2003). The global apparel value chain: what prospects for
upgrading for developing countries. Vienna, Austria: United Nations Industrial
Development Organization (UNIDO).
(12) just-style.com (2009). Japan: China sourcing cuts could raise costs for US, EU buyers. Just-
style, March 4. Retrieved from http://www.just-style.com/article.aspx?id=103487&lk=dm
(13) Japan mulls importing more Indonesian textiles (2009). Jakarta Globe; February 24 Issue.
Retrieved from FashionNetAsia.com:
https://www.fashionnetasia.com/industryupdate/details.aspx?lang=0&sid=22&pid=2254
16
8. Appendix: International Trade Statistics: Tables and Charts
Table 6: Leading Textile Exporters and Importers: 2007
(Values in billions of USD and percentages)
2007 1980 1990 2000 2007 2000-07 2005 2006 2007
Exporters
1 European Union (27) 80.62 - - 36.2 33.9 5 -4 5 9
extra-EU (27) exports 23.72 - - 9.9 10.0 6 -3 5 10
2 China a 55.97 4.6 6.9 10.3 23.5 19 23 19 15
3 United States 12.39 6.8 4.8 7.0 5.2 2 3 2 -2
4 Korea, Republic of 10.37 4.0 5.8 8.1 4.4 -3 -4 -3 3
5 Taipei, Chinese 9.72 3.2 5.9 7.6 4.1 -3 -3 1 0
6 India 9.45 2.4 2.1 3.6 4.0 8 13 7 7
7 Turkey b 8.73 0.6 1.4 2.3 3.7 13 10 7 15
8 Pakistan 7.37 1.6 2.6 2.9 3.1 7 16 5 -1
9 Japan 7.11 9.3 5.6 4.5 3.0 0 -3 0 3
10 United Arab Emirates b 4.02 0.1 0.0 2.0 1.7 4 -24 29 36
11 Indonesia 3.83 0.1 1.2 2.2 1.6 1 13 8 6
12 Thailand 3.11 0.6 0.9 1.2 1.3 7 8 4 8
13 Canada 2.32 0.6 0.7 1.4 1.0 1 1 -4 -2
14 Mexico a 2.21 0.2 0.7 1.6 0.9 -2 3 3 1
15 Hong Kong (domestic exports) 0.46 1.7 2.1 0.8 0.2 -12 -12 -12 -13
Above 15 217.67 - - 91.7 91.4 - - - -
Importers
1 European Union (27) 84.21 - - 34.4 33.7 6 -2 7 10
extra-EU (27) imports 27.31 - - 9.7 10.9 8 2 11 14
2 United States 24.09 4.5 6.2 9.6 9.6 6 9 4 3
3 China a, c 16.64 1.9 4.9 7.7 6.7 4 1 6 2
4 Japan 6.30 3.0 3.8 3.0 2.5 4 4 6 2
5 Turkey b 5.98 0.1 0.5 1.3 2.4 16 6 6 28
6 Mexico a, d 5.66 0.2 0.9 3.5 2.3 0 5 -2 -5
7 Viet Nam b 4.94 ... ... 0.8 2.0 20 17 16 24
8 Canada d 4.46 2.3 2.2 2.5 1.8 1 5 2 2
9 Russian Federation b, d 4.41 - - 0.8 1.8 19 25 26 22
10 Korea, Republic of 4.14 0.7 1.8 2.0 1.7 3 5 10 6
11 United Arab Emirates b 4.10 0.8 0.9 1.2 1.6 10 1 10 15
12 Brazil 2.28 0.1 0.2 0.6 0.9 12 13 38 42
13 Morocco a 2.28 0.2 0.3 0.8 0.9 8 -1 7 19
14 Thailand 2.16 0.3 0.8 1.0 0.9 4 8 4 5
15 Hong Kong (retained imports) 0.60 3.7 3.8 0.9 0.2 -12 14 5 1
Above 15 172.25 - - 70.0 68.9 - - - -
b Includes Secretariat estimates.
c In 2007, China reported imports of textiles from China amounting to $3.3 billion. For further information, see the Metadata.
d Imports are valued f.o.b.
Leading Textile Expor ter s and Impor ter s: 2007
a Includes significant shipments through processing zones
(Billion dollars and percentage)
Share in world exports/imports Value Annual percentage change
Source: WTO International Trade Statistics: 2008
17
Table 7: Leading Apparel Exporters and Importers: 2007 (Values in billions of USD and percentages)
2007 1980 1990 2000 2007 2000-07 2005 2006 2007
Exporters
1 China a 115.2 4.0 8.9 18.2 33.4 18 20 29 21
2 European Union (27) 103.4 - - 28.4 29.9 9 3 7 13
extra-EU (27) exports 24.8 - - 6.5 7.2 10 5 10 19
3 Turkey b 14.0 0.3 3.1 3.3 4.1 12 6 2 16
4 Bangladesh b 10.1 0.0 0.6 2.6 2.9 10 19 28 4
5 India 9.7 1.7 2.3 3.0 2.8 7 26 10 2
6 Viet Nam b 7.2 ... ... 0.9 2.1 22 10 19 29
7 Indonesia 5.9 0.2 1.5 2.4 1.7 3 16 16 2
8 Mexico a 5.1 0.0 0.5 4.4 1.5 -7 -2 -13 -19
9 Hong Kong (domestic exports only) 5.0 11.5 8.6 5.0 1.4 -9 -11 -7 -26
10 United States 4.3 3.1 2.4 4.4 1.2 -9 -1 -2 -12
11 Thailand 4.1 0.7 2.6 1.9 1.2 1 3 4 -4
12 Pakistan 3.8 0.3 0.9 1.1 1.1 9 19 8 -3
13 Morocco a 3.6 0.3 0.7 1.2 1.0 6 -6 14 11
14 Tunisia 3.6 0.8 1.0 1.1 1.0 7 -5 -3 18
15 Sri Lanka b 3.3 0.3 0.6 1.4 1.0 2 4 6 8
Above 15 298.1 - - 79.2 86.3 - - - -
Importers
1 European Union (27) 162.8 - - 39.7 45.5 10 5 10 13
extra-EU (27) imports 84.2 - - 19.2 23.5 11 9 13 13
2 United States 84.9 16.4 24.0 32.1 23.7 3 6 4 2
3 Japan 24.0 3.6 7.8 9.4 6.7 3 4 6 1
4 Russian Federation b, c 14.5 - - 1.3 4.1 27 23 2 79
5 Canada c 7.6 1.7 2.1 1.8 2.1 11 14 14 12
6 Switzerland 5.2 3.4 3.1 1.5 1.4 7 2 5 11
7 United Arab Emirates b 5.0 0.6 0.5 0.4 1.4 29 7 72 64
8 Korea, Republic of 4.3 0.0 0.1 0.6 1.2 19 6 29 15
9 Australia c 3.7 0.8 0.6 0.9 1.0 10 17 5 13
10 Mexico a, c 2.5 0.3 0.5 1.7 0.7 -5 -2 0 -2
11 Singapore 2.4 0.3 0.8 0.9 0.7 4 -5 17 -3
12 Norway 2.3 1.7 1.1 0.6 0.6 9 11 7 16
13 China a 2.0 0.1 0.0 0.6 0.6 7 6 6 15
14 Saudi Arabia 1.9 1.6 0.7 0.4 0.5 13 25 13 18
15 Hong Kong, China 19.1 1.6 6.2 7.6 5.4 3 8 2 2
retained imports ... ... ... ... ... ... ... ... ...
Above 15 d 323.1 - - 91.8 90.3 - - - -
c Imports are valued f.o.b.
d Excludes retained imports of Hong Kong, China.
Leading Appar el Expor ter s and Impor ter s: 2007
a Includes significant shipments through processing zones
b Includes Secretariat estimates.
(Billion dollars and percentage)
Share in world exports/imports Value Annual percentage change
Source: WTO International Trade Statistics 2008

18
Table 8: Top 15 Textile and Apparel Exporting Countries or Regions: 2007
Country Share in
World
Textile
Exports
(%)
Share in
World
Apparel
Exports
(%)
EU27 33.9 29.9
Extra-EU27 exports 10.0 7.2
China 23.5 33.4
U.S. 5.2 1.2
Korea 4.4
Taipei, Chinese 4.1
India 4.0 2.8
Turkey 3.7 4.1
Pakistan 3.1 1.1
Japan 3.0
United Arab Emirates 1.7
Indonesia 1.6 1.7
Thailand 1.3 1.2
Canada 1.0
Mexico 0.9 1.5
Hong Kong
(domestic exports only)
0.2 1.4
Bangladesh 2.9
Vietnam 2.1
Morocco 1.0
Tunisia 1.0
Sri Lanka 1.0
Top 15 Total: 91.4 86.3
Source: WTO International Trade Statistics 2008
19
Table 9: China Apparel Exports: 1997, 2002, 2007 (values in USD millions)
1997: Top Apparel Markets 1997: Top Apparel Markets (using EU-15)
Hong Kong $11,601 36.5% Hong Kong $11,601 36.5%
Japan $7,757 24.4% Japan $7,757 24.4%
USA $3,587 11.3% USA $3,587 11.3%
Germany $962 3.0% European Union 15 $2,868 9.0%
Russian Fed. $884 2.8% Russian Federation $884 2.8%
Rep. of Korea $737 2.3% Rep. of Korea $737 2.3%
Australia $536 1.7% Australia $536 1.7%
U.K. $377 1.2% Panama $352 1.1%
Panama $352 1.1% Canada $318 1.0%
Italy $341 1.1% Poland $315 1.0%
World $31,803 World $31,803
Top Ten Markets $27,135 85.3% Top Ten Markets $28,955 91.0%
2002: Top Apparel Markets 2002: Top Apparel Markets (using EU-15)
Japan $11,197 27.1% Japan $11,197 27.1%
Hong Kong $7,084 17.2% Hong Kong $7,084 17.2%
USA $5,325 12.9% USA $5,325 12.9%
Rep. of Korea $2,250 5.4% European Union 15 $4,672 11.3%
Russian Fed. $1,300 3.1% Rep. of Korea $2,250 5.4%
Germany $1,120 2.7% Russian Federation $1,300 3.1%
Australia $1,027 2.5% Australia $1,027 2.5%
U.K. $754 1.8% Canada $731 1.8%
Canada $731 1.8% Mexico $618 1.5%
Mexico $618 1.5% Singapore $617 1.5%
World $41,302 World $41,302
Top Ten Markets $31,405 76.0% Top Ten Markets $34,821 84.3%
2007: Top Apparel Markets 2007: Top Apparel Markets (using EU-15)
USA $18,791 16.3% European Union 15 $19,996 17.4%
Japan $16,498 14.3% USA $18,791 16.3%
Hong Kong $9,336 8.1% Japan $16,498 14.3%
Russian Fed. $8,884 7.7% Hong Kong $9,336 8.1%
Germany $4,766 4.1% Russian Fed. $8,884 7.7%
Canada $3,849 3.3% Canada $3,849 3.3%
U.K. $3,500 3.0% Rep. of Korea $3,379 2.9%
Rep. of Korea $3,379 2.9% Singapore $3,111 2.7%
Singapore $3,111 2.7% United Arab Emirates $2,516 2.2%
Italy $2,600 2.3% Australia $2,158 1.9%
World $115,238 World $115,238
Top Ten Markets $74,712 64.8% Top Ten Markets $88,517 76.8%
Source: UN Comtrade: SITC code 84 rev. 3: China exports
20
Figure 1: Shifts in the Regional Structure of U.S. Apparel Imports: 1996-20081

21
Figure 2: Shifts in the Regional Structure of EU-151 Apparel Imports: 1996-2007
2
22
Figure 3: Shifts in the Regional Structure of Japan’s Apparel Imports: 1996-20071
23
Figure 4: Shifts in the Regional Structure of U.S. Textile Exports: 1996-2008 1
24
Figure 5: Shifts in the Regional Structure of EU-151 Textile Exports: 1996-2008
2
25
Figure 6: Shifts in the Regional Structure of Japan’s Textile Exports: 1996-2007 1