review and assessment of data quality in the national … and assessment of data quality in the...
TRANSCRIPT

Review and Assessment of Data Quality in the National Fire Incident
Reporting SystemNational Fire Data Center
May 2017


Mission StatementWe provide national leadership to foster a solid foundation for our fi re and emergency services stakeholders in prevention, preparedness and response.


Review and Assessment of Data Quality in the National
Fire Incident Reporting SystemNational Fire Data Center
May 20171
1This publication was originally submitted to the Office of Management and Budget in September 2014 and approved in February 2016 as per the requirements of the Paperwork Reduction Act of 1995.


iTable of Contents
Table of ContentsIntroduction ......................................................................................................................... 1
About the National Fire Incident Reporting System ...................................................... 3National Fire Incident Reporting System Enhancements ....................................... 7National Fire Incident Reporting System Training ................................................... 8Uses of the National Fire Incident Reporting System .............................................. 9The National Fire Incident Reporting System and the National Fire Protection
Association Survey ................................................................................................. 10
Incident Reporting and Submission Process ................................................................... 12Incident Reporting ........................................................................................................ 12Submission to the National Production Database ................................................... 13Public Data Release and Data Review ........................................................................ 13Data Quality and U.S. Fire Administration Interaction With States ...................... 15Data Quality Checks by the National Fire Data Center ........................................... 15
Key Data Considerations for the User .............................................................................. 17Unknown Entries ........................................................................................................... 17Fires Versus National Fire Incident Reporting System Record Counts.................. 17Counting Fires Versus Counting Fire-Related Statistics .......................................... 17Confined Versus Nonconfined Fires ........................................................................... 17Mutual Aid ...................................................................................................................... 18Types of Fires ................................................................................................................. 18Property Definitions ..................................................................................................... 18Multiyear and Trend Analyses..................................................................................... 18Cause .............................................................................................................................. 19Smoke Alarms and Smoke Alarm Performance ....................................................... 22Dollar Loss Data ............................................................................................................ 22Structures, Buildings and Nonbuildings .................................................................... 22
The National Fire Incident Reporting System Data Quality .......................................... 23State-Based Data Quality ............................................................................................ 23Data Quality of Key Data Elements ............................................................................ 26The National Fire Incident Reporting System Data Element Quality .................... 30
National Fire Protection Association Survey ................................................................... 78Sample Selection ........................................................................................................... 78Data Collection .............................................................................................................. 79Estimation Methodology ............................................................................................. 79Fire Experience of Nonrespondents .......................................................................... 80
Resources ............................................................................................................................. 82
Acronyms .............................................................................................................................. 84
ii Review and Assessment of Data Quality in the National Fire Incident Reporting System
List of FiguresFigure 1. NFIRS Fire Department Participation 1980 to 2011, Fire Incidents Only ..... 4
Figure 2. Total Reported Fire Incidents, NFIRS Public Data Release 2003 to 2011 ..... 7
Figure 3. NFIRS Incident Reporting, Submission and Dissemination Process ............ 14
Figure 4. Three-Year NFIRS Data Quality by State Relative to National Average Data Quality Measure, 2009 to 2011 ................................................................................... 24
Figure 5. Annual NFIRS Data Quality by State Relative to National Average Data Quality Measure, 2009 to 2011 ................................................................................... 25
List of TablesTable 1. NFIRS Modules ....................................................................................................... 5
Table 2. NFIRS Fire Incident Data Reporting by Version (Percent) ............................... 6
Table 3. Midlevel Structure Fire Cause Groupings .......................................................... 19
Table 4. NFIRS Data Elements Used in USFA Analyses (Fires) ....................................... 27
Table 5. NFIRS Data Elements Used in USFA Analyses (Civilian Casualties) ................ 30
Table 6. Data Element Quality and Usability Summary for Common NFIRS Data Elements Type of Fire, 2009 to 2011 ........................................................................... 32
Table 7. Data Element Quality and Usability Summary for Common NFIRS Data Elements Type of Fire With Deaths or Injuries, 2009 to 2011 ................................. 33
Table 8. Data Element Quality and Usability Summary for Common NFIRS Data Elements Type of Casualty With Deaths or Injuries, 2009 to 2011 ......................... 34
Table 9. Data Element Quality and Usability for Common NFIRS Data Elements Used in USFA Analyses Reported Nonbuilding Structure Fires, 2009 to 2011 ..... 36
Table 10. Data Element Quality and Usability for Common NFIRS Data Elements Used in USFA Analyses Reported Buildings and Mobile Property Structure Fires, 2009 to 2011 ........................................................................................................ 38
Table 11. Data Element Quality and Usability for Common NFIRS Data Elements Used in USFA Analyses Reported Vehicle Fires, 2009 to 2011 ................................ 42
Table 12. Data Element Quality and Usability for Common NFIRS Data Elements Used in USFA Analyses Reported Outside Fires, 2009 to 2011 ............................... 44
Table 13. Data Element Quality and Usability for Common NFIRS Data Elements Used in USFA Analyses Reported Fatal Fires, 2009 to 2011 .................................... 46
Table 14. Data Quality for Common NFIRS Data Elements Used in USFA Analyses Distribution of Fatal Fires by Reported Deaths, 2009 to 2011 ................................ 49

iiiList of Figures and Tables
Table 15. Data Element Quality and Usability for Common NFIRS Data Elements Used in USFA Analyses Reported Buildings and Mobile Property Structure Fatal Fires, 2009 to 2011 ............................................................................................... 50
Table 16. Data Quality for Common NFIRS Data Elements Used in USFA Analyses Distribution of Buildings and Mobile Property Structure Fatal Fires by Reported Deaths, 2009 to 2011 ................................................................................... 54
Table 17. Data Element Quality and Usability for Common NFIRS Data Elements Used in USFA Analyses Reported Fires With Injuries, 2009 to 2011 ...................... 54
Table 18. Data Quality for Common NFIRS Data Elements Used in USFA Analyses Distribution of Reported Fires With Injuries by Reported Injuries, 2009 to 2011 .. 58
Table 19. Data Element Quality and Usability for Common NFIRS Data Elements Used in USFA Analyses Reported Buildings and Mobile Property Structures Fires With Injuries, 2009 to 2011 ................................................................................. 58
Table 20. Data Quality for Common NFIRS Data Elements Used in USFA Analyses Distribution of Buildings and Mobile Property Structure Fires With Injuries by Reported Injuries, 2009 to 2011 .................................................................................. 62
Table 21. Data Element Quality and Usability for Common NFIRS Data Elements Used in USFA Analyses Distribution of Fires With Reported Property Dollar Loss, 2009 to 2011 ......................................................................................................... 63
Table 22. Data Quality for Common NFIRS Data Elements Used in USFA Analyses Distribution of Fires With Reported Contents Dollar Loss in Buildings and Mobile Property Structure Fires, 2009 to 2011 ......................................................... 65
Table 23. Data Element Quality and Usability for Common NFIRS Data Elements Used in USFA Analyses Reported Fire Deaths, 2009 to 2011 .................................. 66
Table 24. Data Element Quality and Usability for Common NFIRS Data Elements Used in USFA Analyses Reported Fire Deaths in Buildings and Mobile Property Structures, 2009 to 2011.............................................................................. 69
Table 25. Data Element Quality and Usability for Common NFIRS Data Elements Used in USFA Analyses Reported Fire Injuries, 2009 to 2011 ................................. 72
Table 26. Data Element Quality and Usability for Common NFIRS Data Elements Used in USFA Analyses Reported Fire Injuries in Buildings and Mobile Property Structures, 2009 to 2011.............................................................................. 75

iv Review and Assessment of Data Quality in the National Fire Incident Reporting System

1Introduction
IntroductionFederal agencies conduct or sponsor a wide variety of information collections to gather data from businesses, individuals, schools, hospitals, and state, local and tribal governments. Information collections that employ surveys are frequently used for general-purpose statistics, as well as for program evaluations or research studies that answer more specific research questions. Data collected by federal agencies are widely used to make informed decisions and to provide necessary information for policymakers and planners. The collection of this information can take many forms and is accomplished in a variety of ways.
The Paperwork Reduction Act of 1995 (PRA) requires agencies to submit requests to collect information from the public to the Office of Management and Budget (OMB) for approval. These requests, variously known as Information Collection Requests, PRA submissions, or “OMB clearance packages,” are required for any survey used for general purpose statistics, program evaluations or research studies. The purpose of the PRA is to ensure that the public is not overburdened by the federal data collection. In a given period, the OMB may focus on the design, methodology and practical utility of data to the federal government and other issues. In 2013, the OMB requested that the U.S. Fire Administration (USFA) assess and document the quality of the information from the National Fire Incident Reporting System (NFIRS) and the National Fire Protection Association (NFPA) and make it more accessible and useable for NFIRS users. This document was originally completed and submitted to the OMB in September 2014 to fulfill the aforementioned request.
Although NFIRS is by design a voluntary incident reporting system, and not a survey, the OMB considers the system to fall under the PRA. In the past, the OMB has questioned why the NFIRS is a voluntary census of incidents for all departments rather than a statistical sample. The USFA has investigated the possibility of sampling and the issues surrounding it. While there are certain advantages to a statistical sampling methodology, the USFA has not undertaken a sampling approach to fire incident reporting for several reasons. First and foremost, Public Law 93-498, the Federal Fire Prevention and Control Act of 1974, directed the then newly created USFA to develop a standardized incident data reporting method and to assist local and state agencies in reporting incident data to this system.2 Because the NFIRS is used at the local, state and federal levels, abandoning it for a statistical sampling method would adversely impact state and local fire department incident reporting and the NFIRS standard, which is also used internationally. Additionally, much of the cost burden of the current NFIRS reporting is carried by the state in conducting NFIRS operations. The USFA has relied heavily on states as cooperative partners in bearing the costs and resources of maintaining the system, and the states have relied on the USFA to shoulder the development costs. Switching to a sampling method would mean the USFA would need to acquire additional funding and personnel to design and maintain a new sampling system, leaving the state and local entities to wholly cover the cost of an incident reporting system.
2http://uscode.house.gov/view.xhtml?req=%28%22national+fire+data+center%22%29&f=treesort&fq=true&num=1&hl=true&edition=prelim&granuleId=USC-prelim-title15-section2208

2 Review and Assessment of Data Quality in the National Fire Incident Reporting System
In addition to completing two separate studies showing that there is no evident systematic nonresponse bias to the NFIRS system, under the PRA process, the USFA has also made good progress working with our state and local partners in addressing previous OMB PRA terms of clearance instructions to increase the use of the voluntary NFIRS system:
“The agency is instructed to continue efforts to improve response rates to NFIRS. The agency should also investigate the possibility of using additional studies to determine what characteristics of a fire department might make it less willing to participate in NFIRS and determine whether there is a systematic nonresponse bias to the system that should be disclosed in the published reports based on this system” (2003).
“The agency is instructed to continue efforts to increase the utilization of NFIRS. The agency must provide a report to OMB on the bias in NFIRS due to nonresponse. This report is a condition of future OMB approvals” (2006).
“The agency is instructed to continue efforts to increase the utilization of NFIRS. The agency must provide a report to OMB on the bias in NFIRS due to nonresponse. This report is a condition of future OMB approvals” (2009).
The current terms of clearance require that:
“… FEMA will engage in efforts over the clearance period to assess and document the quality of the information from NFPA and NFIRS and make this more accessible and useable for NFIRS users” (2013).
The following is a response, originally given in September 2014, to the 2013 Terms of Clearance. The response was made public in 2017. It is a review of the NFIRS system, the many robust data quality checks and mechanisms which are an integral part of the system, and an assessment of the data quality both at the state level and at the data element level. The data element assessment is of the most commonly used data elements in the NFIRS data analyses. The NFIRS data from the three most recent years available at the time of this document’s production (2009 to 2011) are reviewed. Although the USFA has no authority over the NFPA survey, a section drawn from published NFPA documents covering the NFPA survey methodology is also included.

3About the National Fire Incident Reporting System
About the National Fire Incident Reporting SystemThe NFIRS was established in 1975 as one of the first programs of the National Fire Prevention and Control Administration, which later became the USFA. The basic concept of the NFIRS has not changed since the system’s inception. All states and all fire departments within them have been invited to participate on a voluntary basis. Participating fire departments report a common core of information on an incident and any casualties that ensue by using a common set of definitions. Detailed incident data are reported locally. Local agencies forward the completed NFIRS modules to the state agency responsible for the NFIRS data. The state agency combines the information with data from other fire departments into a statewide database and then transmits the data to the National Fire Data Center (NFDC) at the USFA. Data on individual incidents and casualties are preserved incident by incident at local, state and national levels.
From an initial six states in 1976, the NFIRS has grown in both participation and use. Over the life of the system, all 50 states, the District of Columbia, and more than 40 major metropolitan areas have reported to the NFIRS. More than 30,000 fire departments have been assigned participating NFIRS fire department identification numbers by their states. Once limited to fire incidents only, the NFIRS now encompasses all incidents to which the fire department responds: fire, Emergency Medical Services (EMS), hazardous materials (hazmat), and others.
Approximately one million fire incident records and 22 million nonfire incident records are added to the database each year. The NFIRS is the world’s largest collection of incidents to which fire departments have responded.
Between 1985 and 1999, the level of participation remained relatively constant: A few states came in or left the system each year, and at least 39 states reported to the NFIRS. Most years also included participation from the District of Columbia. The number of fire departments participating within the states remained relatively constant as well, with a slight dip in participation during the system migration from version 4.1 to 5.0 in 1999. In 2000, the number of states increased to 43. The Department of Defense adopted the NFIRS reporting, and fire department participation began to bounce back from the version 5.0 transition low. Since 2000, state and fire department participation has been steadily increasing. In 2003, the NFIRS reached a milestone with participation by all 50 states. The following year, the NFIRS achieved another significant goal: The NFIRS not only achieved the national goal of 100 percent state participation, including the District of Columbia, but also for the first time, the Native American Tribal Authorities submitted data.
The NFIRS continues to grow and mature. As of 2007, a new level of participation had been achieved: all 50 states, the District of Columbia, Native American Tribal Authorities, Northern Mariana Islands, and Puerto Rico all participated in the NFIRS for a total of 54 state, district, tribal authority, and commonwealth entities. However, the Northern Mariana Islands and Puerto Rico are no longer reporting incident data to NFIRS. Fire departments reporting fire incidents grew to 20,680 in 2011 (Figure 1). Across participating entities, 69 percent of U.S. fire departments reported fire incidents to the NFIRS in 2011.3 The percentage of fire departments participating in the NFIRS varies from state to state,
3For 2011, NFPA estimated that there were 30,145 fire departments in the United States. NFPA, U.S. Fire Department Profile — 2014, http://www.nfpa.org/~/media/files/news-and-research/fire-statistics/fire-service/osfdprofile.pdf?la=en, January 2016.

4 Review and Assessment of Data Quality in the National Fire Incident Reporting System
with some states not participating at all in some years. With over two-thirds of all fire departments nationwide reporting fire incidents to NFIRS 5.0, the reporting departments represent a very large dataset that enables the USFA to make reasonable estimates of various facets of the fire problem. Although some states do require their departments to participate in the state system, participation in the NFIRS is voluntary. Additionally, if a fire department is a recipient of a Fire Act Grant, participation is required.4
Figure 1. NFIRS Fire Department Participation 1980 to 2011, Fire Incidents Only
0
5,000
10,000
15,000
20,000
25,000
2011
2010
2009
2008
2007
2006
2005
2004
2003
2002
2001
2000
1999
1998
1997
1996
1995
1994
1993
1992
1991
1990
1989
1988
1987
1986
1985
1984
1983
1982
1981
1980
Num
ber
of P
artic
ipat
ing
Fire
Dep
artm
ents
Source: NFIRS.Note: 1999 to 2008 includes participation from the NFIRS 4.1 and NFIRS 5.0 versions; 2009 and later includes participation only
from the NFIRS 5.0.
Corresponding to increased participation, the numbers of fires, deaths and injuries, as well as estimates of dollar loss reported to the NFIRS, have also grown; an estimated 71 percent of all U.S. fires to which fire departments responded in 2011 were captured in the NFIRS.
There are, of course, many problems in assembling a real-world database, and the NFIRS is no exception. Although the NFIRS does not represent 100 percent of incidents reported to fire departments each year, the enormous dataset and good efforts by the fire service result in a huge amount of useful information. Because of advances in computer technology and data reporting techniques over the past 35 years, as well as improvements suggested by participants, the NFIRS has been revised periodically. The newest revision, NFIRS 5.0, became operational in January 1999.
The NFIRS 5.0 version captures information on all incidents, not just fires, to which a fire department responds. In addition to many data coding improvements, version 5.0 provides 11 modules that recognize the increasingly diverse activities of fire departments today. These modules, together, contain 567 data elements or fields.
4From the Assistance to Firefighters Grant Guidance and Application Kit ( June 2012), if the applicant is a fire department, the department must agree to provide information, through established reporting channels, to the NFIRS for the period covered by the assistance. If a fire department does not currently participate in the incident reporting system and does not have the capacity to report at the time of the award, the department must agree to provide information to the system for a 12-month period that begins as soon as the department develops the capacity to report. See http://www.fema.gov/library/viewRecord.do?id=6007 (fy_2012_afg_program_guidance.pdf).

5About the National Fire Incident Reporting System
The Basic Module is the main module, which is completed for every incident. The other modules are filled out, when appropriate, to provide additional information on an incident. All 11 modules are listed in Table 1:
Table 1. NFIRS Modules
Module Description
Basic Module General information for each incidentFire Module Fire incident informationStructure Fire Module Information on structure firesCivilian Fire Casualty Module Fire-related injuries or deaths to civiliansFire Service Casualty Module Injuries or deaths to firefightersEMS Module Medical incidentsHazardous Materials Module Hazardous materials incidentsWildland Fire Module Wildland or vegetation firesApparatus/Resources Module Apparatus-specific informationPersonnel Module Personnel associated with apparatusArson Module Intentionally set fire information
Source: NFIRS.
Data from the modules are grouped together each calendar year to create the Public Data Release (PDR) files in delimited text format (.txt) that are then released annually into the public domain. For the NFIRS data submitted prior to 2012, the PDR files were released in dBase format (.dbf). The Apparatus/Resources and Personnel Modules are excluded from the PDR because they are intended for local fire department use only, and the PDR dataset’s main utility is intended for national analyses. The PDR files consist of a subset of the data fields contained within the NFIRS national production database. For example, data elements with sensitive or identifying information are removed, as are data elements that are wholly used for maintenance or production purposes. The PDR data structure has been considerably simplified from the production database’s schema for ease of use. The PDR files from 2004 to the present only include fire and hazmat incidents and their related data tables. Prior to 2004, all incidents were included in the PDR files.
In its basic form, the NFIRS PDR files have a relational data structure where data from each incident module is represented by a row in a data table. The primary tables (basic incident and incident address) contain most of the Basic Module data. There is exactly one record in the basic incident table for every incident reported to the NFIRS. All other modules, represented by data tables with similar names (such as fire incident or civilian casualties), have records that are linked to the basic incident table through unique incident identification key fields (state, fire department ID, incident date, incident number and exposure number). Some module data are split across several tables (e.g., basic incident, incident address, and basic aid tables); one table (fire incident) combines data from two modules (Fire Module and Structure Fire Module). Some tables, such as fire incident, will only have one record for each relevant incident in the basic incident table, while tables such as civilian casualty may have several records linked to a single incident in the case where multiple injuries or deaths occur in the same incident.
6 Review and Assessment of Data Quality in the National Fire Incident Reporting System
NFIRS 5.0, the current version of the NFIRS, is the result of a collaborative effort between the USFA and state and local users. This version incorporates many improvements. The design of NFIRS 5.0 makes the system easier to use than previous NFIRS versions because it captures only the data required to profile the extent of the incident. Some fires, for example, require just basic information to be recorded, whereas others require considerably more detail.
State participation is voluntary, and each state specifies the NFIRS reporting requirements for its fire departments. States have the flexibility to adapt their state reporting systems to their specific needs. As a result, the design of a state’s incident reporting system varies from state to state. The NFIRS 5.0 version was designed so that data from state systems can be converted to a single format that is used at the national level to aggregate and store the NFIRS data.
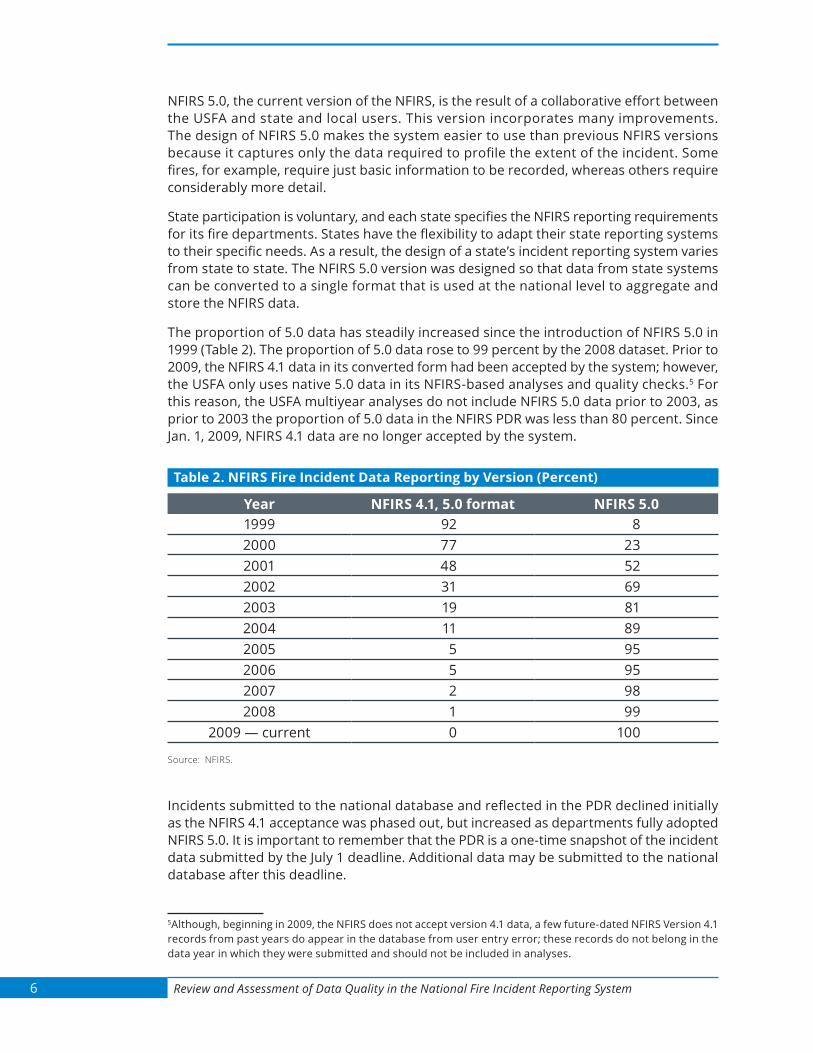
The proportion of 5.0 data has steadily increased since the introduction of NFIRS 5.0 in 1999 (Table 2). The proportion of 5.0 data rose to 99 percent by the 2008 dataset. Prior to 2009, the NFIRS 4.1 data in its converted form had been accepted by the system; however, the USFA only uses native 5.0 data in its NFIRS-based analyses and quality checks.5 For this reason, the USFA multiyear analyses do not include NFIRS 5.0 data prior to 2003, as prior to 2003 the proportion of 5.0 data in the NFIRS PDR was less than 80 percent. Since Jan. 1, 2009, NFIRS 4.1 data are no longer accepted by the system.
Table 2. NFIRS Fire Incident Data Reporting by Version (Percent)
Year NFIRS 4.1, 5.0 format NFIRS 5.01999 92 82000 77 232001 48 522002 31 692003 19 812004 11 892005 5 952006 5 952007 2 982008 1 99
2009 — current 0 100
Source: NFIRS.
Incidents submitted to the national database and reflected in the PDR declined initially as the NFIRS 4.1 acceptance was phased out, but increased as departments fully adopted NFIRS 5.0. It is important to remember that the PDR is a one-time snapshot of the incident data submitted by the July 1 deadline. Additional data may be submitted to the national database after this deadline.
5Although, beginning in 2009, the NFIRS does not accept version 4.1 data, a few future-dated NFIRS Version 4.1 records from past years do appear in the database from user entry error; these records do not belong in the data year in which they were submitted and should not be included in analyses.

7About the National Fire Incident Reporting System
Figure 2. Total Reported Fire Incidents, NFIRS Public Data Release 2003 to 2011Re
port
ed F
ire
Inci
dent
s
0
200,000
400,000
600,000
800,000
1,000,000
1,200,000
1,400,000
201120102009200820072006200520042003
4.1 NFIRS Data
5.0 NFIRS Data
Total ReportedFire Incidents in NFIRS Public Data Release
Source: NFIRS.Note: Includes all incident records in the NFIRS PDR except those incidents with fatal data quality errors.
National Fire Incident Reporting System EnhancementsUnder the USFA Reauthorization Act of 2008, the U.S. Congress authorized and funded the USFA to develop a web-based data entry tool enhancement to the NFIRS. This upgrade to the system began in October 2008. In 2010, a data warehouse for generating output reports for use in analyses was developed with additional funding provided by Congress for the NFIRS enhancements. These improvements make reporting and accessing the NFIRS data much easier for fire departments.
In July 2010, the USFA completed and deployed the new web-based data entry tool. The Data Entry Browser Interface (DEBI) is a one-purpose tool for use by the fire service to document incident information within the NFIRS. While the functionality is the same as the NFIRS client Data Entry Tool that has been available for many years, DEBI allows entry of incidents using a standard web browser, eliminating the need to download, install and configure client software.
The development of a flexible NFIRS data warehouse with comprehensive data mining capabilities was completed in July 2011, but technical problems with the data and environment led to extensive delays. Deployment to national, state and fire department NFIRS users in three phases began in the summer of 2015, starting with users at the national level. Deployment to state and fire department users is forthcoming. The data warehouse allows NFIRS users to access and report on nationally reported data with significantly increased functionality over the current report-generation tool. The data have been transformed into a custom schema that greatly increases the speed of report generation and data access. NFIRS users will be able to generate reports using data from other departments and states, which was not previously possible.

8 Review and Assessment of Data Quality in the National Fire Incident Reporting System
The data warehouse includes a suite of 30 NFIRS data quality reports. The reports include functionality to:
ĵ Track and assign data quality measures for critical data elements in each module and to provide overall data quality ratings by state and department.
ĵ Identify incidents which, though valid, have serious data quality issues and list the problems found with the incidents.
ĵ Identify incidents with outlier dates and times for incident response and duration.
ĵ Identify incidents with dollar loss data quality issues.
ĵ Identify incidents that should have been marked as invalid.
ĵ Track departments and incidents with an abnormally high rate of fires under investigation.
ĵ Identify incidents with mutual-aid field data quality issues.
ĵ Identify near duplicate incidents.
ĵ Identify incidents with missing casualty modules.
National Fire Incident Reporting System TrainingTo promote best practices, the USFA offers several NFIRS training courses for fire departments and state-level departments that manage the NFIRS. The courses are available at the National Fire Academy (NFA), online and within localities (i.e., field deliveries). These training courses include the “National Fire Incident Reporting System: Program Management” (NFIRS: PM) course (six-day NFA course), the “NFIRS 5.0 Self-Study” course (online), the “Introduction to NFIRS 5.0” course (two-day NFA course or field delivery course), and the “NFIRS Data Analysis and Problem Solving Techniques” course (two-day NFA course or field delivery course).
ĵ The “NFIRS: PM” course teaches the participants the full duties of the NFIRS program management and enables participants to promote, support and manage NFIRS incident reporting successfully. This six-day course is offered as a resident course at the NFA and as a field delivery course. The foundation of the training is built on the use of the participants’ own data in the national database. This allows the participants to see the quality of their data and the impact it has on analysis and decision-making. The course teaches the participants the five roles of NFIRS program management: communicating, administrating, planning, training and operating. The participants learn:
Ý The NFIRS rules to ensure that data are coded according to the NFIRS standard. Ý To use tools (e.g., web-based reports, queries, Excel, and PivotTables) to identify
data quality issues (e.g., invalid incidents, incomplete incidents, outdated incidents). Ý How to use the data to recognize problems in their communities. Ý How to effectively present the data to decision-makers and other users of fire data. Ý How to administer different training methods (e.g., train-the-trainer, initial and
refresher) to ensure that accurate, complete and timely data are available. Ý How to develop a local analytical tool from the data in the national database by:
f Exporting data from the national database.

9About the National Fire Incident Reporting System
f Importing the data to a local database. f Building a local interactive tool to display, troubleshoot, query and analyze
the data.
ĵ The “NFIRS 5.0 Self-Study” (online) course provides an overview of the incident reporting system, its modules, and its rules for documenting incidents.
ĵ The “Introduction to NFIRS 5.0” course emphasizes how to properly document incidents using standardized NFIRS data elements and codes for achieving uniformity in incident reporting.
ĵ The “NFIRS Data Analysis and Problem Solving Techniques” course teaches the participants how to better evaluate the reported data, as well as how to use the data to identify problems, evaluate resources and measure services provided. By using their own data in the national database, participants gain a direct correlation to the training and its immediate value to their departments and communities.
This training program is designed specifically to support local fire service organizations and assists them in providing data both to management and decision-makers, to the state uniform fire reporting system, and to the NFIRS nationwide. Additional information on the NFIRS training courses can be found at https://www.usfa.fema.gov/data/nfirs/support/training.html.
To assist fire departments who use NFIRS to improve data quality and reliability, the USFA publishes short, informative notices called NFIRSGrams. By addressing frequently asked questions and common mistakes made when completing incident forms, these bulletins provide coding help to fire department personnel using the NFIRS. NFIRSGrams also help NFIRS users to better understand their impact on the quality of the information from the NFIRS at the local, state and national levels.
The USFA’s NFIRS Support Center also offers a consolidated national help desk to provide technical support to fire departments and NFIRS state program managers regarding all aspects of the NFIRS.
Uses of the National Fire Incident Reporting SystemNFIRS data are used extensively at all levels of government for major fire protection decisions. At the local level, incident and casualty information is used for setting priorities and targeting resources. The reported data are particularly useful for designing fire prevention and educational programs, as well as EMS-related activities specifically suited to the real emergency problems local communities face.
At the state level, the NFIRS is used in many capacities. One valuable contribution is that some state legislatures use these data to justify budgets and to pass important bills on fire-related issues, such as sprinklers, fireworks and arson.
Many federal agencies, in addition to the USFA, make use of NFIRS data. NFIRS data are used, for example, by the Consumer Product Safety Commission (CPSC) to identify problem products and to monitor corrective actions. The Department of Transportation uses NFIRS data to identify fire problems in automobiles, which has resulted in mandated recalls. The Department of Housing and Urban Development uses the NFIRS to evaluate safety of manufactured housing (mobile homes).

10 Review and Assessment of Data Quality in the National Fire Incident Reporting System
The USFA uses the data to design prevention programs, to order firefighter safety priorities, to assist in the development of training courses at the NFA, and for a host of other purposes. Thousands of fire departments, scores of states, and hundreds of industries have used the data. The potential for even greater use remains. The USFA report “Uses of NFIRS: The Many Uses of the National Fire Incident Reporting System” further describes the uses of the data and is available online at http://usfa.kohalibrary.com/app/work/159371.
The National Fire Incident Reporting System and the National Fire Protection Association SurveyThere are two major sources of data about the U.S. fire problem: the USFA’s NFIRS and the NFPA Survey of Fire Departments for U.S. Fire Experience. The NFPA is an international nonprofit organization whose mission is to reduce the burden of fire and other hazards.
While the USFA provides fire departments with the NFIRS as a method to report fire data to understand the details of the U.S. fire problem — how fires start, where they occur, when they occur, what (if any) equipment is involved, and other associated elements of information — the NFPA surveys fire departments each year to determine the nature and characteristics of fire departments across the U.S. and uses the data collected in the survey to estimate the magnitude of the fire problem. The NFPA’s Survey of Fire Departments for U.S. Fire Experience is based on a stratified random sample of U.S. fire departments.6 The sample of departments is stratified by size of community protected, and a ratio estimation methodology is used to develop national-level summary estimates on fire loss statistics (the total numbers of reported fires, fire deaths, fire injuries and direct dollar loss), as well as summary estimates of fires and losses by major incident types (i.e., structure, vehicle, outside and other).
Thus, overall estimates of the fire problem come from the NFPA’s annual Survey of Fire Departments for U.S. Fire Experience. As noted, this survey produces national level summary estimates on fire loss statistics, as well as summary estimates of fires and losses by major incident types (i.e., structure, vehicle, outside and other). The summary estimates by major incident type are further broken down to the next tier — e.g. residential structures, highway vehicles, etc. The raw NFPA survey data are of a proprietary nature and are not available to the public, the USFA, or various other national fire data analysts. More information regarding the NFPA survey is provided in a later section of this report.
All nationally-based estimates on subsets of fire data, however, are derived by using the NFPA estimates to scale up the raw NFIRS subset data, which is a standard statistical technique. These “national estimates” are not the raw totals from the NFIRS. The estimates are based on a method of apportioning the NFPA estimates for total fires, structure, vehicle, outside and other fires.7 Generally, these national estimates are derived by computing a percentage of fires, deaths, injuries or dollar loss in a particular NFIRS category and multiplying it by the corresponding total estimate from the NFPA
6For detailed information regarding the NFPA’s survey methodology, see the NFPA’s annual report on Fire Loss in the U.S.: http://www.nfpa.org//~/media/files/news-and-research/fire-statistics/overall-fire-statistics/osfireloss.pdf.7The foundation of computing national estimates is based on “The National Estimates Approach to U.S. Fire Statistics” by Hall, J. and Harwood, B.: http://www.nfpa.org/~/media/files/news-and-research/fire-statistics/latest-estimates/nationalestimatesapproach.pdf?la=en.

11About the National Fire Incident Reporting System
annual survey.8 In analyses, the unknown and missing data values should not be ignored. The approach taken by the USFA in presenting the data is to provide not only the “raw” percentages of each category, but also the “adjusted” percentages computed using only those incidents for which data were provided.
One problem with this approach is that the proportions of fires and fire losses differ between the large NFIRS dataset and the NFPA survey sample.9 Nonetheless, to be consistent with approaches being used by other fire data analysts, the NFPA estimates of fires, deaths, injuries and dollar loss are used as a starting point. The details of the fire problem below the national level are based on proportions from the NFIRS. Because the proportions of fires and fire losses differ between the NFIRS and the NFPA estimates, from time to time, this approach leads to inconsistencies. These inconsistencies will remain until all estimates can be derived from NFIRS data alone.
Ideally, one would like to have all of the data for the various components come from one consistent data source — the NFIRS. One of the critical pieces of data necessary to do so is missing: the overall population protected by all reporting fire departments. This “residential population protected” is not reported to the NFIRS, nor are the data easy to come by, especially where a county or other jurisdiction is served by several fire departments that each report their fires independently.
Other issues — such as full reporting because of reporting deadlines, data access, budgetary considerations, and the like — add a layer of complexity to using the NFIRS data to create estimates. Through the years, a number of ad hoc studies have been undertaken to identify NFIRS nonresponse bias, but none have identified major reporting issues. Most of the NFIRS data exhibit stability from one year to the next. Results based on the full dataset are generally similar to those based on part of the data, another indication of data reliability. The dataset is so large — on average, over the past five years, about 67 percent of reported fires10 — and reasonably distributed geographically and by size of community that it is used as input to developing national estimates.11
8The NFPA summary estimates are used for the overall U.S. fire losses; fire losses from structure, vehicle, outside and other fires; and as the basis for USFA’s estimates of residential and nonresidential building fires and losses. The alternative approach for these summary numbers is to use the relative percentage of fires (or other loss measures) from the NFIRS and scale up to (multiply by) the NFPA estimate of total fires.9For additional information regarding the differences in proportions of fires and losses between NFIRS data and the NFPA survey, see the section entitled Differences Between NFIRS Data and NFPA Survey Data in “USFA’s Data Sources and Methodology Documentation,” March 2014, http://www.usfa.fema.gov/downloads/pdf/statistics/data_sources_methodology.pdf.10The data reported in the NFIRS is continually growing: Between 2007 and 2011, NFIRS data represented 67, 61, 57 and 59 percent of reported fires, fire deaths, fire injuries and direct dollar loss when compared to the statistical estimates from the NFPA’s Annual Survey of Fire Departments. Between 2009 and 2011 these percentages rose to 70, 64, 58 and 62 respectively.11USFA’s NFIRS Representativeness Study (October 2008) previously submitted to the OMB.
12 Review and Assessment of Data Quality in the National Fire Incident Reporting System
Incident Reporting and Submission ProcessOver 20,000 fire departments12 and state governments actively work on improving the information they enter into the NFIRS. Their data, based on their own needs for high quality fire and other incident data, is used to plan, fund and implement effective local, state and regional fire and emergency services programs.
At the same time, the NFDC engages in efforts to both document and communicate to users the content and quality of fire information products resulting from NFIRS data. The NFDC accomplishes these efforts through an ongoing and robust data quality assessment process, detailed analysis of the NFIRS data and production of reports, training and informational bulletins, data analysis tools, and a congressionally funded NFIRS enhancement project.
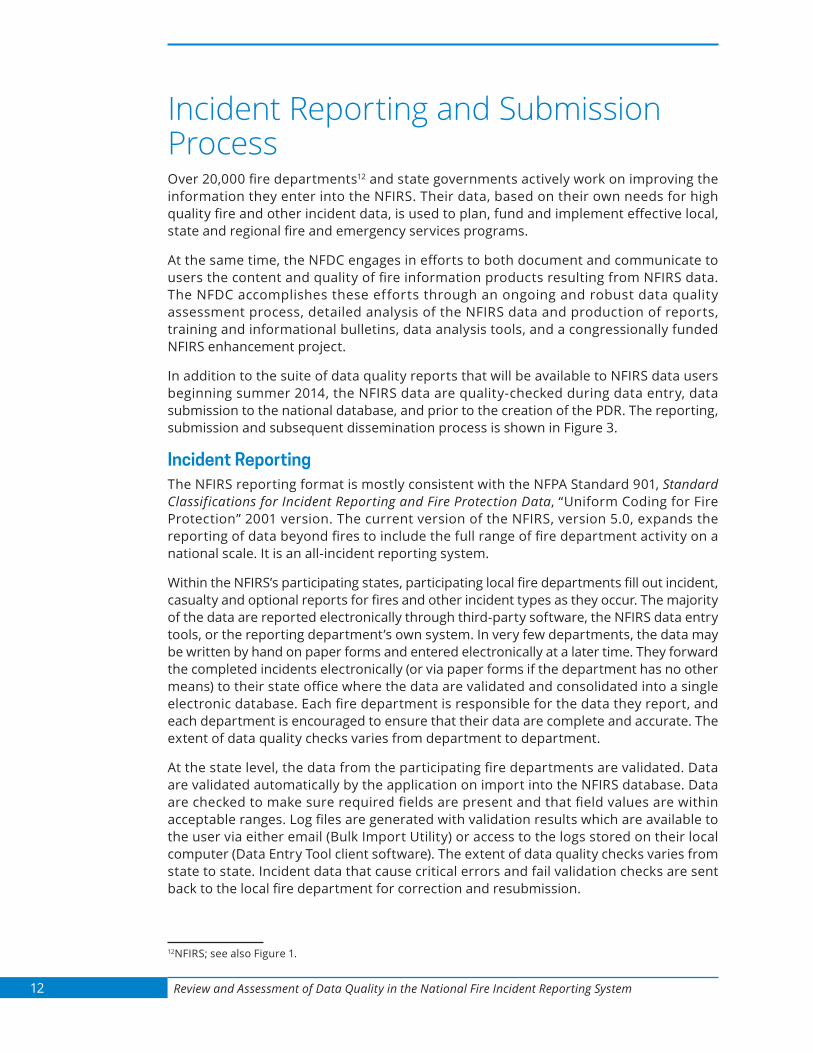
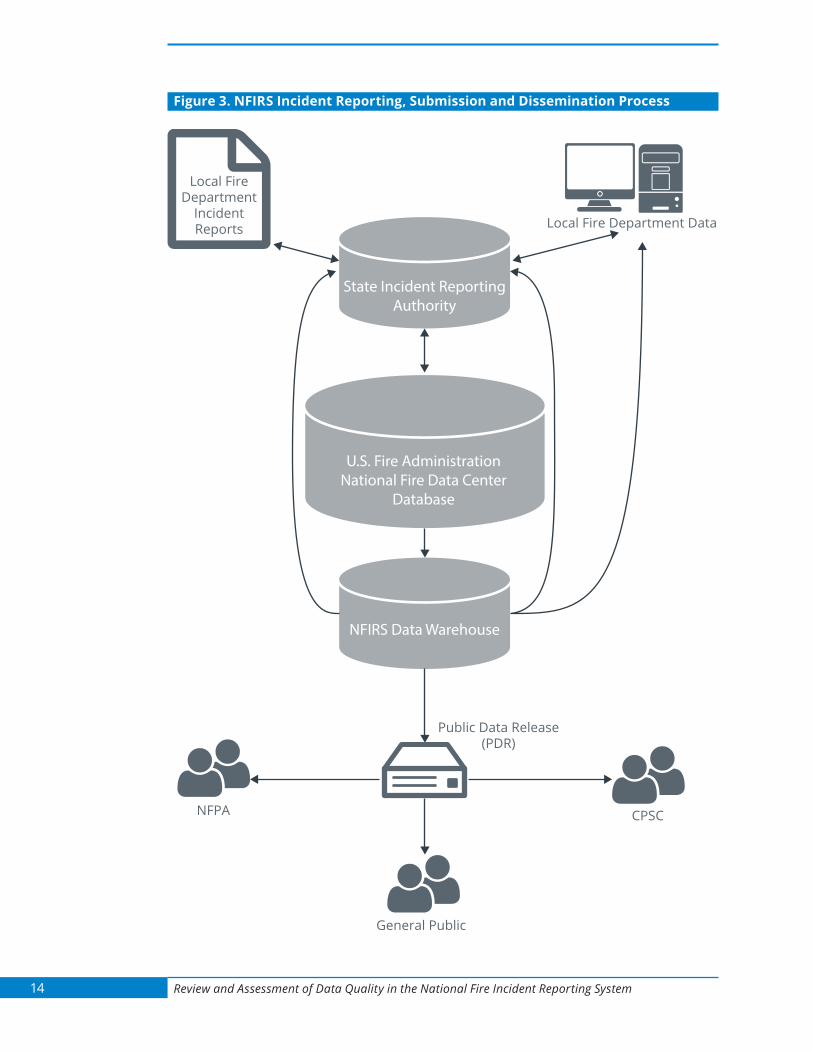
In addition to the suite of data quality reports that will be available to NFIRS data users beginning summer 2014, the NFIRS data are quality-checked during data entry, data submission to the national database, and prior to the creation of the PDR. The reporting, submission and subsequent dissemination process is shown in Figure 3.
Incident ReportingThe NFIRS reporting format is mostly consistent with the NFPA Standard 901, Standard Classifications for Incident Reporting and Fire Protection Data, “Uniform Coding for Fire Protection” 2001 version. The current version of the NFIRS, version 5.0, expands the reporting of data beyond fires to include the full range of fire department activity on a national scale. It is an all-incident reporting system.
Within the NFIRS’s participating states, participating local fire departments fill out incident, casualty and optional reports for fires and other incident types as they occur. The majority of the data are reported electronically through third-party software, the NFIRS data entry tools, or the reporting department’s own system. In very few departments, the data may be written by hand on paper forms and entered electronically at a later time. They forward the completed incidents electronically (or via paper forms if the department has no other means) to their state office where the data are validated and consolidated into a single electronic database. Each fire department is responsible for the data they report, and each department is encouraged to ensure that their data are complete and accurate. The extent of data quality checks varies from department to department.
At the state level, the data from the participating fire departments are validated. Data are validated automatically by the application on import into the NFIRS database. Data are checked to make sure required fields are present and that field values are within acceptable ranges. Log files are generated with validation results which are available to the user via either email (Bulk Import Utility) or access to the logs stored on their local computer (Data Entry Tool client software). The extent of data quality checks varies from state to state. Incident data that cause critical errors and fail validation checks are sent back to the local fire department for correction and resubmission.
12NFIRS; see also Figure 1.

13Incident Reporting and Submission Process
Submission to the National Production DatabasePeriodically, the aggregated statewide data are sent to the NFDC to be released and included in the national production database. When and how states send their data depends on the individual state — some states (and their departments) use the USFA’s data entry tool to enter, store and manage their data on the USFA’s federal server warehouse. Other states, typically the larger states, keep their data locally and report their incident data en masse, quarterly or yearly, just prior to the annual federal reporting deadline. Submission guidelines13 call for quarterly reporting at a minimum during the year and an annual deadline for states on July 1. Regardless of the submission or entry method, all state data submitted to the federal servers are stored in individual state partitions. From the state partitions, the states manage their final datasets prior to releasing their data to the national production database. All state data belongs to the individual states, with the state having the sole responsibility for its content. The NFDC is the custodian of the data and does not have the authority to make changes to the state data in the state partitions.
Public Data Release and Data ReviewAfter the data submission deadline, a “snapshot” of the national production database is taken. It is from this snapshot that the PDR is created. During the PDR process, the released incident data are checked for fire death and reported dollar loss consistency. Because deaths and total dollar loss are important metrics of the U.S. fire problem, incidents with more than 20 million in dollar loss or more than five deaths are sent back to the state for verification.14 Once the PDR is finalized, it is packaged on a CD with documentation and made available to the public, other government agencies, and outside organizations by request.
Internally, once the annual PDR is completed, the USFA assigns data quality ratings based on a calculated formula to each individual department, each state, and nationally overall. The data quality rating is calculated using quality measures of the fields used in the creation of annual fire causes and is intended to help track the quality of the data used by the USFA to assign these causes each year.
13NFIRS Reporting Guidelines: https://www.nfirs.fema.gov/system/guidelines.shtm.14Injuries are also an important metric; however, injuries totals are not checked, as it is possible to have a large number of injuries at an incident, making checking this field at a national level difficult.
14 Review and Assessment of Data Quality in the National Fire Incident Reporting System
Figure 3. NFIRS Incident Reporting, Submission and Dissemination Process
U.S. Fire AdministrationNational Fire Data Center
Database
NFIRS Data Warehouse
State Incident ReportingAuthority
Local FireDepartment
IncidentReports Local Fire Department Data
NFPA CPSC
General Public
Public Data Release(PDR)

15Incident Reporting and Submission Process
Data Quality and U.S. Fire Administration Interaction With StatesThree criteria are used in the monitoring of data in the NFIRS during the year: the data are complete, the data are accurate, and the data are current. These criteria are monitored by creating reports from the database that show the number of reporting fire departments, the number of incidents by state, the number of invalid incidents, and the number of unreleased incidents. The USFA provides the reports to the state NFIRS program managers and works with them to resolve any data issues. Technical assistance (e.g., telephone support or site visits) is provided to states to help address any data quality and data reporting needs.
Data quality is an area of great importance. Audits of the data are performed during the year to identify any inconsistences in the data. The audits focus on three criteria: gaps in reporting, critical errors in the data, and outliers in the data. In particular, the USFA works closely with states to monitor the quality of data coming from third-party vendor software. Each state is responsible for enforcing that the NFIRS third-party software sold by vendors in their state is compliant with NFIRS standards. The USFA will assist states in monitoring vendor data quality issues or will contact vendors directly to discuss an issue at a state’s request. Other data quality issues are questionable high dollar-loss incidents and questionable high numbers of fire deaths. Annually, the USFA queries the database for questionable values (i.e., outliers) and verifies the values with state-level NFIRS program managers and local-level NFIRS program managers. The data quality steps are important to ensure that the data meet the USFA’s three criteria before the data are released in the NFIRS PDR format.
Data Quality Checks by the National Fire Data CenterThe PDR is further quality checked by the NFDC staff and statisticians upon receipt and prior to release to the general public. The NFDC staff and statisticians double-check for items such as:
ĵ Missing required modules. ĵ Null values in required data elements. ĵ Invalid values or codes that are not in the current NFIRS Complete Reference Guide (CRG). ĵ Large outliers. ĵ Duplicates in multientry data elements.
Any issues are reported to the NFIRS program manager, who in turn reports them to the NFIRS support contractor. The support contractor investigates and incorporates any needed changes and updates into the NFIRS validation rules or the PDR generation procedures. If the record clearly contains outliers, it is generally the USFA’s practice to recommend excluding it from analyses. Before excluding such records as a data quality check, a quick internet search is conducted to see if some unusual fire did occur. As described above, the USFA follows up with the fire department that submitted the incident record for data verification.
Although invalid values and duplicates in multientry fields are reviewed, these values are not necessarily changed on the PDR as each major data user (e.g., the NFDC itself, CPSC, the NFPA and others) has its own method of analyzing the fire data in the PDR.

16 Review and Assessment of Data Quality in the National Fire Incident Reporting System
Additionally, the NFDC staff and statisticians, in their analytical database based on the PDR data, check the following:
ĵ That all incidents are version 5.0.
ĵ For null or missing values in property use when: Ý Mutual or automatic aid is received. Ý Other aid is given. Ý No aid is given or received.
If null values occur, the incidents are deleted from the analytic database.
ĵ For fires, check for null values in the AID field. If null/missing values occur, the incidents are also deleted from the analytic database.
The USFA’s analytic contractor performs additional data quality checks as it loads the PDR data into its NFIRS database. The analytic contractor checks for:
ĵ Potential duplicate entries: Entries whose unique, identifying information is identical — save for a leading or trailing blank or zero.
ĵ Orphan records: Records in the secondary files that do not have a parent record in the main data file.
Any potential duplicate entries and orphan records are reported back to the NFDC and to the NFIRS program manager. The NFDC recommends that if records under either of these instances occur, they should be deleted from the NFDC analytic database. Major data users are notified of the NFDC decisions and may or may not implement them in their own datasets.
17Key Data Considerations for the User
Key Data Considerations for the UserUnknown EntriesIn a small number of incident or casualty reports sent to the NFIRS, many data items are either not reported (i.e., null, blank or missing values) or are reported as “unknown.” For most coded fields, “U,” “UU” and “UUU” are codes available in NFIRS 5.0 to indicate “unknown.” In some cases, even after the best attempts by fire investigators to document the fire, the information is truly unknown. In other cases, the information reported as unknown in the initial NFIRS report is not updated after the fire investigation is completed.
In analyses, the unknowns should not be ignored. The approach taken by the USFA in presenting the data is to provide not only the “raw” percentages of each category, but also the “adjusted” percentages computed using only those incidents for which data were provided.
Null and blank values differ from entries coded as unknown. Null and blank values are considered unreported data and differ in meaning and substance from “unknown” data. In data elements where information is required, a null or blank value may invalidate the record.
Unknown entries are of the highest concern for data quality. For some data elements, the number of incidents with null, blank or unknown entries can be larger than the number of incidents for which data were provided. Through the various USFA and NFDC training initiatives and efforts by various fire organizations (e.g., the National Association of State Fire Marshals (NASFM)), fire departments are encouraged to reduce the number of unknown entries by fully documenting the fire incident.
Fires Versus National Fire Incident Reporting System Record CountsIt is important to underscore that the raw NFIRS record counts are not the total number of fires reported by fire departments each year. The NFIRS is a large but not randomly selected sample of fires reported to fire departments, and as such, analyses address the relative proportions (percentages) or apply the national estimates methodology to produce estimates of the aspect of the fire problem that is under analysis.
Counting Fires Versus Counting Fire-Related StatisticsWhen the data element in question is a fire-related data element (i.e., captured under the fire modules — fire, structure fire, wildland, etc.), fires are counted. When the data element in question is in the casualty modules, casualties are counted. Even the most seasoned fire data analyst may overlook this distinction from time to time. The proper phrasing of analysis for casualties counted from fire data elements is “fires with casualties/injuries/deaths” or an equivalent statement.
Confined Versus Nonconfined FiresConfined fires are generally small, low-loss fires and are allowed abbreviated reporting. This limited reporting can result in an increase in the proportion of null or missing values. The USFA generally separates the analyses into a confined fires version and a nonconfined fires version and recommends that others do the same. The resulting analysis can be very generic, but there are instances where this is reasonable. While the NFPA survey includes a category for confined fires, the NFPA does not publish estimates of confined fires. It is unclear what the effect of this has on estimates derived from NFIRS datasets that include confined fires.

18 Review and Assessment of Data Quality in the National Fire Incident Reporting System
Mutual AidSome records in the NFIRS refer to aid provided to another fire department — either mutual aid given to an outside fire service entity upon request of the outside entity, or automatic aid given through mutual-aid agreements. To isolate individual fire incidents, only records of the primary fire department are included. This is achieved by excluding records reflecting aid provided, as in essence, not excluding aid incidents when analyzing incidents may result in the double counting of those incidents where both the giving and receiving departments report to the NFIRS.
This exclusion is also a data quality consideration. The fire department receiving aid is considered the “owner” of the incident, and this fire department is responsible for providing the incident data. The aid-giving department’s incident record is generally only a record of having given aid and most, if not all, data elements are not required or submitted. Including these records would result in an unacceptably large number of unknown entries.
Mutual-aid given incidents are excluded from all analyses with one major exception: when counting firefighter casualties.
Types of FiresThe general categories of fire incidents are broadly defined by the type of incident, with the four major incident types of structure, vehicle/mobile properties, outside, and other. Structure fires are further broken down into residential and nonresidential structure fires based on the property definitions (see below), as well as by type of structure — building and nonbuilding fires. Type of incident, property use, and type of structure (for structure fires) are required elements with near 100 percent compliance.
Property DefinitionsThe general categories of property use are defined by the property use data element. Property use is a required field; blank and null values are not expected (but do occur occasionally under specific rare circumstances15). Null values in property use receive special treatment as the requirements for certain types of incidents changed in 2006. These specifications are discussed more fully in the USFA’s “National Fire Incident Reporting System Version 5.0 Fire Data Analysis Guidelines and Issues.” These guidelines discuss specific data elements and how the USFA analyzes and interprets the results of the analyses.
Multiyear and Trend AnalysesIt is important to note that NFIRS data may fluctuate from year to year, resulting in variability. It is possible that any given year may be an anomalous year for a subset of fire data or for the data overall. Statistically rare, but real-world incidents do occur. Large conflagrations, such as the various California wildfires; large petrochemical plant fires, such as the 1989 Houston Ship Channel fire; and large multifatality, multi-injury fires, such as the 1980 MGM Grand Hotel fire or the 2003 fire at The Station Nightclub, can have one-time effects on fire analyses for that year.
For these reasons — yearly fluctuation and single-event spikes — it is often preferable to aggregate several years of data for analyses. The USFA uses three-year averaged data and, where possible, analyzes trends of five or more years of data. Trends are usually described by the change in the linear best fit. Moving averages are another type of trend analyses available.
15The entry rules that allow blank and null property types to occur were eliminated as of January 2015.

19Key Data Considerations for the User
CauseThe cause of a fire is often a complex chain of events. To make it easier to grasp the “big picture,” the USFA originally developed a cause hierarchy for structure fires, where the majority of fire losses occur.16 The cause for other incident types is based on the distributions of the NFIRS cause of ignition data element. This data element captures a very broad sense of the cause of the fire.
The hierarchy schema provides three levels of cause descriptions: a set of more detailed causes, a set of midlevel causes, and a set of high-level causes. The midlevel categories of fire causes, such as heating, cooking and playing with heat source, are used by the USFA. Fires are assigned to one of the 16 midlevel cause groupings using a hierarchy of definitions, as shown in Table 3. A fire is included in the highest category into which it fits on the list. If it does not fit the top category, then the second one is considered, and if not that one, the third and so on.
In principle, it is the cause of the fire which results in deaths, injuries and dollar loss that should be analyzed, not numbers of deaths and injuries associated with fire causes.
Table 3. Midlevel Structure Fire Cause Groupings
Cause Category DefinitionExposure Caused by heat spreading from another hostile fire.Intentional Cause of ignition is intentional, or fire is deliberately
set.Cause under investigation Cause is under investigation, and a valid NFIRS
Arson Module is present.Playing with heat source Includes all fires caused by individuals playing with
any materials contained in the categories below, as well as fires where the factors contributing to ignition include playing with a heat source. Children playing with fire are included in this category.
Natural Caused by the sun’s heat, spontaneous ignition, chemicals, lightning, static discharge, high winds, storms, high water including floods, earthquakes, volcanic action, and animals.
Other heat Includes fireworks; explosives; flame/torch used for lighting; heat or spark from friction; molten material; hot material; heat from hot, or smoldering objects.
Smoking Cigarettes, cigars, pipes and heat from undetermined smoking materials.
16The structure fire cause hierarchy and specific definitions in terms of the NFIRS 5.0 codes may be found in the “National Fire Incident Reporting System Version 5.0 Fire Data Analysis Guidelines and Issues,” USFA, July 2011, http://www.usfa.fema.gov/downloads/pdf/nfirs/nfirs_data_analysis_guidelines_issues.pdf. The hierarchy involves a large number of subcategories that are later grouped into the 16 mid-level cause categories, then the eight high-level cause groupings.

20 Review and Assessment of Data Quality in the National Fire Incident Reporting System
Table 3. Midlevel Structure Fire Cause Groupings — continued
Cause Category DefinitionHeating Includes confined chimney or flue fire, fire confined
to fuel burner/boiler malfunction, central heating, fixed and portable local heating units, fireplaces and chimneys, furnaces, boilers, water heaters as sources of heat.
Cooking Includes confined cooking fires, stoves, ovens, fixed and portable warming units, deep fat fryers, open grills as sources of heat.
Appliances Includes televisions, radios, video equipment, phonographs, dryers, washing machines, dishwashers, garbage disposals, vacuum cleaners, hand tools, electric blankets, irons, hairdryers, electric razors, can openers, dehumidifiers, heat pumps, water cooling devices, air conditioners, freezers, and refrigeration equipment as sources of heat.
Electrical malfunction Includes electrical distribution, wiring, transformers, meter boxes, power switching gear, outlets, cords, plugs, surge protectors, electric fences, lighting fixtures, electrical arcing as sources of heat.
Other equipment Includes special equipment (radar, x-ray, computer, telephone, transmitters, vending machine, office machine, pumps, printing press, gardening tools, agricultural equipment), processing equipment (furnace, kiln, other industrial machines), service, maintenance equipment (incinerator, elevator), separate motor or generator, vehicle in a structure, unspecified equipment.
Open flame, spark (heat from) Includes torches, candles, matches, lighters, open fire, ember, ash, rekindled fire, backfire from internal combustion engine as sources of heat.
Other unintentional, careless Includes misuse of material or product, abandoned or discarded materials or products, heat source too close to combustibles, other unintentional (mechanical failure/malfunction, backfire).
Equipment misoperation, failure Includes equipment operation deficiency, equipment malfunction.
Unknown Cause of fire undetermined or not reported.Source: USFA.
The percentage of unknown fire causes has seen a steady increase since the introduction of the NFIRS Version 5.0. This increase may be due, in part, to the fact that the original cause hierarchy does not apply as well to NFIRS 5.0 data.17 While the cause hierarchy
17See the full description of the cause hierarchy in “Fire in the United States 1995-2004, 14th edition.”

21Key Data Considerations for the User
was revised to incorporate the 5.0 data as best possible, the result is that, where the fit is imperfect, many incidents are assigned to the unknown cause category.
Further, with the current NFPA 921, Guide for Fire and Explosion Investigations, there may be reluctance on the part of some fire departments to enter anything but “unknown” in causal fields, unless these elements can be determined with certainty.18
NFPA 921 sets guidelines for scientific-based investigation and analysis of fire and explosion incidents and is considered the foremost guide for rendering accurate opinions as to incident origin, cause, responsibility and prevention. The issues surrounding NFPA 921’s role in fire departments’ willingness to determine fire cause are complex, but if the investigation does not or cannot meet these guidelines, often the preliminary cause of “under investigation” remains in the NFIRS, and under the cause hierarchy, those fires are assigned to the unknown cause category.
The NASFM recently studied the problem of the large numbers of unknown data in the causal data elements.19 This report identified five recommendations that have resonance for data quality in general to solve the issue of unreported fire causal information:
ĵ Whether a cause is determined or remains undetermined after investigation, fire departments must “Close the Loop” by updating the codes in the NFIRS incident report. Codes need to be updated in the system once a cause is determined. “Under Investigation” reports should always be revisited and updated after the investigation.
ĵ Clear the “Litigation Cloud” by addressing the liability concerns for cause determination through a multipronged approach. Several approaches to this area are suggested.
ĵ Improve training for chiefs, officers and front-line personnel on the concepts and reasons behind the need for reporting, as well as how fire incident data can be used to advance fire prevention and suppression goals.
ĵ Improve the NFIRS by developing and implementing the next generation of the NFIRS — what is commonly referred to as NFIRS Version 6 — with input from stakeholders who are tasked with inputting the data at the local level, as well as those who analyze and use the data at all levels.
ĵ Improve quality assurance and quality control in fire incident reporting throughout the system. Specific systemic changes to improve quality assurance and quality control include designating a “Data Champion” to be responsible for NFIRS quality control/ quality assurance at the local level; providing a mechanism for departments to report “no incidents” periodically; emphasizing the importance of dedicated state NFIRS program managers to work with departments in their state; adopting a standard
18National Association of State Fire Marshals Fire Research & Education Foundation, “Conquering the “Unknowns” Research and Recommendations on the Chronic Problem of Undetermined and Missing Data in the Causal Factors Sections of the National Fire Incident Reporting System,” final report for Award No. EMW-2011-FP-00356 Assistance to Firefighters Fire Prevention & Safety Grant Program Federal Emergency Management Agency. Undated. http://www.firemarshals.org/resources/Documents/Fire%20Incident%20Data%20Collectin/NASFMFoundationFinalReportConqueringtheUnknowns.pdf.19National Association of State Fire Marshals Fire Research & Education Foundation, “Conquering the “Unknowns” Research and Recommendations on the Chronic Problem of Undetermined and Missing Data in the Causal Factors Sections of the National Fire Incident Reporting System,” final report for Award No. EMW-2011-FP-00356 Assistance to Firefighters Fire Prevention & Safety Grant Program Federal Emergency Management Agency. Undated. http://www.firemarshals.org/resources/Documents/Fire%20Incident%20Data%20Collectin/NASFMFoundationFinalReportConqueringtheUnknowns.pdf.

22 Review and Assessment of Data Quality in the National Fire Incident Reporting System
operating procedure or standard operating guideline on completing incident reports; and revitalizing the National Fire Information Council with a focus on developing strategies and training to improve the quality of the nation’s NFIRS data.
The NASFM report notes that there will always be fires whose cause cannot legitimately be determined, even after investigation. For many incidents, however, definite steps can be taken toward reducing the level of “undetermined” or unreported responses in the causal factors section of the NFIRS. “To achieve this will require confronting some difficult, thorny issues that do not have clear solutions. But, if you don’t write it down, it didn’t happen, and we may never be able to quantify what has been lost by not having sufficient data on the causes of fires.”20
Smoke Alarms and Smoke Alarm PerformanceSmoke alarm data are reported at the fire-incident level (not the casualty level). Smoke alarm data are analyzed for presence, operation, and effectiveness; other smoke alarm data elements are not analyzed at this time. Smoke alarm performance is analyzed for nonconfined fires only. Confined fires have abbreviated reporting, and the various smoke alarm data are not required. From a data quality perspective, including confined fire smoke alarm data (which is mostly null) with the more robust nonconfined fire smoke alarm data degrades the data quality.
Dollar Loss DataIt is difficult to estimate dollar loss. Insurance claim data are generally not available to the public, and fire departments rarely have the time to research the actual value of a property. It is not unusual for the property or content loss to be unreported. Even when reported, there are often inconsistencies. For example, there are many reported fires where the fire spread suggests damage, but property loss is not reported or seems low (or high) for the extent of reported fire spread.
Structures, Buildings and NonbuildingsThe NFIRS 5.0 allows for the differentiation of structures between buildings and nonbuildings. In the NFIRS, a structure is a built object and can include nonbuildings, such as platforms and tents; connective structures, such as bridges or fences; telephone poles; and various other structures in addition to buildings.
Structures are split into building and nonbuilding structures for purposes of data quality. While most structures are buildings (analyses of NFIRS structure fires between 2009 and 2011 show that 93 percent of structure fires occur in buildings), the distinction between buildings and nonbuildings is particularly important when determining the effectiveness of nonbehavior-based fire safety mechanisms, such as smoke alarms and residential sprinklers. These important components of early fire detection apply to buildings and not necessarily to these other types of structures.
20National Association of State Fire Marshals Fire Research & Education Foundation, “Conquering the “Unknowns” Research and Recommendations on the Chronic Problem of Undetermined and Missing Data in the Causal Factors Sections of the National Fire Incident Reporting System,” final report for Award No. EMW-2011-FP-00356 Assistance to Firefighters Fire Prevention & Safety Grant Program Federal Emergency Management Agency. Undated. http://www.firemarshals.org/resources/Documents/Fire%20Incident%20Data%20Collectin/NASFMFoundationFinalReportConqueringtheUnknowns.pdf.

23The National Fire Incident Reporting System Data Quality
The National Fire Incident Reporting System Data QualityTwo major assessments are used by the USFA when monitoring the quality of the incident data reported by the participating states: the overall quality of the data submitted by the state as a unit and the overall quality of key data elements across all participating states and fire departments.
State-Based Data QualityBased on the USFA’s state data quality rating, 12 states — Nebraska, Massachusetts, Alaska, North Dakota, Montana, Idaho, South Dakota, Utah, Colorado, California, Florida and Washington — as well as the District of Columbia, have demonstrated consistent, high-quality data (Figure 4). Nebraska and the District of Columbia have vied for the top-ranked state for data quality over the 2009 to 2011 period.
As a group, the states with the best data quality ratings relative to the national average are those in the central Midwest, throughout the Northwest, and California, with the mid-Atlantic and southeastern states (with the exception of Florida) having the lowest ratings (Figure 5). The reasons for this consistent pattern are not clear.

24 Review and Assessment of Data Quality in the National Fire Incident Reporting System
Figure 4. Three-Year NFIRS Data Quality by State Relative to National Average Data Quality Measure, 2009 to 2011
-9.0 -6.0 -3.0 0.0 3.0 6.0 9.0
District of ColumbiaNebraska
North DakotaMassachusetts
AlaskaMontana
IdahoSouth Dakota
UtahColoradoCalifornia
FloridaWashington
KansasMichigan
MaineWyomingVermont
IllinoisVirginia
IowaOregon
MinnesotaWisconsin
TennesseeNew York
New MexicoOklahoma
Native American Tribal AuthorityNorth Carolina
West VirginiaNew Hampshire
NevadaArkansas
OhioGeorgia
South CarolinaMissouri
TexasMississippi
PennsylvaniaRhode Island
IndianaKentuckyAlabama
ConnecticutArizonaHawaii
LouisianaMaryland
New JerseyDelaware
Relative Data Quality

25The National Fire Incident Reporting System Data Quality
Figure 5. Annual NFIRS Data Quality by State Relative to National Average Data Quality Measure, 2009 to 2011
2009 Good Average Poor
2010 Good Average Poor

26 Review and Assessment of Data Quality in the National Fire Incident Reporting System
Figure 5. Annual NFIRS Data Quality by State Relative to National Average Data Quality Measure, 2009 to 2011 — continued
2011 Good Average Poor
Data Quality of Key Data ElementsAlthough the NFIRS contains hundreds of data elements, only a few are used in producing the USFA’s topical and analytic reports. Most of the elements used in the USFA’s analyses are required to be completed for each fire incident type. For small confined fires, outside rubbish fires with no value, and other unclassified fires, however, only the most basic incident information is required.
A complete list of NFIRS data elements is documented in the “NFIRS 5.0 Complete Reference Guide.”21 Table 4 identifies the NFIRS data elements that are used most often in fire data analyses produced by the USFA. Not all types of fires require the same data elements. Table 4 displays the data elements and the data element’s required completion by type of fire. Table 5 identifies the NFIRS data elements that are used most often in the analyses of casualties produced by the USFA. Because of the limited reporting required of confined fires and other unclassified fires, these fires are not included here or in the data quality tables that follow.
Incident type, incident date and alarm time are integral elements of the incident and are not subject to quality review: either these elements exist and are within valid ranges or the incident record is not accepted into the national fire database. Similarly, deaths, injuries, contents and property loss can only be “sanity checked” as there are not specific and definable correct entries, only “reasonable” ones. These elements are shown in the detailed tables as distributions. Content loss is only shown for buildings and mobile property structure fires.
21“NFIRS 5.0 Complete Reference Guide,” USFA, January 2013: http://www.nfirs.fema.gov/documentation/reference/.

27The National Fire Incident Reporting System Data Quality
Four types of fires are defined for the purposes of data quality analysis. These fire types are largely based on the NFIRS modules that departments are required to complete.
ĵ Nonbuilding structure fires (also called “special structure” fires) — Fires in or of structures that are not buildings or used as buildings, e.g. bridges or fences. For nonbuilding structure fires, the Fire Module and the first element in the Structure Fire Module are required.
ĵ Buildings and mobile property structures — Fires in structures that are buildings or are in mobile properties that are used as structures, e.g. manufactured or mobile homes. For buildings and mobile property structure fires, both the Fire and Structure Fire Modules are required.
ĵ Vehicle fires — Fires in vehicles or other mobile property, e.g., trucks, planes, trains. For vehicle fires, the Fire Module is required.
ĵ Outside fires — Fires that occur outdoors that may be open, e.g., grass fires, crop fires, other vegetation fires, and the like. For outside fires, the Fire Module or the Wildland Fire Module is required.
Table 4. NFIRS Data Elements Used in USFA Analyses (Fires)
Data Element
Description
Required Data ElementA
ll Fi
resa
Non
build
ing
Stru
ctur
esBu
ildin
gs
and
Mob
ile
Prop
erty
St
ruct
ures
b
Vehi
cles
Out
side
c
Incident Type The actual situation found on scene when emergency personnel arrived. Yes Yes Yes Yes Yes
Property Use
The actual use of the property where the incident occurred, not the overall use of mixed-use properties of which the property is part.
Yes Yes Yes Yes Yes
Incident Date The month, day and year of incident. Yes Yes Yes Yes Yes
Alarm Time
The actual month, day, year and time of day (hour, minute and seconds) when the alarm was received by the fire department.
Yes Yes Yes Yes Yes
Deaths
A civilian fire death resulting from the incident, or during the mitigation of the incident (includes emergency personnel who are not part of the fire department, such as police officers or utility workers).
Yes Yes Yes Yes Yes
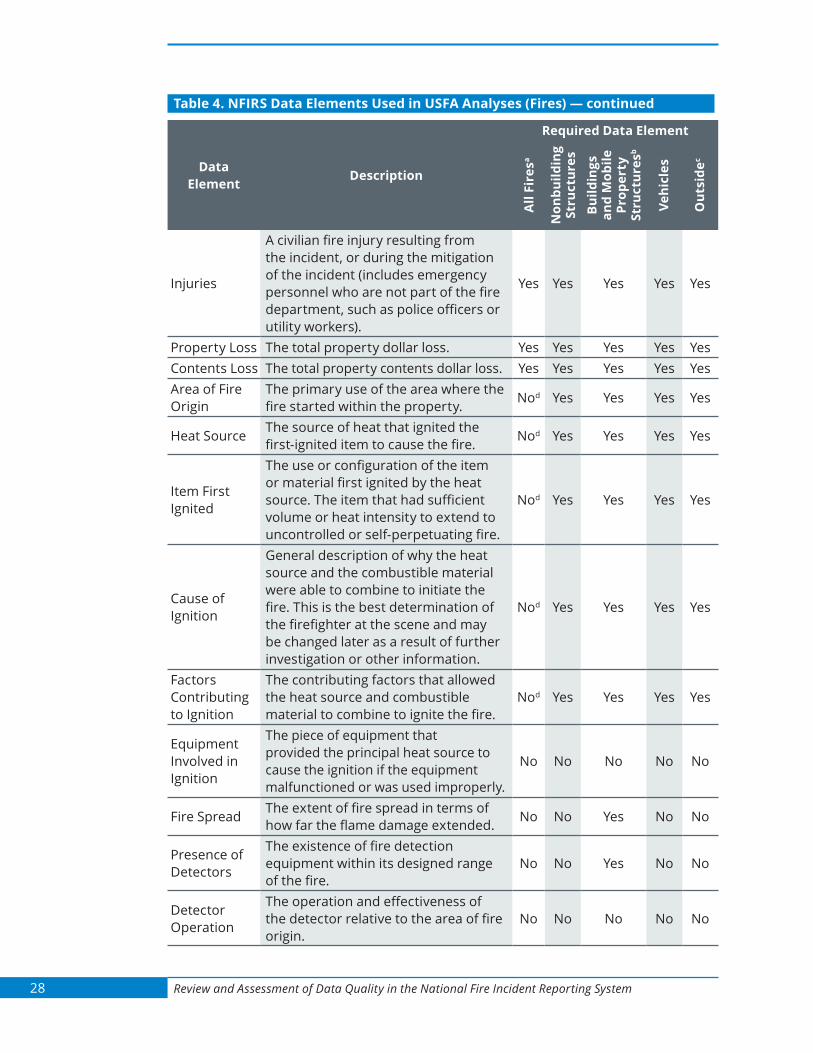
28 Review and Assessment of Data Quality in the National Fire Incident Reporting System
Table 4. NFIRS Data Elements Used in USFA Analyses (Fires) — continued
Data Element
Description
Required Data Element
All
Fire
sa
Non
build
ing
Stru
ctur
esBu
ildin
gs
and
Mob
ile
Prop
erty
St
ruct
ures
b
Vehi
cles
Out
side
c
Injuries
A civilian fire injury resulting from the incident, or during the mitigation of the incident (includes emergency personnel who are not part of the fire department, such as police officers or utility workers).
Yes Yes Yes Yes Yes
Property Loss The total property dollar loss. Yes Yes Yes Yes YesContents Loss The total property contents dollar loss. Yes Yes Yes Yes YesArea of Fire Origin
The primary use of the area where the fire started within the property. Nod Yes Yes Yes Yes
Heat Source The source of heat that ignited the first-ignited item to cause the fire. Nod Yes Yes Yes Yes
Item First Ignited
The use or configuration of the item or material first ignited by the heat source. The item that had sufficient volume or heat intensity to extend to uncontrolled or self-perpetuating fire.
Nod Yes Yes Yes Yes
Cause of Ignition
General description of why the heat source and the combustible material were able to combine to initiate the fire. This is the best determination of the firefighter at the scene and may be changed later as a result of further investigation or other information.
Nod Yes Yes Yes Yes
Factors Contributing to Ignition
The contributing factors that allowed the heat source and combustible material to combine to ignite the fire.
Nod Yes Yes Yes Yes
Equipment Involved in Ignition
The piece of equipment that provided the principal heat source to cause the ignition if the equipment malfunctioned or was used improperly.
No No No No No
Fire Spread The extent of fire spread in terms of how far the flame damage extended. No No Yes No No
Presence of Detectors
The existence of fire detection equipment within its designed range of the fire.
No No Yes No No
Detector Operation
The operation and effectiveness of the detector relative to the area of fire origin.
No No No No No

29The National Fire Incident Reporting System Data Quality
Table 4. NFIRS Data Elements Used in USFA Analyses (Fires) — continued
Data Element
Description
Required Data Element
All
Fire
sa
Non
build
ing
Stru
ctur
esBu
ildin
gs
and
Mob
ile
Prop
erty
St
ruct
ures
b
Vehi
cles
Out
side
c
Detector Effectiveness
The effectiveness of the fire detection equipment in alerting occupants. No No No No No
Presence of Automatic Extinguishing System (AES)
The existence of an AES within the AES’s designed range of a fire. No No Yes No No
Source: “NFIRS 5.0 Complete Reference Guide,” USFA, January 2013.Notes: a.“Allfires”includessmallconfinedfires,outsiderubbishfireswithnovalue,andotherunclassifiedfireswhichhaveless
stringent reporting requirements. b. “Buildings andmobilepropertystructures”doesnotincludeconfinedbuildingfires(smallfiresconfinedtotheobject
oforigin),asforthesefires,onlythemostbasicinformationabouttheincidentisrequired. c.“Outside”doesnotincludeoutsiderubbishfires(fireswithnovalue)orother,unspecifiedfires,asforthesefires,only
the most basic information about the incident is required. d.Areaoffireorigin,heatsource,itemfirstignited,causeofignition,andfactorscontributingtoignitionarenotrequired
forsmallconfinedfires,outsiderubbishfireswithnovalue,andotherunclassifiedfires,asthesetypesoffireshaveless stringent reporting requirements.

30 Review and Assessment of Data Quality in the National Fire Incident Reporting System
Table 5. NFIRS Data Elements Used in USFA Analyses (Civilian Casualties)
Data Element Description Required Data
Gender The gender of the injured person. YesAge or Date of Birth The casualty’s age in years or, if the casualty is an
infant, the age in months OR the month, day and year of birth of the casualty.
Yes
Race The identification of the race of the casualty based on U.S. Office of Management and Budget (OMB) designations.
No
Ethnicity Identifies the ethnicity of the casualty. Ethnicity is an ethnic classification or affiliation. Ethnicity designates a population subgroup having a common cultural heritage, as distinguished by customs, characteristics, language or common history, amongst other attributes. Currently, Hispanic/Latino is the only OMB designation for ethnicity.
No
Severity The relative severity or seriousness of the injury on a scale from “least serious” (minor) to “most serious” (death).
Yes
Cause of Injury The physical event that caused the injury. NoHuman Factors Contributing to Injury
The physical or mental state of the person before becoming a casualty. No
Factors Contributing to Injury
The most significant factors contributing to the injury of the casualty. No
Activity When Injured
The action or activity in which the person was engaged at the time of the injury. No
Primary Apparent Symptom
The casualty’s most serious apparent injury. No
Primary Area of Body Injured
The part of the body that sustained the most serious injury.
No
Source: “NFIRS 5.0 Complete Reference Guide,” USFA, January 2013.Note: IntheNFIRSpaperformsandtheNFIRSCRG,thefulldataelementnameisAgeorDateofBirth;inthecivilianfirecasualty
fileinthePDR,thedataelementisAge.AllotherdataelementsretaintheirnamesinthePDR.
The National Fire Incident Reporting System Data Element QualityIn the sections that follow, data elements typically used in USFA analyses are assessed for overall data quality and usefulness for the period of 2009 to 2011. The first section is an overall summary of key data elements. The second section presents the detailed assessment by year, type of fire, and data element of the data quality and data usability of data elements commonly used in the USFA’s NFIRS data analyses.

31The National Fire Incident Reporting System Data Quality
Summary TablesIn the summary tables that follow, data elements typically used in USFA analyses are assessed for overall data quality and usefulness for the period of 2009 to 2011. The summary tables are organized as follows:
ĵ Table 6, by type of fire — nonbuilding structures, buildings and mobile property structures, vehicles, and outside fires. Detailed breakouts of these summary tables by type of fire and year are found in Table 9 through Table 12.
ĵ Table 7, fires with casualties — by type of casualty (deaths, injuries) and general type of fire (all fires or building and mobile property fire where the majority of fire casualties occur). Detailed breakouts of these summary tables by type of fire and year are found in Table 13, Table 15, Table 17 and Table 19.
ĵ Table 8, by type of casualty and general type of fire (all fires or building and mobile property fire where the majority of fire casualties occur). Detailed breakouts of these summary tables by type of fire and year are found in Table 23 through Table 26.
Data quality for each data element is indexed on the total proportion of valid entries for that element. Data usability for each data element is indexed on the proportion of valid known entries for that element. Both have a maximum value of 100. Ranges of these indices are shown rather than averages. It is possible that a data element has a high data element quality index but a moderate data element usability index — while entries are valid and complete, the difference in the indices reflects the amount of data coded as unknown.
Required data elements, shown in Table 4, have an overall data quality index that is either a perfect value of 100 or very near. The exceptions are outside fires, all fires with injuries, and the presence of detectors and automatic extinguishing systems in fires other than buildings and mobile property structures. Incident data for many types of outside fires can be reported via the Wildland Module in lieu of the Fire Module. The Wildland Module does not have the full set of required data elements contained in the Fire Module. As a result, many required Fire Module data elements have no entries. The overall result is a lower data quality index.
A similar situation occurs with the data quality for fires with injuries. Fire injuries occur frequently and across all types of fires. The data quality index is in the low 90s because of the number of injuries that occur in outside and other fires where alternate reporting methods are allowed and reporting requirements are somewhat less stringent. In addition, determining many of the fire-related data elements for outside fires is difficult because of the nature of the fires.
The lower data quality index for the presence of detectors and AESs in fires other than buildings and mobile property structures is a result of deaths and injuries in incidents, such as vehicle and outside fires, where the Structure Module is not required (these data variables only apply to buildings and mobile structures).

32 Review and Assessment of Data Quality in the National Fire Incident Reporting System
Table 6. Data Element Quality and Usability Summary for Common NFIRS Data Elements Type of Fire, 2009 to 2011
Data Element
Type of Fire
Nonbuilding Structure Buildings and Mobile Property Structure Vehicle Outside
Quality Index Range
Usability Index Range
Quality Index Range
Usability Index Range
Quality Index Range
Usability Index Range
Quality Index Range
Usability Index Range
Property Use 100.0 99.2 - 99.5 100.0 99.3 - 99.4 100.0 98.4 - 98.6 100.0 98.1 - 98.5Area of Fire Origin 100.0 84.6 - 84.9 100.0 86.3 - 86.5 100.0 86.2 - 86.3 77.4 - 79.8 63.4 - 65.7Heat Source 100.0 64.6 - 65.0 100.0 62.8 - 63.7 100.0 49.4 - 49.6 90.1 - 91.1 45.2 - 47.7Item First Ignited 100.0 64.1 - 64.6 100.0 62.6 - 63.3 100.0 41.6 - 43.5 77.4 - 79.7 50.7 - 53.8Cause of Ignition 100.0 82.7 - 84.2 100.0 86.4 - 86.6 100.0 77.7 - 78.0 99.9 - 100.0 68.6 - 69.6Factors Contributing to Ignition 100.0 73.6 - 74.4 100.0 73.0 - 73.4 100.0 70.1 - 70.2 87.5 - 88.6 64.7 - 65.5
Equipment Involved in Ignition 36.1 - 40.9 35.4 - 40.2 41.6 - 42.7 40.3 - 41.4 27.9 - 29.3 27.6 - 28.9 26.4 - 27.2 25.3 - 26.3
Fire Spread – – 94.7 - 95.4 94.7 - 95.4 – – – –Presence of Detectors – – 95.4 - 95.6 68.7 - 69.2 – – – –Detector Operation – – 100.0 81.3 - 83.2 – – – –Detector Effectiveness – – 100.0 90.2 - 90.5 – – – –
Presence of AES – – 95.1 - 95.2 86.6 - 86.8 – – – –

33The National Fire Incident Reporting System Data Quality
Table 7. Data Element Quality and Usability Summary for Common NFIRS Data Elements Type of Fire With Deaths or Injuries, 2009 to 2011
Data Element
Type of Fire
Fatal FiresFatal Fires in Buildings and Mobile Property
StructureFires with Injuries
Buildings and Mobile Property Structure Fires with Injuries
Quality Index Range
Usability Index Range
Quality Index Range
Usability Index Range
Quality Index Range
Usability Index Range
Quality Index Range
Usability Index Range
Property Use 100.0 99.4 - 99.8 100.0 99.8 - 99.8 100.0 99.5 - 99.6 100.0 99.4 - 99.6Area of Fire Origin 99.2 - 99.5 79.1 - 79.5 100.0 79.9 - 80.4 90.6 - 91.9 85.9 - 86.8 100.0 94.0 - 94.4Heat Source 99.1 - 99.5 43.3 - 44.3 100.0 42.9 - 43.3 90.6 - 91.9 66.2 - 67.7 100.0 71.4 - 72.4Item First Ignited 99.1 - 99.5 43.1 - 45.3 100.0 42.3 - 45.2 90.6 - 91.9 65.4 - 66.1 99.9 - 100.0 70.6 - 71.6Cause of Ignition 99.1 - 99.5 85.6 - 87.0 100.0 86.1 - 86.8 90.6 - 92.0 83.2 - 84.8 100.0 91.9 - 92.0Factors Contributing to Ignition 99.2 - 99.5 54.5 - 56.4 100.0 51.4 - 54.9 90.6 - 91.9 70.2 - 71.4 100.0 75.4 - 77.1
Equipment Involved in Ignition 36.5 - 38.8 34.0 - 36.6 38.8 - 42.0 35.9 - 39.3 43.3 - 44.5 42.1 - 43.6 48.3 - 49.4 46.8 - 48
Fire Spread 78.5 - 79.2 78.5 - 79.2 97.9 - 98.2 97.9 - 98.2 71.0 - 74.6 71.0 - 74.6 98.6 - 98.7 98.6 - 98.7Presence of Detectors 78.7 - 79.5 46.6 - 48.7 98.2 - 98.4 58.3 - 60.1 71.3 - 74.7 54.5 - 58.2 98.7 - 98.8 75.3 - 77.1Detector Operation 100.0 61.3 - 65.5 100.0 61.4 - 65.5 100.0 81.0 - 85.5 100.0 80.3 - 85.0Detector Effectiveness 100.0 65.8 - 68.4 62.0 - 71.2 42.3 - 46.8 100.0 87.8 - 88.9 100.0 87.3 - 88.5
Presence of AES 78.5 - 79.2 71.6 - 72.3 97.8 - 98.3 89.4 - 90.1 71.0 - 74.3 68.7 - 71.4 98.1 - 98.5 94.4 - 95.5
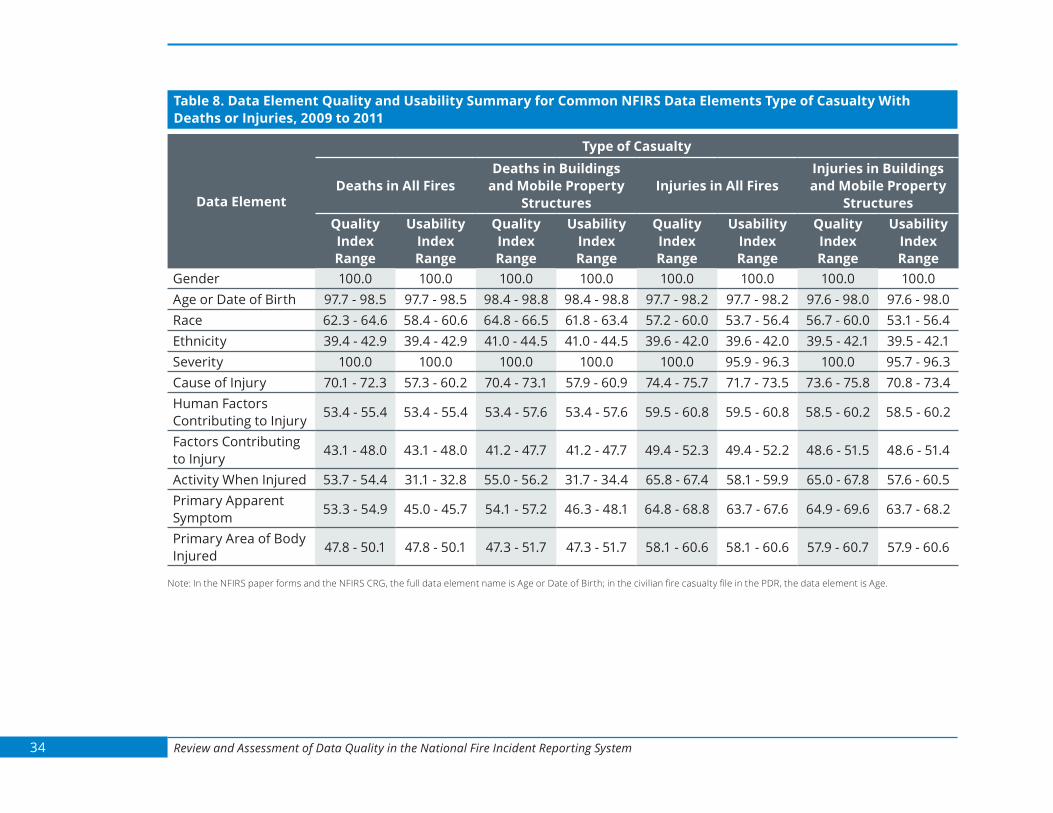
34 Review and Assessment of Data Quality in the National Fire Incident Reporting System
Table 8. Data Element Quality and Usability Summary for Common NFIRS Data Elements Type of Casualty With Deaths or Injuries, 2009 to 2011
Data Element
Type of Casualty
Deaths in All FiresDeaths in Buildings
and Mobile Property Structures
Injuries in All FiresInjuries in Buildings and Mobile Property
StructuresQuality Index Range
Usability Index Range
Quality Index Range
Usability Index Range
Quality Index Range
Usability Index Range
Quality Index Range
Usability Index Range
Gender 100.0 100.0 100.0 100.0 100.0 100.0 100.0 100.0Age or Date of Birth 97.7 - 98.5 97.7 - 98.5 98.4 - 98.8 98.4 - 98.8 97.7 - 98.2 97.7 - 98.2 97.6 - 98.0 97.6 - 98.0Race 62.3 - 64.6 58.4 - 60.6 64.8 - 66.5 61.8 - 63.4 57.2 - 60.0 53.7 - 56.4 56.7 - 60.0 53.1 - 56.4Ethnicity 39.4 - 42.9 39.4 - 42.9 41.0 - 44.5 41.0 - 44.5 39.6 - 42.0 39.6 - 42.0 39.5 - 42.1 39.5 - 42.1Severity 100.0 100.0 100.0 100.0 100.0 95.9 - 96.3 100.0 95.7 - 96.3Cause of Injury 70.1 - 72.3 57.3 - 60.2 70.4 - 73.1 57.9 - 60.9 74.4 - 75.7 71.7 - 73.5 73.6 - 75.8 70.8 - 73.4Human Factors Contributing to Injury 53.4 - 55.4 53.4 - 55.4 53.4 - 57.6 53.4 - 57.6 59.5 - 60.8 59.5 - 60.8 58.5 - 60.2 58.5 - 60.2
Factors Contributing to Injury 43.1 - 48.0 43.1 - 48.0 41.2 - 47.7 41.2 - 47.7 49.4 - 52.3 49.4 - 52.2 48.6 - 51.5 48.6 - 51.4
Activity When Injured 53.7 - 54.4 31.1 - 32.8 55.0 - 56.2 31.7 - 34.4 65.8 - 67.4 58.1 - 59.9 65.0 - 67.8 57.6 - 60.5Primary Apparent Symptom 53.3 - 54.9 45.0 - 45.7 54.1 - 57.2 46.3 - 48.1 64.8 - 68.8 63.7 - 67.6 64.9 - 69.6 63.7 - 68.2
Primary Area of Body Injured 47.8 - 50.1 47.8 - 50.1 47.3 - 51.7 47.3 - 51.7 58.1 - 60.6 58.1 - 60.6 57.9 - 60.7 57.9 - 60.6
Note:IntheNFIRSpaperformsandtheNFIRSCRG,thefulldataelementnameisAgeorDateofBirth;inthecivilianfirecasualtyfileinthePDR,thedataelementisAge.

35The National Fire Incident Reporting System Data Quality
Detailed Data Quality and Usability of Commonly Used Data Elements in AnalysesThe following tables present the detailed assessment of data quality and data usability of data elements commonly used in the USFA’s NFIRS data analyses. For coded data elements, four data quality measures are assessed based on the proportion of fires that fall under the measure for the data element in question. These measures are:
ĵ Valid known — The number/percent of data element entries that are valid according to the NFIRS CRG.
ĵ Valid unknown — The number/percent of data element entries that are coded as unknown (“U,” “UU” or “UUU”), where unknown is a valid entry according to the NFIRS CRG.
ĵ Invalid — The number/percent of data element entries whose entries are not valid according to the NFIRS CRG.
ĵ Null or no entry — The number of entries where no data has been entered whether or not the data element is required to be completed.
The two quality indices, data element quality and data element usability, are also included in each of these tables. As noted earlier, it is possible that a data element with a high data quality index may have a moderate, or even low, usability index. For example, in Table 9 the data element “heat source” has a data quality index of 100.0 — all entries in heat source for nonbuilding fires are valid entries, whether the actual heat source is explicitly specified or it is coded as “unknown.” The usability index, however, is 64.6 because a very large proportion of those entries are coded as “unknown,” making definitive analyses using this data element problematic.
For data elements that have direct entry, specifically dollar losses and numbers of casualties, distributions of entries are shown.
Table 9 through Table 12 are detailed breakouts by year of common NFIRS data elements by the four major types of fire. These tables are also summarized in Table 6.
Table 13 through Table 20 are paired tables of detailed breakouts by year of common NFIRS data elements for fires with casualties by type of casualty (deaths, injuries) and general type of fire (all fires or building and mobile property fire). Each detailed table is followed by a distribution of the number of casualties (e.g., reported deaths or injuries) by year. The detailed tables are also summarized in Table 7.
Table 21 is the distribution of reported property loss by year for each of the four major fire types.
Table 22 is the distribution of reported content loss by year for building and mobile property structure fires, where content losses are typically found.
Table 23 through Table 26 are detailed breakouts by year of common NFIRS data elements for reported casualties (deaths, injuries) by general type of fire (all fires or building and mobile property fire). These tables are also summarized in Table 8.

36 Review and Assessment of Data Quality in the National Fire Incident Reporting System
Table 9. Data Element Quality and Usability for Common NFIRS Data Elements Used in USFA Analyses Reported Nonbuilding Structure Fires, 2009 to 2011
Data Element
Number of Reported
Fires
Number and Percent of Reported FiresQuality Index
Usability IndexValid
KnownValid
Unknowna Invalid Null or No Entry
2009Property Use 8,254 8,213 41 0 0
100.0 99.5Percent 100.0 99.5 0.5 0.0 0.0
Area of Fire Origin 8,254 6,979 1,275 0 0100.0 84.6
Percent 100.0 84.6 15.4 0.0 0.0Heat Source 8,254 5,334 2,920 0 0
100.0 64.6Percent 100.0 64.6 35.4 0.0 0.0
Item First Ignited 8,254 5,330 2,924 0 0100.0 64.6
Percent 100.0 64.6 35.4 0.0 0.0Cause of Ignition 8,254 6,825 1,429 0 0
100.0 82.7Percent 100.0 82.7 17.3 0.0 0.0
Factors Contributing to Ignition 8,254 6,072 2,179 0 3100.0 73.6
Percent 100.0 73.6 26.4 0.0 0.0Equipment Involved in Ignition 8,254 3,320 60 0 4,874
40.9 40.2Percent 100.0 40.2 0.7 0.0 59.1
2010Property Use 9,381 9,311 70 0 0
100.0 99.3Percent 100.0 99.3 0.7 0.0 0.0
Area of Fire Origin 9,381 7,947 1,434 0 0100.0 84.7
Percent 100.0 84.7 15.3 0.0 0.0Heat Source 9,381 6,100 3,281 0 0
100.0 65.0Percent 100.0 65.0 35.0 0.0 0.0
Item First Ignited 9,381 6,010 3,371 0 0100.0 64.1
Percent 100.0 64.1 35.9 0.0 0.0

37The National Fire Incident Reporting System Data Quality
Table 9. Data Element Quality and Usability for Common NFIRS Data Elements Used in USFA Analyses Reported Nonbuilding Structure Fires, 2009 to 2011 — continued
Data Element
Number of Reported
Fires
Number and Percent of Reported FiresQuality Index
Usability IndexValid
KnownValid
Unknowna Invalid Null or No Entry
Cause of Ignition 9,381 7,841 1,540 0 0100.0 83.6
Percent 100.0 83.6 16.4 0.0 0.0Factors Contributing to Ignition 9,381 6,984 2,397 0 0
100.0 74.4Percent 100.0 74.4 25.6 0.0 0.0
Equipment Involved in Ignition 9,381 3,454 88 0 5,83937.7 36.8
Percent 100.0 36.8 0.9 0.0 62.22011
Property Use 9,996 9,918 78 0 0100.0 99.5
Percent 100.0 99.2 0.8 0.0 0.0Area of Fire Origin 9,996 8,486 1,510 0 0
100.0 84.6Percent 100.0 84.9 15.1 0.0 0.0
Heat Source 9,996 6,479 3,517 0 0100.0 64.6
Percent 100.0 64.8 35.2 0.0 0.0Item First Ignited 9,996 6,422 3,574 0 0
100.0 64.6Percent 100.0 64.2 35.8 0.0 0.0
Cause of Ignition 9,996 8,413 1,583 0 0100.0 82.7
Percent 100.0 84.2 15.8 0.0 0.0Factors Contributing to Ignition 9,996 7,361 2,635 0 0
100.0 73.6Percent 100.0 73.6 26.4 0.0 0.0
Equipment Involved in Ignition 9,996 3,541 73 0 6,38236.1 40.2
Percent 100.0 35.4 0.7 0.0 63.8
Source: NFIRS.Note: a.Validunknownentriesarecodedas“U,”“UU”or“UUU”(dependingonthefieldlength).Thesecodedvaluesaredistinctlydifferentfromblanksandnoentriesasthelackof
information only implies that the information was not given and does not imply that the element is truly “unknown.”

38 Review and Assessment of Data Quality in the National Fire Incident Reporting System
Table 10. Data Element Quality and Usability for Common NFIRS Data Elements Used in USFA Analyses Reported Buildings and Mobile Property Structure Fires22, 2009 to 2011
Data ElementNumber of Reported
Fires
Number and Percent of Reported FiresQuality Index
Usability IndexValid
KnownValid
Unknowna Invalid Null or No Entry
2009Property Use 167,249 166,258 991 0 0
100.0 99.4Percent 100.0 99.4 0.6 0.0 0.0
Area of Fire Origin 167,249 144,258 22,986 0 5100.0 86.3
Percent 100.0 86.3 13.7 0.0 0.0Heat Source 167,249 104,991 62,253 0 5
100.0 62.8Percent 100.0 62.8 37.2 0.0 0.0
Item First Ignited 167,249 105,813 61,431 0 5100.0 63.3
Percent 100.0 63.3 36.7 0.0 0.0Cause of Ignition 167,249 144,432 22,812 0 5
100.0 86.4Percent 100.0 86.4 13.6 0.0 0.0
Factors Contributing to Ignition 167,249 122,202 45,036 0 11100.0 73.1
Percent 100.0 73.1 26.9 0.0 0.0Equipment Involved in Ignition 167,249 69,307 2,216 0 95,726
42.7 41.4Percent 100.0 41.4 1.3 0.0 57.2
Fire Spread 167,249 158,389 0 0 8,86094.7 94.7
Percent 100.0 94.7 0.0 0.0 5.3Presence of Detectors 167,249 114,842 44,631 0 7,776
95.4 68.7Percent 100.0 68.7 26.7 0.0 4.6
Detector Operation (when present) 59,248 48,140 11,108 0 0100.0 81.3
Percent 100.0 81.3 18.7 0.0 .00
22Does not include confined building fires (small fires confined to the object of origin), as for these fires, only the most basic information about the incident is required.

39The National Fire Incident Reporting System Data Quality
Table 10. Data Element Quality and Usability for Common NFIRS Data Elements Used in USFA Analyses Reported Buildings and Mobile Property Structure Fires, 2009 to 2011 — continued
Data ElementNumber of Reported
Fires
Number and Percent of Reported FiresQuality Index
Usability IndexValid
KnownValid
Unknowna Invalid Null or No Entry
Detector Effectiveness (when present and operating) 34,059 30,726 3,333 0 0
100.0 90.2Percent 100.0 90.2 9.8 0.0 0.0
Presence of AES 167,249 144,790 14,134 0 8,32595.1 86.6
Percent 100.0 86.6 8.5 0.0 5.02010
Property Use 187,711 186,469 1,242 0 0100.0 99.3
Percent 100.0 99.3 0.7 0.0 0.0Area of Fire Origin 187,711 162,375 25,327 0 9
100.0 86.5Percent 100.0 86.5 13.5 0.0 0.0
Heat Source 187,711 119,575 68,127 0 9100.0 63.7
Percent 100.0 63.7 36.3 0.0 0.0Item First Ignited 187,711 118,632 69,062 0 17
100.0 63.2Percent 100.0 63.2 36.8 0.0 0.0
Cause of Ignition 187,711 162,602 25,092 0 17100.0 86.6
Percent 100.0 86.6 13.4 0.0 0.0Factors Contributing to Ignition 187,711 137,805 49,893 0 13
100.0 73.4Percent 100.0 73.4 26.6 0.0 0.0
Equipment Involved in Ignition 187,711 75,692 2,382 0 109,63741.6 40.3
Percent 100.0 40.3 1.3 0.0 58.4Fire Spread 187,711 178,380 0 0 9,331
95.0 95.0Percent 100.0 95.0 0.0 0.0 5.0
Presence of Detectors 187,711 129,825 49,128 0 8,75895.4 69.2
Percent 100.0 69.2 26.2 0.0 4.7

40 Review and Assessment of Data Quality in the National Fire Incident Reporting System
Table 10. Data Element Quality and Usability for Common NFIRS Data Elements Used in USFA Analyses Reported Buildings and Mobile Property Structure Fires, 2009 to 2011 — continued
Data ElementNumber of Reported
Fires
Number and Percent of Reported FiresQuality Index
Usability IndexValid
KnownValid
Unknowna Invalid Null or No Entry
Detector Operation (when present) 68,466 56,956 11,507 0 3100.0 83.2
Percent 100.0 83.2 16.8 0.0 0.0Detector Effectiveness (when present and operating) 39,608 35,836 3,770 0 2
100.0 90.5Percent 100.0 90.5 9.5 0.0 0.0
Presence of AES 187,711 162,868 15,551 0 9,29295.1 86.8
Percent 100.0 86.8 8.3 0.0 5.02011
Property Use 188,976 187,852 1,123 1 0100.0 99.4
Percent 100.0 99.4 0.6 0.0 0.0Area of Fire Origin 188,976 163,235 25,740 0 1
100.0 86.4Percent 100.0 86.4 13.6 0.0 0.0
Heat Source 188,976 119,536 69,439 0 1100.0 63.3
Percent 100.0 63.3 36.7 0.0 0.0Item First Ignited 188,976 118,283 70,692 0 1
100.0 62.6Percent 100.0 62.6 37.4 0.0 0.0
Cause of Ignition 188,976 163,557 25,418 0 1100.0 86.5
Percent 100.0 86.5 13.5 0.0 0.0Factors Contributing to Ignition 188,976 137,993 50,979 0 4
100.0 73.0Percent 100.0 73.0 27.0 0.0 0.0
Equipment Involved in Ignition 188,976 76,291 2,267 0 110,41841.6 40.4
Percent 100.0 40.4 1.2 0.0 58.4Fire Spread 188,976 180,321 0 0 8,655
95.4 95.4Percent 100.0 95.4 0.0 0.0 4.6

41The National Fire Incident Reporting System Data Quality
Table 10. Data Element Quality and Usability for Common NFIRS Data Elements Used in USFA Analyses Reported Buildings and Mobile Property Structure Fires, 2009 to 2011 — continued
Data ElementNumber of Reported
Fires
Number and Percent of Reported FiresQuality Index
Usability IndexValid
KnownValid
Unknowna Invalid Null or No Entry
Presence of Detectors 188,976 130,179 50,391 0 8,40695.6 68.9
Percent 100.0 68.9 26.7 0.0 4.4Detector Operation (when present) 69,324 57,689 11,634 0 1
100.0 83.2Percent 100.0 83.2 16.8 0.0 0.0
Detector Effectiveness (when present and operating) 40,302 36,380 3,922 0 0
100.0 90.3Percent 100.0 90.3 9.7 0.0 0.0
Presence of AES 188,976 163,858 16,131 0 8,98795.2 86.7
Percent 100.0 86.7 8.5 0.0 4.8
Source: NFIRS.Note: a.Validunknownentriesareentriescodedas“U,”“UU”or“UUU”(dependingonthefieldlength).Thesecodedvaluesaredistinctlydifferentfromblanksandnoentriesasthe
lack of information only implies that the information was not given and does not imply that the element is truly “unknown.”

42 Review and Assessment of Data Quality in the National Fire Incident Reporting System
Table 11. Data Element Quality and Usability for Common NFIRS Data Elements Used in USFA Analyses Reported Vehicle Fires, 2009 to 2011
Data ElementNumber of Reported
Fires
Number and Percent of Reported FiresQuality Index
Usability IndexValid
KnownValid
Unknowna Invalid Null or No Entry
2009Property Use 149,471 147,006 2,465 0 0
100.0 98.4Percent 100.0 98.4 1.6 0.0 0.0
Area of Fire Origin 149,471 128,922 20,548 0 1100.0 86.3
Percent 100.0 86.3 13.7 0.0 0.0Heat Source 149,471 74,076 75,394 0 1
100.0 49.6Percent 100.0 49.6 50.4 0.0 0.0
Item First Ignited 149,471 64,987 84,483 0 1100.0 43.5
Percent 100.0 43.5 56.5 0.0 0.0Cause of Ignition 149,471 116,136 33,334 0 1
100.0 77.7Percent 100.0 77.7 22.3 0.0 0.0
Factors Contributing to Ignition 149,471 104,722 44,744 0 5100.0 70.1
Percent 100.0 70.1 29.9 0.0 0.0Equipment Involved in Ignition 149,471 43,260 585 0 105,626
29.3 28.9Percent 100.0 28.9 0.4 0.0 70.7
2010Property Use 155,267 152,854 2,412 1 0
100.0 98.4Percent 100.0 98.4 1.6 0.0 0.0
Area of Fire Origin 155,267 133,863 21,400 0 4100.0 86.2
Percent 100.0 86.2 13.8 0.0 0.0Heat Source 155,267 76,749 78,514 0 4
100.0 49.4Percent 100.0 49.4 50.6 0.0 0.0
Item First Ignited 155,267 65,395 89,859 0 13100.0 42.1
Percent 100.0 42.1 57.9 0.0 0.0

43The National Fire Incident Reporting System Data Quality
Table 11. Data Element Quality and Usability for Common NFIRS Data Elements Used in USFA Analyses Reported Vehicle Fires, 2009 to 2011 — continued
Data ElementNumber of Reported
Fires
Number and Percent of Reported FiresQuality Index
Usability IndexValid
KnownValid
Unknowna Invalid Null or No Entry
Cause of Ignition 155,267 120,795 34,457 2 13100.0 77.8
Percent 100.0 77.8 22.2 0.0 0.0Factors Contributing to Ignition 155,267 109,026 46,231 0 10
100.0 70.2Percent 100.0 70.2 29.8 0.0 0.0
Equipment Involved in Ignition 155,267 42,792 508 0 111,96727.9 27.6
Percent 100.0 27.6 0.3 0.0 72.12011
Property Use 149,333 147,178 2,155 0 0100.0 98.6
Percent 100.0 98.6 1.4 0.0 0.0Area of Fire Origin 149,333 128,838 20,495 0 0
100.0 86.3Percent 100.0 86.3 13.7 0.0 0.0
Heat Source 149,333 73,884 75,449 0 0100.0 49.5
Percent 100.0 49.5 50.5 0.0 0.0Item First Ignited 149,333 62,185 87,148 0 0
100.0 41.6Percent 100.0 41.6 58.4 0.0 0.0
Cause of Ignition 149,333 116,504 32,829 0 0100.0 78.0
Percent 100.0 78.0 22.0 0.0 0.0Factors Contributing to Ignition 149,333 104,707 44,625 0 1
100.0 70.1Percent 100.0 70.1 29.9 0.0 0.0
Equipment Involved in Ignition 149,333 42,343 456 0 106,53428.7 28.4
Percent 100.0 28.4 0.3 0.0 71.3
Source: NFIRS.Note: a.Validunknownentriesarecodedas“U,”“UU”or“UUU”(dependingonthefieldlength).Thesecodedvaluesaredistinctlydifferentfromblanksandnoentriesasthelackof
information only implies that the information was not given and does not imply that the element is truly “unknown.”
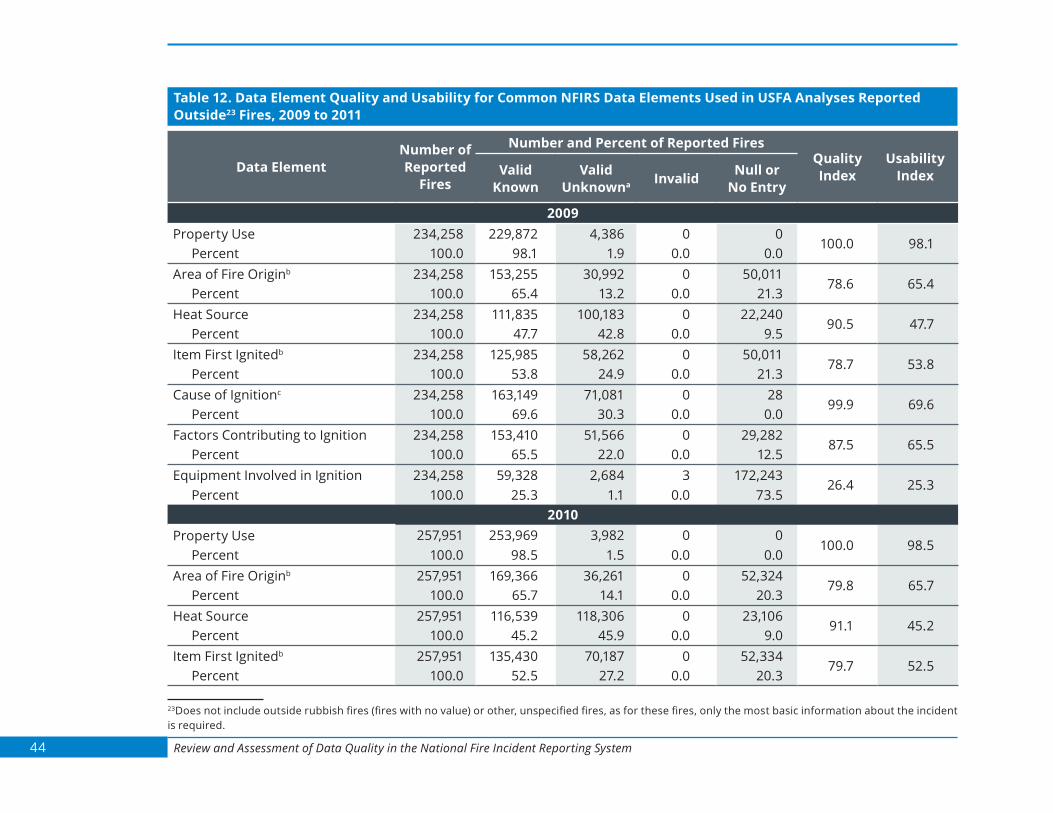
44 Review and Assessment of Data Quality in the National Fire Incident Reporting System
Table 12. Data Element Quality and Usability for Common NFIRS Data Elements Used in USFA Analyses Reported Outside23 Fires, 2009 to 2011
Data ElementNumber of Reported
Fires
Number and Percent of Reported FiresQuality Index
Usability IndexValid
KnownValid
Unknowna Invalid Null or No Entry
2009Property Use 234,258 229,872 4,386 0 0
100.0 98.1Percent 100.0 98.1 1.9 0.0 0.0
Area of Fire Originb 234,258 153,255 30,992 0 50,01178.6 65.4
Percent 100.0 65.4 13.2 0.0 21.3Heat Source 234,258 111,835 100,183 0 22,240
90.5 47.7Percent 100.0 47.7 42.8 0.0 9.5
Item First Ignitedb 234,258 125,985 58,262 0 50,01178.7 53.8
Percent 100.0 53.8 24.9 0.0 21.3Cause of Ignitionc 234,258 163,149 71,081 0 28
99.9 69.6Percent 100.0 69.6 30.3 0.0 0.0
Factors Contributing to Ignition 234,258 153,410 51,566 0 29,28287.5 65.5
Percent 100.0 65.5 22.0 0.0 12.5Equipment Involved in Ignition 234,258 59,328 2,684 3 172,243
26.4 25.3Percent 100.0 25.3 1.1 0.0 73.5
2010Property Use 257,951 253,969 3,982 0 0
100.0 98.5Percent 100.0 98.5 1.5 0.0 0.0
Area of Fire Originb 257,951 169,366 36,261 0 52,32479.8 65.7
Percent 100.0 65.7 14.1 0.0 20.3Heat Source 257,951 116,539 118,306 0 23,106
91.1 45.2Percent 100.0 45.2 45.9 0.0 9.0
Item First Ignitedb 257,951 135,430 70,187 0 52,33479.7 52.5
Percent 100.0 52.5 27.2 0.0 20.3
23Does not include outside rubbish fires (fires with no value) or other, unspecified fires, as for these fires, only the most basic information about the incident is required.

45The National Fire Incident Reporting System Data Quality
Table 12. Data Element Quality and Usability for Common NFIRS Data Elements Used in USFA Analyses Reported Outside Fires, 2009 to 2011 — continued
Data ElementNumber of Reported
Fires
Number and Percent of Reported FiresQuality Index
Usability IndexValid
KnownValid
Unknowna Invalid Null or No Entry
Cause of Ignitionc 257,951 176,886 81,018 1 46100.0 68.6
Percent 100.0 68.6 31.4 0.0 0.0Factors Contributing to Ignition 257,951 168,525 60,224 0 29,202
88.6 65.3Percent 100.0 65.3 23.3 0.0 11.3
Equipment Involved in Ignition 257,951 67,968 2,225 4 187,75427.2 26.3
Percent 100.0 26.3 0.9 0.0 72.82011
Property Use 274,379 269,651 4,727 1 0100.0 98.3
Percent 100.0 98.3 1.7 0.0 0.0Area of Fire Originb 274,379 174,031 38,319 0 62,029
77.4 63.4Percent 100.0 63.4 14.0 0.0 22.6
Heat Source 274,379 124,467 122,550 0 27,36290.1 45.4
Percent 100.0 45.4 44.7 0.0 10.0Item First Ignitedb 274,379 139,019 73,331 0 62,029
77.4 50.7Percent 100.0 50.7 26.7 0.0 22.6
Cause of Ignitionc 274,379 188,816 85,562 0 1100.0 68.8
Percent 100.0 68.8 31.2 0.0 0.0Factors Contributing to Ignition 274,379 177,608 62,812 0 33,959
87.6 64.7Percent 100.0 64.7 22.9 0.0 12.4
Equipment Involved in Ignition 274,379 71,994 2,007 4 200,37426.9 26.2
Percent 100.0 26.2 0.7 0.0 73
Source: NFIRS.Notes: a.Validunknownentriesarecodedas“U,”“UU”or“UUU”(dependingonthefieldlength).Thesecodedvaluesaredistinctlydifferentfromblanksandnoentriesasthelackof
information only implies that the information was not given and does not imply that the element is truly “unknown.” b.Forvegetation,cropandotherspecifictypesofoutsidefires,datacanbereportedviatheFireorWildlandFireModules.Areaoffireoriginanditemfirstignitedarefoundin
theFireModuleonly. c.Forvegetation,cropandotherspecifictypesofoutsidefires,datacanbereportedviatheFireorWildlandFireModules.Thegeneralcausedataelementiscauseofignition
intheFireModuleandwildlandfirecauseintheWildlandFireModule.

46 Review and Assessment of Data Quality in the National Fire Incident Reporting System
Table 13. Data Element Quality and Usability for Common NFIRS Data Elements Used in USFA Analyses Reported Fatal Fires, 2009 to 2011
Data ElementNumber of Reported
Fires
Number and Percent of Reported FiresQuality Index
Usability IndexValid
KnownValid
Unknowna Invalid Null or No Entry
2009Property Use 1,512 1,508 4 0 0
100.0 99.7Percent 100.0 99.7 0.3 0.0 0.0
Area of Fire Origin 1,512 1,199 306 0 799.5 79.3
Percent 100.0 79.3 20.2 0.0 0.5Heat Source 1,512 670 835 0 7
99.5 44.3Percent 100.0 44.3 55.2 0.0 0.5
Item First Ignited 1,512 685 820 0 799.5 45.3
Percent 100.0 45.3 54.2 0.0 0.5Cause of Ignition 1,512 1,316 189 0 7
99.5 87Percent 100.0 87.0 12.5 0.0 0.5
Factors Contributing to Ignition 1,512 853 652 0 799.5 56.4
Percent 100.0 56.4 43.1 0.0 0.5Equipment Involved in Ignition 1,512 554 33 0 925
38.8 36.6Percent 100.0 36.6 2.2 0.0 61.2
Fire Spread 1,512 1,189 0 0 32378.6 78.6
Percent 100.0 78.6 0.0 0.0 21.4Presence of Detectors 1,512 708 486 0 318
78.9 46.8Percent 100.0 46.8 32.1 0.0 21
Detector Operation (when present) 424 275 149 0 0
100.0 64.9Percent 100.0 64.9 35.1 0.0 0.0
Detector Effectiveness (when present and operating) 170 116 54 0 0
100.0 68.2Percent 100.0 68.2 31.8 0.0 0.0

47The National Fire Incident Reporting System Data Quality
Table 13. Data Element Quality and Usability for Common NFIRS Data Elements Used in USFA Analyses Reported Fatal Fires, 2009 to 2011 — continued
Data ElementNumber of Reported
Fires
Number and Percent of Reported FiresQuality Index
Usability IndexValid
KnownValid
Unknowna Invalid Null or No Entry
Presence of AES 1,512 1,083 105 0 32478.5 71.6
Percent 100.0 71.6 6.9 0.0 21.42010
Property Use 1,637 1,627 10 0 0100.0 99.4
Percent 100.0 99.4 0.6 0.0 0.0Area of Fire Origin 1,637 1,301 322 0 14
99.2 79.5Percent 100.0 79.5 19.7 0.0 0.9
Heat Source 1,637 726 897 0 1499.1 44.3
Percent 100.0 44.3 54.8 0.0 0.9Item First Ignited 1,637 706 917 0 14
99.1 43.1Percent 100.0 43.1 56.0 0.0 0.9
Cause of Ignition 1,637 1,402 221 0 1499.1 85.6
Percent 100.0 85.6 13.5 0.0 0.9Factors Contributing to Ignition 1,637 892 731 0 14
99.2 54.5Percent 100.0 54.5 44.7 0.0 0.9
Equipment Involved in Ignition 1,637 557 41 0 1,03936.5 34.0
Percent 100.0 34.0 2.5 0.0 63.5Fire Spread 1,637 1,296 0 0 341
79.2 79.2Percent 100.0 79.2 0.0 0.0 20.8
Presence of Detectors 1,637 798 505 0 33479.5 48.7
Percent 100.0 48.7 30.8 0.0 20.4Detector Operation (when present) 481 295 186 0 0
100.0 61.3Percent 100.0 61.3 38.7 0.0 0.0

48 Review and Assessment of Data Quality in the National Fire Incident Reporting System
Table 13. Data Element Quality and Usability for Common NFIRS Data Elements Used in USFA Analyses Reported Fatal Fires, 2009 to 2011 — continued
Data ElementNumber of Reported
Fires
Number and Percent of Reported FiresQuality Index
Usability IndexValid
KnownValid
Unknowna Invalid Null or No Entry
Detector Effectiveness (when present and operating) 193 132 61 0 0
100.0 68.4Percent 100.0 68.4 31.6 0.0 0.0
Presence of AES 1,637 1,183 113 0 34179.2 72.3
Percent 100.0 72.3 6.9 0.0 20.82011
Property Use 1,690 1,686 4 0 0100.0 99.8
Percent 100.0 99.8 0.2 0.0 0.0Area of Fire Origin 1,690 1,337 342 0 11
99.3 79.1Percent 100.0 79.1 20.2 0.0 0.7
Heat Source 1,690 731 948 0 1199.4 43.3
Percent 100.0 43.3 56.1 0.0 0.7Item First Ignited 1,690 728 951 0 11
99.4 43.1Percent 100.0 43.1 56.3 0.0 0.7
Cause of Ignition 1,690 1,458 221 0 1199.4 86.3
Percent 100.0 86.3 13.1 0.0 0.7Factors Contributing to Ignition 1,690 929 750 0 11
99.4 55.0Percent 100.0 55.0 44.4 0.0 0.7
Equipment Involved in Ignition 1,690 606 35 0 1,04938.0 35.9
Percent 100.0 35.9 2.1 0.0 62.1Fire Spread 1,690 1,327 0 0 363
78.5 78.5Percent 100.0 78.5 0.0 0.0 21.5
Presence of Detectors 1,690 788 542 0 36078.7 46.6
Percent 100.0 46.6 32.1 0.0 21.3

49The National Fire Incident Reporting System Data Quality
Table 13. Data Element Quality and Usability for Common NFIRS Data Elements Used in USFA Analyses Reported Fatal Fires, 2009 to 2011 — continued
Data ElementNumber of Reported
Fires
Number and Percent of Reported FiresQuality Index
Usability IndexValid
KnownValid
Unknowna Invalid Null or No Entry
Detector Operation (when present) 478 313 165 0 0
100.0 65.5Percent 100.0 65.5 34.5 0.0 0.0
Detector Effectiveness (when present and operating) 222 146 76 0 0
100.0 65.8Percent 100.0 65.8 34.2 0.0 0.0
Presence of AES 1,690 1,217 112 0 36178.6 72.0
Percent 100.0 72.0 6.6 0.0 21.4
Source: NFIRS.Note: a.Validunknownentriesarecodedas“U,”“UU”or“UUU”(dependingonthefieldlength).Thesecodedvaluesaredistinctlydifferentfromblanksandnoentriesasthelackof
information only implies that the information was not given and does not imply that the element is truly “unknown.”
Table 14. Data Quality for Common NFIRS Data Elements Used in USFA Analyses Distribution of Fatal Fires by Reported Deaths, 2009 to 2011
Deaths per Incident
2009 2010 2011
Fires Percent Fires Percent Fires Percent1 1,284 84.9 1,409 86.1 1,480 87.62 172 11.4 164 10.0 148 8.83 36 2.4 37 2.3 36 2.14 10 0.7 13 0.8 13 0.85 8 0.5 9 0.5 7 0.4
More than 5 2 0.1 5 0.3 6 0.4Total fires 1,512 100.0 1,637 100.0 1,690 100.0
Source: NFIRS. Note: Total for 2011 does not add up to 100 percent due to rounding.

50 Review and Assessment of Data Quality in the National Fire Incident Reporting System
Table 15. Data Element Quality and Usability for Common NFIRS Data Elements Used in USFA Analyses Reported Buildings24 and Mobile Property Structure Fatal Fires, 2009 to 2011
Data ElementNumber of Reported
Fires
Number and Percent of Reported FiresQuality Index
Usability IndexValid
KnownValid
Unknowna Invalid Null or No Entry
2009Property Use 1,206 1,203 3 0 0
100.0 99.8Percent 100.0 99.8 0.2 0.0 0.0
Area of Fire Origin 1,206 966 240 0 0100.0 80.1
Percent 100.0 80.1 19.9 0.0 0.0Heat Source 1,206 522 684 0 0
100.0 43.3Percent 100.0 43.3 56.7 0.0 0.0
Item First Ignited 1,206 545 661 0 0100.0 45.2
Percent 100.0 45.2 54.8 0.0 0.0Cause of Ignition 1,206 1,047 159 0 0
100.0 86.8Percent 100.0 86.8 13.2 0.0 0.0
Factors Contributing to Ignition 1,206 662 544 0 0100.0 54.9
Percent 100.0 54.9 45.1 0.0 0.0Equipment Involved in Ignition 1,206 474 32 0 700
42.0 39.3Percent 100.0 39.3 2.7 0.0 58.0
Fire Spread 1,206 1,183 0 0 2398.1 98.1
Percent 100.0 98.1 0.0 0.0 1.9Presence of Detectors 1,206 705 481 0 20
98.4 58.5Percent 100.0 58.5 39.9 0.0 1.7
Detector Operation (when present) 423 274 149 0 0
100.0 64.8Percent 100.0 64.8 35.2 0.0 0.0
24Does not include confined building fires (small fires confined to the object of origin) or outside rubbish fires (fires with no value), as for these fires, only the most basic information about the incident is required.
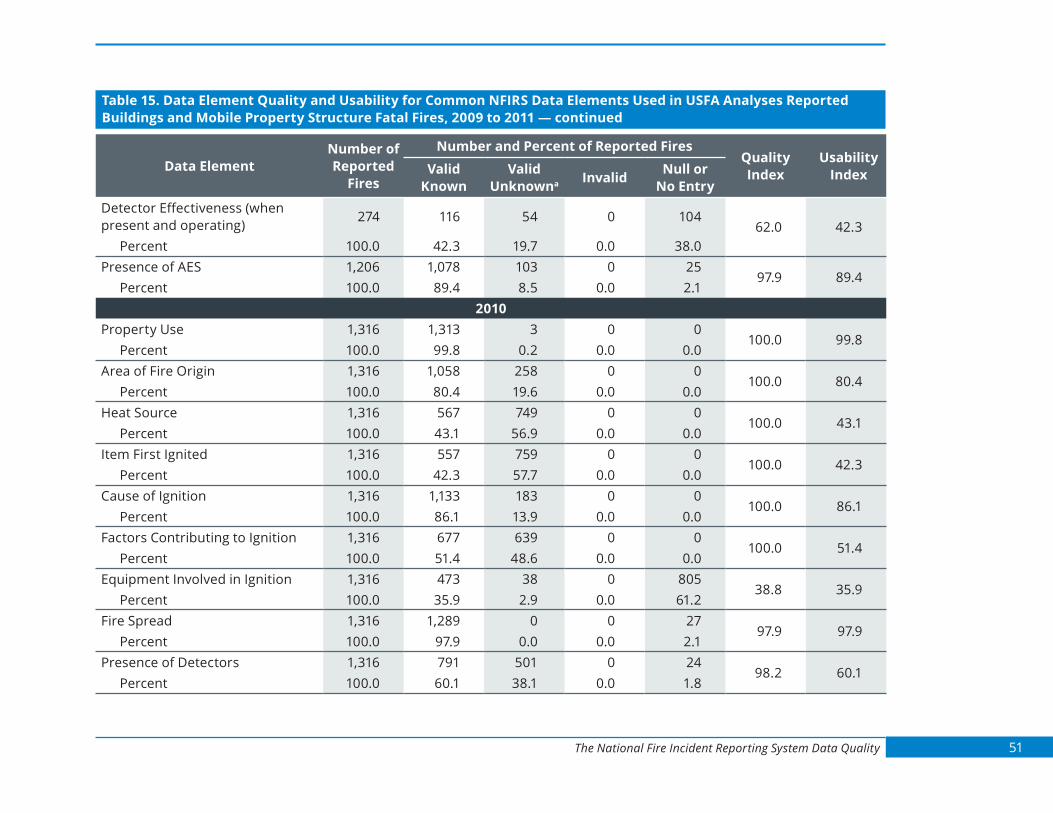
51The National Fire Incident Reporting System Data Quality
Table 15. Data Element Quality and Usability for Common NFIRS Data Elements Used in USFA Analyses Reported Buildings and Mobile Property Structure Fatal Fires, 2009 to 2011 — continued
Data ElementNumber of Reported
Fires
Number and Percent of Reported FiresQuality Index
Usability IndexValid
KnownValid
Unknowna Invalid Null or No Entry
Detector Effectiveness (when present and operating) 274 116 54 0 104
62.0 42.3Percent 100.0 42.3 19.7 0.0 38.0
Presence of AES 1,206 1,078 103 0 2597.9 89.4
Percent 100.0 89.4 8.5 0.0 2.12010
Property Use 1,316 1,313 3 0 0100.0 99.8
Percent 100.0 99.8 0.2 0.0 0.0Area of Fire Origin 1,316 1,058 258 0 0
100.0 80.4Percent 100.0 80.4 19.6 0.0 0.0
Heat Source 1,316 567 749 0 0100.0 43.1
Percent 100.0 43.1 56.9 0.0 0.0Item First Ignited 1,316 557 759 0 0
100.0 42.3Percent 100.0 42.3 57.7 0.0 0.0
Cause of Ignition 1,316 1,133 183 0 0100.0 86.1
Percent 100.0 86.1 13.9 0.0 0.0Factors Contributing to Ignition 1,316 677 639 0 0
100.0 51.4Percent 100.0 51.4 48.6 0.0 0.0
Equipment Involved in Ignition 1,316 473 38 0 80538.8 35.9
Percent 100.0 35.9 2.9 0.0 61.2Fire Spread 1,316 1,289 0 0 27
97.9 97.9Percent 100.0 97.9 0.0 0.0 2.1
Presence of Detectors 1,316 791 501 0 2498.2 60.1
Percent 100.0 60.1 38.1 0.0 1.8

52 Review and Assessment of Data Quality in the National Fire Incident Reporting System
Table 15. Data Element Quality and Usability for Common NFIRS Data Elements Used in USFA Analyses Reported Buildings and Mobile Property Structure Fatal Fires, 2009 to 2011 — continued
Data ElementNumber of Reported
Fires
Number and Percent of Reported FiresQuality Index
Usability IndexValid
KnownValid
Unknowna Invalid Null or No Entry
Detector Operation (when present) 479 294 185 0 0
100.0 61.4Percent 100.0 61.4 38.6 0.0 0.0
Detector Effectiveness (when present and operating) 294 132 61 0 101
65.6 44.9Percent 100.0 44.9 20.7 0.0 34.4
Presence of AES 1,316 1,177 110 0 2997.8 89.4
Percent 100.0 89.4 8.4 0.0 2.22011
Property Use 1,338 1,335 3 0 0100.0 99.8
Percent 100.0 99.8 0.2 0.0 0.0Area of Fire Origin 1,338 1,069 269 0 0
100.0 79.9Percent 100.0 79.9 20.1 0.0 0.0
Heat Source 1,338 574 764 0 0100.0 42.9
Percent 100.0 42.9 57.1 0.0 0.0Item First Ignited 1,338 587 751 0 0
100.0 43.9Percent 100.0 43.9 56.1 0.0 0.0
Cause of Ignition 1,338 1,157 181 0 0100.0 86.5
Percent 100.0 86.5 13.5 0.0 0.0Factors Contributing to Ignition 1,338 700 638 0 0
100.0 52.3Percent 100.0 52.3 47.7 0.0 0.0
Equipment Involved in Ignition 1,338 493 35 0 81039.4 36.8
Percent 100.0 36.8 2.6 0.0 60.5Fire Spread 1,338 1,314 0 0 24
98.2 98.2Percent 100.0 98.2 0 0.0 1.8

53The National Fire Incident Reporting System Data Quality
Table 15. Data Element Quality and Usability for Common NFIRS Data Elements Used in USFA Analyses Reported Buildings and Mobile Property Structure Fatal Fires, 2009 to 2011 — continued
Data ElementNumber of Reported
Fires
Number and Percent of Reported FiresQuality Index
Usability IndexValid
KnownValid
Unknowna Invalid Null or No Entry
Presence of Detectors 1,338 780 536 0 2298.4 58.3
Percent 100.0 58.3 40.1 0.0 1.6Detector Operation (when present) 476 312 164 0 0
100.0 65.5Percent 100.0 65.5 34.5 0.0 0.0
Detector Effectiveness (when present and operating) 312 146 76 0 90
71.2 46.8Percent 100.0 46.8 24.4 0.0 28.8
Presence of AES 1,338 1,205 110 0 2398.3 90.1
Percent 100.0 90.1 8.2 0.0 1.7
Source: NFIRS.Note: a.Validunknownentriesarecodedas“U,”“UU”or“UUU”(dependingonthefieldlength).Thesecodedvaluesaredistinctlydifferentfromblanksandnoentriesasthelackof
information only implies that the information was not given and does not imply that the element is truly “unknown.”
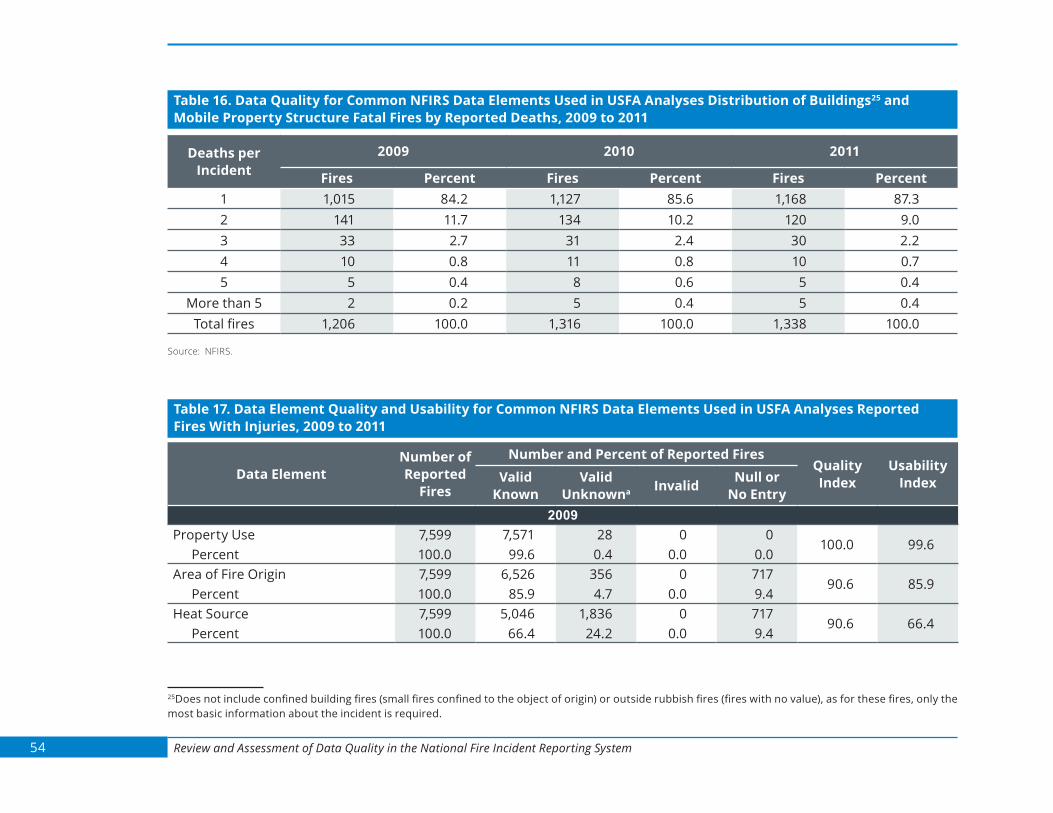
54 Review and Assessment of Data Quality in the National Fire Incident Reporting System
Table 16. Data Quality for Common NFIRS Data Elements Used in USFA Analyses Distribution of Buildings25 and Mobile Property Structure Fatal Fires by Reported Deaths, 2009 to 2011
Deaths per Incident
2009 2010 2011
Fires Percent Fires Percent Fires Percent1 1,015 84.2 1,127 85.6 1,168 87.32 141 11.7 134 10.2 120 9.03 33 2.7 31 2.4 30 2.24 10 0.8 11 0.8 10 0.75 5 0.4 8 0.6 5 0.4
More than 5 2 0.2 5 0.4 5 0.4Total fires 1,206 100.0 1,316 100.0 1,338 100.0
Source: NFIRS.
Table 17. Data Element Quality and Usability for Common NFIRS Data Elements Used in USFA Analyses Reported Fires With Injuries, 2009 to 2011
Data ElementNumber of Reported
Fires
Number and Percent of Reported FiresQuality Index
Usability IndexValid
KnownValid
Unknowna Invalid Null or No Entry
2009Property Use 7,599 7,571 28 0 0
100.0 99.6Percent 100.0 99.6 0.4 0.0 0.0
Area of Fire Origin 7,599 6,526 356 0 71790.6 85.9
Percent 100.0 85.9 4.7 0.0 9.4Heat Source 7,599 5,046 1,836 0 717
90.6 66.4Percent 100.0 66.4 24.2 0.0 9.4
25Does not include confined building fires (small fires confined to the object of origin) or outside rubbish fires (fires with no value), as for these fires, only the most basic information about the incident is required.

55The National Fire Incident Reporting System Data Quality
Table 17. Data Element Quality and Usability for Common NFIRS Data Elements Used in USFA Analyses Reported Fires With Injuries, 2009 to 2011 — continued
Data ElementNumber of Reported
Fires
Number and Percent of Reported FiresQuality Index
Usability IndexValid
KnownValid
Unknowna Invalid Null or No Entry
Item First Ignited 7,599 5,014 1,868 0 71790.6 66.0
Percent 100.0 66.0 24.6 0.0 9.4Cause of Ignition 7,599 6,322 560 0 717
90.6 83.2Percent 100.0 83.2 7.4 0.0 9.4
Factors Contributing to Ignition 7,599 5,419 1,463 0 71790.6 71.3
Percent 100.0 71.3 19.3 0.0 9.4Equipment Involved in Ignition 7,599 3,228 99 0 4,272
43.8 42.5Percent 100.0 42.5 1.3 0.0 56.2
Fire Spread 7,599 5,393 0 0 2,20671.0 71.0
Percent 100.0 71.0 0.0 0.0 29.0Presence of Detectors 7,599 4,139 1,279 0 2,181
71.3 54.5Percent 100.0 54.5 16.8 0.0 28.7
Detector Operation (when present) 2,722 2,187 535 0 0
100.0 80.3Percent 100.0 80.3 19.7 0.0 0.0
Detector Effectiveness (when present and operating) 1,631 1,424 207 0 0
100.0 87.3Percent 100.0 87.3 12.7 0.0 0.0
Presence of AES 7,599 5,219 174 0 2,20671.0 68.7
Percent 100.0 68.7 2.3 0.0 29.02010
Property Use 8,164 8,126 38 0 0100.0 99.5
Percent 100.0 99.5 0.5 0.0 0.0Area of Fire Origin 8,164 7,012 426 0 726
91.1 85.9Percent 100.0 85.9 5.2 0.0 8.9
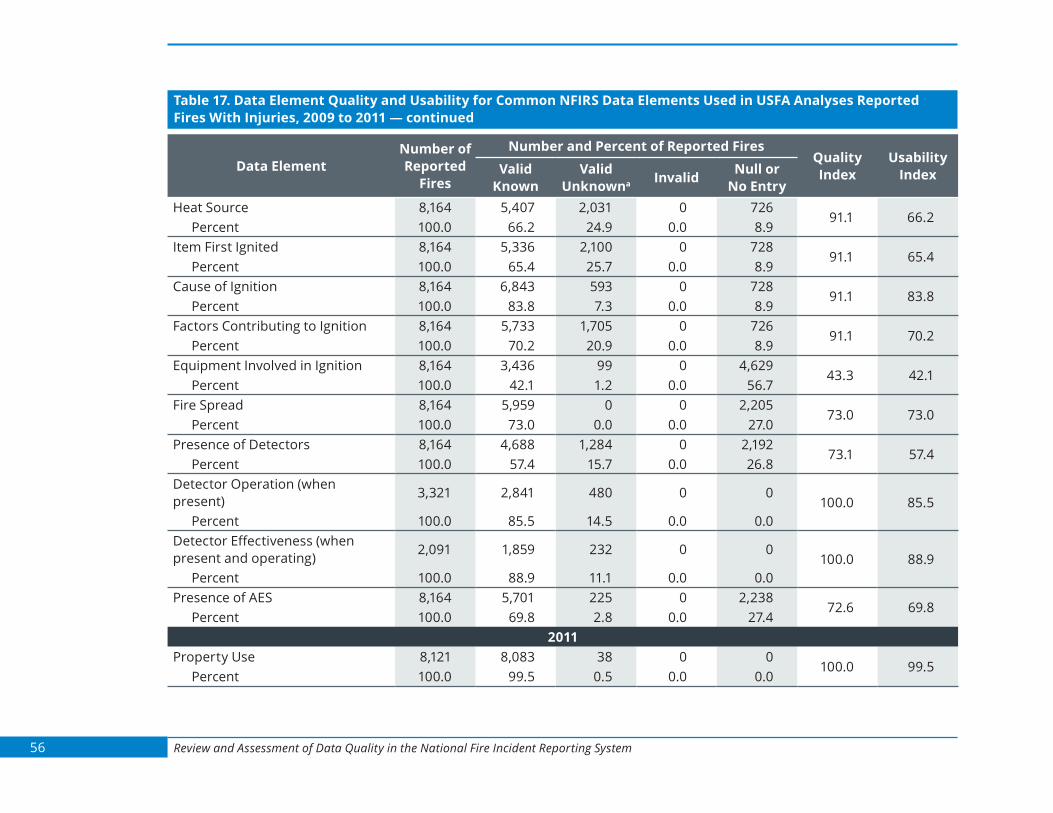
56 Review and Assessment of Data Quality in the National Fire Incident Reporting System
Table 17. Data Element Quality and Usability for Common NFIRS Data Elements Used in USFA Analyses Reported Fires With Injuries, 2009 to 2011 — continued
Data ElementNumber of Reported
Fires
Number and Percent of Reported FiresQuality Index
Usability IndexValid
KnownValid
Unknowna Invalid Null or No Entry
Heat Source 8,164 5,407 2,031 0 72691.1 66.2
Percent 100.0 66.2 24.9 0.0 8.9Item First Ignited 8,164 5,336 2,100 0 728
91.1 65.4Percent 100.0 65.4 25.7 0.0 8.9
Cause of Ignition 8,164 6,843 593 0 72891.1 83.8
Percent 100.0 83.8 7.3 0.0 8.9Factors Contributing to Ignition 8,164 5,733 1,705 0 726
91.1 70.2Percent 100.0 70.2 20.9 0.0 8.9
Equipment Involved in Ignition 8,164 3,436 99 0 4,62943.3 42.1
Percent 100.0 42.1 1.2 0.0 56.7Fire Spread 8,164 5,959 0 0 2,205
73.0 73.0Percent 100.0 73.0 0.0 0.0 27.0
Presence of Detectors 8,164 4,688 1,284 0 2,19273.1 57.4
Percent 100.0 57.4 15.7 0.0 26.8Detector Operation (when present) 3,321 2,841 480 0 0
100.0 85.5Percent 100.0 85.5 14.5 0.0 0.0
Detector Effectiveness (when present and operating) 2,091 1,859 232 0 0
100.0 88.9Percent 100.0 88.9 11.1 0.0 0.0
Presence of AES 8,164 5,701 225 0 2,23872.6 69.8
Percent 100.0 69.8 2.8 0.0 27.42011
Property Use 8,121 8,083 38 0 0100.0 99.5
Percent 100.0 99.5 0.5 0.0 0.0
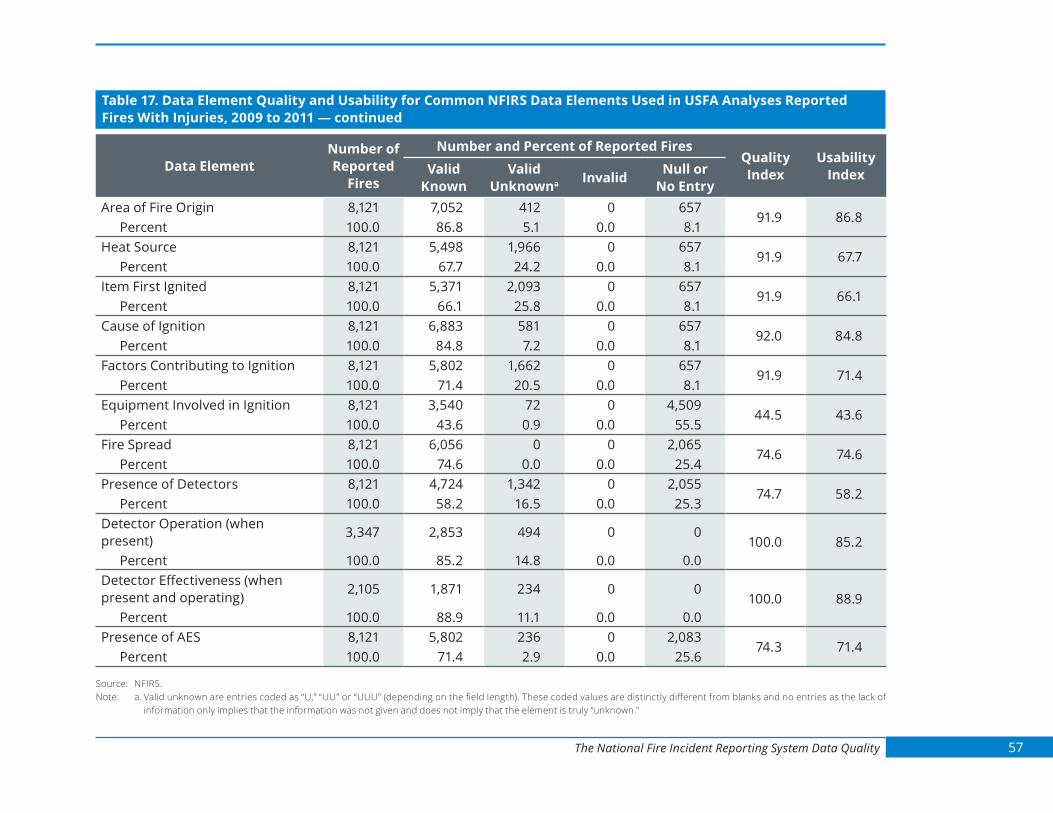
57The National Fire Incident Reporting System Data Quality
Table 17. Data Element Quality and Usability for Common NFIRS Data Elements Used in USFA Analyses Reported Fires With Injuries, 2009 to 2011 — continued
Data ElementNumber of Reported
Fires
Number and Percent of Reported FiresQuality Index
Usability IndexValid
KnownValid
Unknowna Invalid Null or No Entry
Area of Fire Origin 8,121 7,052 412 0 65791.9 86.8
Percent 100.0 86.8 5.1 0.0 8.1Heat Source 8,121 5,498 1,966 0 657
91.9 67.7Percent 100.0 67.7 24.2 0.0 8.1
Item First Ignited 8,121 5,371 2,093 0 65791.9 66.1
Percent 100.0 66.1 25.8 0.0 8.1Cause of Ignition 8,121 6,883 581 0 657
92.0 84.8Percent 100.0 84.8 7.2 0.0 8.1
Factors Contributing to Ignition 8,121 5,802 1,662 0 65791.9 71.4
Percent 100.0 71.4 20.5 0.0 8.1Equipment Involved in Ignition 8,121 3,540 72 0 4,509
44.5 43.6Percent 100.0 43.6 0.9 0.0 55.5
Fire Spread 8,121 6,056 0 0 2,06574.6 74.6
Percent 100.0 74.6 0.0 0.0 25.4Presence of Detectors 8,121 4,724 1,342 0 2,055
74.7 58.2Percent 100.0 58.2 16.5 0.0 25.3
Detector Operation (when present) 3,347 2,853 494 0 0
100.0 85.2Percent 100.0 85.2 14.8 0.0 0.0
Detector Effectiveness (when present and operating) 2,105 1,871 234 0 0
100.0 88.9Percent 100.0 88.9 11.1 0.0 0.0
Presence of AES 8,121 5,802 236 0 2,08374.3 71.4
Percent 100.0 71.4 2.9 0.0 25.6
Source: NFIRS.Note: a.Validunknownareentriescodedas“U,”“UU”or“UUU”(dependingonthefieldlength).Thesecodedvaluesaredistinctlydifferentfromblanksandnoentriesasthelackof
information only implies that the information was not given and does not imply that the element is truly “unknown.”

58 Review and Assessment of Data Quality in the National Fire Incident Reporting System
Table 18. Data Quality for Common NFIRS Data Elements Used in USFA Analyses Distribution of Reported Fires With Injuries by Reported Injuries, 2009 to 2011
Injuries per Incident
2009 2010 2011
Fires Percent Fires Percent Fires Percent1 6,378 83.9 6,763 82.8 6,738 83.02 832 10.9 973 11.9 942 11.63 212 2.8 263 3.2 254 3.14 84 1.1 76 0.9 97 1.25 50 0.7 37 0.5 26 0.3
More than 5 43 0.6 52 0.6 64 0.8Total fires 7,599 100.0 8,164 100.0 8,121 100.0
Source: NFIRS. Note: Total for 2010 does not add up to 100 percent due to rounding.
Table 19. Data Element Quality and Usability for Common NFIRS Data Elements Used in USFA Analyses Reported Buildings26 and Mobile Property Structures Fires With Injuries, 2009 to 2011
Data ElementNumber of Reported
Fires
Number and Percent of Reported FiresQuality Index
Usability IndexValid
KnownValid
Unknowna Invalid Null or No Entry
2009Property Use 5,287 5,268 19 0 0
100.0 99.6Percent 100.0 99.6 0.4 0.0 0.0
Area of Fire Origin 5,287 4,992 295 0 0100.0 94.4
Percent 100.0 94.4 5.6 0.0 0.0Heat Source 5,287 3,795 1,492 0 0
100.0 71.8Percent 100.0 71.8 28.2 0.0 0.0
26Does not include confined building fires (small fires confined to the object of origin) or outside rubbish fires (fires with no value), as for these fires, only the most basic information about the incident is required.

59The National Fire Incident Reporting System Data Quality
Table 19. Data Element Quality and Usability for Common NFIRS Data Elements Used in USFA Analyses Reported Buildings and Mobile Property Structures Fires With Injuries, 2009 to 2011 — continued
Data ElementNumber of Reported
Fires
Number and Percent of Reported FiresQuality Index
Usability IndexValid
KnownValid
Unknowna Invalid Null or No Entry
Item First Ignited 5,287 3,787 1,500 0 0100.0 71.6
Percent 100.0 71.6 28.4 0.0 0.0Cause of Ignition 5,287 4,860 427 0 0
100.0 91.9Percent 100.0 91.9 8.1 0.0 0.0
Factors Contributing to Ignition 5,287 4,076 1,211 0 0100.0 77.1
Percent 100.0 77.1 22.9 0.0 0.0Equipment Involved in Ignition 5,287 2,528 87 0 2,672
49.4 47.8Percent 100.0 47.8 1.6 0.0 50.5
Fire Spread 5,287 5,215 0 0 7298.6 98.6
Percent 100.0 98.6 0.0 0.0 1.4Presence of Detectors 5,287 3,983 1,242 0 62
98.8 75.3Percent 100.0 75.3 23.5 0.0 1.2
Detector Operation (when present)
2,722 2,187 535 0 0100.0 80.3
Percent 100.0 80.3 19.7 0.0 0.0Detector Effectiveness (when present and operating) 1,631 1,424 207 0 0
100.0 87.3Percent 100.0 87.3 12.7 0.0 0.0
Presence of AES 5,287 5,047 161 0 7998.5 95.5
Percent 100.0 95.5 3.0 0.0 1.52010
Property Use 5,759 5,729 30 0 0100.0 99.5
Percent 100.0 99.5 0.5 0.0 0.0Area of Fire Origin 5,759 5,412 347 0 0
100.0 94.0Percent 100.0 94.0 6.0 0.0 0.0

60 Review and Assessment of Data Quality in the National Fire Incident Reporting System
Table 19. Data Element Quality and Usability for Common NFIRS Data Elements Used in USFA Analyses Reported Buildings and Mobile Property Structures Fires With Injuries, 2009 to 2011 — continued
Data ElementNumber of Reported
Fires
Number and Percent of Reported FiresQuality Index
Usability IndexValid
KnownValid
Unknowna Invalid Null or No Entry
Heat Source 5,759 4,112 1,647 0 0100.0 71.4
Percent 100.0 71.4 28.6 0.0 0.0Item First Ignited 5,759 4,068 1,690 0 1
99.9 70.6Percent 100.0 70.6 29.3 0.0 0.0
Cause of Ignition 5,759 5,297 461 0 1100.0 92.0
Percent 100.0 92.0 8.0 0.0 0.0Factors Contributing to Ignition 5,759 4,342 1,417 0 0
100.0 75.4Percent 100.0 75.4 24.6 0.0 0.0
Equipment Involved in Ignition 5,759 2,696 89 0 2,97448.3 46.8
Percent 100.0 46.8 1.5 0.0 51.6Fire Spread 5,759 5,680 0 0 79
98.6 98.6Percent 100.0 98.6 0.0 0.0 1.4
Presence of Detectors 5,759 4,443 1,246 0 7098.7 77.1
Percent 100.0 77.1 21.6 0.0 1.2Detector Operation (when present) 3,123 2,656 467 0 0
100.0 85.0Percent 100.0 85.0 15.0 0.0 0.0
Detector Effectiveness (when present and operating) 1,946 1,718 228 0 0
100.0 88.3Percent 100.0 88.3 11.7 0.0 0.0
Presence of AES 5,759 5,439 213 0 10798.1 94.4
Percent 100.0 94.4 3.7 0.0 1.92011
Property Use 5,852 5,818 34 0 0100.0 99.4
Percent 100.0 99.4 0.6 0.0 0.0

61The National Fire Incident Reporting System Data Quality
Table 19. Data Element Quality and Usability for Common NFIRS Data Elements Used in USFA Analyses Reported Buildings and Mobile Property Structures Fires With Injuries, 2009 to 2011 — continued
Data ElementNumber of Reported
Fires
Number and Percent of Reported FiresQuality Index
Usability IndexValid
KnownValid
Unknowna Invalid Null or No Entry
Area of Fire Origin 5,852 5,518 334 0 0100.0 94.3
Percent 100.0 94.3 5.7 0.0 0.0Heat Source 5,852 4,237 1,615 0 0
100.0 72.4Percent 100.0 72.4 27.6 0.0 0.0
Item First Ignited 5,852 4,164 1,688 0 0100.0 71.2
Percent 100.0 71.2 28.8 0.0 0.0Cause of Ignition 5,852 5,382 470 0 0
100.0 92.0Percent 100.0 92.0 8.0 0.0 0.0
Factors Contributing to Ignition 5,852 4,448 1,404 0 0100.0 76.0
Percent 100.0 76.0 24.0 0.0 0.0Equipment Involved in Ignition 5,852 2,808 69 0 2,975
49.2 48.0Percent 100.0 48.0 1.2 0.0 50.8
Fire Spread 5,852 5,778 0 0 7498.7 98.7
Percent 100.0 98.7 0.0 0.0 1.3Presence of Detectors 5,852 4,492 1,285 0 75
98.8 76.8Percent 100.0 76.8 22.0 0.0 1.3
Detector Operation (when present) 3,154 2,672 482 0 0
100.0 84.7Percent 100.0 84.7 15.3 0.0 0.0
Detector Effectiveness (when present and operating) 1,977 1,750 227 0 0
100.0 88.5Percent 100.0 88.5 11.5 0.0 0.0
Presence of AES 5,852 5,539 216 0 9798.4 94.7
Percent 100.0 94.7 3.7 0.0 1.7
Source: NFIRS.Note: a.Validunknownentriesarecodedas“U,”“UU”or“UUU”(dependingonthefieldlength).Thesecodedvaluesaredistinctlydifferentfromblanksandnoentriesasthelackof
information only implies that the information was not given and does not imply that the element is truly “unknown.”

62 Review and Assessment of Data Quality in the National Fire Incident Reporting System
Table 20. Data Quality for Common NFIRS Data Elements Used in USFA Analyses Distribution of Buildings27 and Mobile Property Structure Fires With Injuries by Reported Injuries, 2009 to 2011
Injuries per Incident
2009 2010 2011
Injuries Percent Injuries Percent Injuries Percent1 4,272 80.8 4,599 79.9 4,690 80.12 672 12.7 785 13.6 764 13.13 184 3.5 224 3.9 227 3.94 76 1.4 71 1.2 90 1.55 42 0.8 34 0.6 24 0.4
More than 5 41 0.8 46 0.8 57 1Total injuries 5,287 100.0 5,759 100.0 5,852 100.0
Source: NFIRS.
27Does not include confined building fires (small fires confined to the object of origin) or outside rubbish fires (fires with no value), as for these fires, only the most basic information about the incident is required.

63The National Fire Incident Reporting System Data Quality
Table 21. Data Element Quality and Usability for Common NFIRS Data Elements Used in USFA Analyses Distribution of Fires With Reported Property Dollar Loss28, 2009 to 2011
Reported Property Dollar Loss
All Fires Nonbuilding Structure
Buildings and Mobile Property
StructureVehicle Outside
Fires Percent Fires Percent Fires Percent Fires Percent Fires Percent2009
No Loss Reported 150,222 26.9 2,720 33.0 30,209 18.1 77,822 33.2 28,475 20.6$0 212,895 38.1 2,289 27.7 33,791 20.2 141,220 60.3 35,595 25.7$100 and under 13,207 2.4 261 3.2 3,777 2.3 6,284 2.7 2,885 2.1$101 - $500 22,530 4.0 627 7.6 9,374 5.6 3,474 1.5 9,055 6.5$501 - $1,000 20,650 3.7 420 5.1 8,620 5.2 1,759 0.8 9,851 7.1$1,001 - $5,000 58,063 10.4 734 8.9 23,317 13.9 2,341 1.0 31,671 22.9$5,001 - $10,000 23,833 4.3 344 4.2 12,772 7.6 554 0.2 10,163 7.3$10,001 - $50,000 39,070 7.0 555 6.7 28,659 17.1 567 0.2 9,289 6.7$50,001 - $100,000 10,560 1.9 187 2.3 9,339 5.6 111 0.0 923 0.7$100,001 - $500,000 7,451 1.3 109 1.3 6,726 4.0 93 0.0 523 0.4$500,001 - $1,000,000 479 0.1 5 0.1 431 0.3 17 0.0 26 0.0Over $1,000,000 272 0.0 3 0.0 234 0.1 16 0.0 19 0.0Total 559,232 100.0 8,254 100.0 167,249 100.0 234,258 100.0 138,475 100.0
2010No Loss Reported 169,177 27.7 2,992 31.9 37,092 19.8 86,943 33.7 42,150 27.1$0 233,837 38.3 2,728 29.1 37,750 20.1 156,731 60.8 36,628 23.6$100 and under 12,776 2.1 315 3.4 4,352 2.3 5,408 2.1 2,701 1.7$101 - $500 23,353 3.8 731 7.8 10,403 5.5 3,490 1.4 8,729 5.6$501 - $1,000 21,971 3.6 508 5.4 9,906 5.3 1,665 0.6 9,892 6.4$1,001 - $5,000 63,488 10.4 905 9.6 26,333 14.0 2,303 0.9 33,947 21.9$5,001 - $10,000 25,562 4.2 330 3.5 13,973 7.4.0 607 0.2 10,652 6.9$10,001 - $50,000 40,729 6.7 586 6.2 30,604 16.3 589 0.2 8,950 5.8
28Does not include confined building fires (small fires confined to the object of origin) or outside rubbish fires (fires with no value).

64 Review and Assessment of Data Quality in the National Fire Incident Reporting System
Table 21. Data Element Quality and Usability for Common NFIRS Data Elements Used in USFA Analyses Distribution of Fires With Reported Property Dollar Loss, 2009 to 2011 - continued
Reported Property Dollar Loss
All Fires Nonbuilding Structure
Buildings and Mobile Property
StructureVehicle Outside
Fires Percent Fires Percent Fires Percent Fires Percent Fires Percent$50,001 - $100,000 11,003 1.8 174 1.9 9,765 5.2 95 0.0 969 0.6$100,001 - $500,000 7,688 1.3 103 1.1 6,895 3.7 95 0.0 595 0.4$500,001 - $1,000,000 507 0.1 4 0.0 461 0.2 15 0.0 27 0.0Over $1,000,000 219 0.0 5 0.1 177 0.1 10 0.0 27 0.0Total 610,310 100.0 9,381 100.0 187,711 100.0 257,951 100.0 155,267 100.0
2011No Loss Reported 173,062 27.8 3,135 31.4 37,331 19.8 92,929 33.9 39,667 26.6$0 244,170 39.2 2,910 29.1 38,763 20.5 166,270 60.6 36,227 24.3$100 and under 12,635 2.0 359 3.6 4,324 2.3 5,497 2.0 2,455 1.6$101 - $500 22,846 3.7 848 8.5 10,531 5.6 3,568 1.3 7,899 5.3$501 - $1,000 21,427 3.4 534 5.3 9,876 5.2 1,909 0.7 9,108 6.1$1,001 - $5,000 63,062 10.1 931 9.3 26,463 14.0 2,575 0.9 33,093 22.2$5,001 - $10,000 25,573 4.1 362 3.6 14,087 7.5 693 0.3 10,431 7.0$10,001 - $50,000 41,009 6.6 594 5.9 30,863 16.3 642 0.2 8,910 6.0$50,001 - $100,000 10,744 1.7 209 2.1 9,486 5.0 140 0.1 909 0.6$100,001 - $500,000 7,344 1.2 104 1.0 6,546 3.5 120 0.0 574 0.4$500,001 - $1,000,000 563 0.1 7 0.1 498 0.3 17 0.0 41 0.0Over $1,000,000 249 0.0 3 0.0 208 0.1 19 0.0 19 0.0Total 622,684 100.0 9,996 100.0 188,976 100.0 274,379 100.0 149,333 100.0
Source: NFIRS. Note: Some totals do not add up to 100 percent due to rounding.

65The National Fire Incident Reporting System Data Quality
Table 22. Data Quality for Common NFIRS Data Elements Used in USFA Analyses Distribution of Fires With Reported Contents Dollar Loss in Buildings and Mobile Property Structure Fires, 2009 to 2011
Reported Contents Dollar Loss
2009 2010 2011Fires Percent Fires Percent Fires Percent
No Loss Reported 30,209 21.2 43,804 23.3 43,576 23.1$0 33,791 30.8 56,606 30.2 58,251 30.8$100 and under 3,777 4.1 7,422 4.0 7,348 3.9$101 - $500 9,374 6.5 12,076 6.4 12,300 6.5$501 - $1,000 8,620 5.7 10,771 5.7 10,952 5.8$1,001 - $5,000 23,317 12.6 23,262 12.4 23,496 12.4$5,001 - $10,000 12,772 6.2 11,151 5.9 10,972 5.8$10,001 - $50,000 28,659 9.9 17,365 9.3 16,918 9.0$50,001 - $100,000 9,339 1.9 3,295 1.8 3,174 1.7$100,001 - $500,000 6,726 1.0 1,703 0.9 1,737 0.9$500,001 - $1,000,000 431 0.1 178 0.1 159 0.1Over $1,000,000 234 0.0 78 0.0 93 0.0Total 167,249 100.0 187,711 100.0 188,976 100.0
Source: NFIRS.

66 Review and Assessment of Data Quality in the National Fire Incident Reporting System
Table 23. Data Element Quality and Usability for Common NFIRS Data Elements Used in USFA Analyses Reported Fire Deaths, 2009 to 2011
Data ElementNumber of Reported
Deaths
Number and Percent of Reported DeathsQuality Index
Usability IndexValid
KnownValid
Unknowna Invalid Null or No Entry
2009Gender 1,831 1,831 0 0 0
100.0 100.0Percent 100.0 100.0 0.0 0.0 0.0
Age or Date of Birthb 1,831 1,788 0 42 197.7 97.7
Percent 100.0 97.7 0.0 2.3 0.1Race 1,831 1,110 73 0 648
64.6 60.6Percent 100.0 60.6 4.0 0.0 35.4
Ethnicity 1,831 786 0 0 1,04542.9 42.9
Percent 100.0 42.9 0.0 0.0 57.1Severity 1,831 1,831 0 0 0
100.0 100.0Percent 100.0 100.0 0.0 0.0 0.0
Cause of Injury 1,831 1,090 234 0 50772.3 59.5
Percent 100.0 59.5 12.8 0.0 27.7Human Factors Contributing to Injury 1,831 994 0 0 837
54.3 54.3Percent 100.0 54.3 0.0 0.0 45.7
Factors Contributing to Injury 1,831 849 2 0 98046.5 46.4
Percent 100.0 46.4 0.1 0.0 53.5Activity When Injured 1,831 601 395 0 835
54.4 32.8Percent 100.0 32.8 21.6 0.0 45.6
Primary Apparent Symptom 1,831 837 169 0 82554.9 45.7
Percent 100.0 45.7 9.2 0.0 45.1Primary Area of Body Injured 1,831 918 0 0 913
50.1 50.1Percent 100.0 50.1 0.0 0.0 49.9

67The National Fire Incident Reporting System Data Quality
Table 23. Data Element Quality and Usability for Common NFIRS Data Elements Used in USFA Analyses Reported Fire Deaths, 2009 to 2011 — continued
Data ElementNumber of Reported
Deaths
Number and Percent of Reported DeathsQuality Index
Usability IndexValid
KnownValid
Unknowna Invalid Null or No Entry
2010Gender 1,978 1,978 0 0 0
100.0 100.0Percent 100.0 100.0 0.0 0.0 0.0
Age or Date of Birthb 1,978 1,949 0 29 098.5 98.5
Percent 100.0 98.5 0.0 1.5 0.0Race 1,978 1,156 77 1 744
62.3 58.4Percent 100.0 58.4 3.9 0.1 37.6
Ethnicity 1,978 779 0 0 1,19939.4 39.4
Percent 100.0 39.4 0.0 0.0 60.6Severity 1,978 1,978 0 0 0
100.0 100.0Percent 100.0 100.0 0.0 0.0 0.0
Cause of Injury 1,978 1,133 253 0 59270.1 57.3
Percent 100.0 57.3 12.8 0.0 29.9Human Factors Contributing to Injury 1,978 1,096 0 0 882
55.4 55.4Percent 100.0 55.4 0.0 0.0 44.6
Factors Contributing to Injury 1,978 949 0 0 1,02948.0 48.0
Percent 100.0 48.0 0.0 0.0 52.0Activity When Injured 1,978 616 453 0 909
54.0 31.1Percent 100.0 31.1 22.9 0.0 46.0
Primary Apparent Symptom 1,978 904 162 0 91253.9 45.7
Percent 100.0 45.7 8.2 0.0 46.1Primary Area of Body Injured 1,978 975 0 0 1,003
49.3 49.3Percent 100.0 49.3 0.0 0.0 50.7

68 Review and Assessment of Data Quality in the National Fire Incident Reporting System
Table 23. Data Element Quality and Usability for Common NFIRS Data Elements Used in USFA Analyses Reported Fire Deaths, 2009 to 2011 — continued
Data ElementNumber of Reported
Deaths
Number and Percent of Reported DeathsQuality Index
Usability IndexValid
KnownValid
Unknowna Invalid Null or No Entry
2011Gender 2,007 2,007 0 0 0
100.0 100.0Percent 100.0 100.0 0.0 0.0 0.0
Age or Date of Birthb 2,007 1,966 0 41 098.0 98.0
Percent 100.0 98.0 0.0 2.0 0.0Race 2,007 1,182 83 1 741
63.0 58.9Percent 100.0 58.9 4.1 0.0 36.9
Ethnicity 2,007 830 0 0 1,17741.4 41.4
Percent 100.0 41.4 0.0 0.0 58.6Severity 2,007 2,007 0 0 0
100.0 100.0Percent 100.0 100.0 0.0 0.0 0.0
Cause of Injury 2,007 1,209 232 0 56671.8 60.2
Percent 100.0 60.2 11.6 0.0 28.2Human Factors Contributing to Injury 2,007 1,072 0 0 935
53.4 53.4Percent 100.0 53.4 0.0 0.0 46.6
Factors Contributing to Injury 2,007 865 0 0 1,14243.1 43.1
Percent 100.0 43.1 0.0 0.0 56.9Activity When Injured 2,007 658 420 0 929
53.7 32.8Percent 100.0 32.8 20.9 0.0 46.3
Primary Apparent Symptom 2,007 903 166 0 93853.3 45.0
Percent 100.0 45.0 8.3 0.0 46.7Primary Area of Body Injured 2,007 959 0 0 1,048
47.8 47.8Percent 100.0 47.8 0.0 0.0 52.2
Source: NFIRS.Notes: a.Validunknownentriesarecodedas“U,”“UU”or“UUU”(dependingonthefieldlength).Thesecodedvaluesaredistinctlydifferentfromblanksandnoentriesasthelackof
information only implies that the information was not given and does not imply that the element is truly “unknown.” b.IntheNFIRSpaperformsandtheNFIRSCRG,thefulldataelementnameisAgeorDateofBirth;inthecivilianfirecasualtyfileinthePDR,thedataelementisAge.

69The National Fire Incident Reporting System Data Quality
Table 24. Data Element Quality and Usability for Common NFIRS Data Elements Used in USFA Analyses Reported Fire Deaths in Buildings29 and Mobile Property Structures, 2009 to 2011
Data ElementNumber of Reported
Deaths
Number and Percent of Reported DeathsQuality Index
Usability IndexValid
KnownValid
Unknowna Invalid Null or No Entry
2009Gender 1,476 1,476 0 0 0
100.0 100.0Percent 100.0 100.0 0.0 0.0 0.0
Age or Date of Birthb 1,476 1,452 0 23 198.4 98.4
Percent 100.0 98.4 0.0 1.6 0.1Race 1,476 936 46 0 494
66.5 63.4Percent 100.0 63.4 3.1 0.0 33.5
Ethnicity 1,476 657 0 0 81944.5 44.5
Percent 100.0 44.5 0.0 0.0 55.5Severity 1,476 1,476 0 0 0
100.0 100.0Percent 100.0 100.0 0.0 0.0 0.0
Cause of Injury 1,476 896 183 0 39773.1 60.7
Percent 100.0 60.7 12.4 0.0 26.9Human Factors Contributing to Injury 1,476 822 0 0 654
55.7 55.7Percent 100.0 55.7 0.0 0.0 44.3
Factors Contributing to Injury 1,476 682 2 0 79246.3 46.2
Percent 100.0 46.2 0.1 0.0 53.7Activity When Injured 1,476 508 322 0 646
56.2 34.4Percent 100.0 34.4 21.8 0.0 43.8
Primary Apparent Symptom 1,476 710 135 0 63157.2 48.1
Percent 100.0 48.1 9.1 0.0 42.8Primary Area of Body Injured 1,476 763 0 0 713
51.7 51.7Percent 100.0 51.7 0.0 0.0 48.3
29Does not include confined building fires (small fires confined to the object of origin) or outside rubbish fires (fires with no value), as for these fires, only the most basic information about the incident is required.

70 Review and Assessment of Data Quality in the National Fire Incident Reporting System
Table 24. Data Element Quality and Usability for Common NFIRS Data Elements Used in USFA Analyses Reported Fire Deaths in Buildings and Mobile Property Structures, 2009 to 2011 — continued
Data ElementNumber of Reported
Deaths
Number and Percent of Reported DeathsQuality Index
Usability IndexValid
KnownValid
Unknowna Invalid Null or No Entry
2010Gender 1,605 1,605 0 0 0
100.0 100.0Percent 100.0 100.0 0.0 0.0 0.0
Age or Date of Birthb 1,605 1,586 0 19 098.8 98.8
Percent 100.0 98.8 0.0 1.2 0.0Race 1,605 992 48 1 564
64.8 61.8Percent 100.0 61.8 3.0 0.1 35.1
Ethnicity 1,605 658 0 0 94741.0 41.0
Percent 100.0 41.0 0.0 0.0 59.0Severity 1,605 1,605 0 0 0
100.0 100.0Percent 100.0 100.0 0.0 0.0 0.0
Cause of Injury 1,605 929 200 0 47670.4 57.9
Percent 100.0 57.9 12.5 0.0 29.7Human Factors Contributing to Injury 1,605 924 0 0 681
57.6 57.6Percent 100.0 57.6 0.0 0.0 42.4
Factors Contributing to Injury 1,605 765 0 0 84047.7 47.7
Percent 100.0 47.7 0.0 0.0 52.3Activity When Injured 1,605 508 374 0 723
55.0 31.7Percent 100.0 31.7 23.3 0.0 45.0
Primary Apparent Symptom 1,605 753 132 0 72055.1 46.9
Percent 100.0 46.9 8.2 0.0 44.9Primary Area of Body Injured 1,605 789 0 0 816
49.2 49.2Percent 100.0 49.2 0.0 0.0 50.8

71The National Fire Incident Reporting System Data Quality
Table 24. Data Element Quality and Usability for Common NFIRS Data Elements Used in USFA Analyses Reported Fire Deaths in Buildings and Mobile Property Structures, 2009 to 2011 — continued
Data ElementNumber of Reported
Deaths
Number and Percent of Reported DeathsQuality Index
Usability IndexValid
KnownValid
Unknowna Invalid Null or No Entry
2011Gender 1,593 1,593 0 0 0
100.0 100.0Percent 100.0 100.0 0.0 0.0 0.0
Age or Date of Birthb 1,593 1,569 0 24 098.5 98.5
Percent 100.0 98.5 0.0 1.5 0.0Race 1,593 994 47 1 551
65.4 62.4Percent 100.0 62.4 3.0 0.1 34.6
Ethnicity 1,593 673 0 0 92042.2 42.2
Percent 100.0 42.2 0.0 0.0 57.8Severity 1,593 1,593 0 0 0
100.0 100.0Percent 100.0 100.0 0.0 0.0 0.0
Cause of Injury 1,593 970 189 0 43472.8 60.9
Percent 100.0 60.9 11.9 0.0 27.2Human Factors Contributing to Injury 1,593 850 0 0 743
53.4 53.4Percent 100.0 53.4 0.0 0.0 46.6
Factors Contributing to Injury 1,593 656 0 0 93741.2 41.2
Percent 100.0 41.2 0.0 0.0 58.8Activity When Injured 1,593 548 330 0 715
55.1 34.4Percent 100.0 34.4 20.7 0.0 44.9
Primary Apparent Symptom 1,593 738 125 0 73054.1 46.3
Percent 100.0 46.3 7.8 0.0 45.8Primary Area of Body Injured 1,593 754 0 0 839
47.3 47.3Percent 100.0 47.3 0.0 0.0 52.7
Source: NFIRS.Notes: a.Validunknownentriesarecodedas“U,”“UU”or“UUU”(dependingonthefieldlength).Thesecodedvaluesaredistinctlydifferentfromblanksandnoentriesasthelackof
information only implies that the information was not given and does not imply that the element is truly “unknown.” b.IntheNFIRSpaperformsandtheNFIRSCRG,thefulldataelementnameisAgeorDateofBirth;inthecivilianfirecasualtyfileinthePDR,thedataelementisAge.

72 Review and Assessment of Data Quality in the National Fire Incident Reporting System
Table 25. Data Element Quality and Usability for Common NFIRS Data Elements Used in USFA Analyses Reported Fire Injuries, 2009 to 2011
Data ElementNumber of Reported Injuries
Number and Percent of Reported InjuriesQuality Index
Usability IndexValid
KnownValid
Unknowna Invalid Null or No Entry
2009Gender 9,582 9,582 0 0 0
100.0 100.0 Percent 100.0 100.0 0.0 0.0 0.0Age or Date of Birthb 9,582 9,357 0 215 10
97.7 97.7 Percent 100.0 97.7 0.0 2.2 0.1Race 9,582 5,241 329 13 3,999
58.1 54.7 Percent 100.0 54.7 3.4 0.1 41.7Ethnicity 9,582 3,792 0 0 5,790
39.6 39.6 Percent 100.0 39.6 0.0 0.0 60.4Severity 9,582 9,204 378 0 0
100.0 96.1 Percent 100.0 96.1 3.9 0.0 00Cause of Injury 9,582 6,955 224 0 2,403
74.9 72.6 Percent 100.0 72.6 2.3 0.0 25.1Human Factors Contributing to Injury 9,582 5,824 0 0 3,758
60.8 60.8 Percent 100.0 60.8 0.0 0.0 39.2Factors Contributing to Injury 9,582 5,003 5 0 4,574
52.3 52.2 Percent 100.0 52.2 0.1 0.0 47.7Activity When Injured 9,582 5,696 679 0 3,207
66.5 59.4 Percent 100.0 59.4 7.1 0.0 33.5Primary Apparent Symptom 9,582 6,101 104 0 3,377
64.8 63.7 Percent 100.0 63.7 1.1 0.0 35.2Primary Area of Body Injured 9,582 5,568 2 0 4,012
58.1 58.1 Percent 100.0 58.1 0.0 0.0 41.9

73The National Fire Incident Reporting System Data Quality
Table 25. Data Element Quality and Usability for Common NFIRS Data Elements Used in USFA Analyses Reported Fire Injuries, 2009 to 2011 — continued
Data ElementNumber of Reported Injuries
Number and Percent of Reported InjuriesQuality Index
Usability IndexValid
KnownValid
Unknowna Invalid Null or No Entry
2010Gender 10,376 10,376 0 0 0
100.0 100.0 Percent 100.0 100.0 0.0 0.0 0.0Age or Date of Birthb 10,376 10,193 0 183 0
98.2 98.2 Percent 100.0 98.2 0.0 1.8 0.0Race 10,376 5,852 373 7 4,144
60.0 56.4 Percent 100.0 56.4 3.6 0.1 39.9Ethnicity 10,376 4,355 0 0 6,021
42.0 42.0 Percent 100.0 42.0 0.0 0.0 58.0Severity 10,376 9,992 384 0 0
100.0 96.3 Percent 100.0 96.3 3.7 0.0 0.0Cause of Injury 10,376 7,624 227 0 2,525
75.7 73.5 Percent 100.0 73.5 2.2 0.0 24.3Human Factors Contributing to Injury 10,376 6,220 0 0 4,156
59.9 59.9 Percent 100.0 59.9 0.0 0.0 40.1Factors Contributing to Injury 10,376 5,204 2 1 5,169
50.2 50.2 Percent 100.0 50.2 0.0 0.0 49.8Activity When Injured 10,376 6,219 783 0 3,374
67.4 59.9 Percent 100.0 59.9 7.5 0.0 32.5Primary Apparent Symptom 10,376 7,018 124 0 3,234
68.8 67.6 Percent 100.0 67.6 1.2 0.0 31.2Primary Area of Body Injured 10,376 6,289 5 0 4,082
60.6 60.6 Percent 100.0 60.6 0.0 0.0 39.3
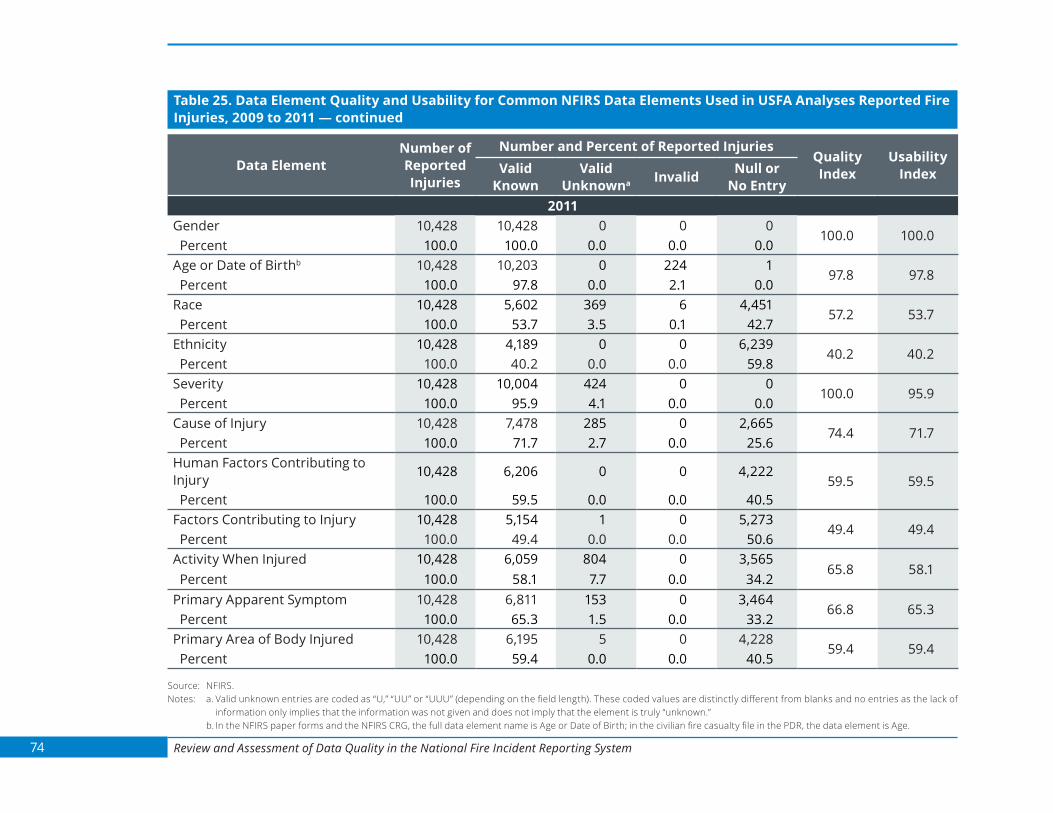
74 Review and Assessment of Data Quality in the National Fire Incident Reporting System
Table 25. Data Element Quality and Usability for Common NFIRS Data Elements Used in USFA Analyses Reported Fire Injuries, 2009 to 2011 — continued
Data ElementNumber of Reported Injuries
Number and Percent of Reported InjuriesQuality Index
Usability IndexValid
KnownValid
Unknowna Invalid Null or No Entry
2011Gender 10,428 10,428 0 0 0
100.0 100.0 Percent 100.0 100.0 0.0 0.0 0.0Age or Date of Birthb 10,428 10,203 0 224 1
97.8 97.8 Percent 100.0 97.8 0.0 2.1 0.0Race 10,428 5,602 369 6 4,451
57.2 53.7 Percent 100.0 53.7 3.5 0.1 42.7Ethnicity 10,428 4,189 0 0 6,239
40.2 40.2 Percent 100.0 40.2 0.0 0.0 59.8Severity 10,428 10,004 424 0 0
100.0 95.9 Percent 100.0 95.9 4.1 0.0 0.0Cause of Injury 10,428 7,478 285 0 2,665
74.4 71.7 Percent 100.0 71.7 2.7 0.0 25.6Human Factors Contributing to Injury 10,428 6,206 0 0 4,222
59.5 59.5 Percent 100.0 59.5 0.0 0.0 40.5Factors Contributing to Injury 10,428 5,154 1 0 5,273
49.4 49.4 Percent 100.0 49.4 0.0 0.0 50.6Activity When Injured 10,428 6,059 804 0 3,565
65.8 58.1 Percent 100.0 58.1 7.7 0.0 34.2Primary Apparent Symptom 10,428 6,811 153 0 3,464
66.8 65.3 Percent 100.0 65.3 1.5 0.0 33.2Primary Area of Body Injured 10,428 6,195 5 0 4,228
59.4 59.4 Percent 100.0 59.4 0.0 0.0 40.5
Source: NFIRS.Notes: a.Validunknownentriesarecodedas“U,”“UU”or“UUU”(dependingonthefieldlength).Thesecodedvaluesaredistinctlydifferentfromblanksandnoentriesasthelackof
information only implies that the information was not given and does not imply that the element is truly “unknown.” b.IntheNFIRSpaperformsandtheNFIRSCRG,thefulldataelementnameisAgeorDateofBirth;inthecivilianfirecasualtyfileinthePDR,thedataelementisAge.
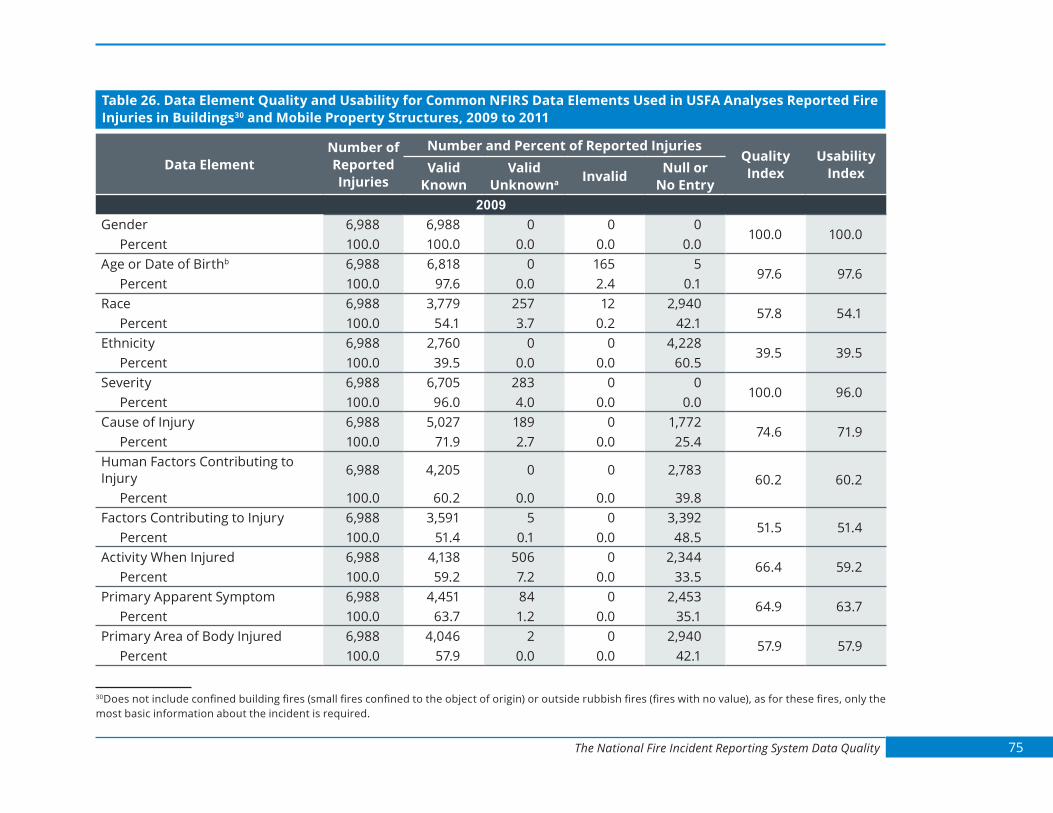
75The National Fire Incident Reporting System Data Quality
Table 26. Data Element Quality and Usability for Common NFIRS Data Elements Used in USFA Analyses Reported Fire Injuries in Buildings30 and Mobile Property Structures, 2009 to 2011
Data ElementNumber of Reported Injuries
Number and Percent of Reported InjuriesQuality Index
Usability IndexValid
KnownValid
Unknowna Invalid Null or No Entry
2009Gender 6,988 6,988 0 0 0
100.0 100.0Percent 100.0 100.0 0.0 0.0 0.0
Age or Date of Birthb 6,988 6,818 0 165 597.6 97.6
Percent 100.0 97.6 0.0 2.4 0.1Race 6,988 3,779 257 12 2,940
57.8 54.1Percent 100.0 54.1 3.7 0.2 42.1
Ethnicity 6,988 2,760 0 0 4,22839.5 39.5
Percent 100.0 39.5 0.0 0.0 60.5Severity 6,988 6,705 283 0 0
100.0 96.0Percent 100.0 96.0 4.0 0.0 0.0
Cause of Injury 6,988 5,027 189 0 1,77274.6 71.9
Percent 100.0 71.9 2.7 0.0 25.4Human Factors Contributing to Injury 6,988 4,205 0 0 2,783
60.2 60.2Percent 100.0 60.2 0.0 0.0 39.8
Factors Contributing to Injury 6,988 3,591 5 0 3,39251.5 51.4
Percent 100.0 51.4 0.1 0.0 48.5Activity When Injured 6,988 4,138 506 0 2,344
66.4 59.2Percent 100.0 59.2 7.2 0.0 33.5
Primary Apparent Symptom 6,988 4,451 84 0 2,45364.9 63.7
Percent 100.0 63.7 1.2 0.0 35.1Primary Area of Body Injured 6,988 4,046 2 0 2,940
57.9 57.9Percent 100.0 57.9 0.0 0.0 42.1
30Does not include confined building fires (small fires confined to the object of origin) or outside rubbish fires (fires with no value), as for these fires, only the most basic information about the incident is required.
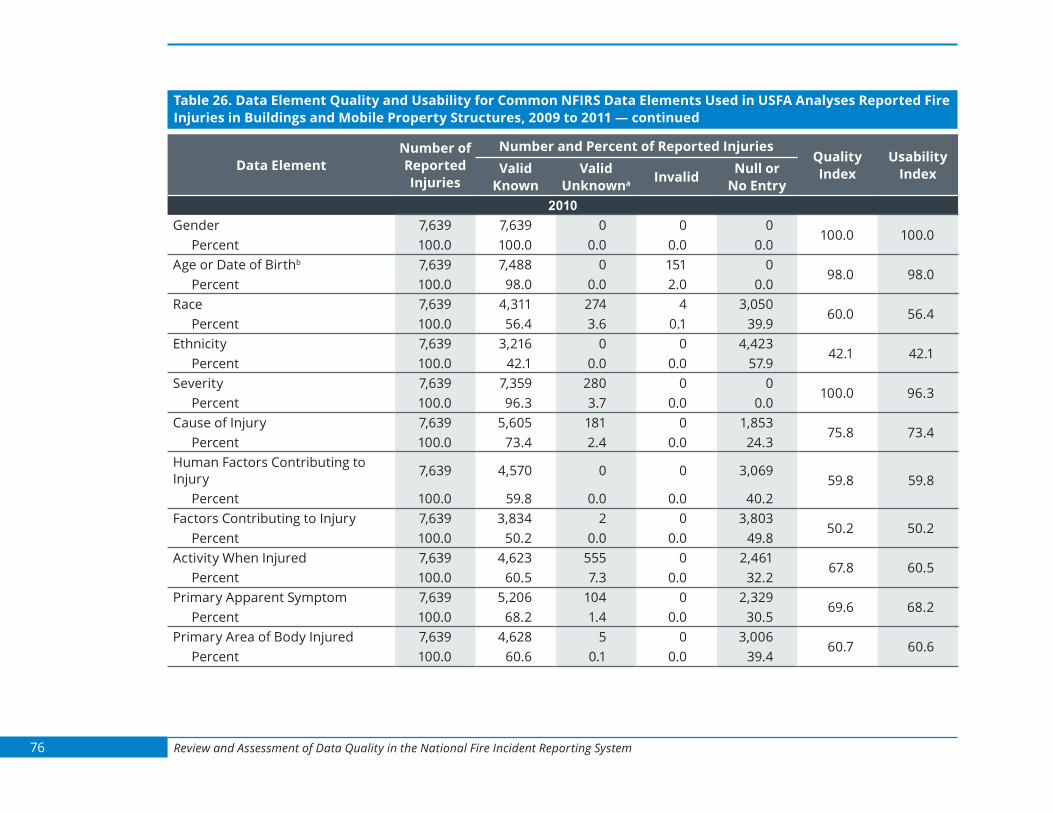
76 Review and Assessment of Data Quality in the National Fire Incident Reporting System
Table 26. Data Element Quality and Usability for Common NFIRS Data Elements Used in USFA Analyses Reported Fire Injuries in Buildings and Mobile Property Structures, 2009 to 2011 — continued
Data ElementNumber of Reported Injuries
Number and Percent of Reported InjuriesQuality Index
Usability IndexValid
KnownValid
Unknowna Invalid Null or No Entry
2010Gender 7,639 7,639 0 0 0
100.0 100.0Percent 100.0 100.0 0.0 0.0 0.0
Age or Date of Birthb 7,639 7,488 0 151 098.0 98.0
Percent 100.0 98.0 0.0 2.0 0.0Race 7,639 4,311 274 4 3,050
60.0 56.4Percent 100.0 56.4 3.6 0.1 39.9
Ethnicity 7,639 3,216 0 0 4,42342.1 42.1
Percent 100.0 42.1 0.0 0.0 57.9Severity 7,639 7,359 280 0 0
100.0 96.3Percent 100.0 96.3 3.7 0.0 0.0
Cause of Injury 7,639 5,605 181 0 1,85375.8 73.4
Percent 100.0 73.4 2.4 0.0 24.3Human Factors Contributing to Injury 7,639 4,570 0 0 3,069
59.8 59.8Percent 100.0 59.8 0.0 0.0 40.2
Factors Contributing to Injury 7,639 3,834 2 0 3,80350.2 50.2
Percent 100.0 50.2 0.0 0.0 49.8Activity When Injured 7,639 4,623 555 0 2,461
67.8 60.5Percent 100.0 60.5 7.3 0.0 32.2
Primary Apparent Symptom 7,639 5,206 104 0 2,32969.6 68.2
Percent 100.0 68.2 1.4 0.0 30.5Primary Area of Body Injured 7,639 4,628 5 0 3,006
60.7 60.6Percent 100.0 60.6 0.1 0.0 39.4

77The National Fire Incident Reporting System Data Quality
Table 26. Data Element Quality and Usability for Common NFIRS Data Elements Used in USFA Analyses Reported Fire Injuries in Buildings and Mobile Property Structures, 2009 to 2011 — continued
Data ElementNumber of Reported Injuries
Number and Percent of Reported InjuriesQuality Index
Usability IndexValid
KnownValid
Unknowna Invalid Null or No Entry
2011Gender 7,853 7,853 0 0 0
100.0 100.0Percent 100.0 100.0 0.0 0.0 0.0
Age or Date of Birthb 7,853 7,682 0 170 197.8 97.8
Percent 100.0 97.8 0.0 2.2 0.0Race 7,853 4,167 280 5 3,401
56.7 53.1Percent 100.0 53.1 3.6 0.1 43.3
Ethnicity 7,853 3,116 0 0 4,73739.7 39.7
Percent 100.0 39.7 0.0 0.0 60.3Severity 7,853 7,514 339 0 0
100.0 95.7Percent 100.0 95.7 4.3 0.0 0.0
Cause of Injury 7,853 5,561 217 0 2,07573.6 70.8
Percent 100.0 70.8 2.8 0.0 26.4Human Factors Contributing to Injury 7,853 4,597 0 0 3,256
58.5 58.5Percent 100.0 58.5 0.0 0.0 41.5
Factors Contributing to Injury 7,853 3,815 1 0 4,03748.6 48.6
Percent 100.0 48.6 0.0 0.0 51.4Activity When Injured 7,853 4,524 582 0 2,747
65.0 57.6Percent 100.0 57.6 7.4 0.0 35.0
Primary Apparent Symptom 7,853 5,061 125 0 2,66766.0 64.4
Percent 100.0 64.4 1.6 0.0 34.0Primary Area of Body Injured 7,853 4,571 5 0 3,277
58.3 58.2Percent 100.0 58.2 0.1 0.0 41.7
Source: NFIRS.Notes: a.Validunknownentriesarecodedas“U,”“UU”or“UUU”(dependingonthefieldlength).Thesecodedvaluesaredistinctlydifferentfromblanksandnoentriesasthelackof
information only implies that the information was not given and does not imply that the element is truly “unknown.” b.IntheNFIRSpaperformsandtheNFIRSCRG,thefulldataelementnameisAgeorDateofBirth;inthecivilianfirecasualtyfileinthePDR,thedataelementisAge.

78 Review and Assessment of Data Quality in the National Fire Incident Reporting System
National Fire Protection Association SurveyThe NFPA is a nongovernmental organization whose mission is “to reduce the worldwide burden of fire and other hazards on the quality of life by providing and advocating consensus codes and standards, research, training and education.” In support of their mission, the NFPA administers the annual National Fire Experience Survey, from which they calculate high-level national estimates of total fires, civilian deaths and injuries, and dollar loss. As described earlier in this report, estimates from the NFPA survey and percentages from the USFA’s NFIRS are combined to portray a richer, more detailed picture of the fire situation in the U.S. This section documents the survey methodology and quality control measures taken by the NFPA to ensure these estimates are as accurate as practicable.
The remainder of this section is drawn from the NFPA’s “Fire Loss in the United States During 2012,” published in September 2013.
Each year, based on a sample survey of fire departments across the country, the NFPA estimates the national fire problem as measured by the number of fires that public fire departments attend and the resulting deaths, injuries and property losses that occur. This section explains the major steps in conducting the 2012 survey.
Sample SelectionThe NFPA currently has 30,145 public fire departments listed in the U.S. in its Fire Service Inventory (FSI) file. Based on desired levels of statistical precision for the survey results and the staff available to process, edit, and follow up on the individual questionnaires, the NFPA determined that 3,000 fire departments was a reasonable number for the 2011 sample. Because of the variation in fire loss results by community size, fire departments were placed in one of the following 10 strata by size of community protected:
1,000,000 and up500,000 to 999,999
250,0000 to 499,999100,000 to 249,999
50,000 to 99,99925,000 to 49,99910,000 to 24,999
5,000 to 9,9992,500 to 4,999Under 2,500
Sample sizes for the individual strata were chosen to ensure the best estimate of civilian deaths in one- and two-family dwellings, the statistic that most aptly reflects the overall severity of the fire problem. All departments that protect 50,000 people or more were included. These 831 departments in the five highest strata protect 153,760,000 people.
A total sample of 2,592 was indicated for the remaining five population strata, assuming response rates similar to the past two years for the five highest strata. Sample sizes for individual strata were calculated using a methodology that assured optimum sample

79National Fire Protection Association Survey
allocations.31 Based on the average variation in civilian deaths in one- and two-family dwellings by stratum for the last two years and on the estimated number of fire departments, appropriate relative sample weights were determined. The corresponding sample sizes by stratum were then calculated. The sample size by stratum was then adjusted based on the response rates from the last two years’ returns. A sample size of 20,385 was found to be necessary to obtain the desired total response of 3,000 fire departments. For all strata, where a sample was necessary, departments were randomly selected.
Data CollectionThe fire departments selected for the survey were sent the 2012 NFPA Fire Experience Questionnaire during the second week of January 2013. A second mailing was sent in mid-March to fire departments that had not responded to the first mailing. A total of 2,795 departments responded to the questionnaire — 2,097 to the first mailing and 698 to the second. There were 676 departments (24 percent) that responded by using the online version of the survey form.
The overall response rate was 14 percent, although response rates were considerably higher for departments protecting larger communities than they were for departments protecting smaller communities. The response rate was 50 percent for departments protecting communities with a population of 50,000 or more, 23 percent for departments protecting communities of 10,000 to 24,999, and 10 percent for departments protecting communities with a population less than 10,000 (which are comprised of mostly volunteers). The 2,795 departments that did respond protect 120,282,500 people, or 39 percent of the total U.S. population.
After the NFPA received the surveys, technical staff members of the Fire Analysis and Research Division reviewed them for completeness and consistency. When appropriate, they followed up on questions with a telephone call. After the review procedures were completed, the survey data were keyed to a computer file, where additional checks were made. The file was then ready for data analysis and estimation procedures.
Estimation MethodologyThe estimation method used for the survey was ratio estimation with stratification by community size.32 For each fire statistic, a sample loss rate was computed for each stratum. This rate consisted of the total for that particular statistic from all fire departments reporting it, divided by the total population protected by the departments reporting the statistic. Note that this means that the departments used in calculating each statistic could be different, reflecting differences in unreported statistics. The sample fire loss rates by stratum were then multiplied by population weighting factors. The estimates were then combined to provide the overall national estimate.
If this method of estimation is to be effective, estimates of the total number of fire departments and the total population protected in each stratum must be accurate. The NFPA makes every effort to ensure that this is the case. The population weights used for the national estimates were developed using the NFPA FSI file and U.S. Census Bureau population estimates.
For each estimate, a corresponding standard error was also calculated. The standard error is a measure of the error caused by the fact that estimates are based on a sampling of fire losses rather than on a complete census of the fire problem. Due to the fact that
31Steve K. Thompson, “Sampling,” John Wiley, New York, NY, 1992, pp. 107-111.32William G. Cochran, “Sampling Techniques,” John Wiley, New York, NY, 1977, pp. 150-161.

80 Review and Assessment of Data Quality in the National Fire Incident Reporting System
the survey is based on a random sample, we can be very confident that the actual value falls within the percentage noted in parentheses for the overall national fire loss statistics: number of fires (2 percent), number of civilian deaths (11.3 percent), number of civilian injuries (5.5 percent), and property loss (3 percent).
The standard error helps in determining whether year-to-year differences are statistically significant. Differences that were found to be statistically significant were so noted in the tables. Property loss estimates are particularly prone to large standard errors because they are sensitive to unusually high losses, and as a result, large percentage differences from year to year may not always be statistically significant. In 2012, for instance, property damage in educational properties was estimated to be $64,000,000. This represented an increase of 35 percent from the year before, but was found not to be statistically significant.
In addition to sampling errors, there are nonsampling errors. These include biases of the survey methodology, incomplete or inaccurate reporting of data to the NFPA, or differences in data collection methods by the responding fire departments. As an example of a nonsampling error, most of the fires included in the survey took place in highly populated, residential areas, because the fire departments selected for the surveys are primarily public fire departments that protect sizable residential populations. Fires that occur in sparsely populated areas protected primarily by state and federal departments of forestry are not likely to be included in the survey results.
The NFPA Fire Incident Data Organization database was also used in conjunction with the annual survey to help identify any large loss fires or deaths that the survey might have missed. The editors of the survey data attempted to verify all reported civilian deaths in vehicle fires. They contacted most of the fire departments that reported fire-related deaths in vehicles and found that many of the deaths were indeed the results of fire. In some instances, however, impact was found to have been the cause of death. This effort can have a considerable impact on the estimates.
The results presented in this report are based on fire incidents attended by public fire departments. No adjustments were made for unreported fires and losses (e.g., fires extinguished by the occupant). Also, no adjustments were made for fires attended solely by private fire brigades (e.g., industry and military installations) or for fires extinguished by fixed suppression systems with no fire department response.
Fire Experience of NonrespondentsA telephone follow-up was made to a sample of nonrespondents to determine whether fire departments that did not respond to the survey experienced fire loss rates similar to those that did respond. This would help the NFPA determine whether we received questionnaires only from departments that had experienced unusually high or low fire losses.
The sample of nonrespondents selected was proportional by state and population of community to the original sample selected for the survey. As a result of these efforts, 155 fire departments were successfully contacted and answered some of the questions about their fire experience.
For communities of 100,000 to 249,999, the rates for respondents and nonrespondents were similar for deaths — the respondent rate was 55 percent higher for civilian deaths, and 102 percent higher for property loss, while the nonrespondent rate was 12 percent higher for fires. The result for property loss was statistically significant.
81National Fire Protection Association Survey
For communities of 50,000 to 99,999, the respondent rate was 61 percent higher for civilian deaths and 45 percent higher for property loss, while the nonrespondent rate was 18 percent higher for fires. The result for property loss was statistically significant.
For communities of 25,000 to 49,999, the respondent rate was 112 percent higher for civilian deaths and 10 percent higher for property loss, while the nonrespondent rate was 48 percent higher for fires. Results for fires and deaths were statistically significant.
For communities of 10,000 to 24,999, the respondent rate was 20 percent higher for civilian deaths and 11 percent higher for property loss, while the nonrespondent rate was 12 percent higher for fires. None of these results were statistically significant.
For communities of 5,000 to 9,999, the nonrespondent rate was 50 percent higher for fires, while the respondent rate was 21 percent higher for property loss. Neither of these results was statistically significant.

82 Review and Assessment of Data Quality in the National Fire Incident Reporting System
ResourcesSeveral resources are available that provide more detailed documentation on the NFIRS system and using the NFIRS data. The “National Fire Incident Reporting System Complete Reference Guide” provides instructions for reporting data to the NFIRS, as well as an understanding of the data elements collected by the system. It also serves as a reference for the coding of the data.
The “National Fire Incident Reporting System Version 5.0 Fire Data Analysis Guidelines and Issues” discusses analytic considerations and methods of analyzing fire incident data using the NFIRS data. The topics include the NFIRS 5.0 data structure, general quality assurance (QA) issues, and definitions and parameters of common fire analyses (e.g., residential structure fires or fires by a specific cause). The methods, techniques and considerations discussed are those used by USFA analysts and do not necessarily reflect methods, techniques and considerations used by fire data analysts from other agencies and organizations. NFIRS data partners may (and do) employ their own methods for analyzing the data and may make differing assumptions when encountering data issues.
The “National Estimates Approach to U.S. Fire Statistics” is the original methodology for creating estimates of the U.S. fire problem using the NFPA annual survey of fire departments and the NFIRS data. The authors present a detailed consensus procedure for such calculations and the supporting rationale. “National Estimates Methodology for Building Fires and Losses” is the USFA’s application of the national estimates approach to building fires and fire losses. It details USFA’s current fire data estimation methodology for all building fires (i.e., residential and nonresidential) and associated losses.
The “USFA Data Sources and Methodology Documentation” provides an in-depth discussion of the data sources and the methodologies used to incorporate this data into fire analyses. The “Fire Data Analysis Handbook” is a resource for those unfamiliar with basic data analysis techniques and their applicability to fire data based analyses.
Lastly, NFIRSGrams, short bulletins that provide coding help to fire department personnel using the NFIRS, address frequently asked questions and common mistakes made when completing incident forms. NFIRSGrams also help NFIRS users to better understand their impact on the quality of the information from the NFIRS at the local, state and national levels.
These resources are listed below:
ĵ Hall, J. & Harwood, B. (1989). The national estimates approach to U.S. fire statistics. Fire Technology, 25(2), 99–113. Retrieved from http://www.nfpa.org/~/media/files/news-and-research/fire-statistics/latest-estimates/nationalestimatesapproach.pdf?la=en
ĵ NFIRSGrams. Retrieved from https://www.usfa.fema.gov/data/nfirs/support/training.html
ĵ USFA. (2004). Fire data analysis handbook, (2nd ed.). Retrieved from https://www.usfa.fema.gov/downloads/pdf/publications/fa-266.pdf
ĵ USFA. (2011). National fire incident reporting system version 5.0 fire data analysis guidelines and issues. Retrieved from https://www.usfa.fema.gov/downloads/pdf/nfirs/ nfirs_data_analysis_guidelines_issues.pdf

83Resources
ĵ USFA. (2012). National estimates methodology for building fires and losses. Retrieved from https://www.usfa.fema.gov/downloads/pdf/statistics/national_estimate_ methodology.pdf
ĵ USFA. (2013). National fire incident reporting system complete reference guide. Retrieved from http://www.nfirs.fema.gov/documentation/reference/
ĵ USFA. (2014). USFA data sources and methodology documentation. Retrieved from https://www.usfa.fema.gov/downloads/pdf/statistics/data_sources_methodology.pdf

84 Review and Assessment of Data Quality in the National Fire Incident Reporting System
AcronymsAES Automatic Extinguishing System
CPSC Consumer Product Safety Commission
CRG Complete Reference Guide
DEBI Data Entry Browser Interface
EMS Emergency Medical Services
FSI Fire Service Inventory
NASFM National Association of State Fire Marshals
NFA National Fire Academy
NFDC National Fire Data Center
NFIRS National Fire Incident Reporting System
NFPA National Fire Protection Association
OMB Office of Management and Budget
PDR Public Data Release
PRA Paperwork Reduction Act
USFA U.S. Fire Administration