review article evaluating alpha and beta taxonomy in ant
TRANSCRIPT

Hindawi Publishing CorporationPsycheVolume 2013, Article ID 736939, 10 pageshttp://dx.doi.org/10.1155/2013/736939
Review ArticleEvaluating Alpha and Beta Taxonomy in Ant-Nest Beetles(Coleoptera, Carabidae, Paussini)
Simone Fattorini,1,2 Emanuela Maurizi,3 and Andrea Di Giulio3
1 Water Ecology Team, Department of Biotechnology and Biosciences, University of Milano Bicocca, Piazza della Scienza 2,20126 Milan, Italy
2 Azorean Biodiversity Group (ABG, CITA-A) and Portuguese Platform for Enhancing Ecological Research & Sustainability (PEERS),University of the Azores, Rua Capitao Joao de Avila, 9700-042 Angra do Heroısmo, Portugal
3 Department of Sciences, University of Roma Tre, Viale G. Marconi 446, 00146 Rome, Italy
Correspondence should be addressed to Andrea Di Giulio; [email protected]
Received 7 March 2013; Accepted 24 April 2013
Academic Editor: Alain Lenoir
Copyright © 2013 Simone Fattorini et al. This is an open access article distributed under the Creative Commons AttributionLicense, which permits unrestricted use, distribution, and reproduction in any medium, provided the original work is properlycited.
We evaluated completeness, accuracy, and historical trend of the taxonomic knowledge on the myrmecophilous ground beetletribe Paussini (Coleoptera, Carabidae, Paussinae). Accumulation curves for valid names and synonyms of species, subgenera, andgenera were modelled using logistic functions. Analyses of trends in synonymies suggest that few currently accepted taxa will berecognized to be synonymous in the future. This may indicate that Paussini are a taxonomically relatively stable tribe of carabidbeetles. However, this result might also be due to the lack of recent taxonomic work in some biogeographical regions.
1. Introduction
Arthropods are the most diversified animal group [1, 2].Although it is widely acknowledged that only a small frac-tion of the extant arthropod species has been described,the magnitude of the so-called Linnean shortfall (i.e., thediscrepancy between the number of described species and thenumber of living species) is a matter of discussion [2]. Alsofor relatively well-investigated arthropod groups, there is fewinformation about the quality of the taxonomic knowledge [3,4]. The most basic question is to establish how complete andaccurate the taxonomic status of a given group is. With theword completeness we refer here to the problem whether thespecies list of a given group can be considered fairly completeor if there are still many species to describe. A completelyknown group is one for which there is no longer a needof an alpha taxonomic work (the discovering and namingof new species [5]). With accuracy we refer to taxonomicstability. An accurately known group is one for which thereis no more need of a beta taxonomic work (the study of therelationships between the already described taxa, throughsystematic revisional work of higher taxa [5]). Because it
is not rare that species are redundantly described underdifferent names (i.e., synonyms), a group is known withaccuracy when no relevant taxonomic change is expected.
Although the two aspects tend to be interrelated, they arenot necessarily redundant, because revisional works aremuchrarer than descriptions of new taxa.
In this paper, we evaluated the completeness and accuracyof the taxonomic knowledge about a group of myrme-cophilous beetles, the tribe Paussini (“ant-nest beetles”) ofthe family Carabidae (Coleoptera, Adephaga, Paussinae), ata global level.
All Paussini are highly specialized social parasites,depending on ants (mainly associated with Myrmicinaeand Formicinae) during any stage of their development[6–9]. Adults prey on ants and their broods without anyobvious benefit for the ant colonies [10–15]. Because oftheir specialised behavioural andmorphological adaptations,Paussini have long attracted the interest of entomologistsworking on myrmecophilous insects [13], and they havebeen recently into focus because of strong incertitude abouttheir relationships with other Paussinae lineages [6, 7]. Thesestudies have prompted our knowledge of Paussini biology,

2 Psyche
20406080
100120140
1770
–177
9
1790
–179
9
1810
–181
9
1830
–183
9
1850
–185
9
1870
–187
9
1890
–189
9
1910
–191
9
1930
–193
9
1950
–195
9
1970
–197
9
1990
–199
9
0
(a)
0100200300400500600700800 𝑦 = 767.876/[1 + exp(−0.381𝑥 + 5.473)]
𝑅2 = 0.998
1770
–177
9
1790
–179
9
1810
–181
9
1830
–183
9
1850
–185
9
1870
–187
9
1890
–189
9
1910
–191
9
1930
–193
9
1950
–195
9
1970
–197
9
1990
–199
9
(b)
0102030405060708090
100
1770
–177
9
1790
–179
9
1810
–181
9
1830
–183
9
1850
–185
9
1870
–187
9
1890
–189
9
1910
–191
9
1930
–193
9
1950
–195
9
1970
–197
9
1990
–199
9
(c)
0100200300400500600700 𝑦 = 594.907/[1 + exp(−0.362𝑥 + 5.23)]
𝑅2 = 0.998
1770
–177
9
1790
–179
9
1810
–181
9
1830
–183
9
1850
–185
9
1870
–187
9
1890
–189
9
1910
–191
9
1930
–193
9
1950
–195
9
1970
–197
9
1990
–199
9
(d)
05
1015202530354045
1770
–177
9
1790
–179
9
1810
–181
9
1830
–183
9
1850
–185
9
1870
–187
9
1890
–189
9
1910
–191
9
1930
–193
9
1950
–195
9
1970
–197
9
1990
–199
9
(e)
020406080
100120140160180 𝑦 = 156.254/[1 + exp(−0.433𝑥 + 6.171)]
𝑅2 = 0.994
1770
–177
9
1790
–179
9
1810
–181
9
1830
–183
9
1850
–185
9
1870
–187
9
1890
–189
9
1910
–191
9
1930
–193
9
1950
–195
9
1970
–197
9
1990
–199
9(f)
Figure 1: Numbers of total described taxa (a, b), valid species (c, d), and synonyms (e, f) of Paussini by decade. Figures (a), (c), and (e) reportthe absolute numbers, and Figures (b), (d), and (f) the cumulative numbers along with the equations of the fitted curves.
with emphasis on their immature stages and microscopicmorphology, but taxonomical work seems to receive littleattention.
In general, for assessing the status of the taxonomicalprocess in a given group, the study should be addressedto describe (1) the growth through time of the cumulativenumber of valid names to estimate the number of speciesthat remain to be discovered in a given taxonomic group,globally or regionally [4, 16–19], (2) the progression of thecumulative number of invalid names (synonyms), and (3)the temporal trends in the proportion of synonyms [20, 21].Presence of a plateau is considered evidence that no, or few,species remain to be described, but it can be also due to astop in taxonomic research [22]. In this paper we presentan extension and continuation of a recently published study[22] where we have presented a comprehensive treatmentof point 1. In the present paper we will treat the additional
aspects of points 2 and 3 taking advantage of the statisticalmethodologies developed in the former paper.
2. Material and Methods
2.1. Data Collection. We used a computerized databaseincluding 572 species and 17 subspecies of the tribe Paussini.
The following information was recorded for each speciesand subspecies: generic assignment, subgeneric assignment,author, year of description, synonyms, and the biogeo-graphical region of species distribution. We also recordedauthorship and year of description of genera (see [22] fordetails).
2.2. Historical Accumulation Curves of Valid Names andSynonyms. We extracted the year of description of all valid
Psyche 3
0
5
10
15
20
25
30
35
40
45
0 50 100 150Number of described taxa
Num
ber o
f syn
onym
s
𝑦 = 0.23𝑥
𝑅2 = 0.767
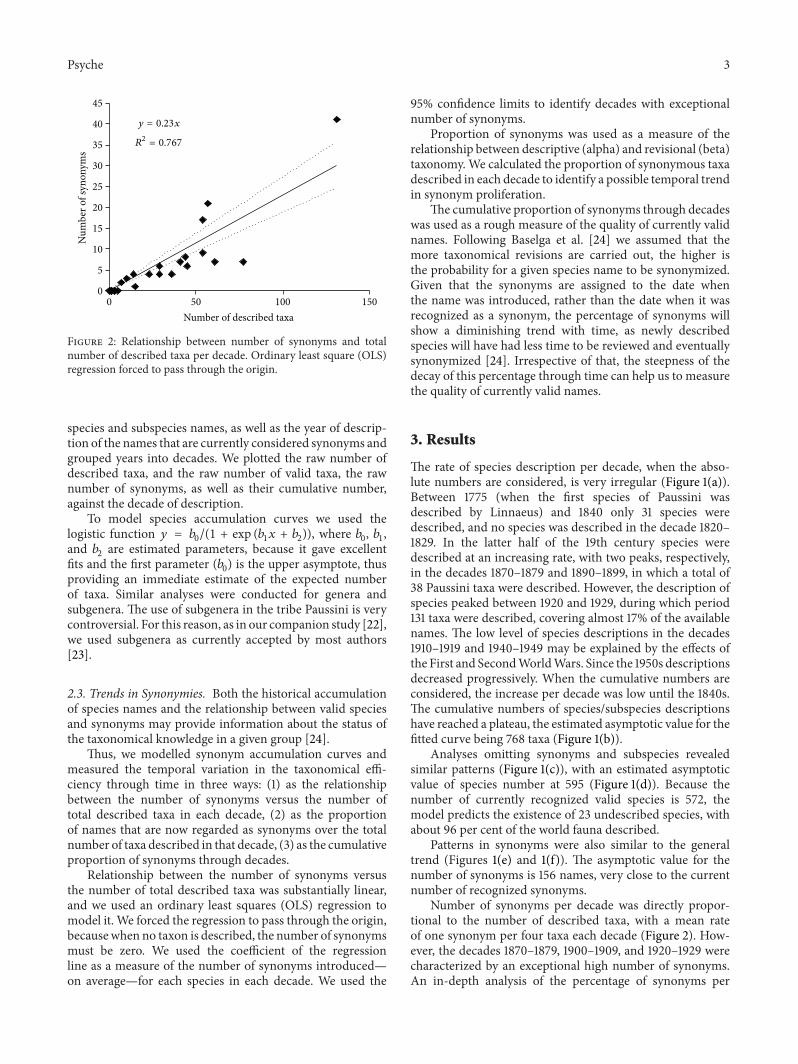
Figure 2: Relationship between number of synonyms and totalnumber of described taxa per decade. Ordinary least square (OLS)regression forced to pass through the origin.
species and subspecies names, as well as the year of descrip-tion of the names that are currently considered synonyms andgrouped years into decades. We plotted the raw number ofdescribed taxa, and the raw number of valid taxa, the rawnumber of synonyms, as well as their cumulative number,against the decade of description.
To model species accumulation curves we used thelogistic function 𝑦 = 𝑏
0/(1 + exp (𝑏
1𝑥 + 𝑏2)), where 𝑏
0, 𝑏1,
and 𝑏2are estimated parameters, because it gave excellent
fits and the first parameter (𝑏0) is the upper asymptote, thus
providing an immediate estimate of the expected numberof taxa. Similar analyses were conducted for genera andsubgenera. The use of subgenera in the tribe Paussini is verycontroversial. For this reason, as in our companion study [22],we used subgenera as currently accepted by most authors[23].
2.3. Trends in Synonymies. Both the historical accumulationof species names and the relationship between valid speciesand synonyms may provide information about the status ofthe taxonomical knowledge in a given group [24].
Thus, we modelled synonym accumulation curves andmeasured the temporal variation in the taxonomical effi-ciency through time in three ways: (1) as the relationshipbetween the number of synonyms versus the number oftotal described taxa in each decade, (2) as the proportionof names that are now regarded as synonyms over the totalnumber of taxa described in that decade, (3) as the cumulativeproportion of synonyms through decades.
Relationship between the number of synonyms versusthe number of total described taxa was substantially linear,and we used an ordinary least squares (OLS) regression tomodel it. We forced the regression to pass through the origin,becausewhen no taxon is described, the number of synonymsmust be zero. We used the coefficient of the regressionline as a measure of the number of synonyms introduced—on average—for each species in each decade. We used the
95% confidence limits to identify decades with exceptionalnumber of synonyms.
Proportion of synonyms was used as a measure of therelationship between descriptive (alpha) and revisional (beta)taxonomy.We calculated the proportion of synonymous taxadescribed in each decade to identify a possible temporal trendin synonym proliferation.
The cumulative proportion of synonyms through decadeswas used as a rough measure of the quality of currently validnames. Following Baselga et al. [24] we assumed that themore taxonomical revisions are carried out, the higher isthe probability for a given species name to be synonymized.Given that the synonyms are assigned to the date whenthe name was introduced, rather than the date when it wasrecognized as a synonym, the percentage of synonyms willshow a diminishing trend with time, as newly describedspecies will have had less time to be reviewed and eventuallysynonymized [24]. Irrespective of that, the steepness of thedecay of this percentage through time can help us to measurethe quality of currently valid names.
3. Results
The rate of species description per decade, when the abso-lute numbers are considered, is very irregular (Figure 1(a)).Between 1775 (when the first species of Paussini wasdescribed by Linnaeus) and 1840 only 31 species weredescribed, and no species was described in the decade 1820–1829. In the latter half of the 19th century species weredescribed at an increasing rate, with two peaks, respectively,in the decades 1870–1879 and 1890–1899, in which a total of38 Paussini taxa were described. However, the description ofspecies peaked between 1920 and 1929, during which period131 taxa were described, covering almost 17% of the availablenames. The low level of species descriptions in the decades1910–1919 and 1940–1949 may be explained by the effects ofthe First and SecondWorldWars. Since the 1950s descriptionsdecreased progressively. When the cumulative numbers areconsidered, the increase per decade was low until the 1840s.The cumulative numbers of species/subspecies descriptionshave reached a plateau, the estimated asymptotic value for thefitted curve being 768 taxa (Figure 1(b)).
Analyses omitting synonyms and subspecies revealedsimilar patterns (Figure 1(c)), with an estimated asymptoticvalue of species number at 595 (Figure 1(d)). Because thenumber of currently recognized valid species is 572, themodel predicts the existence of 23 undescribed species, withabout 96 per cent of the world fauna described.
Patterns in synonyms were also similar to the generaltrend (Figures 1(e) and 1(f)). The asymptotic value for thenumber of synonyms is 156 names, very close to the currentnumber of recognized synonyms.
Number of synonyms per decade was directly propor-tional to the number of described taxa, with a mean rateof one synonym per four taxa each decade (Figure 2). How-ever, the decades 1870–1879, 1900–1909, and 1920–1929 werecharacterized by an exceptional high number of synonyms.An in-depth analysis of the percentage of synonyms per

4 Psyche
0
5
10
15
20
25
30
35
40Ta
xa re
cogn
ized
as sy
nony
mou
s (%
)
1770
–177
9
1790
–179
9
1810
–181
9
1830
–183
9
1850
–185
9
1870
–187
9
1890
–189
9
1910
–191
9
1930
–193
9
1950
–195
9
1970
–197
9
1990
–199
9(a)
0
5
10
15
20
25
Cum
ulat
ive p
ropo
rtio
n of
syno
nym
s
1770
–177
9
1790
–179
9
1810
–181
9
1830
–183
9
1850
–185
9
1870
–187
9
1890
–189
9
1910
–191
9
1930
–193
9
1950
–195
9
1970
–197
9
1990
–199
9
(b)
Figure 3: Percentages of synonymous taxa described in each decade (a) and their historical process of accumulation (b).
050
100150200250300350400
Africa Australia Oriental Palaearctic Neotropics
(a)
05
10152025303540
Africa Australia Oriental Palaearctic Neotropics
(b)
Figure 4: Number of valid species of Paussini per biogeographical region (a) and percentage of synonymous taxa of Paussini perbiogeographical region (b).
05
1015202530354045
1 2 4 3 6 10 11 5 18 19 20 21 52 71 73 79 88Number of species
Num
ber o
f aut
hors
Figure 5: Number of authors in relation to the numbers of speciesof Paussini that they described.
decade shows a roughly humped trend, with proportionof synonymous taxa increasing from 1830–1849 to 1870–1879, and then decreasing to very low values (Figure 3(a)),which determines a plateau in the accumulation curve ofsynonymies (Figure 3(b)).
The historical process of variation in proportion ofsynonymized names defines the following time spans that
correspond to periods of roughly homogenous taxonomicalwork (Figure 3(a)): (1) the very early stage was obviouslycharacterized by few descriptions (cf. Figure 1) which arestill valid species; (2) the relative rate of redescriptions wasnearly constant between 1800 and 1870; (3) between 1870and 1930 we found that at increasing description of speciesthere was also an increasing number of species subsequentlyfound to be synonymous; and (4) finally, from 1930 topresent time, the relative rate of descriptions subsequentlysynonymized diminishes drastically, as less than 20% of thespecies described during this period have been synonymized(Figure 3(b)).
The largest numbers of described species occur in Africa,followed by theOriental andAustralian regions (Figure 4(a)).This pattern is not paralleled by proportion of synonymies,with the Australian fauna being that with the highest percent-age of synonymized taxa (Figure 4(b)).
The distribution of the numbers of authors that havedescribed Paussini taxa is strongly right-skewed (Figure 5).Over 52% of authors have described only one species.The most productive author, Reichensperger, described 88
Psyche 5
02468
101214
1770
–177
9
1790
–179
9
1810
–181
9
1830
–183
9
1850
–185
9
1870
–187
9
1890
–189
9
1910
–191
9
1930
–193
9
1950
–195
9
1970
–197
9
1990
–199
9
(a)
0
10
20
30
40
50
60
1770
–177
917
90–1
799
1810
–181
918
30–1
839
1850
–185
918
70–1
879
1890
–189
919
10–1
919
1930
–193
919
50–1
959
1970
–197
919
90–1
999
𝑦 = 55.443/[1 + exp(−0.270𝑥 + 3.52)]𝑅2 = 0.979
(b)
00.5
11.5
22.5
33.5
44.5
1770
–177
9
1790
–179
9
1810
–181
9
1830
–183
9
1850
–185
9
1870
–187
9
1890
–189
9
1910
–191
9
1930
–193
9
1950
–195
9
1970
–197
9
1990
–199
9
(c)
0
5
10
15
20
25
1770
–177
917
90–1
799
1810
–181
918
30–1
839
1850
–185
918
70–1
879
1890
–189
919
10–1
919
1930
–193
919
50–1
959
1970
–197
919
90–1
999
𝑅2 = 0.981
𝑦 = 24.03/[1 + exp(−0.258𝑥 + 2.941)]
(d)
0123456789
10
1770
–177
9
1790
–179
9
1810
–181
9
1830
–183
9
1850
–185
9
1870
–187
9
1890
–189
9
1910
–191
9
1930
–193
9
1950
–195
9
1970
–197
9
1990
–199
9
(e)
0
5
10
15
20
25
30
35
1770
–177
917
90–1
799
1810
–181
918
30–1
839
1850
–185
918
70–1
879
1890
–189
919
10–1
919
1930
–193
919
50–1
959
1970
–197
919
90–1
999
𝑦 = 30.532/[1 + exp(−0.315𝑥 + 4.39)]𝑅2 = 0.971
(f)
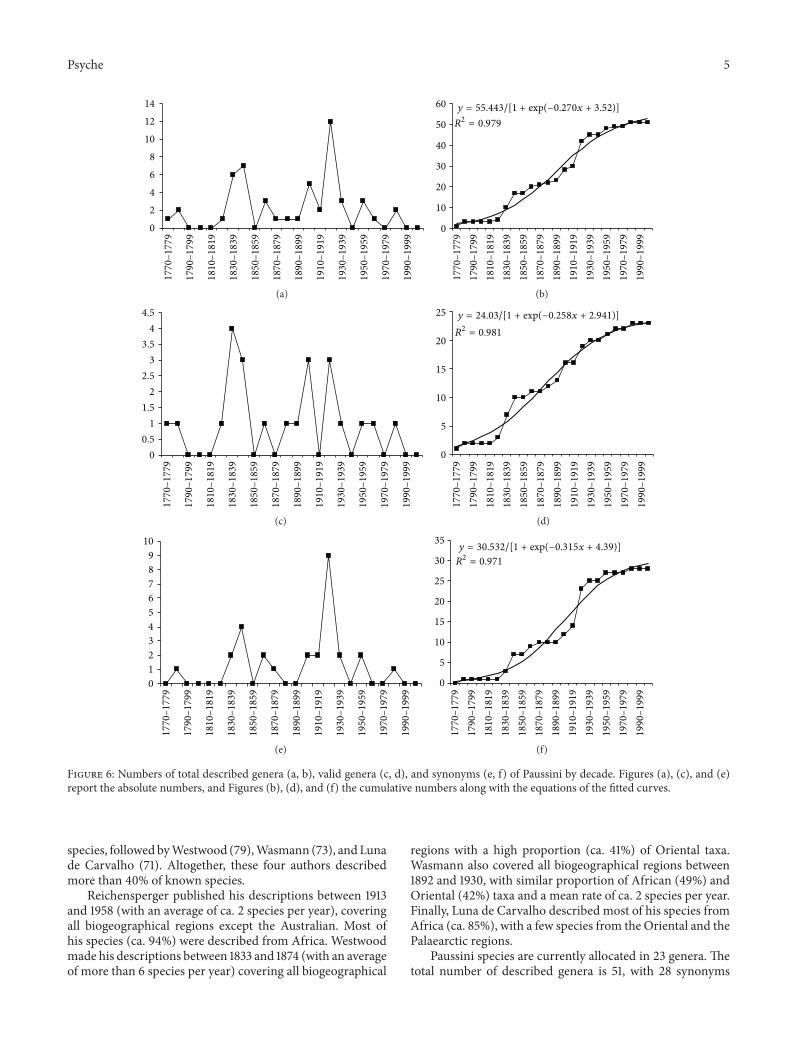
Figure 6: Numbers of total described genera (a, b), valid genera (c, d), and synonyms (e, f) of Paussini by decade. Figures (a), (c), and (e)report the absolute numbers, and Figures (b), (d), and (f) the cumulative numbers along with the equations of the fitted curves.
species, followed byWestwood (79),Wasmann (73), andLunade Carvalho (71). Altogether, these four authors describedmore than 40% of known species.
Reichensperger published his descriptions between 1913and 1958 (with an average of ca. 2 species per year), coveringall biogeographical regions except the Australian. Most ofhis species (ca. 94%) were described from Africa. Westwoodmade his descriptions between 1833 and 1874 (with an averageof more than 6 species per year) covering all biogeographical
regions with a high proportion (ca. 41%) of Oriental taxa.Wasmann also covered all biogeographical regions between1892 and 1930, with similar proportion of African (49%) andOriental (42%) taxa and a mean rate of ca. 2 species per year.Finally, Luna de Carvalho described most of his species fromAfrica (ca. 85%), with a few species from the Oriental and thePalaearctic regions.
Paussini species are currently allocated in 23 genera. Thetotal number of described genera is 51, with 28 synonyms

6 Psyche
0
20
40
60
80
100
120G
ener
a rec
ogni
zed
as sy
nony
mou
s (%
)
1770
–177
9
1790
–179
9
1810
–181
9
1830
–183
9
1850
–185
9
1870
–187
9
1890
–189
9
1910
–191
9
1930
–193
9
1950
–195
9
1970
–197
9
1990
–199
9(a)
0
10
20
30
40
50
60
Cum
ulat
ive p
ropo
rtio
n of
syno
nym
s
1770
–177
9
1790
–179
9
1810
–181
9
1830
–183
9
1850
–185
9
1870
–187
9
1890
–189
9
1910
–191
9
1930
–193
9
1950
–195
9
1970
–197
9
1990
–199
9
(b)
Figure 7: Percentage of synonymous genera described in each decade (a) and their historical process of accumulation (b).
(55%).Most of the genera were described in the decade 1920–1929 (Figure 6(a)). Although some decades were character-ized by a high number of descriptions of genera, many wererecognized as synonyms (especially among those describedin the decade 1920–1929) (Figure 6(e)), so the decade withthe highest number of valid genera (4 genera) was 1830–1839 (Figure 6(c)): 75% of the genera described in the decade1920–1929, and 50% of those described in 1980–1989, weresubsequently recognized as synonyms.
Patterns of genera accumulation through time indicatea good sigmoid shape for the total number of species(Figure 6(b)), valid genera (Figure 6(d)), and synonyms(Figure 6(f)). In all cases, a plateau has been reached, sovirtually no new genus is expected for the future. Thehistorical process of variation in proportion of synonymizedgenera indicates that after the 1930s there is a substantialstabilization (Figure 7).
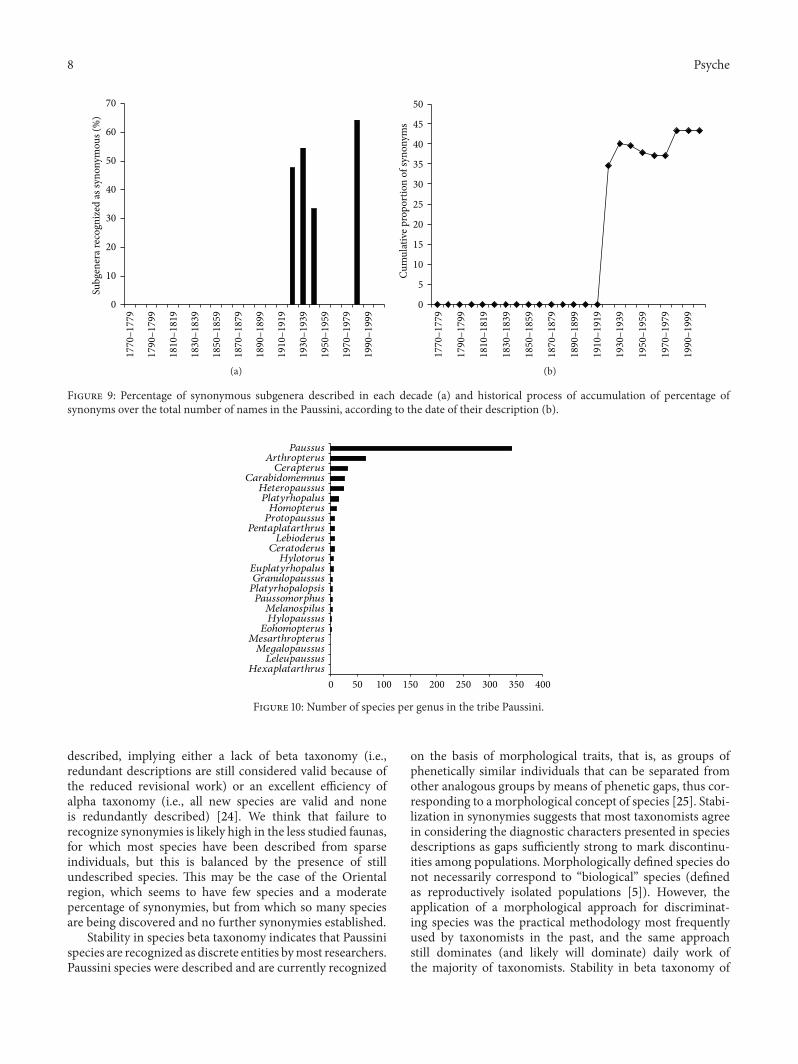
The study of subgenera indicates a proliferation of namesin the periods 1920–1929 and 1980–1989 as for the genera(Figure 8). Although these were the two decades whichmostly contributed to the current accepted subgenera, thesewere also the decades inwhich a large number of synonymoussubgenera were described, with proportions of synonyms ofmore than 54% and 64%, respectively. Accumulation curvesshowed a stair shape pattern, with apparent plateaus, andwere therefore not modelled with fitting curves (Figure 8).Moreover, the historical process of variation in proportionof synonymized genera indicates that there is no substantialstabilization (Figure 9). This was mostly due to the largenumber of subgenera proposed in a recent time (1980–1989)and subsequently synonymized (Figure 9). These patternssuggest that subdivision into subgenera is not reaching adefinitive solution.
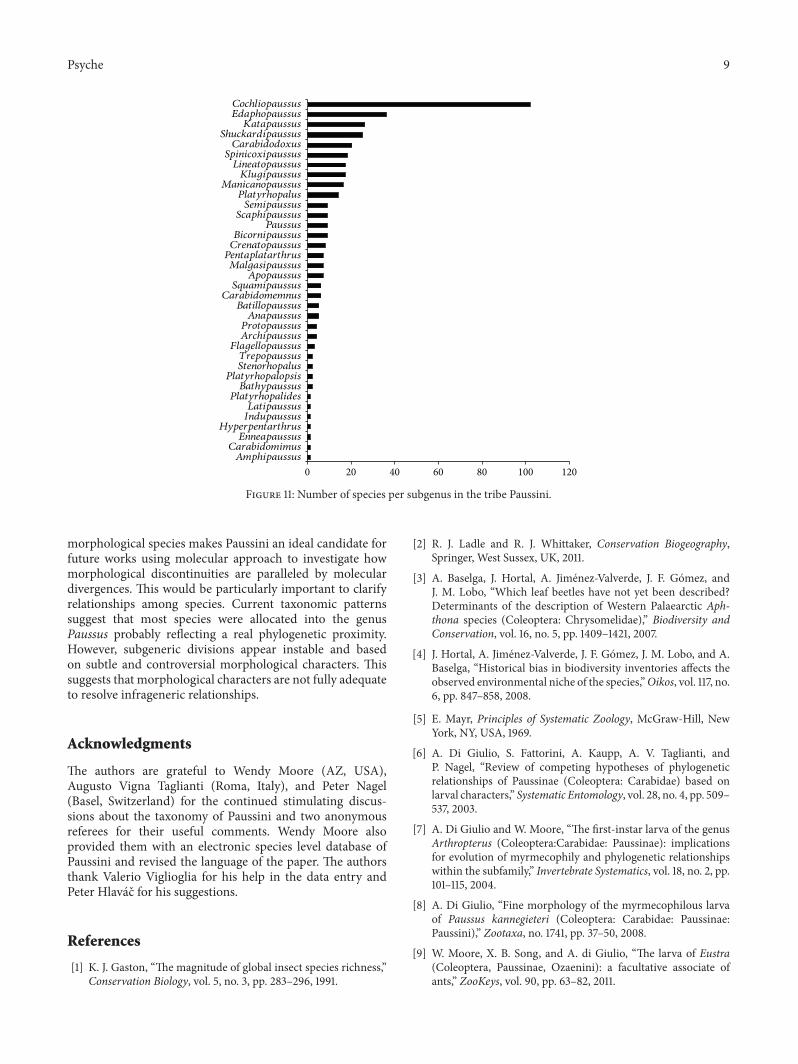
Species allocation among genera is strongly dominatedby the richest genus (Paussus), with 342 ascribed species(Figure 10) and 25 subgenera. Species distribution amongsubgenera is also very uneven: the subgenus with the highestnumber of species is Cochliopaussus (Figure 11).
4. Discussion
Species accumulation curves of theworld Paussini fauna indi-cate that this tribe of carabid beetle is taxonomically stablebut do not prove that knowledge is exhaustive. According tothe trends analyzed in the present paper, relatively few speciesare expected to be described in the future on morphologicalbasis and few currently accepted taxa will be recognized to besynonymous.However, if this situationmay reflect a true stateof affairs in the best explored regions, it may be an artefactwhen stabilization is merely due to prolonged taxonomicinactivity.
In general, temporal trends in species descriptionsmirrordramatic events in human history. The first peak in Africanspecies description occurred in the decade 1880–1899, whichcan be considered an indirect reflection of the first phaseof African explorations that occurred between 1840 and1870 and especially a direct effect of the German expansionin Africa in the 1880s. The second peak occurred in thedecade 1920–1939, which coincides with the third phase ofthe African colonialism, during which the most influentialEuropean states organized and stabilised their territories.The overall trend in species descriptions shows two falls incorrespondence with the First and Second World Wars. Iftaxonomic research was frozen at those dates, we would havea completely false signal of stability. For example, taxonomic

Psyche 7
0
5
10
15
20
25
1770
–177
9
1790
–179
9
1810
–181
9
1830
–183
9
1850
–185
9
1870
–187
9
1890
–189
9
1910
–191
9
1930
–193
9
1950
–195
9
1970
–197
9
1990
–199
9
(a)
1770
–177
9
1790
–179
9
1810
–181
9
1830
–183
9
1850
–185
9
1870
–187
9
1890
–189
9
1910
–191
9
1930
–193
9
1950
–195
9
1970
–197
9
1990
–199
9
0
10
20
30
40
50
60
70
(b)
0
2
4
6
8
10
12
1770
–177
9
1790
–179
9
1810
–181
9
1830
–183
9
1850
–185
9
1870
–187
9
1890
–189
9
1910
–191
9
1930
–193
9
1950
–195
9
1970
–197
9
1990
–199
9
(c)
1770
–177
9
1790
–179
9
1810
–181
9
1830
–183
9
1850
–185
9
1870
–187
9
1890
–189
9
1910
–191
9
1930
–193
9
1950
–195
9
1970
–197
9
1990
–199
9
05
10152025303540
(d)
1770
–177
9
1790
–179
9
1810
–181
9
1830
–183
9
1850
–185
9
1870
–187
9
1890
–189
9
1910
–191
9
1930
–193
9
1950
–195
9
1970
–197
9
1990
–199
9
0
2
4
6
8
10
12
(e)
1770
–177
9
1790
–179
9
1810
–181
9
1830
–183
9
1850
–185
9
1870
–187
9
1890
–189
9
1910
–191
9
1930
–193
9
1950
–195
9
1970
–197
9
1990
–199
90
5
10
15
20
25
30
(f)
Figure 8: Numbers of total described subgenera (a, b), valid subgenera (c, d), and synonyms (e, f) of Paussini by decades. Figures (a), (c),and (e) report the absolute numbers, and Figures (b), (d), and (f) the cumulative numbers.
knowledge in Australia rested at the 1930s [22]. The lackof recent taxonomic activity, coupled with the low numberof described species and the high percentage of synonyms,indicates that the fauna of this region is still poorly known.
Most of taxonomic work on Paussini has been producedby few but very prolific authors. Moreover, the authors thatdescribed most species during the 20th century were thesame that realised the most comprehensive revisions. Thishas created a self-referenced system, with an almost completelack of plurality of views. Therefore, taxonomic stability islargely an effect of the “monopolistic” position of certain
taxonomists (e.g., Reichensperger,Westwood,Wasmann, andLuna de Carvalho) for long times. Moreover, each of themost active taxonomists was mostly interested in a differentbiogeographical region, thus with limited taxonomic overlap.
At global level, the asymptotic value calculated for thesynonym curve is very close to the current number ofsynonyms (151); thus we expect that virtually no taxa willbe recognized as synonymous in the next future. Thisindicates that new species are still being described (alphataxonomy), albeit at decreasing rate in the best exploredregions, whereas virtually no synonyms are currently being
8 Psyche
0
10
20
30
40
50
60
70Su
bgen
era r
ecog
nize
d as
syno
nym
ous (
%)
1770
–177
9
1790
–179
9
1810
–181
9
1830
–183
9
1850
–185
9
1870
–187
9
1890
–189
9
1910
–191
9
1930
–193
9
1950
–195
9
1970
–197
9
1990
–199
9(a)
0
5
10
15
20
25
30
35
40
45
50
Cum
ulat
ive p
ropo
rtio
n of
syno
nym
s
1770
–177
9
1790
–179
9
1810
–181
9
1830
–183
9
1850
–185
9
1870
–187
9
1890
–189
9
1910
–191
9
1930
–193
9
1950
–195
9
1970
–197
9
1990
–199
9
(b)
Figure 9: Percentage of synonymous subgenera described in each decade (a) and historical process of accumulation of percentage ofsynonyms over the total number of names in the Paussini, according to the date of their description (b).
0 50 100 150 200 250 300 350 400𝐻𝑒𝑥𝑎𝑝𝑙𝑎𝑡𝑎𝑟𝑡ℎ𝑟𝑢𝑠
𝐿𝑒𝑙𝑒𝑢𝑝𝑎𝑢𝑠𝑠𝑢𝑠𝑀𝑒𝑔𝑎𝑙𝑜𝑝𝑎𝑢𝑠𝑠𝑢𝑠
𝑀𝑒𝑠𝑎𝑟𝑡ℎ𝑟𝑜𝑝𝑡𝑒𝑟𝑢𝑠𝐸𝑜ℎ𝑜𝑚𝑜𝑝𝑡𝑒𝑟𝑢𝑠𝐻𝑦𝑙𝑜𝑝𝑎𝑢𝑠𝑠𝑢𝑠𝑀𝑒𝑙𝑎𝑛𝑜𝑠𝑝𝑖𝑙𝑢𝑠
𝑃𝑎𝑢𝑠𝑠𝑜𝑚𝑜𝑟𝑝ℎ𝑢𝑠𝑃𝑙𝑎𝑡𝑦𝑟ℎ𝑜𝑝𝑎𝑙𝑜𝑝𝑠𝑖𝑠𝐺𝑟𝑎𝑛𝑢𝑙𝑜𝑝𝑎𝑢𝑠𝑠𝑢𝑠𝐸𝑢𝑝𝑙𝑎𝑡𝑦𝑟ℎ𝑜𝑝𝑎𝑙𝑢𝑠
𝐻𝑦𝑙𝑜𝑡𝑜𝑟𝑢𝑠𝐶𝑒𝑟𝑎𝑡𝑜𝑑𝑒𝑟𝑢𝑠𝐿𝑒𝑏𝑖𝑜𝑑𝑒𝑟𝑢𝑠
𝑃𝑒𝑛𝑡𝑎𝑝𝑙𝑎𝑡𝑎𝑟𝑡ℎ𝑟𝑢𝑠𝑃𝑟𝑜𝑡𝑜𝑝𝑎𝑢𝑠𝑠𝑢𝑠𝐻𝑜𝑚𝑜𝑝𝑡𝑒𝑟𝑢𝑠
𝑃𝑙𝑎𝑡𝑦𝑟ℎ𝑜𝑝𝑎𝑙𝑢𝑠𝐻𝑒𝑡𝑒𝑟𝑜𝑝𝑎𝑢𝑠𝑠𝑢𝑠
𝐶𝑎𝑟𝑎𝑏𝑖𝑑𝑜𝑚𝑒𝑚𝑛𝑢𝑠𝐶𝑒𝑟𝑎𝑝𝑡𝑒𝑟𝑢𝑠
𝐴𝑟𝑡ℎ𝑟𝑜𝑝𝑡𝑒𝑟𝑢𝑠𝑃𝑎𝑢𝑠𝑠𝑢𝑠
Figure 10: Number of species per genus in the tribe Paussini.
described, implying either a lack of beta taxonomy (i.e.,redundant descriptions are still considered valid because ofthe reduced revisional work) or an excellent efficiency ofalpha taxonomy (i.e., all new species are valid and noneis redundantly described) [24]. We think that failure torecognize synonymies is likely high in the less studied faunas,for which most species have been described from sparseindividuals, but this is balanced by the presence of stillundescribed species. This may be the case of the Orientalregion, which seems to have few species and a moderatepercentage of synonymies, but from which so many speciesare being discovered and no further synonymies established.
Stability in species beta taxonomy indicates that Paussinispecies are recognized as discrete entities bymost researchers.Paussini species were described and are currently recognized
on the basis of morphological traits, that is, as groups ofphenetically similar individuals that can be separated fromother analogous groups by means of phenetic gaps, thus cor-responding to a morphological concept of species [25]. Stabi-lization in synonymies suggests that most taxonomists agreein considering the diagnostic characters presented in speciesdescriptions as gaps sufficiently strong to mark discontinu-ities among populations. Morphologically defined species donot necessarily correspond to “biological” species (definedas reproductively isolated populations [5]). However, theapplication of a morphological approach for discriminat-ing species was the practical methodology most frequentlyused by taxonomists in the past, and the same approachstill dominates (and likely will dominate) daily work ofthe majority of taxonomists. Stability in beta taxonomy of
Psyche 9
0 20 40 60 80 100 120𝐴𝑚𝑝ℎ𝑖𝑝𝑎𝑢𝑠𝑠𝑢𝑠𝐶𝑎𝑟𝑎𝑏𝑖𝑑𝑜𝑚𝑖𝑚𝑢𝑠𝐸𝑛𝑛𝑒𝑎𝑝𝑎𝑢𝑠𝑠𝑢𝑠
𝐻𝑦𝑝𝑒𝑟𝑝𝑒𝑛𝑡𝑎𝑟𝑡ℎ𝑟𝑢𝑠𝐼𝑛𝑑𝑢𝑝𝑎𝑢𝑠𝑠𝑢𝑠𝐿𝑎𝑡𝑖𝑝𝑎𝑢𝑠𝑠𝑢𝑠
𝑃𝑙𝑎𝑡𝑦𝑟ℎ𝑜𝑝𝑎𝑙𝑖𝑑𝑒𝑠𝐵𝑎𝑡ℎ𝑦𝑝𝑎𝑢𝑠𝑠𝑢𝑠
𝑃𝑙𝑎𝑡𝑦𝑟ℎ𝑜𝑝𝑎𝑙𝑜𝑝𝑠𝑖𝑠𝑆𝑡𝑒𝑛𝑜𝑟ℎ𝑜𝑝𝑎𝑙𝑢𝑠𝑇𝑟𝑒𝑝𝑜𝑝𝑎𝑢𝑠𝑠𝑢𝑠
𝐹𝑙𝑎𝑔𝑒𝑙𝑙𝑜𝑝𝑎𝑢𝑠𝑠𝑢𝑠𝐴𝑟𝑐ℎ𝑖𝑝𝑎𝑢𝑠𝑠𝑢𝑠𝑃𝑟𝑜𝑡𝑜𝑝𝑎𝑢𝑠𝑠𝑢𝑠𝐴𝑛𝑎𝑝𝑎𝑢𝑠𝑠𝑢𝑠
𝐵𝑎𝑡𝑖𝑙𝑙𝑜𝑝𝑎𝑢𝑠𝑠𝑢𝑠𝐶𝑎𝑟𝑎𝑏𝑖𝑑𝑜𝑚𝑒𝑚𝑛𝑢𝑠𝑆𝑞𝑢𝑎𝑚𝑖𝑝𝑎𝑢𝑠𝑠𝑢𝑠
𝐴𝑝𝑜𝑝𝑎𝑢𝑠𝑠𝑢𝑠𝑀𝑎𝑙𝑔𝑎𝑠𝑖𝑝𝑎𝑢𝑠𝑠𝑢𝑠𝑃𝑒𝑛𝑡𝑎𝑝𝑙𝑎𝑡𝑎𝑟𝑡ℎ𝑟𝑢𝑠𝐶𝑟𝑒𝑛𝑎𝑡𝑜𝑝𝑎𝑢𝑠𝑠𝑢𝑠𝐵𝑖𝑐𝑜𝑟𝑛𝑖𝑝𝑎𝑢𝑠𝑠𝑢𝑠
𝑃𝑎𝑢𝑠𝑠𝑢𝑠𝑆𝑐𝑎𝑝ℎ𝑖𝑝𝑎𝑢𝑠𝑠𝑢𝑠𝑆𝑒𝑚𝑖𝑝𝑎𝑢𝑠𝑠𝑢𝑠𝑃𝑙𝑎𝑡𝑦𝑟ℎ𝑜𝑝𝑎𝑙𝑢𝑠
𝑀𝑎𝑛𝑖𝑐𝑎𝑛𝑜𝑝𝑎𝑢𝑠𝑠𝑢𝑠𝐾𝑙𝑢𝑔𝑖𝑝𝑎𝑢𝑠𝑠𝑢𝑠
𝐿𝑖𝑛𝑒𝑎𝑡𝑜𝑝𝑎𝑢𝑠𝑠𝑢𝑠𝑆𝑝𝑖𝑛𝑖𝑐𝑜𝑥𝑖𝑝𝑎𝑢𝑠𝑠𝑢𝑠𝐶𝑎𝑟𝑎𝑏𝑖𝑑𝑜𝑑𝑜𝑥𝑢𝑠
𝑆ℎ𝑢𝑐𝑘𝑎𝑟𝑑𝑖𝑝𝑎𝑢𝑠𝑠𝑢𝑠𝐾𝑎𝑡𝑎𝑝𝑎𝑢𝑠𝑠𝑢𝑠
𝐸𝑑𝑎𝑝ℎ𝑜𝑝𝑎𝑢𝑠𝑠𝑢𝑠𝐶𝑜𝑐ℎ𝑙𝑖𝑜𝑝𝑎𝑢𝑠𝑠𝑢𝑠
Figure 11: Number of species per subgenus in the tribe Paussini.
morphological species makes Paussini an ideal candidate forfuture works using molecular approach to investigate howmorphological discontinuities are paralleled by moleculardivergences. This would be particularly important to clarifyrelationships among species. Current taxonomic patternssuggest that most species were allocated into the genusPaussus probably reflecting a real phylogenetic proximity.However, subgeneric divisions appear instable and basedon subtle and controversial morphological characters. Thissuggests that morphological characters are not fully adequateto resolve infrageneric relationships.
Acknowledgments
The authors are grateful to Wendy Moore (AZ, USA),Augusto Vigna Taglianti (Roma, Italy), and Peter Nagel(Basel, Switzerland) for the continued stimulating discus-sions about the taxonomy of Paussini and two anonymousreferees for their useful comments. Wendy Moore alsoprovided them with an electronic species level database ofPaussini and revised the language of the paper. The authorsthank Valerio Viglioglia for his help in the data entry andPeter Hlavac for his suggestions.
References
[1] K. J. Gaston, “The magnitude of global insect species richness,”Conservation Biology, vol. 5, no. 3, pp. 283–296, 1991.
[2] R. J. Ladle and R. J. Whittaker, Conservation Biogeography,Springer, West Sussex, UK, 2011.
[3] A. Baselga, J. Hortal, A. Jimenez-Valverde, J. F. Gomez, andJ. M. Lobo, “Which leaf beetles have not yet been described?Determinants of the description of Western Palaearctic Aph-thona species (Coleoptera: Chrysomelidae),” Biodiversity andConservation, vol. 16, no. 5, pp. 1409–1421, 2007.
[4] J. Hortal, A. Jimenez-Valverde, J. F. Gomez, J. M. Lobo, and A.Baselga, “Historical bias in biodiversity inventories affects theobserved environmental niche of the species,”Oikos, vol. 117, no.6, pp. 847–858, 2008.
[5] E. Mayr, Principles of Systematic Zoology, McGraw-Hill, NewYork, NY, USA, 1969.
[6] A. Di Giulio, S. Fattorini, A. Kaupp, A. V. Taglianti, andP. Nagel, “Review of competing hypotheses of phylogeneticrelationships of Paussinae (Coleoptera: Carabidae) based onlarval characters,” Systematic Entomology, vol. 28, no. 4, pp. 509–537, 2003.
[7] A. Di Giulio and W. Moore, “The first-instar larva of the genusArthropterus (Coleoptera:Carabidae: Paussinae): implicationsfor evolution of myrmecophily and phylogenetic relationshipswithin the subfamily,” Invertebrate Systematics, vol. 18, no. 2, pp.101–115, 2004.
[8] A. Di Giulio, “Fine morphology of the myrmecophilous larvaof Paussus kannegieteri (Coleoptera: Carabidae: Paussinae:Paussini),” Zootaxa, no. 1741, pp. 37–50, 2008.
[9] W. Moore, X. B. Song, and A. di Giulio, “The larva of Eustra(Coleoptera, Paussinae, Ozaenini): a facultative associate ofants,” ZooKeys, vol. 90, pp. 63–82, 2011.

10 Psyche
[10] C. Escherich, “Zur naturgeschichte von Paussus favieri Fairm,”Verhandlungen der Zoologisch-Botanischen Gesellschaft, vol. 49,pp. 278–283, 1899.
[11] G. Le Masne, “Recherches sur la biologie des animauxmyrmecophiles IV: observations sur le comportement de Paus-sus favieri Fairm, hote de la fourmi Pheidole pallidula Nyl.,”Annales de la Faculte des Sciences de Marseille, vol. 31, pp. 111–130, 1961.
[12] G. Le Masne, “Recherches sur la biologie des animauxmyrmecophiles I: L’adoption des Paussus favieri Fairm, par unenouvelle societe de Pheidole pallidula Nyl.,” Comptes RendusHebdomadaires des Sceances de L’Academie des Sceances, vol.253, pp. 1621–1623, 1961.
[13] S. F. Geiselhardt, K. Peschke, and P. Nagel, “A review ofmyrmecophily in ant nest beetles (Coleoptera: Carabidae:Paussinae): linking early observations with recent findings,”Naturwissenschaften, vol. 94, no. 11, pp. 871–894, 2007.
[14] A. di Giulio, E. Maurizi, P. Hlavac, and W. Moore, “Thelong-awaited first instar larva of Paussus favieri (Coleoptera:Carabidae: Paussini),” European Journal of Entomology, vol. 108,no. 1, pp. 127–138, 2011.
[15] E. Maurizi, S. Fattorini, and A. Di Giulio, “Behavior of Paussusfavieri (Coleoptera, Carabidae, Paussini), a myrmecophilousbeetle associated with Pheidole pallidula (Hymenoptera, Formi-cidae),” Psyche, vol. 2012, Article ID 940315, 9 pages, 2012.
[16] G. C. Steyskal, “Trend curves of the rate of species descriptionin zoology,” Science, vol. 149, no. 3686, pp. 880–882, 1965.
[17] R. A. Medellın and J. Soberon, “Predictions of mammal diver-sity on four landmasses,”Conservation Biology, vol. 13, no. 1, pp.143–149, 1999.
[18] F. J. Cabrero-Sanudo and J. M. Lobo, “Estimating the numberof species not yet described and their characteristics: thecase of Western Palaearctic dung beetle species (Coleoptera,Scarabaeoidea),” Biodiversity and Conservation, vol. 12, no. 1, pp.147–166, 2003.
[19] A. Baselga and F. Novoa, “Diversity of Chrysomelidae(Coleoptera) in Galicia, Northwest Spain: estimating thecompleteness of the regional inventory,” Biodiversity andConservation, vol. 15, no. 1, pp. 205–230, 2006.
[20] A. R. Solow and W. K. Smith, “On estimating the number ofspecies from the discovery record,” Proceedings of the RoyalSociety B, vol. 272, no. 1560, pp. 285–287, 2005.
[21] J. Alroy, “How many named species are valid?” Proceedings ofthe National Academy of Sciences of the United States of America,vol. 99, no. 6, pp. 3706–3711, 2002.
[22] S. Fattorini, E. Maurizi, and A. Di Giulio, “Tackling thetaxonomic impediment: a global assessment for ant-nest beetlediversity (Coleoptera: Carabidae: Paussini),” Biological Journalof the Linnean Society, vol. 105, pp. 330–339, 2012.
[23] W. Lorenz, A Systematic List of Extant Ground Beetles of theWorld (Coleoptera “Geadephaga”: Trachypachidae and Cara-bidae Incl. Paussinae, Cicindelinae, Rhysodinae), W. Lorenz,Tutzing, Germany, 2nd edition, 2005.
[24] A. Baselga, J. M. Lobo, J. Hortal, A. Jimenez-Valverde, and J. F.Gomez, “Assessing alpha and beta taxonomy in eupelmidwasps:determinants of the probability of describing good species andsynonyms,” Journal of Zoological Systematics and EvolutionaryResearch, vol. 48, no. 1, pp. 40–49, 2010.
[25] R. R. Sokal and J. Crovello, “The biological species concept: acritical evaluation,” The American Naturalist, vol. 104, pp. 127–153, 1970.

Submit your manuscripts athttp://www.hindawi.com
Hindawi Publishing Corporationhttp://www.hindawi.com Volume 2014
Anatomy Research International
PeptidesInternational Journal of
Hindawi Publishing Corporationhttp://www.hindawi.com Volume 2014
Hindawi Publishing Corporation http://www.hindawi.com
International Journal of
Volume 2014
Zoology
Hindawi Publishing Corporationhttp://www.hindawi.com Volume 2014
Molecular Biology International
GenomicsInternational Journal of
Hindawi Publishing Corporationhttp://www.hindawi.com Volume 2014
The Scientific World JournalHindawi Publishing Corporation http://www.hindawi.com Volume 2014
Hindawi Publishing Corporationhttp://www.hindawi.com Volume 2014
BioinformaticsAdvances in
Marine BiologyJournal of
Hindawi Publishing Corporationhttp://www.hindawi.com Volume 2014
Hindawi Publishing Corporationhttp://www.hindawi.com Volume 2014
Signal TransductionJournal of
Hindawi Publishing Corporationhttp://www.hindawi.com Volume 2014
BioMed Research International
Evolutionary BiologyInternational Journal of
Hindawi Publishing Corporationhttp://www.hindawi.com Volume 2014
Hindawi Publishing Corporationhttp://www.hindawi.com Volume 2014
Biochemistry Research International
ArchaeaHindawi Publishing Corporationhttp://www.hindawi.com Volume 2014
Hindawi Publishing Corporationhttp://www.hindawi.com Volume 2014
Genetics Research International
Hindawi Publishing Corporationhttp://www.hindawi.com Volume 2014
Advances in
Virolog y
Hindawi Publishing Corporationhttp://www.hindawi.com
Nucleic AcidsJournal of
Volume 2014
Stem CellsInternational
Hindawi Publishing Corporationhttp://www.hindawi.com Volume 2014
Hindawi Publishing Corporationhttp://www.hindawi.com Volume 2014
Enzyme Research
Hindawi Publishing Corporationhttp://www.hindawi.com Volume 2014
International Journal of
Microbiology