review article salivary gland imaging: a pictorial...
TRANSCRIPT

Taneja et al: Salivary gland imaging
IJMDS ● www.ijmds.org ● January 2015; 4(1) 692
Review Article Salivary gland imaging: A pictorial essay Taneja A1, Sachdev IS2, Sethi S3, Garga UC4
ABSTRACT
The major salivary glands are parotid, submandibular and sublingual glands. Imaging has an important role to play in detection, diagnosis, aiding biopsy and differentiating benign from malignant pathology. The traditional imaging modalities include plain radiography and sialography. With the advent of modern imaging methods like high resolution ultrasound with color doppler, contrast enhanced CT, MRI and MR sialography, the imaging has become increasingly reliable in making a confident diagnosis. A wide variety of conditions including obstructive, infectious, autoimmune and neoplastic pathologies affect the salivary glands, thus resulting in a wide imaging spectrum. This article is aimed at presenting the imaging appearances of common salivary gland diseases. Key words: Imaging, Ultrasound, CT, MRI, salivary glands, sialography, parotid
Introduction Salivary glands are exocrine glands in mammals that produce saliva. There are three paired major glands, namely parotid, submandibular and sublingual glands and numerous minor glands scattered throughout the oral cavity, nasopharynx and tracheobronchial tree. A variety of disease processes affect the salivary glands, including inflammatory, systemic, obstructive and neoplastic. Imaging plays an important role in detection, diagnosis and differentiation of malignant lesions from benign. The images in this essay have been obtained using high frequency (8-14 MHz) transducer of GE Voluson E6 ultrasound machine, Philips Brilliance 40-slice CT machine and Siemens Magnetom Symphony 1.5 tesla MR machine. Imaging modalities
Conventional Radiography and Sialography were widely used in past but are seldom used nowadays as they are of limited utility. Sialography being an invasive investigation has largely been replaced by MR sialography. Ultrasound remains the initial non-invasive investigation of choice due to its high resolution, easy availability and ability to guide needle biopsy. Ultrasound can detect around 95% of space occupying lesions of major salivary glands. [1] Color doppler can add to the value of ultrasound by depicting the blood flow within the lesion. Computed tomography involves radiation exposure and injection of iodinated contrast. It is useful in situations where MR is not readily available. Except for differentiating cysts from solid masses, and lipomas from other tumors, CT does not play a role in histologic
1Dr Anil Taneja MD, Associate Professor, Radiology [email protected] 2Dr Imroz Singh Sachdev PG Student, Radiology [email protected] 3Dr Sonal Sethi PG Student, Radiology [email protected] 4Dr. U.C. Garga MD, Professor and Head, Radiology [email protected] 1,2,3,4PGIMER, Dr Ram Manohar Lohia Hospital New Delhi, India
Received: 17-05-2014 Revised: 29-05-2014
Accepted: 18-06-2014 Correspondence to:
Dr Imroz Singh Sachdev [email protected]
9868030432
Taneja et al: Salivary gland imaging
IJMDS ● www.ijmds.org ● January 2015; 4(1) 693
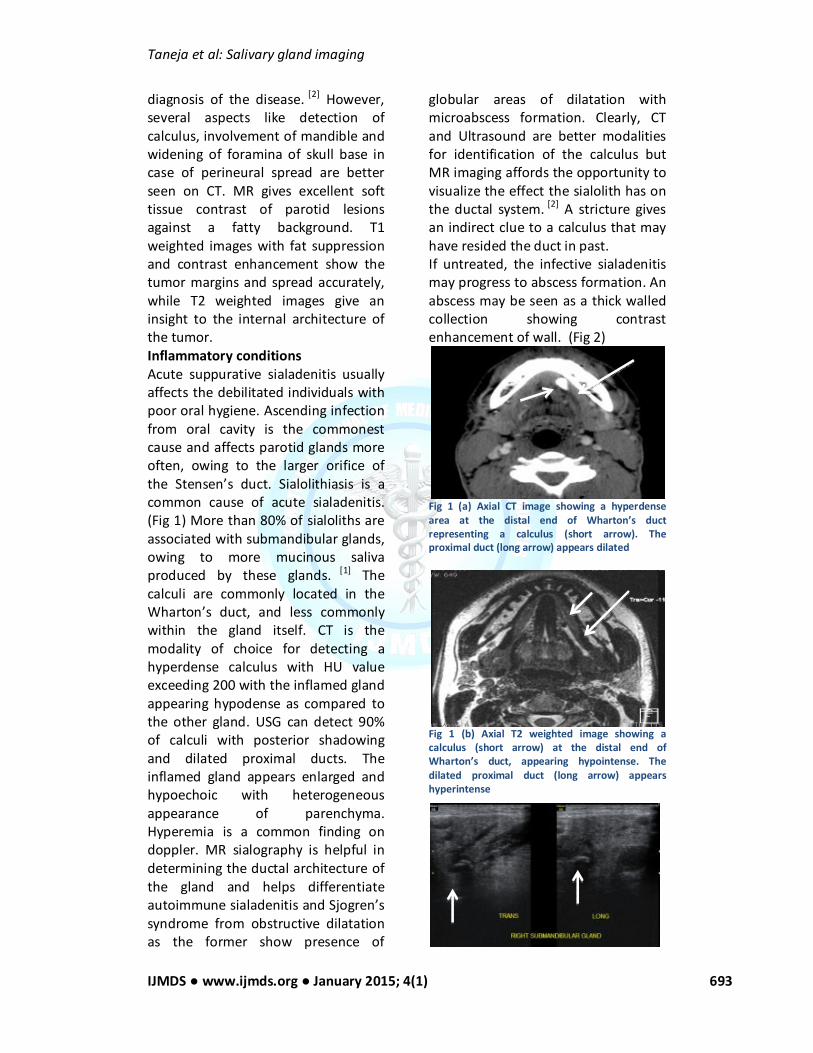
diagnosis of the disease. [2] However, several aspects like detection of calculus, involvement of mandible and widening of foramina of skull base in case of perineural spread are better seen on CT. MR gives excellent soft tissue contrast of parotid lesions against a fatty background. T1 weighted images with fat suppression and contrast enhancement show the tumor margins and spread accurately, while T2 weighted images give an insight to the internal architecture of the tumor. Inflammatory conditions Acute suppurative sialadenitis usually affects the debilitated individuals with poor oral hygiene. Ascending infection from oral cavity is the commonest cause and affects parotid glands more often, owing to the larger orifice of the Stensen’s duct. Sialolithiasis is a common cause of acute sialadenitis. (Fig 1) More than 80% of sialoliths are associated with submandibular glands, owing to more mucinous saliva produced by these glands. [1] The calculi are commonly located in the Wharton’s duct, and less commonly within the gland itself. CT is the modality of choice for detecting a hyperdense calculus with HU value exceeding 200 with the inflamed gland appearing hypodense as compared to the other gland. USG can detect 90% of calculi with posterior shadowing and dilated proximal ducts. The inflamed gland appears enlarged and hypoechoic with heterogeneous appearance of parenchyma. Hyperemia is a common finding on doppler. MR sialography is helpful in determining the ductal architecture of the gland and helps differentiate autoimmune sialadenitis and Sjogren’s syndrome from obstructive dilatation as the former show presence of
globular areas of dilatation with microabscess formation. Clearly, CT and Ultrasound are better modalities for identification of the calculus but MR imaging affords the opportunity to visualize the effect the sialolith has on the ductal system. [2] A stricture gives an indirect clue to a calculus that may have resided the duct in past. If untreated, the infective sialadenitis may progress to abscess formation. An abscess may be seen as a thick walled collection showing contrast enhancement of wall. (Fig 2)
Fig 1 (a) Axial CT image showing a hyperdense area at the distal end of Wharton’s duct representing a calculus (short arrow). The proximal duct (long arrow) appears dilated
Fig 1 (b) Axial T2 weighted image showing a calculus (short arrow) at the distal end of Wharton’s duct, appearing hypointense. The dilated proximal duct (long arrow) appears hyperintense

Taneja et al: Salivary gland imaging
IJMDS ● www.ijmds.org ● January 2015; 4(1) 694
Fig. 1 (c) USG showing a hyper echoic calculus (arrows) with posterior acoustic shadowing in submandibular gland with dilated intraglandular ducts
Fig. 2 Parotid abscess Coronal CECT image showing a well defined hypodense lesion in Left parotid gland with enhancing margins (arrow) A number of conditions cause chronic inflammatory sialadenitis, which includes sialolithiasis, Sjogren’s syndrome and chronic sclerosing sialadenitis. [3] An attempt should be made to differentiate the obstructive and non-obstructive diseases, since their treatment and prognosis often vary considerably. In chronic non-obstructive inflammations, parotid is more commonly involved. The gland is usually enlarged on imaging, and shows diffuse contrast enhancement on CT. The parenchyma appears heterogeneous and calcific foci may be seen scattered within the gland. In long standing cases, atrophy of glands is seen. MR shows an intermediate to high signal on T2. [4]
Fig. 3(a) Axial NCCT image in a case of chronic sialadenitis. The parotids appear shrunken in size with few calcific foci (arrow) scattered within the glands
Fig. 3(b) Axial T2 weighted MR of the same patient showing predominantly hyperintense areas scattered throughout the parotid glands (arrows) Sjogren’s syndrome usually affects middle-aged women and is associated with keratoconjunctivitis sicca, xerostomia and connective tissue disease. On USG, in the early stage the salivary glands may be normal or show diffuse enlargement with normal echogenicity. The late features include a heterogeneous echopattern with multiple round hypoechoic areas within the parenchyma. [5] The gland may appear small and atrophic in long standing disease. On CT, there is fatty replacement of the gland in late stages. MR sialography is especially helpful in depiction of globular microabscesses in intraglandular ducts. MR offers an advantage over other imaging modalities in visualization and assessment of severity in Sjogren’s syndrome. Some authors have published grading system for Sjogren’s on the basis of their MR and MR sialography appearances. [6,7] (Fig. 4)
Fig. 4 (a) Sjogren’s syndrome. USG images show multiple hypoechoic areas (arrow) in parotid gland in a known case of Sjogren’s

Taneja et al: Salivary gland imaging
IJMDS ● www.ijmds.org ● January 2015; 4(1) 695
Fig. 4(b) Sjogren’s syndrome. T1 weighted image shows predominantly hyperintense parotid glands representing the fatty replacement of the parenchyma (arrow)
Fig. 4(c) Sjogren’s syndrome. MR sialography shows multiple intraglandular microabscesses Salivary gland cysts Cystic lesions of salivary gland may be congenital, which include first branchial cleft cysts (Fig. 5), lymphoepithelial cysts and epidermoid inclusion cysts. Acquired cysts may be a result of obstruction, trauma or surgical complication. A sialogram is helpful if the cyst communicates with the ductal system. The cyst usually gives a bright signal on T2 weighted images. Heterogeneous signal may be seen if the cyst becomes infected or there is hemorrhage within. Ultrasound is mostly sufficient for making a diagnosis, aided by the ability to guide the aspiration of the cyst contents. CT and MRI are useful in difficult cases.
Fig. 5 (a) Branchial cleft cyst. Axial CECT image shows a large hypodense lesion in right parotid gland (arrow) with calcific content in dependent portion
Fig. 5(b) The calcific content appears hypointense (arrow) as compared to the bright signal of the cystic fluid on T2 image AIDS related parotid cysts or benign lymphoepithelial cysts present as bilateral, painless enlarged glands in AIDS patients and appear as multiple small cystic areas on imaging. Patients typically present with unilateral or bilateral painless, enlarging masses; imaging studies reveal that bilaterality is the rule. Ultrasound shows multiple, small hypoechoic areas within the gland (Fig 6a). On CT and MR, individual cysts may not be identifiable and the heterogeneous appearance of the gland may be the only clue. (Fig 6b)
Fig. 6(a) USG of parotid gland in an HIV positive patient shows hypoechoic foci representing lymphoepithelial cysts (arrow)
Taneja et al: Salivary gland imaging
IJMDS ● www.ijmds.org ● January 2015; 4(1) 696
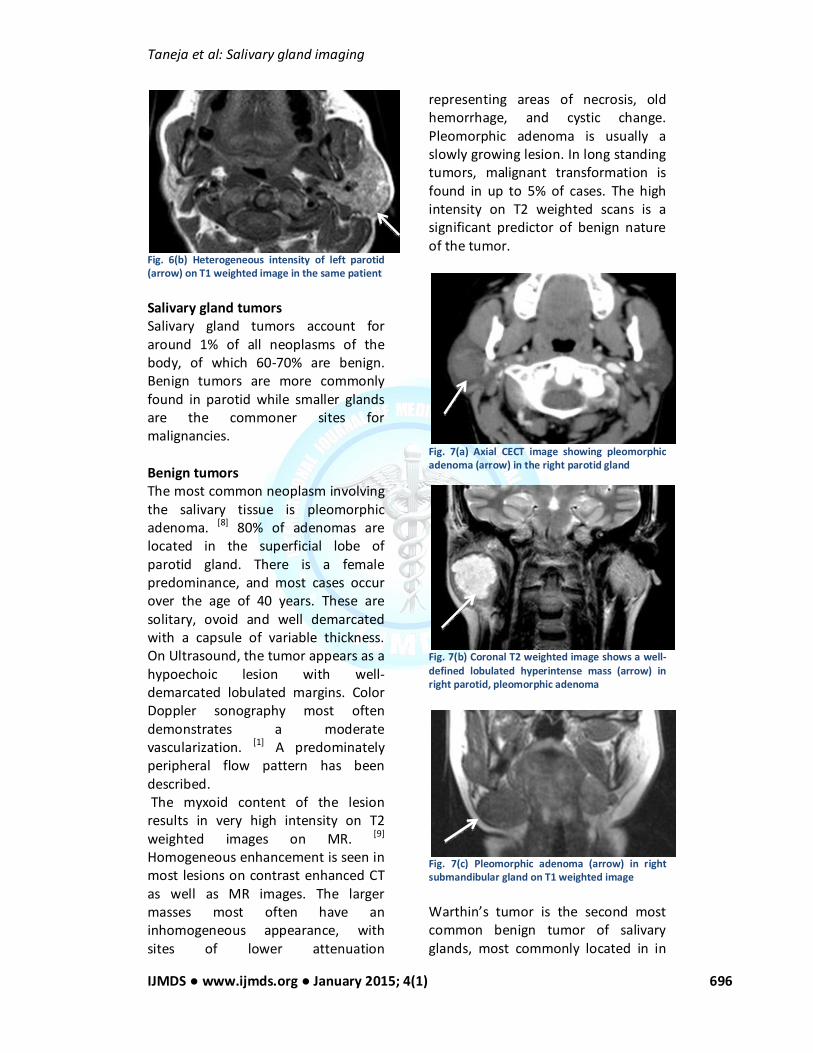
Fig. 6(b) Heterogeneous intensity of left parotid (arrow) on T1 weighted image in the same patient Salivary gland tumors Salivary gland tumors account for around 1% of all neoplasms of the body, of which 60-70% are benign. Benign tumors are more commonly found in parotid while smaller glands are the commoner sites for malignancies. Benign tumors The most common neoplasm involving the salivary tissue is pleomorphic adenoma. [8] 80% of adenomas are located in the superficial lobe of parotid gland. There is a female predominance, and most cases occur over the age of 40 years. These are solitary, ovoid and well demarcated with a capsule of variable thickness. On Ultrasound, the tumor appears as a hypoechoic lesion with well-demarcated lobulated margins. Color Doppler sonography most often demonstrates a moderate vascularization. [1] A predominately peripheral flow pattern has been described. The myxoid content of the lesion results in very high intensity on T2 weighted images on MR. [9] Homogeneous enhancement is seen in most lesions on contrast enhanced CT as well as MR images. The larger masses most often have an inhomogeneous appearance, with sites of lower attenuation
representing areas of necrosis, old hemorrhage, and cystic change. Pleomorphic adenoma is usually a slowly growing lesion. In long standing tumors, malignant transformation is found in up to 5% of cases. The high intensity on T2 weighted scans is a significant predictor of benign nature of the tumor.
Fig. 7(a) Axial CECT image showing pleomorphic adenoma (arrow) in the right parotid gland
Fig. 7(b) Coronal T2 weighted image shows a well-defined lobulated hyperintense mass (arrow) in right parotid, pleomorphic adenoma
Fig. 7(c) Pleomorphic adenoma (arrow) in right submandibular gland on T1 weighted image Warthin’s tumor is the second most common benign tumor of salivary glands, most commonly located in in

Taneja et al: Salivary gland imaging
IJMDS ● www.ijmds.org ● January 2015; 4(1) 697
the tail of parotid gland and multicentric in 30% cases. These are sharply demarcated homogeneous solid mass lesions, although cyst formation is commonly seen. On ultrasound, they are not as homogeneous as the pleomorphic adenomas. [10,11] The cyst content consists of homogeneous material of 10-20 HU on CT. Peripheral enhancement is seen in cystic lesions. Solid tumors show similar appearance as pleomorphic adenomas on MR, while cystic lesions show low, intermediate or mixed signal intensity on T2 weighted images. [12] The mitochondrium-rich oncocytes of Warthin’ s tumors are the cells that accumulate 99m Tc pertechnetate on salivary radionuclide scans. [13]
Fig. 8(a) Coronal CECT showing Warthin’s tumor (arrow) in right parotid gland
Fig. 8(b) T1 weighted MRI shows a solid Warthin’s tumor (arrow) in right parotid gland Other benign tumors include lipomas, which are best distinguished on CT due to their characteristic fat attenuation. On USG, lipomas appear slightly hypoechoic with linear
striations. [14] On MRI lipomas appear hyperintense on T1 with suppression of signal on fat saturation sequences. Rare tumors include dermoid, basal cell adenomas and neurogenic tumors. It is usually not possible to differentiate these from other benign tumors and the diagnosis is made on histopathology.
Fig. 9(a) Axial CECT and 9(b) USG images in a case of right parotid lipoma (arrows)
Fig. 10(a) T1 weighted contrast enhanced image showing a well-defined enhancing mass (arrow) in right parotid gland- basal cell adenoma
Fig. 10(b) Axial CECT image of the same patient showing a hyperdense enhancing mass (arrow)

Taneja et al: Salivary gland imaging
IJMDS ● www.ijmds.org ● January 2015; 4(1) 698
Malignant tumors The commonest malignant neoplasms of salivary glands are mucoepidermoid carcinomas. Eighty percent of these occur in parotid glands. They can be low or high malignant potential. Tumors less than 2 cm are homogeneous and have well defined margins and may be difficult to differentiate from benign tumors. [8]
Irregular margins, large size and necrosis favor a high-grade malignancy. Ultrasound is able to correctly distinguish a low grade from a high-grade tumor in most of the cases. Problem arises when the tumors are very large, where USG in unable to delineate the entire extent of the tumor. On CT, low-grade lesions are benign in appearance, with apparently well-delineated, smooth margins. Cystic areas may be present, with a low attenuation of 10 to 18 HU. Rarely, focal calcification may be seen. The appearance is similar to that of a benign pleomorphic tumor. With higher-grade malignancies, the cellularity increases and thus the T2 signal decreases. Thus low to intermediate signal intensity is a feature of high-grade malignancy on MR imaging.
Fig. 11(a) Coronal T2 weighted image showing an ill defined, hypointense mass lesion (arrow) in left parotid gland- low-grade mucoepidermoid carcinoma Adenoid cystic tumor is a slow growing, widely infiltrative tumor with a tendency for perineural spread. Its
incidence keeps on increasing with the decreasing size of gland, thus making it a more common tumor of minor salivary glands. [15]
Fig. 11(b) USG of the same patient shows a heterogeneous hypoechoic mass (arrow) in left parotid Around 50-60% of these tumors show perineural spread. [16] On cross sectional imaging, the parotid lesions tend to appear as benign, well delineated tumors, while the minor salivary gland neoplasms usually have malignant infiltrative margins. MR imaging is more sensitive than CT in detecting neural tumor invasion and on contrast MR imaging, nerve enhancement can be identified.
Fig. 12(a) Axial T2 weighted image in a case of adenoid cystic carcinoma shows a heterogeneous mass (arrow) in left parotid gland
Fig. 12(b) Sagittal post contrast T1 image of the same patient shows the tumor extending intracranially along mandibular nerve through foramen ovale (arrow)-perineural spread

Taneja et al: Salivary gland imaging
IJMDS ● www.ijmds.org ● January 2015; 4(1) 699
Acinic cell tumors very often appear well defined, with high signal intensity on T2 mimicking pleomorphic adenomas. Adenocarcinomas are large tumors with necrotic component and often invade the deep lobe of parotid (Fig 13). Lymph nodes are normally present within the parenchyma of parotid glands. Since the parotid gland encapsulates late in the second trimester, it incorporates lymphatic tissue, whereas the other salivary glands do not. This accounts for the potential for involvement of parotid glands in metastases from head and neck malignancies or lymphomas (mostly non-Hodgkin’s lymphoma). (Fig 14)
Fig. 13 Post contrast T1 weighted image shows a large mass (arrow) in right parotid gland extending into the deep lobe, with areas of necrosis within- adenocarcinoma
Fig. 14 Axial T2 weighted MR image shows involvement of left parotid gland (arrow) in a case of Non Hodgkin’s lymphoma Conclusion There are a wide variety of pathologic conditions that affect the salivary
glands. It is important from the imaging point of view to detect, delineate the extent, involvement of adjacent structures and differentiate between benign and malignant lesions. Ultrasound should be the first line modality and should be combined with needle biopsy wherever possible. CT is useful, besides determining the attenuation of the lesion, in detection of calculi and bony involvement, however its use is limited by the high dose of radiation involved. MR, due to its excellent soft tissue contrast, is the preferred modality differentiating benign from malignant lesions. The limitations of MRI are limited availability and affordability. References
1. Gritzmann N, Rettenbacher T, Hollerweger a, Macheiner P, Hubner E. Sonography of the salivary glands. European radiology 2003;13(5):964–75.
2. Yousem DM, Kraut MA, Chalian AA. Major Salivary Gland Imaging. Radiology 2000; 216:19–29.
3. Wong KT, Ahuja AT, Yuen H, King AD. Ultrasound of salivary glands. Australasian Journal of Ultrasound in Medicine 2003;6(3):18–22.
4. Som PM, Curtin HD. Head and Neck Imaging. 4th ed. Mosby, Inc.; 2003.p.2005-133.
5. Bradus RJ, Hybarger P, Gooding GA. Parotid gland: US findings in Sjogren syndrome. Work in progress. Radiology 1988;169(3):749–51.
6. Izumi M, Eguchi K, Ohki M et al. MR Imaging of the Parotid Gland in Sjogren’s Syndrome: A Proposal for new Diagnostic Criteria. AJR. American journal of roentgenology 1996; 166:1483–7.
7. Tonami H, Ogawa Y, Matoba M, Kuginuki Y, Yokota H. MR Sialography

Taneja et al: Salivary gland imaging
IJMDS ● www.ijmds.org ● January 2015; 4(1) 700
in Patients with Sjogren Syndrome. AJNR Am J Neuroradiol1998;19:1199–203.
8. Koischwitz D, Gritzmann N. Ultrasound of the neck. Radiol Clin North Am 2000; 38(5):1029–45.
9. Teresi LM, Lufkin RB, Wortham DG, Abemayor E, Hanafee WN. Parotid masses: MR imaging. Radiology 1987;163(2):405–9.
10. Shimizu M, Ussmuller J, Hartwein J, Donath K. A comparative study of onographic and histopathologic findings of tumorous lesions in the parotid gland. Oral Surg Oral Med Oral Pathol Oral Radiol Endod 1999;88(6):723–37.
11. Yoshiura K, Miwa K, Yuasa K, Tokumori K, Kanda S, Higuchi Y, et al. Ultrasonographic texture characterization of salivary and neck masses using two-dimensional gray-scale clustering. Dentomaxillofac Radiol 1997;26(6):332–6.
12. Schlakman BN, Yousem DM. MR of intraparotid masses. AJNR Am J Neuroradiol 1993;14(5):1173–80.
13. Shugar JM, Som PM, Biller HF. Warthin’s tumor, a multifocal disease. Ann Otol Rhinol Laryngol 1982;91(3 Pt 1):246–9.
14. Gritzmann N, Schratter M, Traxler M, Helmer M. Sonography and computed tomography in deep cervical lipomas and lipomatosis of the neck. J Ultrasound 1988;7(8):451–6.
15. Conley J, Dingman DL. Adenoid cystic carcinoma in the head and neck (cylindroma). Arch Otolaryngol 1974;100(2):81–90.
16. Seaver PRJ, Kuehn PG. Adenoid cystic carcinoma of the salivary glands. A study of ninety-three cases. Am J Surg 1979;137(4):449–55.
Cite this article as: Taneja A, Sachdev IS, Sethi S, Garga UC. Salivary gland imaging: A pictorial essay. Int J Med and Dent Sci 2015; 4(1): 692-700.
Source of Support: Nil Conflict of Interest: No