review of 12m15 results 9 march 2016imagehk.hurriyet.com.tr/userfiles/yatırımcısunumları... ·...
TRANSCRIPT
Review of 12M15 Results 9 March 2016

2
16%
Newspaper Ad Market (TL mn)
Turkish Ad Market and Hürriyet
Hürriyet Print Ad Revenue (TL mn)
-12%
Hürriyet Domestic Online Ad Rev. (TL mn)
Total Ad Market (TL mn)
33%
-8%
Online Ad Market (TL mn)
5%
900
825
12M14 12M15
1.030
1.197
12M14 12M15
298 261
12M14 12M15
59
79
12M14 12M15
5.743 6.005
12M14 12M15

3
Improved EBITDA
Consolidated Revenues Consolidated EBITDA
-17%
720
596
12M14 12M15
52 65
12M14 12M15

4
All operating costs under strict control
Production and Operating Expenses*
* Total of cost of goods sold, marketing & selling and general administrative expenses excluding depreciation
-20% 677
538
12M14 12M15
12M14 12 M15 Change
Personnel 252,5 195,3 -23%
Raw material 168,7 119,7 -29%
Advertising, promotion and sponsorship 70,7 69,6 -2%
Transportation and travel 38,8 31,2 -20%
Other 146,2 122,0 -17%
Total Production and Operating Expense 676,9 537,8 -21%

5
All operating costs under strict control
Raw material costs (TL mn)
-29%
-68%
-24%
-28%
-55%
-23%
169
120
471
341
Production expenses (TL mn)
Number of pages 12M2014 12M2015
Main newspaper 36,3 36,2
Supplements 35,0 30,7
Cost 12M2014 12M2015
Paper Cost (USD/ton) 720 570
Consumption 12M2014 12M2015
Paper Consumption (K ton)* 56 46
Fx Rate 12M2014 12M2015
Average USD rate 2,19 2,72
*Paper consumption contains only Hürriyet Newspaper's
consumption
150 114
18
6
12M14 12M15
401 309
70
32
12M14 12M15
6
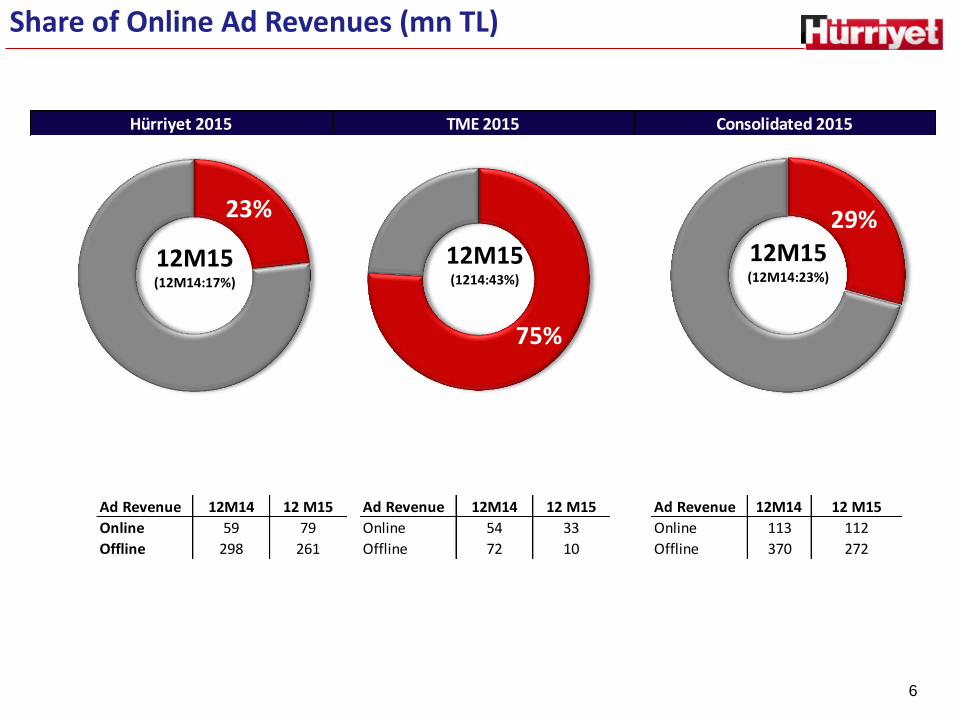
Share of Online Ad Revenues (mn TL)
12M15 (12M14:23%)
12M15 (12M14:17%)
12M15 (1214:43%)
Hürriyet 2015 TME 2015 Consolidated 2015
23%
75%
29%
Ad Revenue 12M14 12 M15
Online 113 112
Offline 370 272
Ad Revenue 12M14 12 M15
Online 59 79
Offline 298 261
Ad Revenue 12M14 12 M15
Online 54 33
Offline 72 10
7
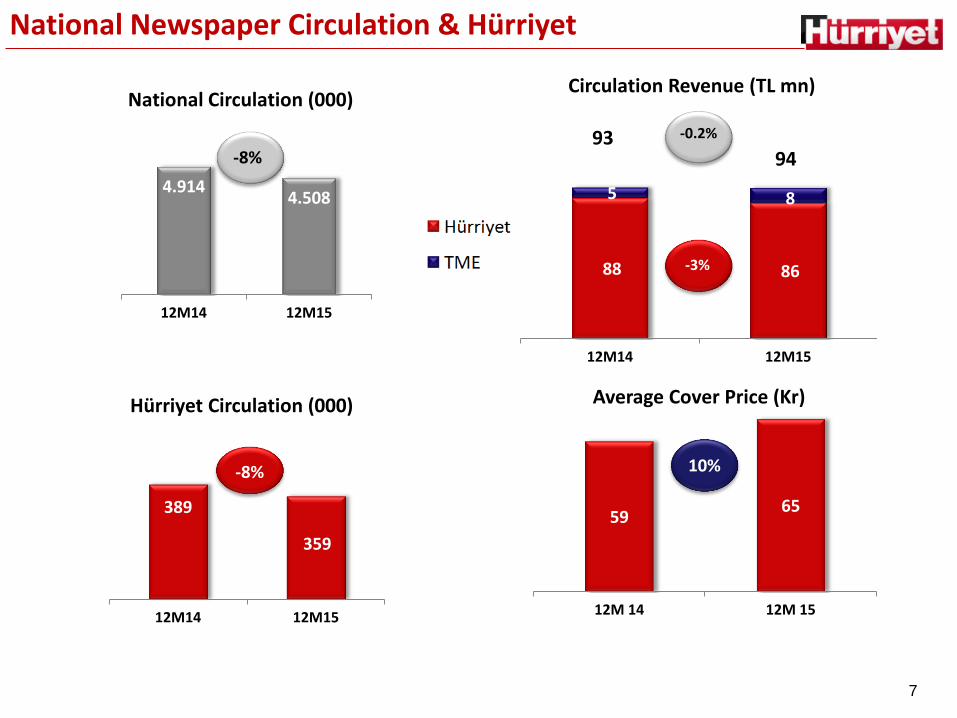
National Newspaper Circulation & Hürriyet
National Circulation (000)
Hürriyet Circulation (000)
-8%
-8% 10%
Average Cover Price (Kr)
Circulation Revenue (TL mn)
-0.2%
-31%
-3%
93 94
4.914 4.508
12M14 12M15
389
359
12M14 12M15
88 86
5 8
12M14 12M15
59 65
12M 14 12M 15

8
TME Standalone Financial Summary (IFRS, mn $)
Financial Summary (IFRS)
(US$ millions) 4Q15 4Q14
Change *
Org ch. **
2015 2014 Change *
Org ch. **
Revenue 3,9 12,6 (69,0%) (65,3%) 21,4 63,3 (66,2%) (50,2%)
Russia 2,7 9,8 (72,4%) (69,1%) 15,7 51,8 (69,7%) (53,3%)
CIS 1,2 2,8 (57,1%) (47,4%) 5,7 11,5 (50,4%) (34,7%)
Operating EBITDA (0,4) (0.7) (42,9%) (3,4) (0,5)
- Corporate Cost (0,0) (0,7) (100%) (0,4) (1,0) (60,0%)
Consolidated EBITDA (0,4) (1,4) (3,8) (1,5)
Net (loss)/profit from continuing operations
0,2 (42,7) (13,6) (64,2)
Operating EBITDA Margin % (12,1)% (5,6%)
(15,0%) (0,8%)
Consolidated EBITDA Margin % (12,1%) (11,1%)
(18,9%) (2,4%)
(US$ millions) 4Q15 4Q14
Change *
Org ch. **
2015 2014
Change *
Org ch. **
Online Revenue 2,2 5,7 (61,4%) (48,3%) 11,6 25,2 (54,0%) (50,2%)
Share of total revenue 66,7% 45,2% 54,2% 39,8%
*Change: Change is calculated in USD terms. **Organic change: Change in local currency terms, including only continuing operations.
9
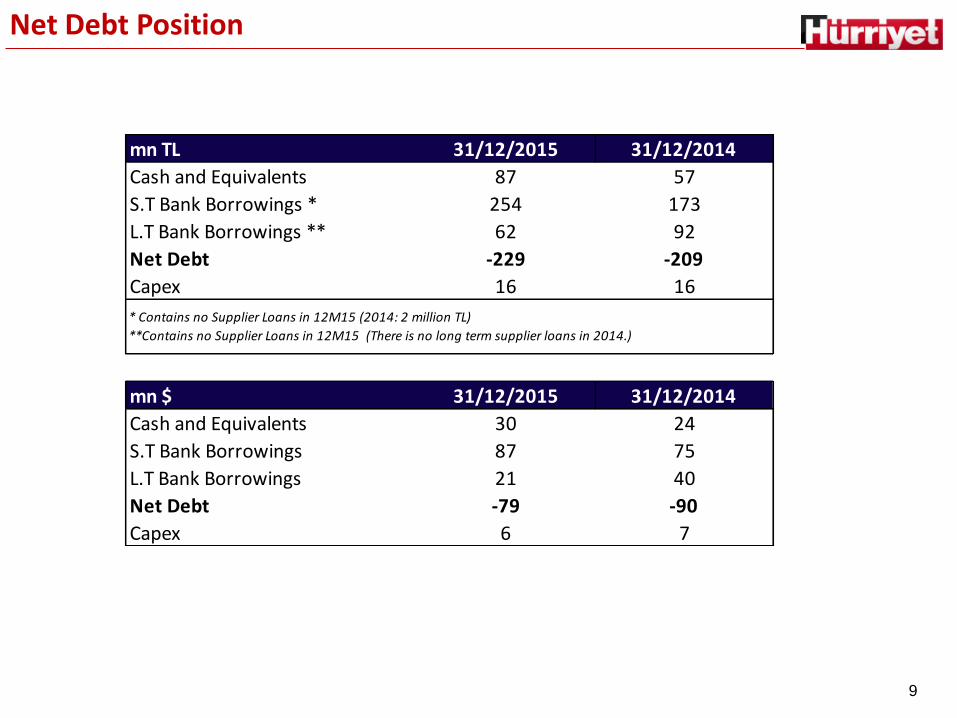
Net Debt Position
mn TL 31/12/2015 31/12/2014
Cash and Equivalents 87 57
S.T Bank Borrowings * 254 173
L.T Bank Borrowings ** 62 92
Net Debt -229 -209
Capex 16 16
mn $ 31/12/2015 31/12/2014
Cash and Equivalents 30 24
S.T Bank Borrowings 87 75
L.T Bank Borrowings 21 40
Net Debt -79 -90
Capex 6 7
* Contains no Supplier Loans in 12M15 (2014: 2 million TL)
**Contains no Supplier Loans in 12M15 (There is no long term supplier loans in 2014.)

10
Appendix
11
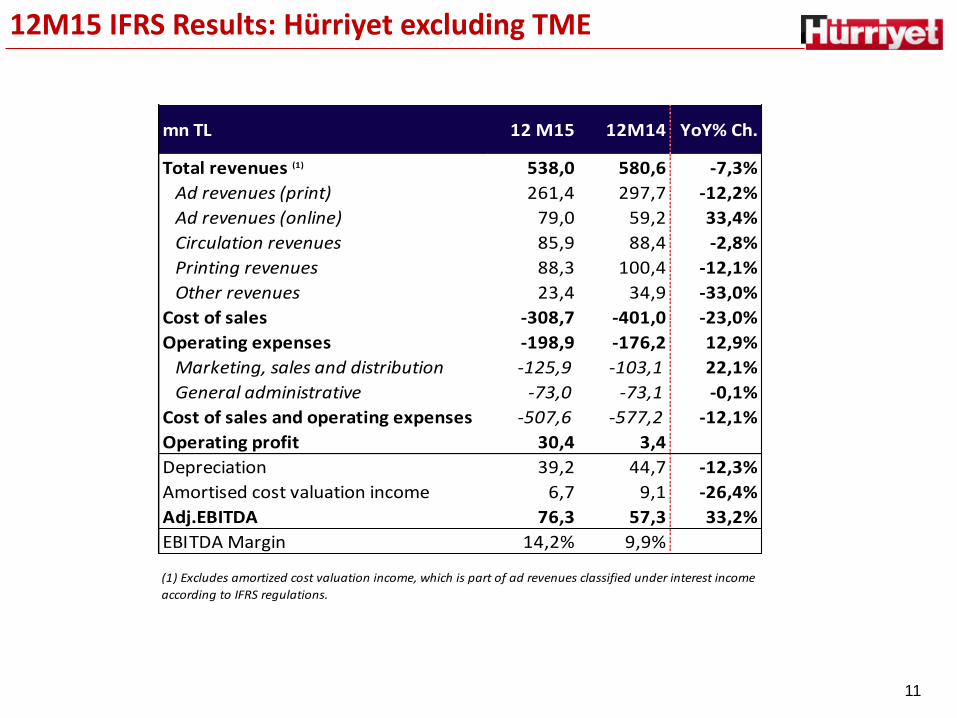
12M15 IFRS Results: Hürriyet excluding TME
mn TL 12 M15 12M14 YoY% Ch.
Total revenues (1) 538,0 580,6 -7,3%
Ad revenues (print) 261,4 297,7 -12,2%
Ad revenues (online) 79,0 59,2 33,4%
Circulation revenues 85,9 88,4 -2,8%
Printing revenues 88,3 100,4 -12,1%
Other revenues 23,4 34,9 -33,0%
Cost of sales -308,7 -401,0 -23,0%
Operating expenses -198,9 -176,2 12,9%
Marketing, sales and distribution -125,9 -103,1 22,1%
General administrative -73,0 -73,1 -0,1%
Cost of sales and operating expenses -507,6 -577,2 -12,1%
Operating profit 30,4 3,4
Depreciation 39,2 44,7 -12,3%
Amortised cost valuation income 6,7 9,1 -26,4%
Adj.EBITDA 76,3 57,3 33,2%
EBITDA Margin 14,2% 9,9%
(1) Excludes amortized cost valuation income, which is part of ad revenues classified under interest income
according to IFRS regulations.

12
12M15 Consolidated IFRS Results
mn TL 12M15 12M14YoY%
Ch.
Total revenues 596,1 719,6 -17,2%
Ad revenues (print) 271,7 370,0 -26,6%
Ad revenues (online) 111,7 113,3 -1,4%
Circulation revenues 93,7 93,8 -0,1%
Printing revenues 88,3 100,4 -12,1%
Other revenues 30,7 42,1 -27,1%
Cost of sales -340,7 -471,4 -27,7%
Operating expenses -254,1 -275,2 -7,7%
Marketing, sales and distribution -140,9 -134,3 4,9%
General administrative -113,2 -140,9 -19,7%
Operating profit 1,3 -27,0 N/A
Other operating expenses (net) -30,9 -39,8 N/A
Income/loss from investments -2,7 -2,5 8,0%
Financial expense (net) -22,1 -129,7 -83,0%
Profit before tax -54,5 -198,9 N/A
Tax 5,9 -3,2 N/A
Net profit before minority -48,6 -202,1 N/A
Minority Interest 18,1 33,5 -46,0%
Profit/loss from discontinued op. 0,0 0,0 0,0%
Net profit -30,5 -168,7 N/A
Depreciation 57,0 69,8 -18,3%
Amortised cost valuation income 6,7 9,1 -26,4%
Adj.EBITDA 65,0 51,8 25,5%
EBITDA Margin 10,9% 7,2%
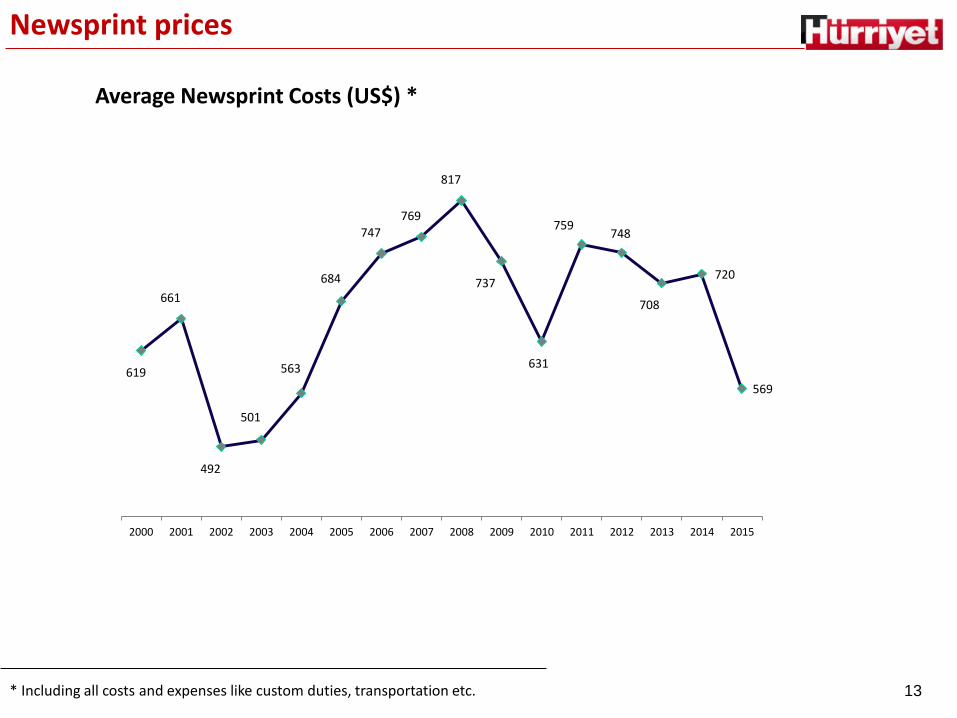
13 * Including all costs and expenses like custom duties, transportation etc.
Newsprint prices
Average Newsprint Costs (US$) *
619
661
492
501
563
684
747
769
817
737
631
759 748
708
720
569
2000 2001 2002 2003 2004 2005 2006 2007 2008 2009 2010 2011 2012 2013 2014 2015

14
Hürriyet’s major advertisers
Sectors 2014 2015
Real Estate 16% 15%
Social 9% 12%
Tourism 9% 11%
Retail 11% 10%
Automotive 6% 6%
Classifieds 5% 5%
Education 4% 5%
Finance 5% 5%
Entertainment, Culture, art & sports 3% 3%
First 10 Total 69% 71%
Others 31% 29%

15
Notice
• This presentation does not constitute an offer or invitation to purchase or subscription for any
securities and no part of it shall form the basis of or be relied upon in connection with any contract or
commitment whatsoever.
• The information contained in this document has not been independently verified. No representation
or warranty express or implied is made as to and no reliance should be placed on, the accuracy,
completeness, correctness or fairness of the information or opinions contained herein. Neither the
company nor any of its affiliates, advisors or representatives shall have any liability whatsoever (for
negligence or otherwise) with respect to any loss howsoever arising from any use by third parties of this
presentation or its contents or otherwise arising in connection with it.
• Turkish ad market figures are estimates of DOHOL; based on currently available data. Ad market
statistics may show inconsistency with IFRS figures.
16
Investor Contact
http://www.hurriyetcorporate.com
http://www.doganholding.com.tr
http://www.tmeast.com
(90) 212 449 6030