review of agricultural and applied economics raae the ...the successor of the acta oeconomica et...
TRANSCRIPT
Review of Agricultural and Applied Economics The Successor of the Acta Oeconomica et Informatica
ISSN 1336-9261, XX (Number 1, 2017): 31–38
doi: 10.15414/raae/2017.20.01.31-38
RAAE REGULAR ARTICLE
TRADE COMPETITIVENESS IN GLOBAL TROPICAL FRUITS
Alieu GIBBA Address:
Doctoral School of Management & Business Administration Sciences, Faculty of Economics & Social Sciences,
Institute of Economics, Law, & Methodology, Szent Istvan University, H-2100 Godollo, Pater Karoly u. 1. Hungary
E-mail: [email protected]
ABSTRACT
Trade in agricultural commodity has significantly played a vital role in world’s economic growth and development.
Drawing its strength from the agricultural industry, such important roles include contribution to quality food production,
job creation, foreign exchange earnings, and industrial inputs. The objective of the article was to examine trade
competitiveness and revealed comparative advantages of global tropical fruits and to measure the stability and duration
of Balassa indices by applying Kaplan-Meier survival function and Markov transition probability matrices. Results
reveal that Spain, Ecuador, and The United States were the main exporters of the examined tropical fruits in the periods
evaluated, together giving 29% of all products exported. The top10 countries, therefore, consisted 60% of concentration,
dominated by fresh or dried banana, including plantains, which constitutes more than 25% of trade, followed by fresh
apples which represents more 18% of the total tropical fruits trade for all the periods. The Balassa indices, however,
were the highest for Costa Rica and Ecuador. Typically, comparative advantages seem to diminish for most of the
countries as manifested by the stability tests and mobility indices.
Keywords: Balassa, comparative advantage, growth, export, stability
JEL: R52, R58, H41
INTRODUCTION
Trade in agricultural commodity has significantly played
a vital role in world’s economic growth and poverty
eradication. Thus, Food and Agriculture Organization
assumptions “In order to meet the demand for food in
2050, annual world production of crops and livestock will
need to be 60 percent higher than it was in 2006” (FAO,
2016, p.1). Drawing its strength from the agricultural
industry, such important roles include contribution to
quality food production, job creation, foreign exchange
earnings, and industrial inputs (Nwachukwu et, al.,
2014). Boansi et, al. (2014) assessed the revitalization of
pineapple export industry of Ghana following its decline
in both volumes and value since 2004. The findings of
their study disclosed that there was competitive advantage
in Ghana’s fresh pineapple export industry which is more
price-driven than volume driven. A positive correlation
exists for both value and volume of exports with
production, the index of competitiveness and trade
liberalization. The policy implications of their findings
was mainly centred on high productivity, openness to
trade, and improved quality products for global
competitiveness.
Adegbite et, al. (2014) analyse the comparative
advantage and competitiveness of pineapple production in
Osun State, Nigeria. The authors applied a technique of
Multistage Sampling in choosing 120 respondents within
the study area, using both primary and desk-research data.
The data were then examined using descriptive statistics
and Policy Analysis Matrix (PAM). Their concluding
results revealed that both techniques assessed were more
profitable at individual and social level, and the system of
pineapple production applying ‘sucker technique’ was
more competitive and had a higher comparative advantage
than that of ‘crown technique’. Muhamad (2014)
investigates Malaysian pineapple comparative advantage
and competitiveness in the global market by applying the
Concentration Ratio, Herfindahl Index, and Porter's
Diamond Theory. The research findings reveal a
production instability and comparative disadvantage in the
pineapple global market, unlike Costa Rica which was
found to be the leading competitive country in exporting
pineapple and many other tropical fruits.
Suresh & Mathur (2016) evaluated the export
tendency of agricultural commodities from India during
the past decade and found a significant improvement in the
share in total export of agricultural commodities
constituted by a shift in commodity composition. Their
study identifies that the share in total export has
diminished in some commodities; fish and marine
products, fruits and nuts and coffee and tea, and a
significant increase was realized in the case of cotton,
spices, guargum, sugar, and cereals (basmati rice and
maize). However, there was an improvement in
comparative advantage in certain fruits and vegetables but
a decline in some plantation crops, wheat, and rice.
El Hag (2014) analyses the comparative advantage
and export competitiveness of Sudanese mango exports
and found that there was comparative advantage in the
mango export industry. Additionally, the results further
revealed an instability in exports caused by the direct and
indirect taxes imposed on the mango exports which
resulted to a reduction in financial profitability. The theory
of export competitiveness and comparative advantage
have been long addressed in national and international

RAAE / Gibba, 2017: 20 (1) 31-38, doi: 10.15414/raae.2017.20.01.31-38
32
studies (Şahinli & Mehmet, 2013). Some of which are:
Karakaya and Özgen (2002), Yılmaz (2003), Altay and
Gacaner (2003), Hillman (1980), Bowen (1983),
Balassa (1965), Balassa (1986), Richardson & Zhang
(2001), Kojima (1970), Yue (2001), and Hinloopen &
Marrewijket (2004), Weiss, (2004), Balassa (1977),
Bender and Li (2002).
The article assesses export competitiveness and
revealed comparative advantages in global tropical fruits
trade. It therefore, commits to the existing literature in the
following ways: First, it applies the theory of revealed
comparative advantages on a specific tropical product
groups. Second, it evaluates products which are significant
from a development economic prospect as tropical fruits
are produced and exported by developing countries mainly
from Africa. It is also important to note, as first elucidated
in the early 1800s by David Ricardo, that a country can
have an absolute advantage in the production of a good
without having a comparative advantage. According to
him, “Comparative advantage is what determines whether
it pays to produce a good or import it....”.
DATA AND METHODS
The research is based on the seminal work of Balassa
(1965) in terms of scientific methods. Balassa’s
measurement of comparative trade advantage is calculated
by different index numbers based on the concept of
Ricardian trade theory. The original index of revealed
comparative advantage is defined by Eq. 1 (Balassa
1965).
𝐵𝑖𝑗 = 𝑅𝐶𝐴𝑖𝑗 = (𝑋𝑖𝑗
𝑋𝑖𝑡) (
𝑋𝑛𝑗
𝑋𝑛𝑡)⁄ (1)
where:
X means export, i indicates a given country, j is a given
product, t is a group of products and n is a group of
countries. It follows that a revealed comparative
advantage (or disadvantage) index of exports can be
calculated by comparing a given country’s export share of
its total exports with the export share in total exports of a
reference group of countries. If the value of B-index is
higher than 1, a given country has a comparative
advantage compared to the reference countries or, in
contrast, a revealed comparative disadvantage if B-index
is less than 1. The source of data is global tropical fruits
exports at HS6 level for 1996-2015.
The Balassa-index (B-index) is widely criticised
because it usually ignores the different effects of
agricultural policies and exhibits asymmetric values.
Trade structure is distorted by different state interventions
and trade limitations while the asymmetric value of the B-
index reveals that it extends from one to infinity if a
country enjoys a comparative advantage, but in the case of
comparative disadvantage, it varies between zero and one,
which overestimates a sector’s relative weight. However,
there are many other specifications of the revealed
comparative advantage (RCA) index available – see
Vollrath (1991); Fertö & Hubbard (2003); Utkulu &
Seymen (2004) for more details.
Furthermore, the paper also analyses the stability and
duration of the RCA index in two steps by employing
STATA software. First, Markov transition probability
matrices are calculated and then summarized by using the
mobility index, evaluating the mobility across countries
and time. Second, following Bojnec and Fertő (2008), a
survival function S(t) can be estimated for by the use of
the non-parametric Kaplan–Meier product limit estimator,
which pertains to the product level distribution analysis of
the RSCA index. Following Bojnec and Fertő (2008), a
sample contains n independent observations denoted (ti;
ci), where i = 1, 2 , . . . , n, and ti is the survival time, while
ci is the censoring indicator variable C (taking on a value
of 1 if a failure occurred, and 0 otherwise) of observation
i. Moreover, it is assumed that there are m < n recorded
times of failure. Then, we denote the rank-ordered survival
times as t(1) < t(2) < … < t(m). Let nj indicate the number
of subjects at risk of failing at t(j) and let dj denote the
number of observed failures. With the convention that
�̂�(𝑡) = 1 if 𝑡 < 𝑡(1),
the Kaplan–Meier estimator of the survival function is
represented by Eq. 2.
�̂�(𝑡) = ∏𝑛𝑗−𝑑𝑗
𝑛𝑗𝑡𝑖<𝑡 (2)
The article employs global tropical fruits trade data of
World Bank (2016) World Integrated Trade Solution
(WITS) database at HS-6 level between 1996 and 2015
with the following product codes included: 080300,
080430, 080450, 080510, 080520, 080530,080540,
080710, 080720, and 080810. It focuses on the export side
of the revealed comparative advantage index (B or RCA
index) to exclude imports analysis, which is more likely to
be influenced by agricultural policy interventions.
RESULTS AND DISCUSSION
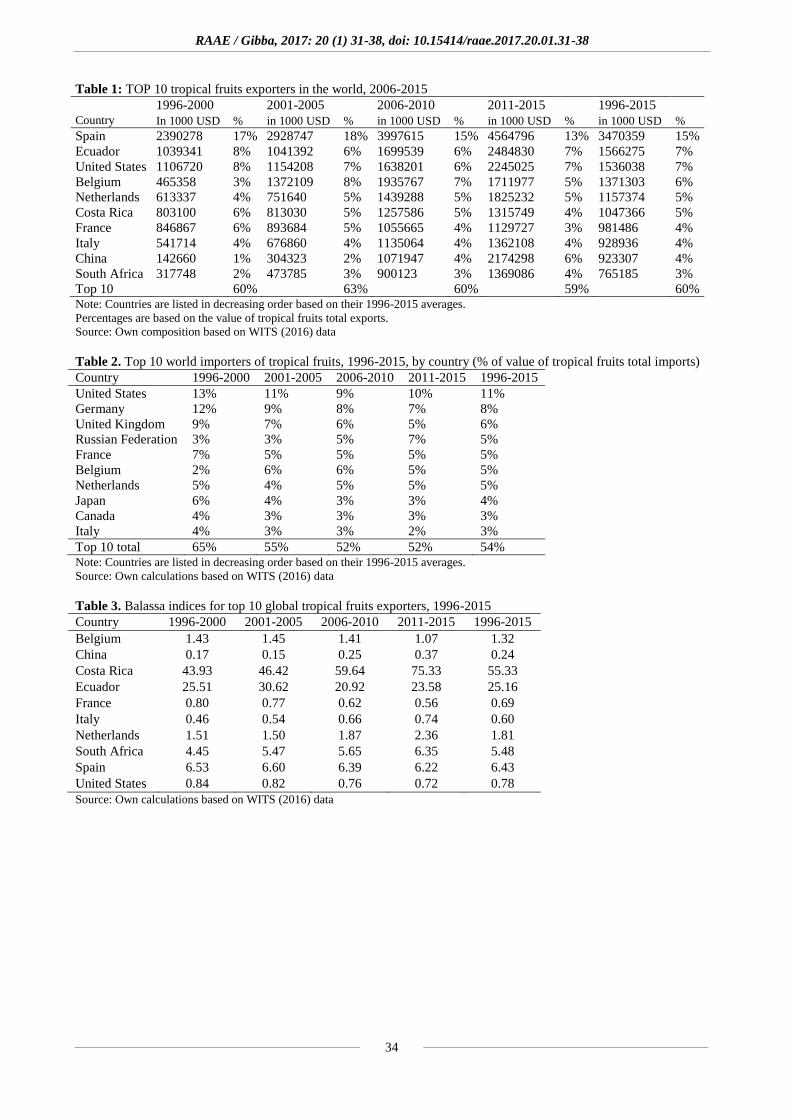
It could be observed that Spain, Ecuador, and The United
States were the major exporters of global tropical fruits in
the periods assessed, accounting for 29% of all the
exported products from 1996-2015 (Table 1).
Consequently, the top 10 countries displayed a
concentration of 60% from 1996–2015 (Table 1).
Moreover, between the periods 1996-2000, 2001–2005,
2006–2010, and 2011–2015, Spain, Ecuador, The United
States, Belgium, Netherlands, Costa Rica, France, Italy,
China, and South Africa, constituted 60%, 63%, 60%, and
59% of global total exports of tropical fruits products
respectively.
As for the global tropical imports, The United States,
which was the 3rd main exporter of tropical fruits, is the
leading importer of the same products (Table 2). France,
Belgium, Netherlands, and Italy, four of the major
exporters of tropical fruits, are the 5th, 6th, 7th, and 10th
countries in global tropical fruits imports. These countries
import in excess for consumption and re-export most of
the products to earn them foreign exchange. The United
Kingdom, Russian Federation, Japan, and Canada were
also among the world major importers of tropical fruits,
suggesting high levels of tropical fruits consumption. It is
paramount to note that concentration of the 10 major
RAAE / Gibba, 2017: 20 (1) 31-38, doi: 10.15414/raae.2017.20.01.31-38
33
importers of tropical fruits were 65%, 55%, 52% and 52%
in the sub-periods estimated, respectively (Table 2).
Meanwhile, The United States, Germany, and The United
Kingdom were the main importers of the selected global
tropical fruits in the analysed periods, accounting for 25%
of all the products exported from 1996-2015 (Table 2).
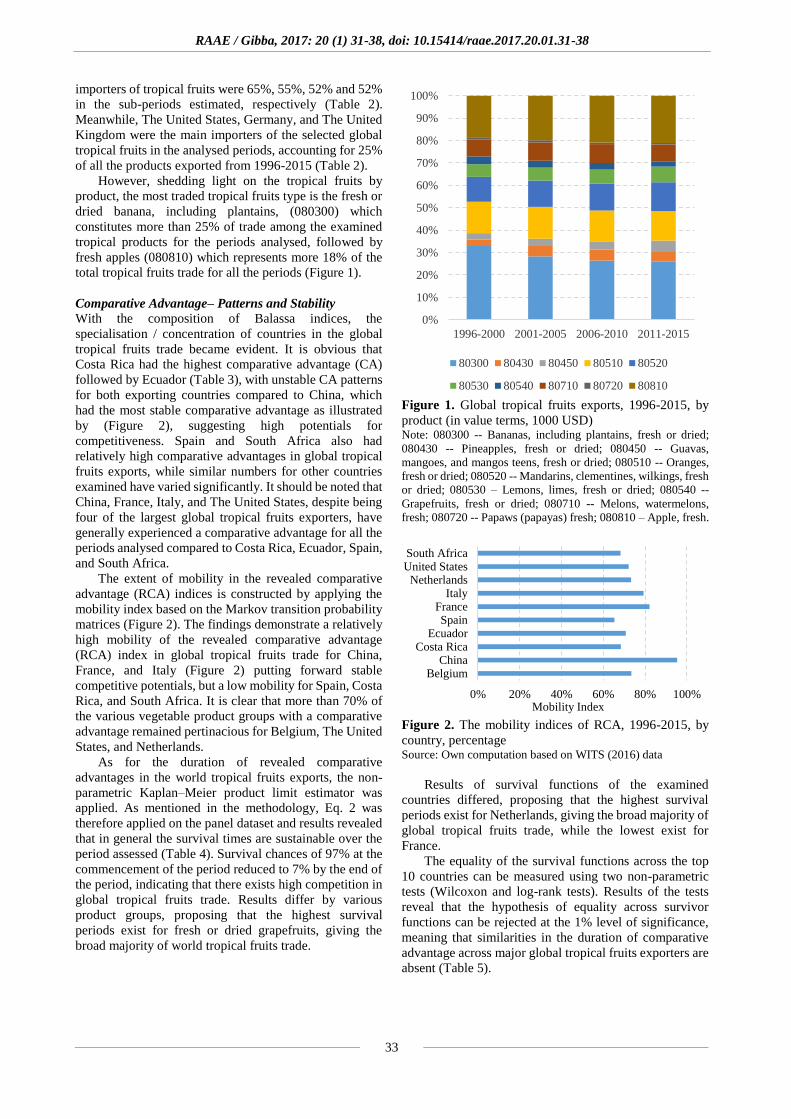
However, shedding light on the tropical fruits by
product, the most traded tropical fruits type is the fresh or
dried banana, including plantains, (080300) which
constitutes more than 25% of trade among the examined
tropical products for the periods analysed, followed by
fresh apples (080810) which represents more 18% of the
total tropical fruits trade for all the periods (Figure 1).
Comparative Advantage– Patterns and Stability
With the composition of Balassa indices, the
specialisation / concentration of countries in the global
tropical fruits trade became evident. It is obvious that
Costa Rica had the highest comparative advantage (CA)
followed by Ecuador (Table 3), with unstable CA patterns
for both exporting countries compared to China, which
had the most stable comparative advantage as illustrated
by (Figure 2), suggesting high potentials for
competitiveness. Spain and South Africa also had
relatively high comparative advantages in global tropical
fruits exports, while similar numbers for other countries
examined have varied significantly. It should be noted that
China, France, Italy, and The United States, despite being
four of the largest global tropical fruits exporters, have
generally experienced a comparative advantage for all the
periods analysed compared to Costa Rica, Ecuador, Spain,
and South Africa.
The extent of mobility in the revealed comparative
advantage (RCA) indices is constructed by applying the
mobility index based on the Markov transition probability
matrices (Figure 2). The findings demonstrate a relatively
high mobility of the revealed comparative advantage
(RCA) index in global tropical fruits trade for China,
France, and Italy (Figure 2) putting forward stable
competitive potentials, but a low mobility for Spain, Costa
Rica, and South Africa. It is clear that more than 70% of
the various vegetable product groups with a comparative
advantage remained pertinacious for Belgium, The United
States, and Netherlands.
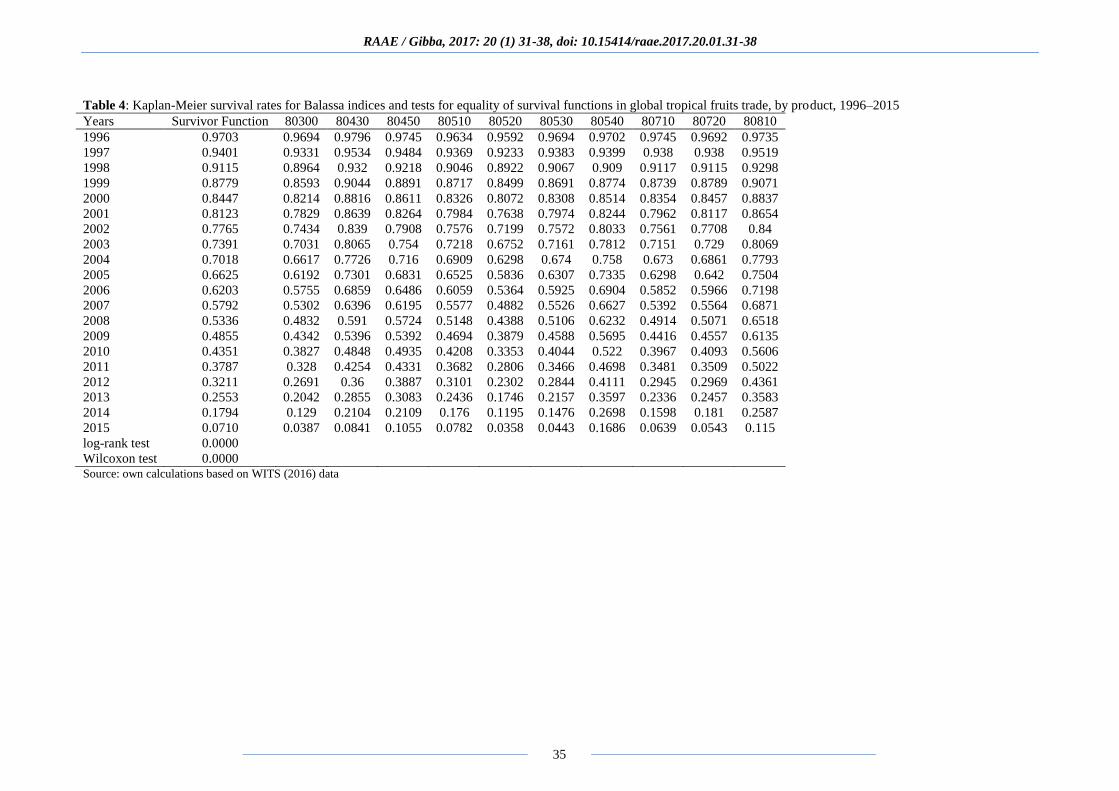
As for the duration of revealed comparative
advantages in the world tropical fruits exports, the non-
parametric Kaplan–Meier product limit estimator was
applied. As mentioned in the methodology, Eq. 2 was
therefore applied on the panel dataset and results revealed
that in general the survival times are sustainable over the
period assessed (Table 4). Survival chances of 97% at the
commencement of the period reduced to 7% by the end of
the period, indicating that there exists high competition in
global tropical fruits trade. Results differ by various
product groups, proposing that the highest survival
periods exist for fresh or dried grapefruits, giving the
broad majority of world tropical fruits trade.
Figure 1. Global tropical fruits exports, 1996-2015, by
product (in value terms, 1000 USD) Note: 080300 -- Bananas, including plantains, fresh or dried;
080430 -- Pineapples, fresh or dried; 080450 -- Guavas,
mangoes, and mangos teens, fresh or dried; 080510 -- Oranges,
fresh or dried; 080520 -- Mandarins, clementines, wilkings, fresh
or dried; 080530 – Lemons, limes, fresh or dried; 080540 --
Grapefruits, fresh or dried; 080710 -- Melons, watermelons,
fresh; 080720 -- Papaws (papayas) fresh; 080810 – Apple, fresh.
Figure 2. The mobility indices of RCA, 1996-2015, by
country, percentage Source: Own computation based on WITS (2016) data
Results of survival functions of the examined
countries differed, proposing that the highest survival
periods exist for Netherlands, giving the broad majority of
global tropical fruits trade, while the lowest exist for
France.
The equality of the survival functions across the top
10 countries can be measured using two non-parametric
tests (Wilcoxon and log-rank tests). Results of the tests
reveal that the hypothesis of equality across survivor
functions can be rejected at the 1% level of significance,
meaning that similarities in the duration of comparative
advantage across major global tropical fruits exporters are
absent (Table 5).
0%
10%
20%
30%
40%
50%
60%
70%
80%
90%
100%
1996-2000 2001-2005 2006-2010 2011-2015
80300 80430 80450 80510 80520
80530 80540 80710 80720 80810
0% 20% 40% 60% 80% 100%
BelgiumChina
Costa RicaEcuador
SpainFrance
ItalyNetherlands
United StatesSouth Africa
Mobility Index
RAAE / Gibba, 2017: 20 (1) 31-38, doi: 10.15414/raae.2017.20.01.31-38
34
Table 1: TOP 10 tropical fruits exporters in the world, 2006-2015
1996-2000 2001-2005 2006-2010 2011-2015 1996-2015 Country In 1000 USD % in 1000 USD % in 1000 USD % in 1000 USD % in 1000 USD %
Spain 2390278 17% 2928747 18% 3997615 15% 4564796 13% 3470359 15%
Ecuador 1039341 8% 1041392 6% 1699539 6% 2484830 7% 1566275 7%
United States 1106720 8% 1154208 7% 1638201 6% 2245025 7% 1536038 7%
Belgium 465358 3% 1372109 8% 1935767 7% 1711977 5% 1371303 6%
Netherlands 613337 4% 751640 5% 1439288 5% 1825232 5% 1157374 5%
Costa Rica 803100 6% 813030 5% 1257586 5% 1315749 4% 1047366 5%
France 846867 6% 893684 5% 1055665 4% 1129727 3% 981486 4%
Italy 541714 4% 676860 4% 1135064 4% 1362108 4% 928936 4%
China 142660 1% 304323 2% 1071947 4% 2174298 6% 923307 4%
South Africa 317748 2% 473785 3% 900123 3% 1369086 4% 765185 3%
Top 10 60% 63% 60% 59% 60% Note: Countries are listed in decreasing order based on their 1996-2015 averages.
Percentages are based on the value of tropical fruits total exports.
Source: Own composition based on WITS (2016) data
Table 2. Top 10 world importers of tropical fruits, 1996-2015, by country (% of value of tropical fruits total imports)
Country 1996-2000 2001-2005 2006-2010 2011-2015 1996-2015
United States 13% 11% 9% 10% 11%
Germany 12% 9% 8% 7% 8%
United Kingdom 9% 7% 6% 5% 6%
Russian Federation 3% 3% 5% 7% 5%
France 7% 5% 5% 5% 5%
Belgium 2% 6% 6% 5% 5%
Netherlands 5% 4% 5% 5% 5%
Japan 6% 4% 3% 3% 4%
Canada 4% 3% 3% 3% 3%
Italy 4% 3% 3% 2% 3%
Top 10 total 65% 55% 52% 52% 54% Note: Countries are listed in decreasing order based on their 1996-2015 averages.
Source: Own calculations based on WITS (2016) data
Table 3. Balassa indices for top 10 global tropical fruits exporters, 1996-2015
Country 1996-2000 2001-2005 2006-2010 2011-2015 1996-2015
Belgium 1.43 1.45 1.41 1.07 1.32
China 0.17 0.15 0.25 0.37 0.24
Costa Rica 43.93 46.42 59.64 75.33 55.33
Ecuador 25.51 30.62 20.92 23.58 25.16
France 0.80 0.77 0.62 0.56 0.69
Italy 0.46 0.54 0.66 0.74 0.60
Netherlands 1.51 1.50 1.87 2.36 1.81
South Africa 4.45 5.47 5.65 6.35 5.48
Spain 6.53 6.60 6.39 6.22 6.43
United States 0.84 0.82 0.76 0.72 0.78
Source: Own calculations based on WITS (2016) data
RAAE / Gibba, 2017: 20 (1) 31-38, doi: 10.15414/raae.2017.20.01.31-38
35
Table 4: Kaplan-Meier survival rates for Balassa indices and tests for equality of survival functions in global tropical fruits trade, by product, 1996–2015
Years Survivor Function 80300 80430 80450 80510 80520 80530 80540 80710 80720 80810
1996 0.9703 0.9694 0.9796 0.9745 0.9634 0.9592 0.9694 0.9702 0.9745 0.9692 0.9735
1997 0.9401 0.9331 0.9534 0.9484 0.9369 0.9233 0.9383 0.9399 0.938 0.938 0.9519
1998 0.9115 0.8964 0.932 0.9218 0.9046 0.8922 0.9067 0.909 0.9117 0.9115 0.9298
1999 0.8779 0.8593 0.9044 0.8891 0.8717 0.8499 0.8691 0.8774 0.8739 0.8789 0.9071
2000 0.8447 0.8214 0.8816 0.8611 0.8326 0.8072 0.8308 0.8514 0.8354 0.8457 0.8837
2001 0.8123 0.7829 0.8639 0.8264 0.7984 0.7638 0.7974 0.8244 0.7962 0.8117 0.8654
2002 0.7765 0.7434 0.839 0.7908 0.7576 0.7199 0.7572 0.8033 0.7561 0.7708 0.84
2003 0.7391 0.7031 0.8065 0.754 0.7218 0.6752 0.7161 0.7812 0.7151 0.729 0.8069
2004 0.7018 0.6617 0.7726 0.716 0.6909 0.6298 0.674 0.758 0.673 0.6861 0.7793
2005 0.6625 0.6192 0.7301 0.6831 0.6525 0.5836 0.6307 0.7335 0.6298 0.642 0.7504
2006 0.6203 0.5755 0.6859 0.6486 0.6059 0.5364 0.5925 0.6904 0.5852 0.5966 0.7198
2007 0.5792 0.5302 0.6396 0.6195 0.5577 0.4882 0.5526 0.6627 0.5392 0.5564 0.6871
2008 0.5336 0.4832 0.591 0.5724 0.5148 0.4388 0.5106 0.6232 0.4914 0.5071 0.6518
2009 0.4855 0.4342 0.5396 0.5392 0.4694 0.3879 0.4588 0.5695 0.4416 0.4557 0.6135
2010 0.4351 0.3827 0.4848 0.4935 0.4208 0.3353 0.4044 0.522 0.3967 0.4093 0.5606
2011 0.3787 0.328 0.4254 0.4331 0.3682 0.2806 0.3466 0.4698 0.3481 0.3509 0.5022
2012 0.3211 0.2691 0.36 0.3887 0.3101 0.2302 0.2844 0.4111 0.2945 0.2969 0.4361
2013 0.2553 0.2042 0.2855 0.3083 0.2436 0.1746 0.2157 0.3597 0.2336 0.2457 0.3583
2014 0.1794 0.129 0.2104 0.2109 0.176 0.1195 0.1476 0.2698 0.1598 0.181 0.2587
2015 0.0710 0.0387 0.0841 0.1055 0.0782 0.0358 0.0443 0.1686 0.0639 0.0543 0.115
log-rank test 0.0000
Wilcoxon test 0.0000
Source: own calculations based on WITS (2016) data

RAAE / Gibba, 2017: 20 (1) 31-38, doi: 10.15414/raae.2017.20.01.31-38
36
Table 5: Kaplan-Meier survival rates for Balassa indices and tests for equality of survival functions in global tropical fruits trade, by country, 1996–2015
Years Survivor Function Belgium China C/Rica Ecuador Spain France Italy Netherlands USA S/ Africa
1996 0.9703 1.055 0.9497 0.9721 0.9708 0.975 0.96 0.955 0.98 0.96 0.985
1997 0.9401 1.0249 0.899 0.943 0.9468 0.944 0.919 0.909 0.9594 0.924 0.964
1998 0.9115 0.9948 0.849 0.913 0.9224 0.912 0.878 0.864 0.9487 0.888 0.953
1999 0.8779 0.9647 0.804 0.883 0.8973 0.880 0.837 0.818 0.932 0.846 0.936
2000 0.8447 0.9346 0.753 0.851 0.8652 0.853 0.795 0.772 0.9145 0.815 0.919
2001 0.8123 0.8972 0.703 0.818 0.852 0.830 0.753 0.726 0.8962 0.782 0.900
2002 0.7765 0.8587 0.653 0.790 0.8245 0.806 0.71 0.679 0.877 0.737 0.875
2003 0.7391 0.8191 0.603 0.762 0.789 0.775 0.666 0.632 0.8635 0.692 0.848
2004 0.7018 0.7781 0.552 0.731 0.7669 0.743 0.621 0.585 0.8491 0.646 0.819
2005 0.6625 0.7357 0.502 0.7 0.7285 0.709 0.576 0.537 0.8337 0.605 0.79
2006 0.6203 0.6916 0.452 0.657 0.6885 0.674 0.530 0.488 0.8087 0.562 0.758
2007 0.5792 0.6531 0.402 0.621 0.646 0.644 0.483 0.439 0.7907 0.519 0.724
2008 0.5336 0.6041 0.351 0.582 0.5922 0.603 0.429 0.395 0.7709 0.473 0.688
2009 0.4855 0.5524 0.306 0.529 0.5349 0.569 0.373 0.345 0.7489 0.426 0.649
2010 0.4351 0.4787 0.255 0.482 0.4834 0.531 0.317 0.299 0.7239 0.376 0.616
2011 0.3787 0.4021 0.204 0.429 0.4272 0.488 0.260 0.251 0.695 0.323 0.555
2012 0.3211 0.3317 0.158 0.365 0.3644 0.439 0.201 0.200 0.6602 0.267 0.513
2013 0.2553 0.2433 0.116 0.284 0.2915 0.395 0.141 0.147 0.6162 0.204 0.444
2014 0.1794 0.146 0.063 0.221 0.2004 0.356 0.077 0.088 0.5238 0.133 0.356
2015 0.0710 0.0292 0.012 0.158 0.1145 0.213 0.007 0.017 0.3666 0.039 0.213
log-rank test 0.0000
Wilcoxon test 0.0000
Source: own calculations based on WITS (2016) data
RAAE / Gibba, 2017: 20 (1) 31-38, doi: 10.15414/raae.2017.20.01.31-38
37
CONCLUSION
One of the major determinants and most important source
of foreign exchange earnings in an economy is the
performance of the agricultural export sector. Fruition in
this sector has always attracted the policy makers’
attention, diversified crops, and improved farm income.
The article assesses the export competitiveness and
revealed comparative advantage of tropical fruits in world
trade, buttressing special attention to its duration and
stability. It has concluded in several ways. first, by
assessing the characteristics of global tropical fruits trade,
it has been observed that Spain, Ecuador, and the United
States were the major exporters of the selected tropical
fruits in the periods examined, together constituting 29%
of all products exported. The top10 countries, however,
consisted 60% of concentration. On the other hand, the
United States, Germany and the United Kingdom were the
major importers, mainly for consumption and re-exporting
purposes.
Second, the analysis has manifested that the most
traded tropical fruits type is the fresh or dried banana,
including plantains, (080300) which constitutes more than
25% of trade among the tropical products for the periods
analysed, followed by fresh apples (080810) which
represents more 18% of the total tropical fruits trade for
all the periods. Third, the computation of the Balassa
indices indicated that Costa Rica had the highest
comparative advantage followed by Ecuador, with
unstable ca patterns for both countries compared to china,
which had the most stable comparative advantage,
suggesting high potentials for specialisation and
competitiveness. Spain and South Africa also had
relatively high comparative advantages in global tropical
fruits exports, revealing stable competitive possibilities.
Lastly, according to survival tests, survival chances of
97% at the commencement of the period reduced to 7% by
the end of the period, showing a high competition that
exists among the global tropical fruits trade. The countries
with comparative disadvantages over the periods analysed
include: China, France, Italy and the United States. This
finding corresponds with the studies of (Muhamad,
2014). Countries with higher comparative advantages over
others like Costa Rica and Ecuador were the most efficient
in the production of the selected tropical fruits.
Export competitiveness policies are usually illustrated
as those that minimise cost of production, increase
revenue, and improve efficiency of the exporting
countries. As a result, policies that aim at increasing the
value, efficiency, and growth rate of exports can be
promoted and implemented. Also, foreign direct
investment (FDI) should be attracted as this has been
found to have a positive impact on export performance in
different countries by bringing in foreign exchange,
capital, technology and other important resources such as
market knowledge.
REFERENCES
ADEGBITE, O., ONI, O. and ADEOYE, I.
(2014). Competitiveness of pineapple production in Osun
State, Nigeria. Journal of Economics and Sustainable
Development Vol.5, No.2, 2014. www.iiste.org ISSN
2222-2855 (Online)
ALTAY, N. O. and GACANER, A. (2003): Turkey’s
Dynamics of Competition: A Comparative Analysis of
Competitiveness of the Textile and Clothing Industry.
In: International Economy Congress.
BALASSA, B. (1965). Trade liberalisation and “revealed”
comparative advantage1. The Manchester School, 33(2),
99-123. DOI: 10.1111/j.1467-9957.1965.tb00050.x
BALASSA, B. (1977). Revealed comparative advantage
revisited: An analysis of relative export shares of the
industrial countries, 1953–1971. The Manchester
School, 45(4), 327-344. DOI: 10.1111/j.1467-
9957.1977.tb00701.x
BALASSA, B. (1986). Comparative advantage in
manufactured goods: a reappraisal. The Review of
Economics and Statistics, 315-319. DOI:
10.2307/1925512
BENDER, S. and LI, K. W. (2002). The changing trade
and revealed comparative advantages of Asian and Latin
American manufacture exports. Yale Economic Growth
Center Discussion Paper, No.843. Available at SSRN:
https://ssrn.com/abstract=303259
BOANSI, D., ODILONKOUNAGBELOKONON, B. and
APPAH, J. (2014). Determinants of Agricultural Export
Trade: Case of Fresh Pineapple Exports from
Ghana. British Journal of Economics, Management &
Trade, 4(11), 1736-1754.
BOJNEC, Š. and FERTO, I. (2014). Agri-Food Export
Competitiveness in European Union Countries. Journal of
Common Market Studies, no. 3: 476–492. DOI:
10.1111/jcms.12215
BOWEN, H. P. (1983). On the theoretical interpretation of
indices of trade intensity and revealed comparative
advantage. Weltwirtschaftliches Archiv, 119(3), 464-472.
DOI: 10.1007/BF02706520
El HAG, S. E. H. A. (2014). Estimation of
Competitiveness of Sudanese Mango Fruits (Doctoral
dissertation, Sudan University of Science and
Technology). URI:
http://repository.sustech.edu/handle/123456789/10759
FERTO, I. and HUBBARD, L. J. (2003). Revealed
comparative advantage and competitiveness in Hungarian
agri–food sectors. The World Economy, 26(2), 247-259.
DOI: 10.1111/1467-9701.00520
FOOD AND AGRICULTURE ORGANISATION OF
THE UNITED NATIONS. (2016). Increasing the
resilience of agricultural livelihoods. Retrieved from
http://www.fao.org/3/a-i5615e.pdf
HILLMAN, A. L. (1980). Observations on the relation
between “revealed comparative advantage” and
comparative advantage as indicated by pre-trade relative
prices. Review of World Economics, 116(2), 315-321. DOI: 10.1007/BF02696859
RAAE / Gibba, 2017: 20 (1) 31-38, doi: 10.15414/raae.2017.20.01.31-38
38
HINLOOPEN, J. and VAN MARREWJIK, C. (2004).
Dynamics of Chinese comparative advantage.
http://dx.doi.org/10.2139/ssrn.524722
KARAKAYA, E. and OZGEN, F. B. (2002). Economic
Feasibility of Turkey's Economic Integration with the EU:
Perspectives from Trade Creation and Trade Diversion.
In International Economics Research Conference.
Available at SSRN: https://ssrn.com/abstract=1014031
KOJIMA, K. (1964). The pattern of international trade
among advanced countries. Hitotsubashi Journal of
Economics, 5(1), 16-36. URL:
http://www.jstor.org/stable/43295433
MUHAMMAD, Z. (2014). The Competitiveness of
Malaysian Pineapple in the Global Market. The 6th
International Conference on Postgraduate Education
(ICPE-6 2014), At UTEM Melaka.
NWACHUKWU, I. N., ONYENWEAKU, C. E.,
NWARU, J. C., MBANASOR, J. A. and DARAMOLA,
A. (2014). Competitiveness in the export demand for
Nigerian rubber. Journal of Agricultural Sciences, 9(1).
DOI: http://doi.org/10.4038/jas.v9i1.6348
RICHARDSON, J. D. and ZHANG, C. (2001). Revealing
comparative advantage: chaotic or coherent patterns
across time and sector and US trading partner? In Topics
in Empirical International Economics: A Festschrift in
Honor of Robert E. Lipsey (pp. 195-232). University of
Chicago Press. URL:
http://www.nber.org/chapters/c10583
ŞAHİNLİ, M. A. (2013). Comparative advantage of
agriculture sector between Turkey and European
Union. African Journal of Agricultural Research, 8(10),
884-895. DOI: 10.5897/AJAR12.2001
SURESH, A. and MATHUR, V. C. (2016). Export of
agricultural commodities from India: Performance and
prospects. Indian Journal of Agricultural Sciences 86 (7):
876–83, July 2016/Article
UTKULU, U. and SEYMEN, D. (2004). Revealed
Comparative Advantage and Competitiveness: Evidence
for Turkey vis-à-vis the EU/15. In European trade study
group 6th annual conference, ETSG.
VOLLRATH, T. L. (1991). A theoretical evaluation of
alternative trade intensity measures of revealed
comparative advantage. Weltwirtschaftliches
Archiv, 127(2), 265-280. DOI: 10.1007/BF02707986
WEISS, J. (2004). People's Republic of China and Its
Neighbours: Partners or Competitors for Trade and
Investment? Asian Development Bank Institute.
http://hdl.handle.net/11540/4166.
YILMAZ, B. (2003). Turkey’s competitiveness in the
European Union: a comparison with five candidate
countries–Bulgaria, the Czech Republic, Hungary,
Poland, Romania–and the EU15 (No. wp12). Free
University Berlin, Jean Monnet Centre of Excellence.
http://hdl.handle.net/10419/22128
YUE, C. (2001). Comparative advantage, exchange rate
and exports in China. A paper prepared for the
international conference on Chinese economy of "Has
China Become A Market Economy?" CERDI, Clermont-
Ferrand, France, May 17-18 2001.