review of bt s 2011/12 cost allocation for fixed access
TRANSCRIPT

Ref: 36198-356
CONFIDENTIAL
Report for Ofcom
Review of BT’s 2011/12
cost allocation for fixed
access markets
27 November 2013
James Allen, Chris Lambert and Tom
Rebbeck
Ref: 36198-356
FINAL REDACTED VERSION

Review of BT’s 2011/12 cost allocation for fixed access markets | i
Ref: 36198-356
CONFIDENTIAL
Contents
1 Introduction 1
2 BT regulatory accounting principles 3
3 Approach to assessment 5
4 Assessment of attribution of costs to LLU and WLR products 7
4.1 Approach 7
4.2 Review of each of the material components 8
4.3 Allocation of duct costs 10
4.4 Allocation of D side copper capital costs between products 11
4.5 Allocation of local exchange general frames capital and current costs 13
5 Attribution of costs between WLR and LLU 15
5.1 General 15
5.2 Identification of key products 15
5.3 Identification of main components of the key products 16
5.4 Attribution of main component costs to key products 17
5.5 Comparison of attribution of main component costs between MPF and SMPF plus WLR 20
6 Recommendations 24
Annex A Glossary

Review of BT’s 2011/12 cost allocation for fixed access markets | ii
Ref: 36198-356 CONFIDENTIAL
Confidentiality Notice: This document and the information contained herein are strictly
private and confidential, and are solely for the use of Ofcom.
Copyright © 2013. The information contained herein is the property of Analysys Mason
Limited and is provided on condition that it will not be reproduced, copied, lent or
disclosed, directly or indirectly, nor used for any purpose other than that for which it was
specifically furnished.
Analysys Mason Limited
Bush House, North West Wing
Aldwych
London WC2B 4PJ
UK
Tel: +44 (0)845 600 5244
Fax: +44 (0)20 7395 9001
www.analysysmason.com
Registered in England No. 5177472

Review of BT’s 2011/12 cost allocation for fixed access markets | 1
Ref: 36198-356
CONFIDENTIAL
1 Introduction
To inform Ofcom’s proposals to set any future Local Loop Unbundling (LLU) and Wholesale Line
Rental (WLR) charge controls, Analysys Mason is conducting a review of the allocation of costs
to BT’s copper access services (the cost allocation review).
The aim of the cost allocation review is to assess:
whether the attribution of costs to the services covered by the LLU and WLR charge controls
(as opposed to other services) is reasonable
whether the attribution of costs between services covered by the LLU and WLR charge
controls is reasonable.
Specifically each of these cost allocations has been examined to ascertain the following:
Does it reflect cost causation?
Is it objective?
Is the treatment consistent between products?
If based on statistical evidence, is that evidence sound?
A reasonable allocation is one which meets these criteria.
The cost allocation review has been carried out using a combination of:
publicly available material such as BT’s 2011/12 Regulatory Accounting Principles,1 which
provides an appropriate framework for the cost allocation review, and the 2011/12 Detailed
Attribution Method (DAM)2
confidential material held by Ofcom, including that obtained by means of statutory s.135
requests
access to the relevant personnel in BT’s Regulatory Finance team, to obtain detailed
explanations and justifications of the allocation methodologies that BT uses, and
Analysys Mason’s knowledge of the costs involved in LLU and WLR products.
This report makes recommendations for adjustments to be considered by Ofcom, including
adjustments to the allocation of costs to cost components and products.
This document is structured as follows:
1 See http://www.btplc.com/Thegroup/RegulatoryandPublicaffairs/Financialstatements/2012/PADS_2012.pdf
2 See http://www.btplc.com/Thegroup/RegulatoryandPublicaffairs/Financialstatements/2012/DAM_2012.pdf

Review of BT’s 2011/12 cost allocation for fixed access markets | 2
Ref: 36198-356 CONFIDENTIAL
Section 2 covers BT’s regulatory accounting principles that are most relevant to this review
Section 3 outlines Analysys Mason’s approach to the assessment
Section 4 provides an assessment of the allocation of costs to services covered in the WLR
and LLU charge controls and to other services
Section 5 provides an assessment of the allocation of costs within the services covered by the
WLR and LLU charge controls
Section 6 provides Analysys Mason’s recommendations to Ofcom based on this review.

Review of BT’s 2011/12 cost allocation for fixed access markets | 3
Ref: 36198-356 CONFIDENTIAL
2 BT regulatory accounting principles
BT defines a set of regulatory accounting principles3, of which the most relevant to this cost
allocation review are:
Principle 3 – Cost causality. “costs (including appropriate transfer charges) […] shall be
attributed to network components, wholesale services and retail products in accordance with
the activities which cause the revenues to be earned or costs to be incurred or the assets to be
acquired or liabilities to be incurred. Where it is not possible to attribute revenues, costs, assets
and liabilities in accordance with the preceding paragraph, the attribution shall be such as to
present fairly the revenues, costs, assets and liabilities accounted for in the Regulatory
Financial Statement (RFS) for each Significant Market Power (SMP) market or Technical
Area (as applicable), as disaggregated, where BT has a regulatory financial reporting
obligation and to present fairly a comparison between the markets or Technical Areas (as
applicable) as disaggregated.”
Principle 4 – Objectivity. “The attribution shall be objective and not intended to benefit
either BT or any other Operator, or any product, service or network component.”
Principle 7 – Transparency. The level of transparency is designed such that “a suitably
informed reader can easily:
— Gain a clear understanding of the overall structure of BT’s financial and information
systems from which regulatory accounting data is derived and in particular the sequence of
the processing and ‘cascade’ effect of the intermediate cost centres.
— Gain a detailed understanding of all the material, methodologies and drivers (e.g. systems,
processes and procedures) applied in the preparation of regulatory accounting data.
— Make their own judgement as to the reasonableness of these methodologies and driver
data and any changes to them.”
This transparency is enabled by the publication of the DAM.
Principle 8 – Sampling. “Where sampling is used to derive the attribution of costs, revenue
etc. it shall be based either on generally accepted statistical techniques or other methods which
should result in the accurate attribution of revenue (including transfer charges), costs
(including transfer charges), assets and liabilities.”
Analysys Mason believes that these principles provide an appropriate framework for assessing
reasonableness and we have therefore used it as part of this cost allocation review. For example,
cost causation is a desirable principle because it means that the costs shown in the regulatory
accounts for each component or service will reflect the cost of the resources used to provide that
3 The other principles are: 1 – Priority, 2 – Definitions, 5 – Consistency of Treatment and 6 – Compliance with
applicable law and IAS. For further details, see http://www.btplc.com/Thegroup/RegulatoryandPublicaffairs/Financialstatements/2012/PADS_2012.pdf

Review of BT’s 2011/12 cost allocation for fixed access markets | 4
Ref: 36198-356 CONFIDENTIAL
component or service, and will therefore be useful to inform price setting and regulation. We
believe these principles are reasonable, but not definitive, as they may not always lead to a unique
cost allocation (such as where common costs are allocated to a group of services).

Review of BT’s 2011/12 cost allocation for fixed access markets | 5
Ref: 36198-356 CONFIDENTIAL
3 Approach to assessment
The approach taken by Analysys Mason in this review was to:
Identify whether the attribution of costs to the services covered by the LLU and WLR charge
controls is reasonable. For the cost components that constitute the majority of cost for these
services, we have considered how costs are attributed between the products in question (i.e.
WLR and LLU), and products in covered in other charge controls (e.g. ISDN2, partial private
circuits (PPCs)). This is covered in Section 4.
Identify whether the attribution of costs between services covered by the LLU and WLR charge
controls is reasonable. For the products that constitute the majority of the cost, this report
assesses the appropriateness of the attribution of components to WLR and LLU. We have also
considered the majority of the differences in cost between MPF and WLR plus SMPF. Both
are covered in Section 5.
The products covered by this cost allocation review are included in Figure 1. The products
included here are those used by Analysys Mason in the cost model4. Note that, as the products
which are described as ‘Internal’5 or ‘External’
6 in the list below are sold on an equivalence of
inputs basis7, they have been treated together in this cost allocation review.
Data assessed in this cost allocation review is BT data taken from the RFS and provided following
Ofcom’s s.135 requests. It does not include the regulatory asset value (RAV) adjustment or other
adjustments made by Ofcom to the cost model.
4 See Annex 12 of the consultation, http://stakeholders.ofcom.org.uk/consultations/llu-wlr-cc-13/
5 That is, products sold to other BT divisions.
6 That is, products sold to other CPs.
7 Openreach supplies products and services to all communications providers on an equivalent basis. Equivalence of
Inputs means that products and services are provided to all customers at the same prices, using the same processes and according to the same timescales. For further information, see http://www.openreach.co.uk/orpg/home/aboutus/equivalence/equivalence.do

Review of BT’s 2011/12 cost allocation for fixed access markets | 6
Ref: 36198-356 CONFIDENTIAL
Figure 1: Products included in the cost allocation review [Source: Analysys Mason, 2013]
Products
WLR Basic Rentals Internal MPF Bulk Migrations
WLR Basic Rentals External MPF Ceases
WLR Premium Rentals Internal MPF Rentals
WLR Premium Rentals External MPF Room build
WLR Basic Connections Internal MPF Hostel rentals
WLR Premium Connections Internal MPF Tie cables
WLR Premium and Basic Connections External Shared Metallic Path Facility (SMPF) New Provides
WLR Premium and Basic Transfers Internal SMPF Single Migrations
WLR Premium and Basic Transfers External SMPF Bulk Migrations
Metallic Path Facility (MPF) New Provides SMPF Ceases
MPF Single Migrations SMPF Rentals
The products in this cost allocation review have hundreds of cost elements, which BT allocates to
30 components. A list of the components included in this review is provided in Figure 2.
Figure 2: Components included in the cost allocation review [Source: Analysys Mason, 2013]
Components
Wholesale Access specific Dropwire capital & PSTN NTE
Routeing & records Residential PSTN drop maintenance
MDF Hardware jumpering PSTN line cards
Software jumpering Pair gain
Service Centre - Provision WLR PSTN/ISDN2 Service Centre - Assurance WLR PSTN/ISDN2
Service Centre - Provision LLU Service Centre - Assurance LLU
Sales product management Combi Card Voice
Directories Local Loop Unbundling systems development
E side copper capital Broadband Line Testing Systems
E side copper current Local Loop Unbundling room build
D side copper capital Local Loop Unbundling hostel rentals
D side copper current Local Loop Unbundling hostel rentals power &
vent
Local exchanges general frames capital Local Loop Unbundling tie cables
Local exchanges general frames current ADSL Connections
PSTN line test equipment DSLAM capital / maintenance

Review of BT’s 2011/12 cost allocation for fixed access markets | 7
Ref: 36198-356 CONFIDENTIAL
4 Assessment of attribution of costs to LLU and WLR
products
4.1 Approach
In this phase of investigation, the focus was to review costs (e.g. duct) which are split between
LLU and WLR related products and products covered in other charge controls.
We have not included a separate assessment of the allocation of general overheads to the products
in this review, as the cost model8 was based on products and components
9.
The first stage of analysis was to identify the components that constitute the largest elements of
cost.
Based on our analysis of BT data in the RFS, we identified 12 of the 33 components which
between them constitute over 90% of total cost attributed to WLR/LLU. No other single
component generates more than 1% of total cost. The amount of cost attributed to the components
list can be seen below in Figure 3 and is illustrated in the chart in Figure 4.
Component
Percentage of
total cost
Figure 3: Key
components as a % of
total cost [Source: BT
RFS, Analysys Mason,
2013]
D side copper capital 43.1%
Dropwire capital & PSTN NTE 15.2%
E side copper capital 6.8%
D side copper current 6.0%
PSTN line cards 5.4%
MDF Hardware jumpering 4.5%
Residential PSTN drop maintenance 3.7%
E side copper current 1.9%
Local exchanges general frames capital 1.9%
Local Loop Unbundling hostel rentals power & vent 1.9%
Broadband Line Testing Systems 1.8%
Local exchanges general frames current 1.3%
Other10
6.5%
8 See Annex 12 of the consultation, http://stakeholders.ofcom.org.uk/consultations/llu-wlr-cc-13/
9 The 2008 KPMG study into BT’s cost allocation methodologies assessed the allocation of general overheads to
Openreach and found it to be reasonable, subject to a number of considerations which KPMG believed were not material. The recommended changes were incorporated into BT’s subsequent RFSs. In addition, the RFSs are audited every year, and material changes to allocations are identified. The 2008 KPMG report can be found at http://stakeholders.ofcom.org.uk/binaries/consultations/openreachframework/annexes/allocations.pdf
10 Components with greater than 0.1% and less than or equal to 1.0% of cost included in the ‘Other’ category are:
Service Centre - Provision, LLU hostel rentals, Service Centre – Assurance, Directories, LLU room build, Routeing and records, LLU tie cables, Sales product management, Combi Card Voice, PSTN line test equipment and DSLAM capital/maintenance.
Review of BT’s 2011/12 cost allocation for fixed access markets | 8
Ref: 36198-356 CONFIDENTIAL
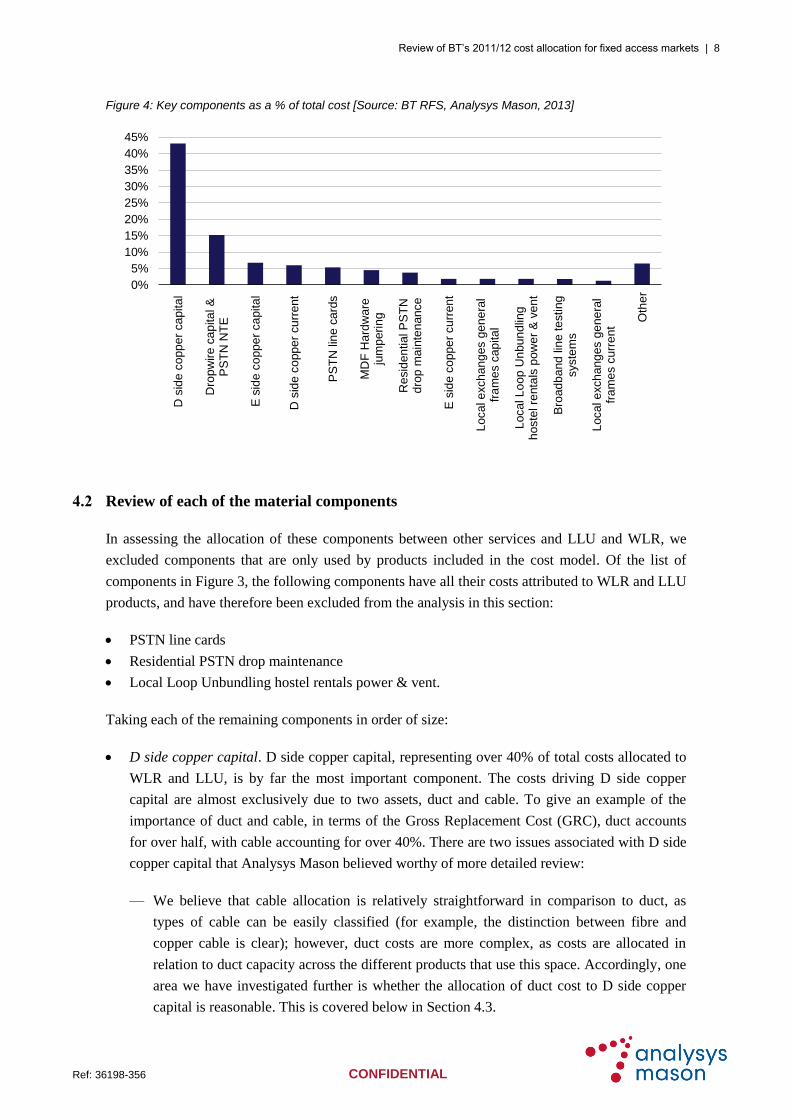
Figure 4: Key components as a % of total cost [Source: BT RFS, Analysys Mason, 2013]
4.2 Review of each of the material components
In assessing the allocation of these components between other services and LLU and WLR, we
excluded components that are only used by products included in the cost model. Of the list of
components in Figure 3, the following components have all their costs attributed to WLR and LLU
products, and have therefore been excluded from the analysis in this section:
PSTN line cards
Residential PSTN drop maintenance
Local Loop Unbundling hostel rentals power & vent.
Taking each of the remaining components in order of size:
D side copper capital. D side copper capital, representing over 40% of total costs allocated to
WLR and LLU, is by far the most important component. The costs driving D side copper
capital are almost exclusively due to two assets, duct and cable. To give an example of the
importance of duct and cable, in terms of the Gross Replacement Cost (GRC), duct accounts
for over half, with cable accounting for over 40%. There are two issues associated with D side
copper capital that Analysys Mason believed worthy of more detailed review:
— We believe that cable allocation is relatively straightforward in comparison to duct, as
types of cable can be easily classified (for example, the distinction between fibre and
copper cable is clear); however, duct costs are more complex, as costs are allocated in
relation to duct capacity across the different products that use this space. Accordingly, one
area we have investigated further is whether the allocation of duct cost to D side copper
capital is reasonable. This is covered below in Section 4.3.
0%
5%
10%
15%
20%
25%
30%
35%
40%
45%
D s
ide
co
pp
er
ca
pita
l
Dro
pw
ire
ca
pita
l &
PS
TN
NT
E
E s
ide c
opp
er
ca
pita
l
D s
ide
co
pp
er
cu
rren
t
PS
TN
lin
e c
ard
s
MD
F H
ard
wa
reju
mp
eri
ng
Re
sid
en
tial P
ST
Nd
rop
ma
inte
nan
ce
E s
ide c
opp
er
cu
rren
t
Loca
l e
xch
an
ges g
en
era
lfr
am
es c
ap
ita
l
Loca
l L
oop
Un
bu
nd
ling
hoste
l re
nta
ls p
ow
er
& v
en
t
Bro
ad
ba
nd
lin
e te
stin
gsyste
ms
Loca
l e
xch
an
ges g
en
era
lfr
am
es c
urr
en
t
Oth
er

Review of BT’s 2011/12 cost allocation for fixed access markets | 9
Ref: 36198-356 CONFIDENTIAL
— The assessment of whether the allocation of D side copper capital between WLR/LLU and
other products, such as ISDN, is reasonable is covered in Section 4.4.
Dropwire capital & PSTN NTE. Total costs related to Dropwire capital and PSTN NTE are
allocated on a volume basis to products in this review (e.g. WLR, MPF) and those outside this
review (e.g. ISDN2). This is objective and reflects cost causation. We have not seen the data
underlying the allocation (i.e. the details of the volume calculation) but we believe this to be a
sound basis for allocation.
E side copper capital. As with D side copper capital, the capital costs for E side copper capital
are largely due to the cable and duct assets. For example, cable accounts for over two thirds of
the GRC for E side copper capital, and duct represents over a quarter. As with D side copper
capital, while Analysys Mason is comfortable with the allocation of cable costs as being
objective and based on cost causation, duct allocations merit further examination in principle.
However, as E side copper capital is similar to D side copper capital in terms of the way it is
used by the products and the fact that the allocation is made using a similar weighting, similar
arguments apply to those in given in Section 4.4.
D side copper current. From the RFS there is insufficient detail on the allocation between
WLR and LLU products and other products not covered by this review (such as ISDN2),
which are also allocated D side copper current costs. Section 5.4 of this report discusses
Analysys Mason’s questions about how D side copper current costs are allocated between
LLU and WLR products, and note that Ofcom is proposing alternative allocations for D side
and E side copper current 11
. As part of this assessment, Ofcom may also wish to consider how
D side copper current costs are allocated to other products, such as ISDN2, ISDN30 and PPCs.
MDF hardware jumpering. Costs associated with this component are related to the product
connection volumes. We note that the relative cost allocations between WLR and ISDN2 on a
per-connection basis are similar (GBP21.34 for WLR compared to GBP21.74 for ISDN2), as
would be expected. As such, we consider that these cost allocations are objective and based on
cost causation.
E side copper current. As with D side copper current, there is a lack of clarity about how E
side copper current costs are allocated between LLU and WLR (see Section 5.4). Ofcom may
wish to consider how E side copper current costs are allocated to other products, such as
ISDN2, ISDN30 and PPCs.
Local exchanges general frames capital. These costs are allocated to WLR/LLU and other
products, such as ISDN. Based on the RFS, this allocation required further assessment. The
assessment is provided in Section 4.5.
11
See Table A13.7 in Annex 13 for details of these proposals.
http://stakeholders.ofcom.org.uk/binaries/consultations/llu-wlr-cc-13/annexes/annexes.pdf

| 10
Ref: 36198-356 CONFIDENTIAL
Broadband Line Testing Systems. In the source data, Broadband line testing systems are
allocated to both WLR lines and to MPF (and SMPF) products. Ofcom has already examined
this issue and consulted on a possible approach in section 6.151 of the 2013 charge control
consultation document12
, spreading the cost of TAMS and evoTAMS across MPF and SMPF
lines on the basis of volumes (i.e. a usage factor of 1 for SMPF, 1 for MPF, and 0 for WLR).
Local exchanges general frames current. These costs are allocated to WLR/LLU and other
products, such as ISDN. Based on the RFS, this allocation required further assessment. The
assessment is provided in Section 4.5.
4.2.1 Summary
From our assessment of the 12 components that carry the most cost, 4 elements were considered
worthy of further investigation, as described in the following subsections:
the allocation of duct costs to products in and out of this review (Section 4.3)
the general allocation of D side copper capital costs to products in and out of this review
(Section 4.4), and
the allocation of local exchanges general frames capital and local exchanges general frames
current costs to products in and out of this review (Section 4.5).
4.3 Allocation of duct costs
The current allocation of duct costs used by BT is based on a sample of ducts that were surveyed
by BT in 1996/7. The cost of replacing each duct was calculated by the 1996/7 study, and this cost
allocated in proportion to the cross-sectional area of the cabling within the duct, based on the
sample. For example, if copper cabling constituted 75% of the cross-sectional area of cabling in
the duct, 75% of the replacement cost would be attributed to it. Changes in the allocation of cost
by BT since this 1996/7 study have been based on the capital spend on duct, split by class of work
(i.e. split by access copper duct, access fibre duct and core duct) and annual price movements.
The resulting allocation of duct cost between copper, fibre and core is shown below in Figure 5.
The allocation in 1996/97 is taken from the survey, while the allocations for subsequent years are
based on that data adjusted by spend on duct since the survey, using the methodology described
above.
12
See http://stakeholders.ofcom.org.uk/binaries/consultations/llu-wlr-cc-13/summary/LLU_WLR_CC_2014.pdf

| 11
Ref: 36198-356 CONFIDENTIAL
Year Copper Fibre Core Figure 5: Duct allocation
by cable type [Source:
BT (confidential), 2013] 96/97 70%-80% 0%-10% 20%-30%
97/98 70%-80% 0%-10% 20%-30%
98/99 70%-80% 0%-10% 20%-30%
99/00 70%-80% 0%-10% 20%-30%
00/01 70%-80% 0%-10% 20%-30%
01/02 70%-80% 0%-10% 20%-30%
02/03 70%-80% 0%-10% 20%-30%
03/04 70%-80% 0%-10% 20%-30%
04/05 70%-80% 0%-10% 20%-30%
05/06 70%-80% 0%-10% 20%-30%
06/07 70%-80% 0%-10% 20%-30%
07/08 70%-80% 0%-10% 20%-30%
08/09 70%-80% 0%-10% 20%-30%
09/10 70%-80% 0%-10% 20%-30%
10/11 70%-80% 0%-10% 20%-30%
11/12 70%-80% 0%-10% 20%-30%
This method may introduce inconsistencies, as it combines two approaches – one based on cross-
sectional area of cabling, the other on spend on duct.
In Analysys Mason’s view, the method of calculating cost based on cross-sectional area is
reasonable, but the evolution of this figure on the basis of spend may distort the values. For
example, if a duct was initially built to carry copper cabling, the cost will be attributed to copper.
If fibre is later introduced in the same duct with no additional spend on the duct (e.g. if there is
sufficient spare space in the duct and no maintenance is required), no cost will be attributed to
fibre. Given the changes in the network over the past 16 years, particularly with the roll-out of
fibre to support VDSL13
, but also due to the growth in fibre access connections, Analysys Mason
believes that this methodology may not reflect current usage of the duct.
We recommend that Ofcom should consider whether an update to BT’s original 1996/7
survey of duct usage is needed.
4.4 Allocation of D side copper capital costs between products
D side copper is used both by WLR and MPF, as well as by products that are not subject to the
LLU and WLR charge controls (such as ISDN2, ISDN30 and low-speed partial private circuits
(PPCs)).
13
BT had passed over 13 million homes with VDSL by the end of December 2012 (source:
http://www.btplc.com/Sharesandperformance/Quarterlyresults/PDFdownloads/q413_slides_update_part2.pdf)

| 12
Ref: 36198-356 CONFIDENTIAL
As noted above, D side copper capital was selected for review on the basis of its contribution to
the overall cost (constituting 43.1% of all costs for components covered by the LLU and WLR
charge controls). Similar allocation methods apply to both capital and current components and for
the analogous E side copper components.
Costs for D side copper capital are assigned on the basis of the effective number of pairs (which
BT calls ‘weighted volumes’).
The calculation of the effective number of pairs is:
Effective number of pairs = Volumes * Line equivalence factor * pairs per connection
Where:
Volumes is the volume of channels
Line equivalence factor captures that the number of channels varies per connection. The line
equivalence factor is:
— 100% for PSTN, as each copper pair carries one voice channel
— 50% for ISDN2, as each copper pair carries two voice channels
— []% for ISDN30. This factor reflects the average number of channels per ISDN30
connection as well as the percentage of ISDN30 connections that use copper rather than
fibre. Although ISDN30 is capable of carrying 30 channels, the average ISDN30 connection
carries [] channels. ISDN30 can use either copper or fibre. Based on Openreach data,
[]% of ISDN30 connections are copper. The line equivalence factor for ISDN30 is
calculated as:
o ISDN30 line equivalence factor = []
Pairs per connection is the average number of pairs per connection. For most services (WLR,
MPF) this is 1. For certain PPCs and ISDN30 this is [].
Total costs for D side copper capital are then apportioned by the weighted volume in this review.
For example, if the total cost was GBP100 and the total effective number of pairs was 1000, of
which ISDN30 represented 50 (or 5%), ISDN30 would be allocated GBP5.
This means that D side copper capital costs are ultimately driven by the number of copper pairs
used for each service. Analysys Mason believes that, in principle, this is a reasonable method for
apportioning costs (as it is objective and based on cost causation) and that the figures in the
calculation are reasonable. The details behind the cost weighting are provided in Figure 6.
We understand that costs are apportioned for E side copper capital using a similar methodology,
which we also consider to be reasonable as it is objective and based on cost causation.

| 13
Ref: 36198-356 CONFIDENTIAL
Figure 6: Inputs for weighted volume calculation, by service [Source: BT (confidential), 2013]
Service name Units Volume Line
equiva-
lence
factor
Pairs
per
con-
nection
Effective
number of
pairs
WLR Premium Rentals Internal Lines 3,026,492 100% 1.00 3,026,492
WLR Basic Rentals Internal Lines 11,418,728 100% 1.00 11,418,728
ISDN30 rentals internal Channels [] []% [] []
MPF Rentals Lines [] []% [] []
WLR Premium Rentals External Lines 1,762,117 100% 1.00 1,762,117
WLR Basic Rentals External Lines 3,191,445 100% 1.00 3,191,445
Wholesale ISDN2 rentals
internal
Channels 616,257 50% 1.00 308,128
Wholesale ISDN2 rentals
external
Channels 524,051 50% 1.00 262,026
Wholesale ISDN30 rentals
external
Channels [] []% [] []
Openreach PPCs Line
equivalents
[] 100% 1.00 []
Openreach PPCs Line
equivalents
[] 100% [] []
Total Line
equivalents
- - - 25,110,162
4.5 Allocation of local exchange general frames capital and current costs
Local exchange general frames capital
Analysys Mason believes that the allocation of Local exchange general frames capital between
WLR and LLU products and other products requires additional investigation by Ofcom. As can be
seen in Figure 7, on a per-line basis, WLR is allocated twice as much cost as ISDN2. We are not
aware of reasons to support this allocation in the 2012 RFS. Based on our understanding, both
WLR and ISDN2 make equal use of the frame. On a per-line basis, we would therefore expect
similar costs to be allocated to WLR and ISDN2. Furthermore, we note that in the 2013 RFS, on a
per-line basis, WLR and ISDN2 are allocated almost the same cost for local exchange general
frames capital (GBP1.81 and GBP1.80 respectively)14
. Relative use of the frame by MPF and
WLR is discussed below in Section 5.4.
14
For the 2013 allocation of costs, see section 7.3.2 and section 7.4.2 of
http://www.btplc.com/Thegroup/RegulatoryandPublicaffairs/Financialstatements/2013/CurrentCostFinancialStatements2013.pdf

| 14
Ref: 36198-356 CONFIDENTIAL
Product Unit Cost (GBP) Ratio (relative
to WLR)
Figure 7: Allocation of
local exchanges general
frames capital by product
[Source: BT RFS, 2012]
WLR Rental
(Basic and
Premium)
Cost per line 1.71 1
MPF Rental Cost per line 3.41 2
ISDN2 Rental Cost per
channel
0.43 0.25
ISDN2 Rental Cost per line 0.86 0.5
Local exchange general frames current
As with the allocation of capital costs, Analysys Mason believes that the allocation of Local
exchange general frames current between WLR and LLU products and other products requires
additional investigation by Ofcom. As can be seen in Figure 8, WLR was allocated twice as much
cost, on a per-copper pair basis, as ISDN2. We are not aware of evidence to support these
allocations. As with Local exchange general frames capital, the ratio of WLR to ISDN2 current
costs has changed in the 2013 RFS, and on a per-line basis the costs are almost identical in the
2013 RFS.
Product Unit Cost (GBP) Ratio (relative
to WLR)
Figure 8: Allocation of
local exchanges general
frames current by product
[Source: BT RFS, 2012]
WLR Rental
(Basic and
Premium)
Cost per line 1.17 1
MPF Rental Cost per line 2.34 2
ISDN2 Rental Cost per
channel
0.29 0.25
ISDN2 Rental Cost per line 0.58 0.5
We recommend that Ofcom investigate further the allocation of local exchanges general
frames capital and local exchanges general frames current between WLR, MPF and ISDN2
products.

| 15
Ref: 36198-356 CONFIDENTIAL
5 Attribution of costs between WLR and LLU
5.1 General
In this task Analysys Mason assessed whether the attribution of costs in 2011/12 between products
in this review was reasonable.
Our approach was to:
identify the key products
identify the main components of the key products, and
establish whether the attribution of main component costs to key products was reasonable.
As a separate step we also compared the cost stack of MPF to the combination of WLR and
SMPF, to see if the differences were reasonable (see Section 5.5).
Each of these steps and the results are described in more detail below.
5.2 Identification of key products
The initial stage of this analysis was to identify which products were allocated the majority of total
cost. We describe these as the key products. For this analysis, as the internal and external products
are sold on an equivalence of inputs basis, they were treated together (e.g. the cost stack for WLR
Basic Rental internal is treated the same way as the cost stack for WLR Basic Rental external).
The three named products shown in Figure 9 and Figure 10 were selected for further examination,
as they comprised 89% of the total cost15
in 2011/12. The remaining products included in this
review (categorised as ‘Other’ in Figure 9 and Figure 10) amounted to 11% of the total costs, and
no single product in this category amounted to more than 3.0%. It should be noted that while
SMPF rentals are not included in our list of key products (as they constitute less than 1%16
of total
cost), SMPF rentals are assessed in Section 5.5 below.
Product % of total cost Figure 9: Products by %
of total cost, 2011/2012
[Source: BT RFS, 2012] WLR Basic Rentals 52.8%
MPF Rentals 18.6%
WLR Premium Rentals 17.6%
Other17
11.0%
15
Figures for total costs exclude values for WLR transfers though these do not have a material impact on results
16 This figure of less than 1% is for external SMPF only. If internal SMPF were also included the figure would be
higher, though still less than 3% of total cost.
17 Products with greater than 0.1% of total costs were (in order of total cost): MPF Hostel rentals, MPF New Provides,
MPF Tie cables, MPF Ceases, Wholesale Premium Connections Internal, MPF Bulk Migrations, SMPF Single Migrations and SMPF Ceases.

| 16
Ref: 36198-356 CONFIDENTIAL
Figure 10: Products by
% of total cost,
2011/2012 [Source: BT
RFS, 2012]
Having identified the key products, the next step was to examine the unit component cost stacks of
these products in order to determine the components that bear the highest cost. We describe these
as the main components.
5.3 Identification of main components of the key products
The cost elements of the three key products are shown in Figure 11 and Figure 12.
Figure 11: Key component costs by product, 2011/12, in GBP [Source: BT RFS, 2012]
D s
ide
co
pp
er
ca
pit
al
Dro
pw
ire
ca
pit
al &
PS
TN
NT
E
PS
TN
lin
e c
ard
s
E s
ide
co
pp
er
ca
pit
al
D s
ide
co
pp
er
cu
rren
t
Res
ide
nti
al
PS
TN
dro
p
ma
inte
na
nc
e
E s
ide
co
pp
er
cu
rren
t
Bro
ad
ba
nd
Lin
e
Te
sti
ng
Sy
ste
ms
Lo
ca
l e
xc
ha
ng
es
ge
ne
ral
fram
es c
ap
ita
l
Oth
er
To
tal
WLR
Basic
Rentals
51.94 18.33 8.13 8.18 6.48 4.51 2.04 0.49 1.71 4.06 105.87
WLR
Premium
Rentals
51.95 18.33 8.13 8.18 7.78 4.51 2.45 0.49 1.71 4.07 107.60
MPF
Rentals 51.90 18.31 - 8.17 8.08 4.51 2.54 8.47 3.41 5.36 110.75
0%
10%
20%
30%
40%
50%
60%
WLR BasicRentals
MPF Rentals WLR PremiumRentals
Other

| 17
Ref: 36198-356 CONFIDENTIAL
Figure 12: Key component costs by product, 2011/12 [Source: BT RFS, 2012]
As is to be expected, due to the fact that both WLR and MPF are based on copper pairs, most
component costs were, although not identical, extremely close across the different products. For
example, D side copper capital contributed GBP51.94 to WLR Basic, GBP51.95 to WLR
Premium and GBP51.90 to MPF. Therefore, the key focus for Analysys Mason’s review was not
on where the costs were the same (or extremely similar) but rather where they were different, and
to try to understand why these costs were different and whether this difference was reasonable.
This analysis is presented in Section 5.4.
5.4 Attribution of main component costs to key products
In order to understand how product costs are constituted, we first needed to understand the
relationship between products and their underlying components. The costs associated with each
product depend on the usage factors of components. For example, as each WLR Basic Rental uses
1 unit of D side copper the usage factor is 1.
For the key products and their main components, the usage factors are displayed below in
Figure 13.
0
10
20
30
40
50
60
D s
ide
co
pp
er
cap
ita
l
Dro
pw
ire
ca
pita
l&
PS
TN
NT
E
PS
TN
lin
e c
ard
s
E s
ide c
opp
er
cap
ita
l
D s
ide
co
pp
er
curr
en
t
Resid
en
tial P
ST
Nd
rop
ma
inte
nan
ce
E s
ide c
opp
er
curr
en
t
Bro
ad
ba
nd
Lin
eT
esting
Syste
ms
Loca
l e
xch
an
ges
gen
era
l fr
am
es
cap
ita
l Oth
er
GB
P
WLR Basic Rentals WLR Premium Rentals MPF Rentals

| 18
Ref: 36198-356 CONFIDENTIAL
Figure 13: Usage factors for 2011/12, by product [Source: BT RFS, 2012]
D s
ide
co
pp
er
ca
pit
al
Dro
pw
ire
ca
pit
al &
PS
TN
NT
E
PS
TN
lin
e c
ard
s
E s
ide
co
pp
er
ca
pit
al
D s
ide
co
pp
er
cu
rre
nt
Re
sid
en
tia
l P
ST
N
dro
p m
ain
ten
an
ce
E s
ide
co
pp
er
cu
rre
nt
Bro
ad
ba
nd
Lin
e
Te
sti
ng
Sy
ste
ms
Lo
ca
l e
xc
ha
ng
es
ge
ne
ral
fram
es
ca
pit
al
WLR
Basic
Rental
1.00 1.00 1.00 1.00 1.00 1.00 1.00 0.10 1.00
WLR
Premium
Rental
1.00 1.00 1.00 1.00 1.20 1.00 1.20 0.10 1.00
MPF
Rental
1.00 1.00 - 1.00 1.25 1.00 1.25 1.79 2.00
In our assessment we then took each component in turn and compared the allocation as determined
by the usage factor to see whether we believed this to be reasonable.
D side copper capital. The usage factor for all key products is identical at 1.00. Analysys
Mason believes this to be objective and based on cost causation and therefore reasonable.
Dropwire capital & PSTN NTE. The usage factor for this component is also 1.00 across all
products, which is objective and based on cost causation and therefore reasonable.
PSTN line cards. The usage factor for this component is 1.00 for WLR rental products and 0
for MPF Rental products, which is reasonable (as only WLR products use PSTN line cards).
E side copper capital. As with D side copper capital, the usage factor is 1.00 across the key
products, which is reasonable.
D side copper current. The usage factors used by BT for this component range from 1 to 1.25,
depending on the product in question. According to BT, there are two reasons for this
variance:
| 19
Ref: 36198-356 CONFIDENTIAL
— WLR Premium and MPF products are provided with a higher level of service level
agreement (SLA) than WLR Basic products. BT believes that this justifies the higher usage
factor of 1.20 for D side copper current. While it is possible that the higher SLA (“care
level”) does indeed lead to higher costs, Analysys Mason has not seen convincing
evidence to support this usage factor – in other words the justification is not transparent18
.
Analysys Mason understands that Ofcom is planning to consult later in 2013 on the
relationship between service quality and resource costs19
.
— MPF has a higher fault rate than WLR lines. BT has argued that MPF lines suffer from a
4% higher rate of failure than WLR lines and therefore a higher proportion of D side
copper current costs should be allocated to MPF lines.
As further evidence is needed to support higher fault rates for MPF lines we recommend
that Ofcom explore this issue further, and understand that this is already underway20
.
Ofcom’s proposed allocation for D side and E side copper current can be found in Table
A13.7 in Annex 13 of the consultation document21
.
Residential PSTN drop maintenance. The allocation of drop maintenance costs is equal across
all of the key products, with a usage factor of 1.00 for each. Analysys Mason believes this is
objective and based on cost causation and therefore reasonable.
E side copper current. As with D side copper current, usage factors for this component range
from 1 to 1.25 depending on the product in question. The explanation from BT is that the
usage factors are due to the same reasons as for D side copper current (i.e. high SLAs and a
greater fault rate for MPF). While it is possible that the higher SLA (“care level”) does indeed
lead to higher costs, Analysys Mason has not seen convincing evidence to support this usage
factor – in other words the justification is not transparent. Analysys Mason understands that
Ofcom is planning to consult later in 2013 on the relationship between service quality and
resource costs. In its consultation, Ofcom has proposed alternative usage factors for E side and
D side copper current22
.
Analysys Mason recommends that Ofcom consider alternative usage factors for E side
copper current, as it is doing for D side copper current.
18
See A13.136 in the annex of the consultation document for more detail on this point,
http://stakeholders.ofcom.org.uk/binaries/consultations/llu-wlr-cc-13/annexes/annexes.pdf
19 See section 5 of the consultation document at http://stakeholders.ofcom.org.uk/binaries/consultations/llu-wlr-cc-
13/summary/LLU_WLR_CC_2014.pdf. See also Annex 13 of the consultation document for further discussion and background on the service levels, including Ofcom’s proposed usage factor, at http://stakeholders.ofcom.org.uk/binaries/consultations/llu-wlr-cc-13/annexes/annexes.pdf
20 See Section 5.23 on fault rates in the consultation document at
http://stakeholders.ofcom.org.uk/binaries/consultations/llu-wlr-cc-13/summary/LLU_WLR_CC_2014.pdf
21 See http://stakeholders.ofcom.org.uk/binaries/consultations/llu-wlr-cc-13/annexes/annexes.pdf
22 See Table A13.7 for the proposed allocation for E-side and D-side copper current at
http://stakeholders.ofcom.org.uk/binaries/consultations/llu-wlr-cc-13/annexes/annexes.pdf

| 20
Ref: 36198-356 CONFIDENTIAL
Broadband Line Testing Systems. In the source data, broadband line testing systems are
allocated to both WLR lines and to MPF (and SMPF) products. Ofcom has already examined
this issue and consulted on a possible approach in section 6.151 of the 2013 charge control
consultation document, which would involve spreading the cost of TAMS and evoTAMS
across MPF and SMPF lines on the basis of volumes (i.e. a usage factor of 1 for SMPF, 1 for
MPF, and 0 for WLR).
Local exchanges general frames capital. The usage factors for this component are 1 for WLR
Rentals and 2 for MPF Rentals. The difference is due to the wiring arrangements of WLR and
MPF. Further detail on this can be found in the annex to the consultation23
. Analysys Mason
believes this to be objective and based on cost causation and therefore reasonable.
In the final section below, the above exercise is repeated but comparing the cost stack for MPF
Rental with that of WLR Basic Rental plus SMPF Rental.
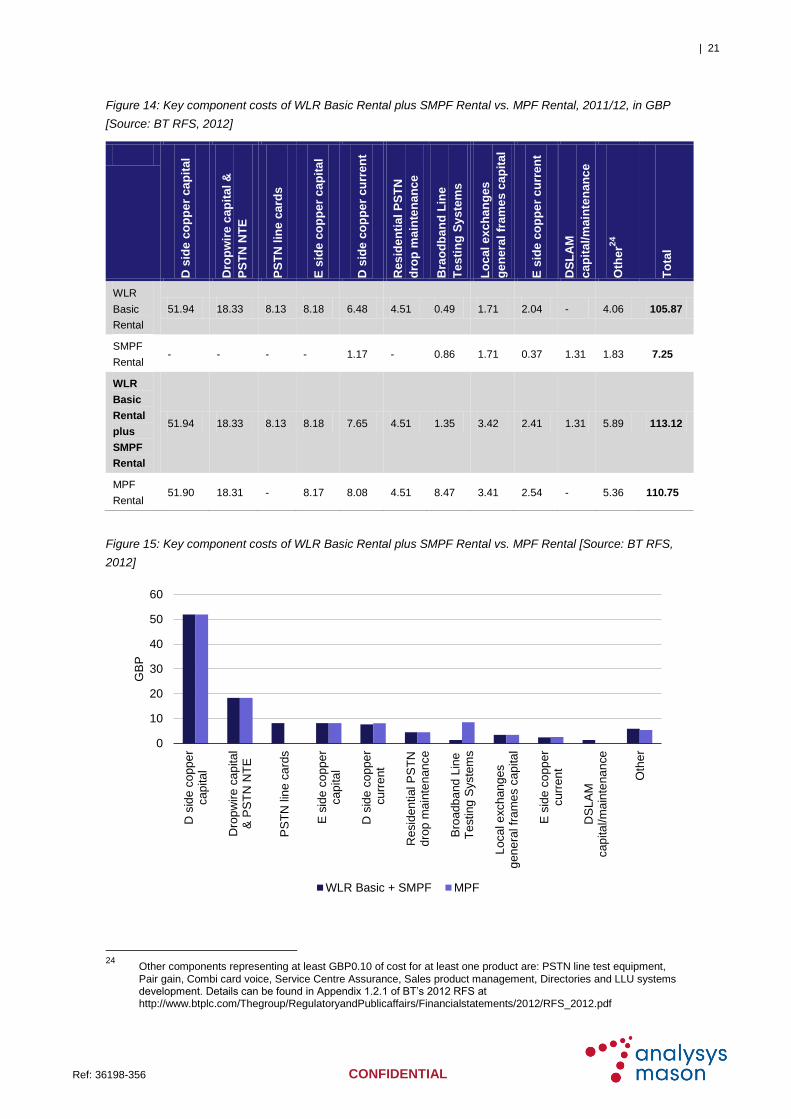
5.5 Comparison of attribution of main component costs between MPF and SMPF plus
WLR
As with the assessment of the main components, in order to make a comparison between MPF
Rental and WLR Basic Rental plus SMPF Rental we built the cost stack of both, as shown in
Figure 14 and Figure 15.
The main nine components have been selected. For both MPF Rental and WLR Basic Rental plus
SMPF Rental these components represent over 90% of the total cost for each product.
23
See figures A10.1-3 for an explanation of the different wiring configurations at
http://stakeholders.ofcom.org.uk/binaries/consultations/llu-wlr-cc-13/annexes/annexes.pdf
| 21
Ref: 36198-356 CONFIDENTIAL
Figure 14: Key component costs of WLR Basic Rental plus SMPF Rental vs. MPF Rental, 2011/12, in GBP
[Source: BT RFS, 2012]
D s
ide
co
pp
er
ca
pit
al
Dro
pw
ire
ca
pit
al &
PS
TN
NT
E
PS
TN
lin
e c
ard
s
E s
ide
co
pp
er
ca
pit
al
D s
ide
co
pp
er
cu
rre
nt
Re
sid
en
tia
l P
ST
N
dro
p m
ain
ten
an
ce
Bra
od
ba
nd
Lin
e
Te
sti
ng
Sy
ste
ms
Lo
ca
l e
xc
ha
ng
es
ge
ne
ral
fram
es c
ap
ita
l
E s
ide
co
pp
er
cu
rre
nt
DS
LA
M
ca
pit
al/m
ain
ten
an
ce
Oth
er2
4
To
tal
WLR
Basic
Rental
51.94 18.33 8.13 8.18 6.48 4.51 0.49 1.71 2.04 - 4.06 105.87
SMPF
Rental - - - - 1.17 - 0.86 1.71 0.37 1.31 1.83 7.25
WLR
Basic
Rental
plus
SMPF
Rental
51.94 18.33 8.13 8.18 7.65 4.51 1.35 3.42 2.41 1.31 5.89 113.12
MPF
Rental 51.90 18.31 - 8.17 8.08 4.51 8.47 3.41 2.54 - 5.36 110.75
Figure 15: Key component costs of WLR Basic Rental plus SMPF Rental vs. MPF Rental [Source: BT RFS,
2012]
24
Other components representing at least GBP0.10 of cost for at least one product are: PSTN line test equipment,
Pair gain, Combi card voice, Service Centre Assurance, Sales product management, Directories and LLU systems development. Details can be found in Appendix 1.2.1 of BT’s 2012 RFS at http://www.btplc.com/Thegroup/RegulatoryandPublicaffairs/Financialstatements/2012/RFS_2012.pdf
0
10
20
30
40
50
60
D s
ide
coppe
rcapital
Dro
pw
ire c
ap
ita
l&
PS
TN
NT
E
PS
TN
lin
e c
ard
s
E s
ide c
oppe
rcapital
D s
ide
coppe
r c
urr
ent
Resid
en
tial P
ST
Nd
rop
ma
inte
nan
ce
Bro
ad
ba
nd
Lin
eT
esting
Syste
ms
Loca
l e
xch
an
ges
gen
era
l fr
am
es c
ap
ita
l
E s
ide c
opp
er
curr
en
t
DS
LA
Mcap
ita
l/m
ain
tena
nce
Oth
er
GB
P
WLR Basic + SMPF MPF

| 22
Ref: 36198-356 CONFIDENTIAL
The differences seen above can be explained by examining the usage factors. Figure 16 provides a
comparison of the usage factors for MPF Rental and WLR Basic Rental plus SMPF Rental for the
key components.
Figure 16: Usage factors for 2011/12, by product [Source: BT RFS, 2012]
D s
ide
co
pp
er
ca
pit
al
Dro
pw
ire
ca
pit
al &
PS
TN
NT
E
PS
TN
lin
e c
ard
s
E s
ide
co
pp
er
ca
pit
al
D s
ide
co
pp
er
cu
rre
nt
PS
TN
dro
p
ma
inte
na
nc
e
Bro
ad
ba
nd
Lin
e T
es
tin
g
Sy
ste
ms
Lo
ca
l e
xc
ha
ng
es
ge
ne
ral
fram
es c
ap
ita
l
E s
ide
co
pp
er
cu
rre
nt
DS
LA
M c
ap
ita
l/
ma
inte
na
nc
e
WLR
Basic
Rental
1.00 1.00 1.00 1.00 1.00 1.00 0.10 1.00 1.00 -
SMPF
Rental - - - - 0.18 - 0.18 1.00 0.18 1.00
WLR
Basic
Rental
plus
SMPF
Rental
1.00 1.00 1.00 1.00 1.18 1.00 0.28 2.00 1.18 1.00
MPF
Rental 1.00 1.00 0 1.00 1.25 1.00 1.79 2.00 1.25 -
Each of the following components has an identical usage factor for both MPF Rental and for WLR
Basic Rental combined with SMPF Rental, which Analysys Mason believes to be reasonable as it
is objective and based on cost causation:
D side copper capital
Dropwire capital & PSTN NTE
E side copper capital
Residential PSTN drop maintenance
Local exchanges general frames capital25
.
Looking at each of the remaining components in turn:
D side copper current. As discussed in Section 5.4 earlier, the difference in usage factors
between WLR and MPF is explained by BT as being due to the higher SLA levels and the
higher fault rates of MPF lines. However, when SMPF lines are also combined with WLR, the
difference is much lower (1.18 compared to 1.25). There is a lack of transparency in the
justification of this difference, which we expect will be addressed in the work Ofcom is
25
The usage factor for MPF and WLR plus SMPF is what we expected, given the usage of the frame by these
products. Further discussion of this can be found in annex 10 of the consultation document at http://stakeholders.ofcom.org.uk/binaries/consultations/llu-wlr-cc-13/annexes/annexes.pdf

| 23
Ref: 36198-356 CONFIDENTIAL
already undertaking in relation to fault rates and quality of service as well as to MPF lines as
part of the rebalancing of costs.
Broadband Line Testing Systems. Analysys Mason does not believe that BT’s explanation for
how costs have been shared across SMPF, WLR and MPF products is sufficiently robust to
justify the wide difference in the usage factors. Ofcom is looking at this point as part of its
consultation. Further discussion of this, and Ofcom’s proposed alternative, can be found in the
consultation documents26
.
As discussed in Section 5.4, Analysys Mason suggests that Ofcom consider how these costs
are allocated across products.
E side copper current. As with D side copper current, the difference between the allocation of
copper current costs between MPF Rental and WLR Basic Rental is reduced significantly
when SMPF Rental is also included. However, there is a lack of transparency in the
justification of the difference, which we expect will be addressed in the work Ofcom is already
undertaking.
As discussed in Section 5.4, Analysys Mason recommends that Ofcom consider alternative
allocation of current costs for D side and E side copper.
DSLAM capital maintenance. According to the RFS, SMPF is allocated GBP1.31 of DSLAM
capital/maintenance costs based on its usage factor of 1. This appears to be a misclassification,
as SMPF should not be allocated costs related to the DSLAM.
Analysys Mason recommends that Ofcom seek clarification of the nature of DSLAM
capital/maintenance with BT. It may be that the term DSLAM is miscategorised and these
costs are related to SMPF, based on cost causation and are therefore reasonable. In this case,
we recommend relabelling ‘DSLAM capital/maintenance’ more appropriately.
Alternatively, if these costs are not related to SMPF, we recommend that Ofcom consider
the reallocation of DSLAM capital/maintenance.
26
See Section 6.137 of the main consultation document for discussion of the broadband line testing costs at
http://stakeholders.ofcom.org.uk/binaries/consultations/llu-wlr-cc-13/summary/LLU_WLR_CC_2014.pdf and see Table A13.4 for Ofcom’s proposed adjusted unit cost at http://stakeholders.ofcom.org.uk/binaries/consultations/llu-wlr-cc-13/annexes/annexes.pdf

| 24
Ref: 36198-356 CONFIDENTIAL
6 Recommendations
Based on our review of BT’s cost allocation, Analysys Mason considers that overall it is
reasonable. Analysys Mason does have the following recommendations however, which are issues
of transparency and sampling:
We note that the method used to allocate duct costs between products within the review (WLR
and LLU) and other products is potentially inaccurate, as it mixes a survey-based approach
(measuring the cross-sectional area used) with one based on spend on duct construction since
that date. Ofcom may wish to consider whether an update to BT’s original 1996/7 survey of
duct usage is needed.
We recommend that Ofcom investigate further the allocation of local exchanges general
frames capital and current between WLR, MPF and ISDN2 products. We are not aware of
reasons to support the allocation in the 2012 RFS and note that the relative allocations are
significantly different in the 2013 RFS.
As further evidence is needed to support higher fault rates for MPF lines we recommend that
Ofcom explore this issue further, and understand that this is already underway. Ofcom’s
proposed allocation for D side and E side copper current can be found in Table A13.7 in
Annex 13 of the consultation document.
We note that there is limited supporting evidence for the difference in BT’s current usage
factors for D side and E side copper current for WLR basic and WLR premium/MPF products.
Analysys Mason recommends that Ofcom consider alternative usage factors for both E side
copper current and D side copper current. We understand that Ofcom is planning to consult
later in 2013 on the relationship between service quality and resource costs and is undertaking
further analysis of fault rate data. As part of this assessment, Ofcom may also wish to consider
how D side copper current costs are allocated to other products, such as ISDN2, ISDN30 and
PPCs.
In the source data, Broadband line testing systems are allocated to both WLR lines and to MPF
(and SMPF) products. Ofcom should also investigate further the relative allocation of
Broadband line testing costs between MPF and SMPF.27
Analysys Mason recommends that Ofcom seek clarification of the nature of DSLAM
capital/maintenance with BT. It may be that the term (especially the reference to DSLAM) is
inaccurate and these costs are related to SMPF and are based on cost causation and therefore
reasonable. In this case, we recommend relabelling ‘DSLAM capital/maintenance’ more
27
See Section 6.137 of the main consultation document for discussion of the broadband line testing costs, at
http://stakeholders.ofcom.org.uk/binaries/consultations/llu-wlr-cc-13/summary/LLU_WLR_CC_2014.pdf and see Table A13.4 for Ofcom’s proposed adjusted unit cost, at http://stakeholders.ofcom.org.uk/binaries/consultations/llu-wlr-cc-13/annexes/annexes.pdf

| 25
Ref: 36198-356 CONFIDENTIAL
appropriately. Alternatively, if these costs are not related to SMPF, we recommend that Ofcom
further consider the reallocation of DSLAM capital/maintenance.

Annex A Glossary
BT: British Telecommunications plc.
Charge control: A control which sets the maximum price that a communication provider can
charge for a particular product or service. Most charge controls are imposed for a defined period.
Communications provider: A person who provides an electronic communications network or
provides an electronic communications service.
Dropwire: The part of the network that uses a copper line from the distribution point to and
including the PSTN network terminating equipment (NTE).
Gross replacement cost (GRC): The cost of replacing an existing tangible fixed asset with an
identical or substantially similar new asset having a similar production or service capacity.
ISDN2: A type of digital telephone line service that supports telephony and switched data
services. ISDN2 allows a business to handle two phone calls simultaneously. It is primarily used
by smaller businesses.
ISDN30: A type of digital telephone line service that provides up to 30 lines over a common
digital bearer circuit. These lines provide digital voice telephony, data services and a wide range
of ancillary services. It is primarily used by larger businesses.
Local loop unbundling (LLU): A process by which a dominant provider’s local loops are
physically disconnected from its network and connected to competing provider’s networks. This
enables operators other than the incumbent to use the local loop to provide services directly to
customers.
Main distribution frame (MDF)/unbundled local loop: An internal wiring frame where copper
access network cables are terminated and cross connected to exchange equipment by flexible wire
jumpers.
Metallic path facilities (MPF): The provision of access to the copper wires from the customer
premises to a BT MDF that covers the full available frequency range, including both narrowband
and broadband channels, allowing a competing provider to provide the customer with voice
and/or data services over such copper wires.
Openreach: The access division of BT established by Undertakings in 2005.
Regulatory financial statements (RFS): The financial statements that BT is required to prepare
and publish by Ofcom.
Shared metallic path facility (SMPF)/shared access: The provision of access to the copper
wires from the customer’s premises to a BT MDF that allows a competing provider to provide the

| 27
Ref: 36198-356 CONFIDENTIAL
customer with broadband services, while the dominant provider continues to provide the customer
with conventional narrowband communications.
Significant market power (SMP): The significant market power test is set out in European
Directives. It is used by national regulatory authorities (NRAs), such as Ofcom, to identify those
CPs which must meet additional obligations under the relevant Directives.
Wholesale line rental (WLR): The service offered by BT to other UK CPs to enable them to
offer retail line rental services in competition with BT’s own retail services. Line rental is offered
along with calls (and other service elements, such as broadband) to retail customers