review of cost versus scale: water and wastewater ... · pdf filecosts of water reuse...
TRANSCRIPT
223 © IWA Publishing 2014 Water Science & Technology | 69.2 | 2014
Review of cost versus scale: water and wastewater
treatment and reuse processes
Tianjiao Guo, James Englehardt and Tingting Wu
ABSTRACT
The US National Research Council recently recommended direct potable water reuse (DPR), or
potable water reuse without environmental buffer, for consideration to address US water demand.
However, conveyance of wastewater and water to and from centralized treatment plants consumes
on average four times the energy of treatment in the USA, and centralized DPR would further require
upgradient distribution of treated water. Therefore, information on the cost of unit treatment
processes potentially useful for DPR versus system capacity was reviewed, converted to constant
2012 US dollars, and synthesized in this work. A logarithmic variant of the Williams Law cost function
was found applicable over orders of magnitude of system capacity, for the subject processes:
activated sludge, membrane bioreactor, coagulation/flocculation, reverse osmosis, ultrafiltration,
peroxone and granular activated carbon. Results are demonstrated versus 10 DPR case studies.
Because economies of scale found for capital equipment are counterbalanced by distribution/
collection network costs, further study of the optimal scale of distributed DPR systems is suggested.
doi: 10.2166/wst.2013.734
Tianjiao Guo (corresponding author)James EnglehardtTingting WuDepartment of Civil, Architectural,
and Environmental Engineering,University of Miami,McArthur Engineering Building,Rm. 325,1251 Memorial Drive,Coral Gables,FL 33146,USAE-mail: [email protected]
Key words | distributed, optimization, reuse, scale, size, water
INTRODUCTION
USwater/wastewater infrastructure is now aging and in needof repair or replacement, offering an opportunity for careful
reassessment of the entire municipal water managementsystem. In that light, a recent report by the US NationalResearch Council (, p. 3) found that ‘The use of reclaimed
water to augment potable water supplies has significantpotential for helping to meet future needs….’ The reportwent on to note that, although de facto potable reuse, invol-
ving the use of source water largely composed of upstreamwastewater effluent, is common in many US water systems,planned potable water reuse is not. Where practiced, potable
water reuse has been termed either ‘indirect’ if treated waste-water is returned to the environment prior to reuse, or ‘direct’if not. In fact globally there are currently no public watersupplies utilizing more than 50% recycled wastewater. In
that sense, all water reuse systems currently operating includean environmental buffer integral to the design. However,100% direct potable water reuse (DPR), i.e. potable reuse
without environmental buffer, was implemented successfullyin Colorado from 1976 to 1982 (Selby & Pure CycleCorp. ). Further, the National Research Council report
found no evidence that an environmental buffer provides
generally higher dilution and attenuation relative to an engin-eered system, and recommended that potable reuse with or
without environmental buffer be considered as a water man-agement alternative.
When considering DPR, distributed DPR systems may
further be considered, given that centralized potable reusesystems with gravity collection would require upgradient dis-tribution of treated water. In fact, even in centralized
systems, the energy consumed for conveyance may be sig-nificantly greater than is used in the treatment process.According to Cohen et al. () and Wolff et al. (),the energy cost per unit water supplied in California isapproximately 20 times higher for conveyance than for treat-ment, and the number approaches 39.5 in San Diego. Thesenumbers may derive in part from the 3% of total electric
power used in delivering water from the San FranciscoBay–Delta to Southern California (Cohen et al. ). Asanother less extreme example, in Iowa, energy consumed
in conveyance of water/wastewater represents 30% of thatconsumed in treatment (Sauer & Kimber ). In fact, astudy supported by the Electric Power Research Institute
concluded that roughly 4% of US electricity is used for

224 T. Guo et al. | Review of cost of water reuse processes versus scale Water Science & Technology | 69.2 | 2014
treatment and conveyance of water/wastewater, of which
80% is used for conveyance (ICF Consulting ; Cohenet al. ). In addition, Cohen’s analysis indicated that atleast 6% of the water is lost in centralized distribution sys-
tems, resulting in higher demands for both water and energy.In addition to saving energy, distributed plants may be
more resilient to willful attack, and amenable to technologi-cal evolution, allowing incremental technological changes
to be implemented and tested when required by local con-ditions. Modern communications technologies also makeit conceivable that many water/wastewater monitoring,
operation, and maintenance functions can be decentralized,supporting savings in conveyance energy and water. In fact,small-scale treatment of black water in semi-public buildings
has been predicted as a trend in the future based on pro-jected savings in energy and water (Timmeren ).
In considering distributed DPR, the question arises as tothe optimal scale of the individual treatment plants. In many
cases this question would be addressed by attempting tominimize total cost, which might also tend to minimizelife-cycle energy demand. However, information on the
costs of water reuse processes as a function of processscale is inadequate, existing primarily in gray literaturesources, limited by the current lack of potable water reuse
design experience and the specificity of cost information tosite characteristics, technological developments, and tem-poral and political variability in monetary values.
Traditionally, cost functions of the Williams Law form,C¼ β ·Qα, in which C is cost, Q is system scale (size), andβ and α are positive constants (Williams ), have beenfound applicable for capital, operation and maintenance
costs. The exponent α is less than one when economies ofscale obtain, and values ranging from 0.2 to 1.5 have beenreported for many processes (Hinomoto ; Tyteca ;
Gillot et al. ). Although economy of scale has generallybeen assumed for overall capital cost, diseconomy of scalehas been reported for water treatment plant capital cost
(Hinomoto ). Further, if energy costs for water/waste-water plants are assumed to follow Williams Law, andconveyance energy were constant at 80% of total energy as
mentioned above, then total energy would be approximatelyC¼ 5 · β ·Qα. More realistically, the multiplier accounting forconveyance energy can be assumed a similar function ofsystemsize, equal tounity for a systemservinga single building,
so that C¼N γ · β ·Qα, in which N is the number of buildingsserved and γ is a constant. Then, the ratio, R, of the cost ofa single system serving N buildings to the cost of N systems
serving N buildings is: R ¼ Nγ � β �Qα=N � β � (Q=N)α. At thebreak-even point for decentralization, this ratio is equal to
unity. In that case, Nγþα�1¼ 1, or in general γþ α¼ 1. That
is, for the centralized system to show advantage, the sum ofthe exponents must not exceed unity, even though the fractionof energy dedicated to conveyance may increase with system
size (i.e. showdiseconomyof scale, γ> 1). Hence, diseconomyof scale may be more common than has been realized.
The purpose of this study is to review and synthesizeavailable information on the costs of individual unit pro-
cesses applicable for distributed DPR, as a function ofprocess scale, and to verify this information as possibleversus previous limited experience with DPR system
implementation. In particular, a review is presented ofcost information for unit processes useful for water reuseincluding activated sludge, membrane bioreactor (MBR),
coagulation/flocculation, reverse osmosis (RO), ultrafiltra-tion, peroxone, and granular activated carbon (GAC), andcontinuous cost functions are developed. Review of costsfor rainwater harvesting, which are highly site-specific, and
other existing and emerging processes useful for reuse isbeyond the scope of this study. Costs of previously reportedreuse treatment systems are then estimated based on the cost
functions presented, and compared to information availableon actual system costs. Discussion and conclusions regard-ing DPR system costs are offered.
COST FUNCTIONS FOR WATER REUSE UNITPROCESSES
In this section, cost information for several water/waste-water treatment and reuse unit processes is reviewed. To
synthesize results for general applicability, reported resultsare first converted to constant 2012 US dollars in proportionto the increase in the GDP deflator (US Bureau of Economic
Analysis ). Then, capital equipment and operation andmaintenance (O&M) costs were fitted to functions ofsystem scale including the form suggested by Williams
() using the Levenberg–Marquardt algorithm (Marquardt) and SigmaPlot® version 12.0 software. The only func-tion found to fit available cost data adequately over severalorders of magnitude of system scale (including onsite sys-
tems) was a logarithmic variant of Williams’ power law, asfollows:
log yð Þ ¼ a log xð Þ½ �bþc (1)
The R2 values found for Equation (1) by non-linearregression are reported for each technology.
225 T. Guo et al. | Review of cost of water reuse processes versus scale Water Science & Technology | 69.2 | 2014
Activated sludge
The activated sludge process may be a useful DPR com-ponent for removal of organic and nitrogen constituents.
Per capita capital cost was reported by Butts & Evans() as a function of population served, with costs for fac-tory-built package plants (750 to 5,000 people) and plantsfabricated onsite (10,000 to 50,000 people) reported separ-
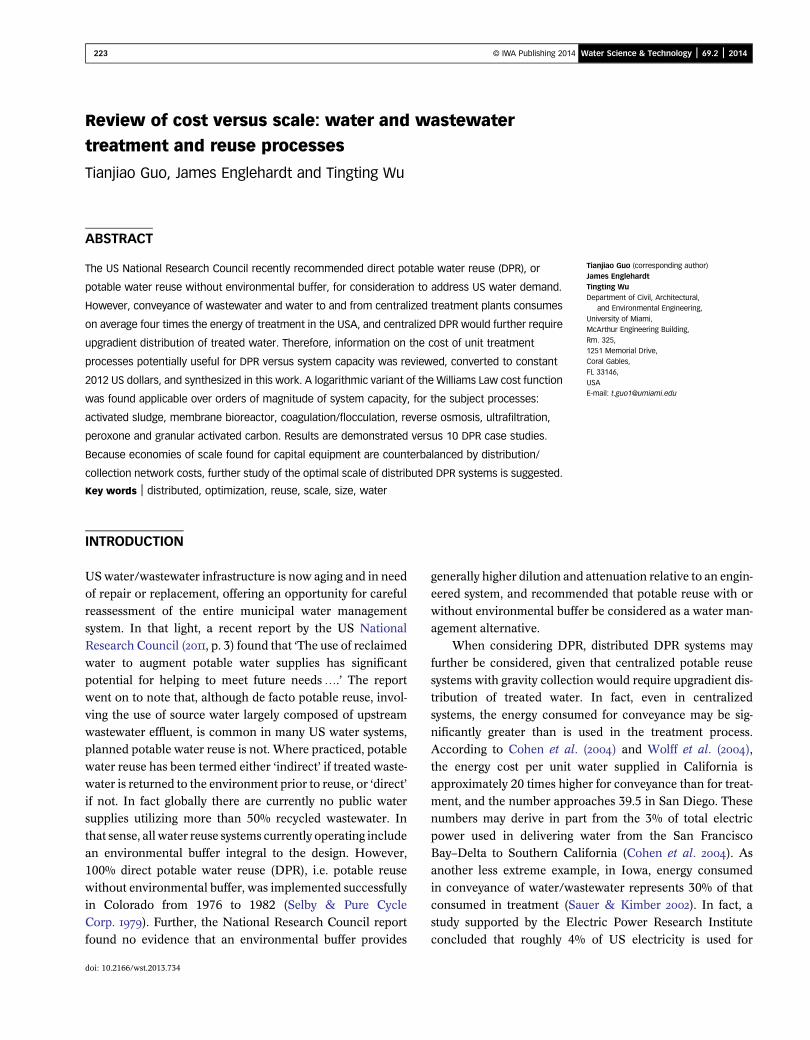
ately. In addition, costs obtained in current research,development, and construction of an onsite DPR system(Englehardt et al. ) indicate capital costs of $49,600
(2009) and $36,334 (2011) for 5.68 m3/d (1,500 US gallonsper day (GPD)) and 1.89 m3/d (500 GPD) attached-growthbiological treatment systems, respectively. In Figure 1,
Equation (1) is fitted to the onsite data points and the capitalcosts obtained from the functions of Butts & Evans ()for package and site-built plants of selected capacities of283.9, 733.0, 1,892.5, 3,785.0, 8,463.5, and 18,925 m3/d,
assuming an average flow per capita as 0.378 m3/d (100GPD) at capacities of 750,
ffiffiffiffiffiffiffiffiffiffiffiffiffiffiffiffiffiffiffiffiffiffiffi750�5,000
p, 5,000, 10,000,ffiffiffiffiffiffiffiffiffiffiffiffiffiffiffiffiffiffiffiffiffiffiffiffiffiffiffiffiffiffiffiffi
10,000�50,000p
, 50,000 people, with R2 value of 0.999.
Also shown is a line corresponding to a linear relationshipbetween cost and capacity, i.e. neither economy nor disec-onomy of scale, passing through the data point for the
smallest plant. Economy of scale is indicated in this case,by a flatter empirical slope relative to the dashed line.
Membrane bioreactor
The MBR process is a relatively newmodification of the acti-vated sludge process which may provide higher quality
effluent, appropriate for DPR. Costs vary greatly with local
Figure 1 | Capital cost of activated sludge plants (Butts & Evans 1970; Englehardt et al.
2013). Conditions: costs converted to constant 2012 US dollars based on the
GDP deflator (US Bureau of Economic Analysis 2013).
construction and power rates, and cost functions are few.
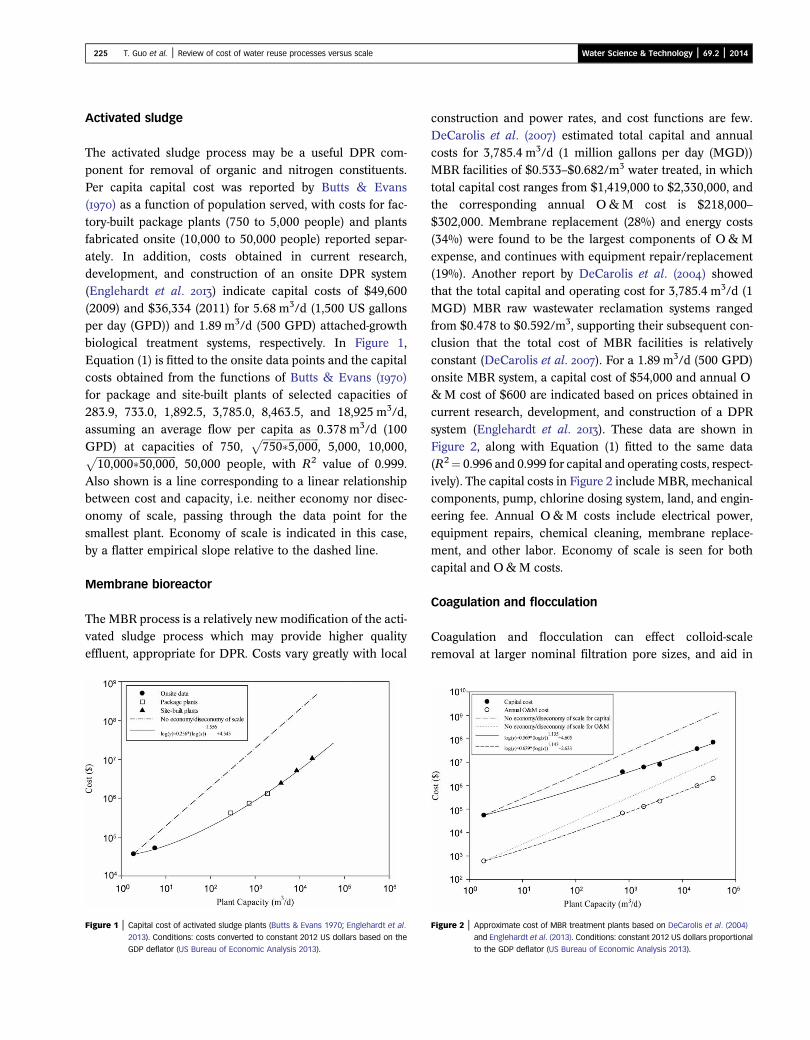
DeCarolis et al. () estimated total capital and annualcosts for 3,785.4 m3/d (1 million gallons per day (MGD))MBR facilities of $0.533–$0.682/m3 water treated, in which
total capital cost ranges from $1,419,000 to $2,330,000, andthe corresponding annual O&M cost is $218,000–$302,000. Membrane replacement (28%) and energy costs(34%) were found to be the largest components of O&M
expense, and continues with equipment repair/replacement(19%). Another report by DeCarolis et al. () showedthat the total capital and operating cost for 3,785.4 m3/d (1
MGD) MBR raw wastewater reclamation systems rangedfrom $0.478 to $0.592/m3, supporting their subsequent con-clusion that the total cost of MBR facilities is relatively
constant (DeCarolis et al. ). For a 1.89 m3/d (500 GPD)onsite MBR system, a capital cost of $54,000 and annual O&M cost of $600 are indicated based on prices obtained incurrent research, development, and construction of a DPR
system (Englehardt et al. ). These data are shown inFigure 2, along with Equation (1) fitted to the same data(R2¼ 0.996 and 0.999 for capital and operating costs, respect-
ively). The capital costs in Figure 2 includeMBR, mechanicalcomponents, pump, chlorine dosing system, land, and engin-eering fee. Annual O&M costs include electrical power,
equipment repairs, chemical cleaning, membrane replace-ment, and other labor. Economy of scale is seen for bothcapital and O&M costs.
Coagulation and flocculation
Coagulation and flocculation can effect colloid-scaleremoval at larger nominal filtration pore sizes, and aid in
Figure 2 | Approximate cost of MBR treatment plants based on DeCarolis et al. (2004)
and Englehardt et al. (2013). Conditions: constant 2012 US dollars proportional
to the GDP deflator (US Bureau of Economic Analysis 2013).
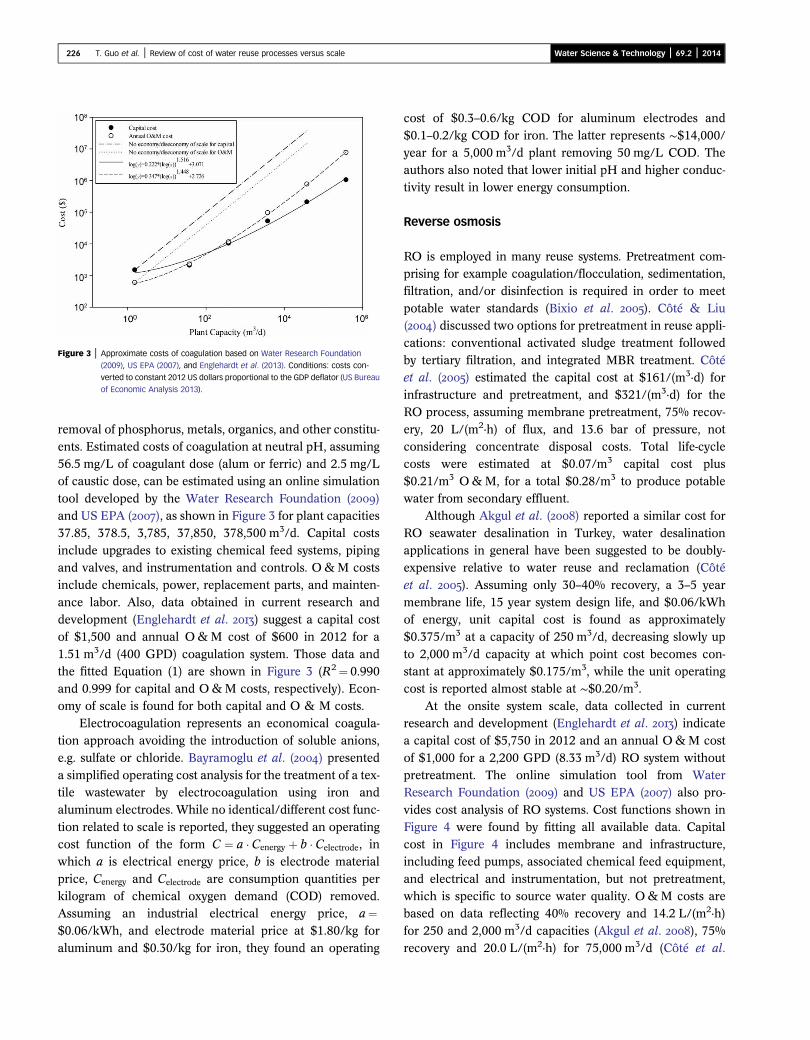
Figure 3 | Approximate costs of coagulation based on Water Research Foundation
(2009), US EPA (2007), and Englehardt et al. (2013). Conditions: costs con-
verted to constant 2012 US dollars proportional to the GDP deflator (US Bureau
of Economic Analysis 2013).
226 T. Guo et al. | Review of cost of water reuse processes versus scale Water Science & Technology | 69.2 | 2014
removal of phosphorus, metals, organics, and other constitu-ents. Estimated costs of coagulation at neutral pH, assuming56.5 mg/L of coagulant dose (alum or ferric) and 2.5 mg/Lof caustic dose, can be estimated using an online simulation
tool developed by the Water Research Foundation ()and US EPA (), as shown in Figure 3 for plant capacities37.85, 378.5, 3,785, 37,850, 378,500 m3/d. Capital costs
include upgrades to existing chemical feed systems, pipingand valves, and instrumentation and controls. O&M costsinclude chemicals, power, replacement parts, and mainten-
ance labor. Also, data obtained in current research anddevelopment (Englehardt et al. ) suggest a capital costof $1,500 and annual O&M cost of $600 in 2012 for a
1.51 m3/d (400 GPD) coagulation system. Those data andthe fitted Equation (1) are shown in Figure 3 (R2¼ 0.990and 0.999 for capital and O&M costs, respectively). Econ-omy of scale is found for both capital and O & M costs.
Electrocoagulation represents an economical coagula-tion approach avoiding the introduction of soluble anions,e.g. sulfate or chloride. Bayramoglu et al. () presenteda simplified operating cost analysis for the treatment of a tex-tile wastewater by electrocoagulation using iron andaluminum electrodes. While no identical/different cost func-
tion related to scale is reported, they suggested an operatingcost function of the form C ¼ a � Cenergy þ b � Celectrode, inwhich a is electrical energy price, b is electrode material
price, Cenergy and Celectrode are consumption quantities perkilogram of chemical oxygen demand (COD) removed.Assuming an industrial electrical energy price, a¼$0.06/kWh, and electrode material price at $1.80/kg for
aluminum and $0.30/kg for iron, they found an operating
cost of $0.3–0.6/kg COD for aluminum electrodes and
$0.1–0.2/kg COD for iron. The latter represents ∼$14,000/year for a 5,000 m3/d plant removing 50 mg/L COD. Theauthors also noted that lower initial pH and higher conduc-
tivity result in lower energy consumption.
Reverse osmosis
RO is employed in many reuse systems. Pretreatment com-prising for example coagulation/flocculation, sedimentation,filtration, and/or disinfection is required in order to meet
potable water standards (Bixio et al. ). Côté & Liu() discussed two options for pretreatment in reuse appli-cations: conventional activated sludge treatment followed
by tertiary filtration, and integrated MBR treatment. Côtéet al. () estimated the capital cost at $161/(m3·d) forinfrastructure and pretreatment, and $321/(m3·d) for the
RO process, assuming membrane pretreatment, 75% recov-ery, 20 L/(m2·h) of flux, and 13.6 bar of pressure, notconsidering concentrate disposal costs. Total life-cyclecosts were estimated at $0.07/m3 capital cost plus
$0.21/m3 O&M, for a total $0.28/m3 to produce potablewater from secondary effluent.
Although Akgul et al. () reported a similar cost for
RO seawater desalination in Turkey, water desalinationapplications in general have been suggested to be doubly-expensive relative to water reuse and reclamation (Côté
et al. ). Assuming only 30–40% recovery, a 3–5 yearmembrane life, 15 year system design life, and $0.06/kWhof energy, unit capital cost is found as approximately$0.375/m3 at a capacity of 250 m3/d, decreasing slowly up
to 2,000 m3/d capacity at which point cost becomes con-stant at approximately $0.175/m3, while the unit operatingcost is reported almost stable at ∼$0.20/m3.
At the onsite system scale, data collected in currentresearch and development (Englehardt et al. ) indicatea capital cost of $5,750 in 2012 and an annual O&M cost
of $1,000 for a 2,200 GPD (8.33 m3/d) RO system withoutpretreatment. The online simulation tool from WaterResearch Foundation () and US EPA () also pro-
vides cost analysis of RO systems. Cost functions shown inFigure 4 were found by fitting all available data. Capitalcost in Figure 4 includes membrane and infrastructure,including feed pumps, associated chemical feed equipment,
and electrical and instrumentation, but not pretreatment,which is specific to source water quality. O&M costs arebased on data reflecting 40% recovery and 14.2 L/(m2·h)
for 250 and 2,000 m3/d capacities (Akgul et al. ), 75%recovery and 20.0 L/(m2·h) for 75,000 m3/d (Côté et al.
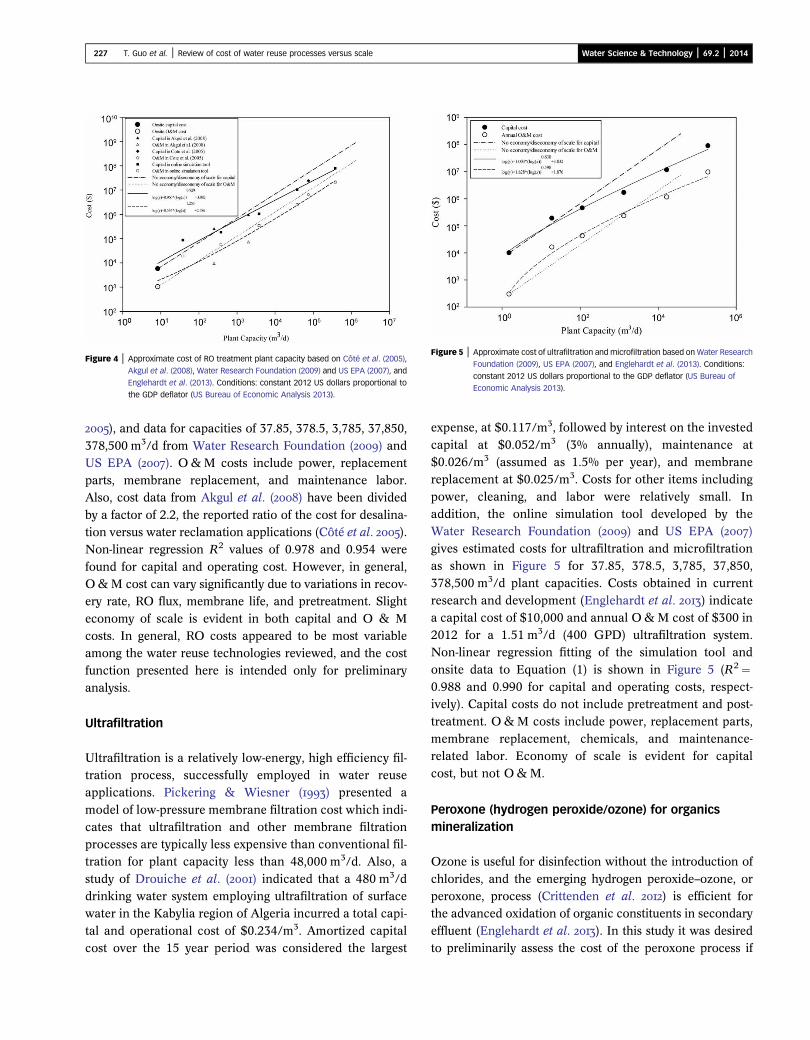
Figure 4 | Approximate cost of RO treatment plant capacity based on Côté et al. (2005),
Akgul et al. (2008), Water Research Foundation (2009) and US EPA (2007), and
Englehardt et al. (2013). Conditions: constant 2012 US dollars proportional to
the GDP deflator (US Bureau of Economic Analysis 2013).
Figure 5 | Approximate cost of ultrafiltration and microfiltration based on Water Research
Foundation (2009), US EPA (2007), and Englehardt et al. (2013). Conditions:
constant 2012 US dollars proportional to the GDP deflator (US Bureau of
Economic Analysis 2013).
227 T. Guo et al. | Review of cost of water reuse processes versus scale Water Science & Technology | 69.2 | 2014
), and data for capacities of 37.85, 378.5, 3,785, 37,850,
378,500 m3/d from Water Research Foundation () andUS EPA (). O&M costs include power, replacementparts, membrane replacement, and maintenance labor.Also, cost data from Akgul et al. () have been divided
by a factor of 2.2, the reported ratio of the cost for desalina-tion versus water reclamation applications (Côté et al. ).Non-linear regression R2 values of 0.978 and 0.954 were
found for capital and operating cost. However, in general,O&M cost can vary significantly due to variations in recov-ery rate, RO flux, membrane life, and pretreatment. Slight
economy of scale is evident in both capital and O & Mcosts. In general, RO costs appeared to be most variableamong the water reuse technologies reviewed, and the cost
function presented here is intended only for preliminaryanalysis.
Ultrafiltration
Ultrafiltration is a relatively low-energy, high efficiency fil-tration process, successfully employed in water reuseapplications. Pickering & Wiesner () presented a
model of low-pressure membrane filtration cost which indi-cates that ultrafiltration and other membrane filtrationprocesses are typically less expensive than conventional fil-tration for plant capacity less than 48,000 m3/d. Also, a
study of Drouiche et al. () indicated that a 480 m3/ddrinking water system employing ultrafiltration of surfacewater in the Kabylia region of Algeria incurred a total capi-
tal and operational cost of $0.234/m3. Amortized capitalcost over the 15 year period was considered the largest
expense, at $0.117/m3, followed by interest on the invested
capital at $0.052/m3 (3% annually), maintenance at$0.026/m3 (assumed as 1.5% per year), and membranereplacement at $0.025/m3. Costs for other items including
power, cleaning, and labor were relatively small. Inaddition, the online simulation tool developed by theWater Research Foundation () and US EPA ()
gives estimated costs for ultrafiltration and microfiltrationas shown in Figure 5 for 37.85, 378.5, 3,785, 37,850,378,500 m3/d plant capacities. Costs obtained in current
research and development (Englehardt et al. ) indicatea capital cost of $10,000 and annual O&M cost of $300 in2012 for a 1.51 m3/d (400 GPD) ultrafiltration system.Non-linear regression fitting of the simulation tool and
onsite data to Equation (1) is shown in Figure 5 (R2¼0.988 and 0.990 for capital and operating costs, respect-ively). Capital costs do not include pretreatment and post-
treatment. O&M costs include power, replacement parts,membrane replacement, chemicals, and maintenance-related labor. Economy of scale is evident for capital
cost, but not O&M.
Peroxone (hydrogen peroxide/ozone) for organicsmineralization
Ozone is useful for disinfection without the introduction of
chlorides, and the emerging hydrogen peroxide–ozone, orperoxone, process (Crittenden et al. ) is efficient forthe advanced oxidation of organic constituents in secondary
effluent (Englehardt et al. ). In this study it was desiredto preliminarily assess the cost of the peroxone process if
228 T. Guo et al. | Review of cost of water reuse processes versus scale Water Science & Technology | 69.2 | 2014
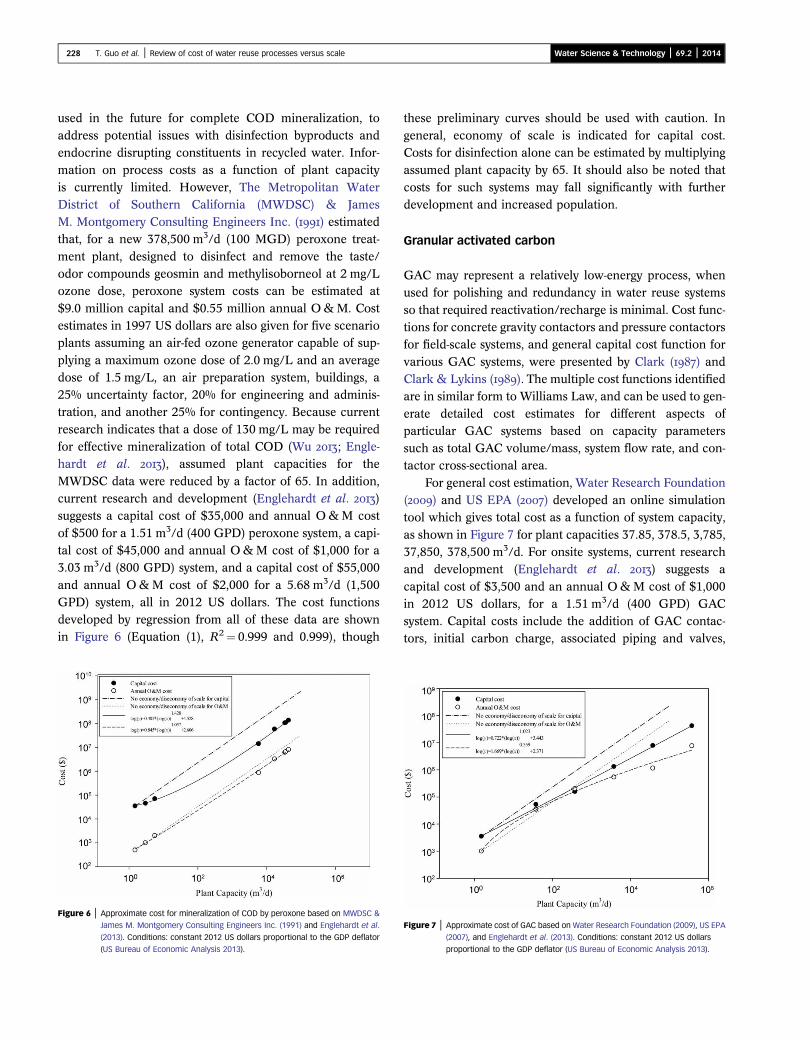
used in the future for complete COD mineralization, to
address potential issues with disinfection byproducts andendocrine disrupting constituents in recycled water. Infor-mation on process costs as a function of plant capacity
is currently limited. However, The Metropolitan WaterDistrict of Southern California (MWDSC) & JamesM. Montgomery Consulting Engineers Inc. () estimatedthat, for a new 378,500 m3/d (100 MGD) peroxone treat-
ment plant, designed to disinfect and remove the taste/odor compounds geosmin and methylisoborneol at 2 mg/Lozone dose, peroxone system costs can be estimated at
$9.0 million capital and $0.55 million annual O&M. Costestimates in 1997 US dollars are also given for five scenarioplants assuming an air-fed ozone generator capable of sup-
plying a maximum ozone dose of 2.0 mg/L and an averagedose of 1.5 mg/L, an air preparation system, buildings, a25% uncertainty factor, 20% for engineering and adminis-tration, and another 25% for contingency. Because current
research indicates that a dose of 130 mg/L may be requiredfor effective mineralization of total COD (Wu ; Engle-hardt et al. ), assumed plant capacities for the
MWDSC data were reduced by a factor of 65. In addition,current research and development (Englehardt et al. )suggests a capital cost of $35,000 and annual O&M cost
of $500 for a 1.51 m3/d (400 GPD) peroxone system, a capi-tal cost of $45,000 and annual O&M cost of $1,000 for a3.03 m3/d (800 GPD) system, and a capital cost of $55,000
and annual O&M cost of $2,000 for a 5.68 m3/d (1,500GPD) system, all in 2012 US dollars. The cost functionsdeveloped by regression from all of these data are shownin Figure 6 (Equation (1), R2¼ 0.999 and 0.999), though
Figure 6 | Approximate cost for mineralization of COD by peroxone based on MWDSC &
James M. Montgomery Consulting Engineers Inc. (1991) and Englehardt et al.
(2013). Conditions: constant 2012 US dollars proportional to the GDP deflator
(US Bureau of Economic Analysis 2013).
these preliminary curves should be used with caution. In
general, economy of scale is indicated for capital cost.Costs for disinfection alone can be estimated by multiplyingassumed plant capacity by 65. It should also be noted that
costs for such systems may fall significantly with furtherdevelopment and increased population.
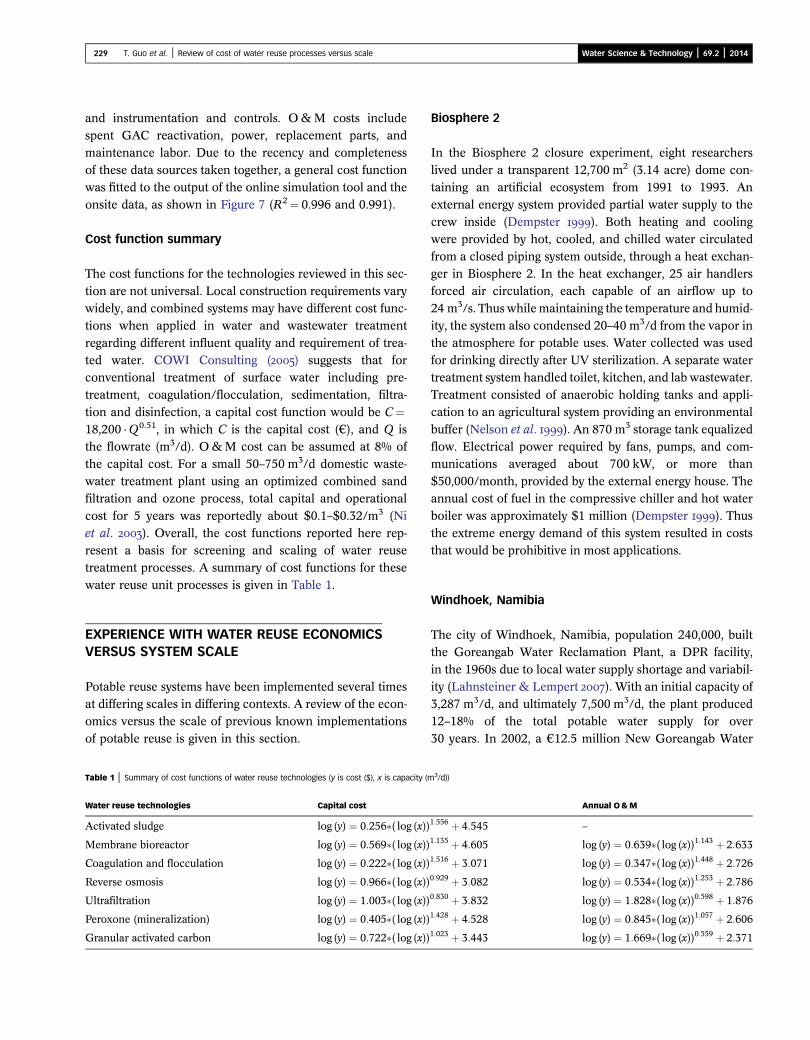
Granular activated carbon
GAC may represent a relatively low-energy process, whenused for polishing and redundancy in water reuse systems
so that required reactivation/recharge is minimal. Cost func-tions for concrete gravity contactors and pressure contactorsfor field-scale systems, and general capital cost function for
various GAC systems, were presented by Clark () andClark & Lykins (). The multiple cost functions identifiedare in similar form to Williams Law, and can be used to gen-
erate detailed cost estimates for different aspects ofparticular GAC systems based on capacity parameterssuch as total GAC volume/mass, system flow rate, and con-tactor cross-sectional area.
For general cost estimation, Water Research Foundation() and US EPA () developed an online simulationtool which gives total cost as a function of system capacity,
as shown in Figure 7 for plant capacities 37.85, 378.5, 3,785,37,850, 378,500 m3/d. For onsite systems, current researchand development (Englehardt et al. ) suggests a
capital cost of $3,500 and an annual O&M cost of $1,000in 2012 US dollars, for a 1.51 m3/d (400 GPD) GACsystem. Capital costs include the addition of GAC contac-tors, initial carbon charge, associated piping and valves,
Figure 7 | Approximate cost of GAC based on Water Research Foundation (2009), US EPA
(2007), and Englehardt et al. (2013). Conditions: constant 2012 US dollars
proportional to the GDP deflator (US Bureau of Economic Analysis 2013).
229 T. Guo et al. | Review of cost of water reuse processes versus scale Water Science & Technology | 69.2 | 2014
and instrumentation and controls. O&M costs include
spent GAC reactivation, power, replacement parts, andmaintenance labor. Due to the recency and completenessof these data sources taken together, a general cost function
was fitted to the output of the online simulation tool and theonsite data, as shown in Figure 7 (R2¼ 0.996 and 0.991).
Cost function summary
The cost functions for the technologies reviewed in this sec-
tion are not universal. Local construction requirements varywidely, and combined systems may have different cost func-tions when applied in water and wastewater treatment
regarding different influent quality and requirement of trea-ted water. COWI Consulting () suggests that forconventional treatment of surface water including pre-treatment, coagulation/flocculation, sedimentation, filtra-
tion and disinfection, a capital cost function would be C¼18,200 ·Q0.51, in which C is the capital cost (€), and Q isthe flowrate (m3/d). O&M cost can be assumed at 8% of
the capital cost. For a small 50–750 m3/d domestic waste-water treatment plant using an optimized combined sandfiltration and ozone process, total capital and operational
cost for 5 years was reportedly about $0.1–$0.32/m3 (Niet al. ). Overall, the cost functions reported here rep-resent a basis for screening and scaling of water reusetreatment processes. A summary of cost functions for these
water reuse unit processes is given in Table 1.
EXPERIENCE WITH WATER REUSE ECONOMICSVERSUS SYSTEM SCALE
Potable reuse systems have been implemented several timesat differing scales in differing contexts. A review of the econ-omics versus the scale of previous known implementations
of potable reuse is given in this section.
Table 1 | Summary of cost functions of water reuse technologies (y is cost ($), x is capacity (
Water reuse technologies Capital cost
Activated sludge log (y) ¼ 0:256�( log (x))Membrane bioreactor log (y) ¼ 0:569�( log (x))Coagulation and flocculation log (y) ¼ 0:222�( log (x))Reverse osmosis log (y) ¼ 0:966�( log (x))Ultrafiltration log (y) ¼ 1:003�( log (x))Peroxone (mineralization) log (y) ¼ 0:405�( log (x))Granular activated carbon log (y) ¼ 0:722�( log (x))
Biosphere 2
In the Biosphere 2 closure experiment, eight researcherslived under a transparent 12,700 m2 (3.14 acre) dome con-
taining an artificial ecosystem from 1991 to 1993. Anexternal energy system provided partial water supply to thecrew inside (Dempster ). Both heating and coolingwere provided by hot, cooled, and chilled water circulated
from a closed piping system outside, through a heat exchan-ger in Biosphere 2. In the heat exchanger, 25 air handlersforced air circulation, each capable of an airflow up to
24 m3/s. Thus while maintaining the temperature and humid-ity, the system also condensed 20–40 m3/d from the vapor inthe atmosphere for potable uses. Water collected was used
for drinking directly after UV sterilization. A separate watertreatment system handled toilet, kitchen, and lab wastewater.Treatment consisted of anaerobic holding tanks and appli-cation to an agricultural system providing an environmental
buffer (Nelson et al. ). An 870 m3 storage tank equalizedflow. Electrical power required by fans, pumps, and com-munications averaged about 700 kW, or more than
$50,000/month, provided by the external energy house. Theannual cost of fuel in the compressive chiller and hot waterboiler was approximately $1 million (Dempster ). Thus
the extreme energy demand of this system resulted in coststhat would be prohibitive in most applications.
Windhoek, Namibia
The city of Windhoek, Namibia, population 240,000, builtthe Goreangab Water Reclamation Plant, a DPR facility,
in the 1960s due to local water supply shortage and variabil-ity (Lahnsteiner & Lempert ). With an initial capacity of3,287 m3/d, and ultimately 7,500 m3/d, the plant produced12–18% of the total potable water supply for over
30 years. In 2002, a €12.5 million New Goreangab Water
m3/d))
Annual O&M
1:556 þ 4:545 –
1:135 þ 4:605 log (y) ¼ 0:639�( log (x))1:143 þ 2:6331:516 þ 3:071 log (y) ¼ 0:347�( log (x))1:448 þ 2:7260:929 þ 3:082 log (y) ¼ 0:534�( log (x))1:253 þ 2:7860:830 þ 3:832 log (y) ¼ 1:828�( log (x))0:598 þ 1:8761:428 þ 4:528 log (y) ¼ 0:845�( log (x))1:057 þ 2:6061:023 þ 3:443 log (y) ¼ 1:669�( log (x))0:559 þ 2:371
230 T. Guo et al. | Review of cost of water reuse processes versus scale Water Science & Technology | 69.2 | 2014
Reclamation Plant was built. Project influent was unchlori-
nated secondary effluent. The progressive city water priceof $0.72/m3 for 0–0.2 m3/d; $1.18/m3 for 0.201–1.8 m3/d;and $2.22/m3 for >1.8 m3/d in 2004 was reasonable in com-
parison with US prices of ca $0.40/m3. Based on Canizareset al. (), the capital cost of ozonation cost can be esti-mated as P ¼ 2,359:85�(V=12)0:6143 after conversion to2012 US dollars, where V is the flow rate (m3/d) and P is
the capital cost ($), assuming ozone dosage at 2 mg/L.Given a similar treatment train comprising enhanced coagu-lation and flocculation, ozonation, GAC filtration, and
ultrafiltration, without chlorine disinfection or stabilization,and assuming the 21,000 m3/d capacity of the new plant, acapital cost of $21.3 million (2012 US dollars) would be esti-
mated using the equations in Table 1.
Denver potable water project
From 1979 to 1992, the Denver Potable Water ReuseDemonstration Project demonstrated the conversion ofunchlorinated secondary effluent into water that could be
directly piped into a drinking water distribution system. Pro-duct water from the 3,785.4 m3/d (1.0 MGD) plant was notused for drinking, but stored and shown as part of the pro-
ject’s public program (Rogers & Lauer ). The plant’sconstruction cost was $18.5 million, with $6.0 million forscientific studies on health risks, and $8.4 million O&M
over the 13 years (Lauer ). For a similar system compris-ing flocculation, reverse osmoses, two stages of GAC,ozonation, and ultrafiltration, without lime treatment, recar-bonation, air stripping, UV or chlorine dioxide disinfection,
at a capacity of 3,785.4 m3/d, a capital cost of $9.7 millionwould be estimated using the equations of Table 1.
International Space System
As of November 2008, the International Space System devel-
oped by NASA included a Water Recovery System consistingof Water Processor Assembly and Urine Processor Assembly(Carter ). The system provided drinking water to a crew
of six members, and was derived from a combination of con-densate and urine. Flush water and urine were treated with aformula containing chromium trioxide and sulfuric acid.From there the water passed to a distillation assembly, con-
sisting of a rotating centrifuge where the wastewater andurine stream were evaporated and condensed. The Urine Pro-cessor Assembly was designed for a load of 9 kg/d (19.8 lb/d)
and could recover a minimum of 85% of the water content,essentially equivalent to the six-crew requirement. The
Water Recovery System reportedly averaged 743W power
consumption while in operation, and 297W while in stand-by, or less than perhaps $40/month, high for six people.
Village of Cloudcroft
Due to lack of sufficient water supply from local springs andwells, the village of Cloudcroft, NewMexico, USA, population
850 increasing to more than 2,000 during holidays, con-structed a system to provide potable water from purifiedwastewater (Livingston ). Following treatment by MBR,
disinfection, RO, and UV/hydrogen peroxide advanced oxi-dation, the treated municipal wastewater is blended withapproximately 50% spring or well water. The blended water
is detained for 2 weeks in a storage reservoir, after which itundergoes ultrafiltration, UV disinfection, and activatedcarbon adsorption. With a treatment capacity of 378.5 m3/d(100,000 GPD), capital cost of the project is roughly
$3,500,000, with operating costs of $50,000/year and equip-ment maintenance costs of $0.21/m3. Overall, the cost ofoperation and maintenance is $0.63/m3, and the total cost of
product water is $2.38/m3. Given a similar system comprisingMBR, RO, peroxone, ultrafiltration, and GAC at a capacity of378.5 m3/d, a capital cost of $3.5million (withoutUVdisinfec-
tion) would be estimated using the equations of Table 1.
Chanute, KS
During a severe drought, the city of Chanute, Kansas, USA,population 12,000 at the time, implemented emergency waste-water reclamation and reuse for municipal water supply from
October 1956 to March 1957 (Mangan ; Asano et al.). The Neosho River, previously used to supply the citywater demand of 5,300 m3/d (1.4 MGD), was dammed
upstream of the treatment plant, and sewage treatment planteffluent was returned to the river as source water. Treatmentcomprised standard 1950s physical–chemical technology,
including alum flocculation, sedimentation, sand filtrationand chlorine disinfection. Activated carbon andmembrane fil-tration were not available. Assuming a similar treatment train
consisting of activated sludge and flocculation, without sandfiltration and chlorine disinfection in Metzler et al. (), ata capacity of 5,300 m3/d, a capital cost of $3.4 millionwould be estimated using the equations of Table 1.
Big Spring, TX
Due to a long-term drought in the Permian Basin of WestTexas, the Colorado River Municipal Water District, which
231 T. Guo et al. | Review of cost of water reuse processes versus scale Water Science & Technology | 69.2 | 2014
supplies water to the cities of Odessa, Big Spring and Snyder,
recently launched a wastewater reuse project. The plan is totreat 7,949.4 m3/d (2.1 MGD) of filtered secondary effluentwith membrane filtration, RO, and UV/hydrogen peroxide
oxidation; blend it with raw water in the transmission line;and pass the water to a potable water treatment processwhich includes flocculation, sedimentation, granular mediafiltration and disinfection, before release to the distribution
network to comprise ca 5% of the finished water. In the pre-liminary design report (Sloan ), construction cost wasestimated to be $8.23 million, including $3.45 million for
treatment equipment, $0.88 million for the pump station,and $0.70 million for the pump line. Annual operating costwas estimated at $667,000 for power, chemical, labor and
equipment replacement. Produced water is projected tocost $0.68/m3. Total energy consumption for operation ofthe membrane treatment, UV oxidation, and source waterand product water pumping is projected at 1.41 kWh/m3.
This is comparable to the current local operating cost of1.33 kWh/m3, due principally to the long pumping distanceand the 914.4 m (3,000 ft) elevation of Big Spring (Sloan
et al. ). Assuming membrane filtration, RO, UV/hydro-gen peroxide oxidation, coagulation, and granular mediafiltration at a capacity of 7,949 m3/d, a capital cost of $14.6
million (without disinfection) can be estimated using theequations of Table 1.
Orange County Water District, CA
The Orange County Water District’s Groundwater Replen-ishment System treats disinfected secondary effluent with
microfiltration, RO, and UV/hydrogen peroxide oxidation,and product water is used to recharge existing groundwaterbasins. The augmented Orange County groundwater basin
supplies water for roughly 2.5 million people, while receiv-ing up to 265,000 m3/d of treated wastewater for recharge(Markus et al. ; Deshmukh ; Tchobanoglous et al.). This $481 million project had an annual budget of∼$34 million (Woodside & Westropp ). Assuming anengineering process comprising microfiltration, three
stages of RO, and UV/hydrogen peroxide oxidation at acapacity of 265,000 m3/d, a capital cost of $253.8 millioncan be estimated using the equations of Table 1.
Pure Cycle Corporation
In the 1970s, the Pure Cycle Corporation developed a com-
plete closed-loop DPR system for single homes. These unitswere installed primarily in mountain homes in Colorado
from 1976 to 1982 (M. Harding, Pure Cycle Corp., personal
communication). The system consisted of a wastewaterholding tank, a biological digester, an ultrafiltration unit,and a deionization unit (Selby & Pure Cycle Corp. ).
A central control system communicated with companyheadquarters in Denver. After the company exited thebusiness due to the expense of maintaining single systemsscattered throughout the mountains, homeowners obtained
permission from the State to operate the systems indepen-dently. While operating costs are not available for thesesystems, one could assume a cost of <$1.32/m3 water trea-
ted for acid and base regenerant, assuming on the order of100 mg/L ions removed, to be a dominant operating cost.The cost of brine evaporation or disposal is not known.
Singapore NEWater Project
With a large urban population and limited land area, theSingapore city-state launched the NEWaterProject in 2002,to reuse clarified secondary effluent as a supplementalwater supply (Singapore Water Reclamation Study ).
Treatment comprises microfiltration, RO, and UV disinfec-tion, followed by blending with reservoir water for potableuse. Recycled water contributed only ∼2% to the finished
potable water as of 2010. Two 72,000 m3/d plants were com-missioned in January 2003. A third 24,000 m3/d plant begansupplying water in January 2004, and a fourth 148,000 m3/d
plant was brought online January 2005 (Asano et al. ).Cost of the product water including production, trans-mission and distribution was about S$1.30/m3 in 2003,decreasing to S$1.00/m3 (US $0.66/m3) by April 2007
(Zhang et al. ). Assuming microfiltration, and RO at acapacity of 316,000 m3/d, a capital cost of $152.8 million(without disinfection) can be estimated using the equations
of Table 1.
Case study summary
A summary of the scales and costs of previous potable reuseimplementations is given in Table 2, based on the infor-
mation in this section. Capital costs estimated as describedfor each case study in this section, using the cost functionsdeveloped in this work, are also shown in the table. Despitethe site-specificity of many labor, construction, and other
costs, predicted costs are generally within a factor of tworelative to reported costs, except for the Denver researchand demonstration project, which may have phases not
reflected in estimated costs. Also, no obvious bias isapparent.
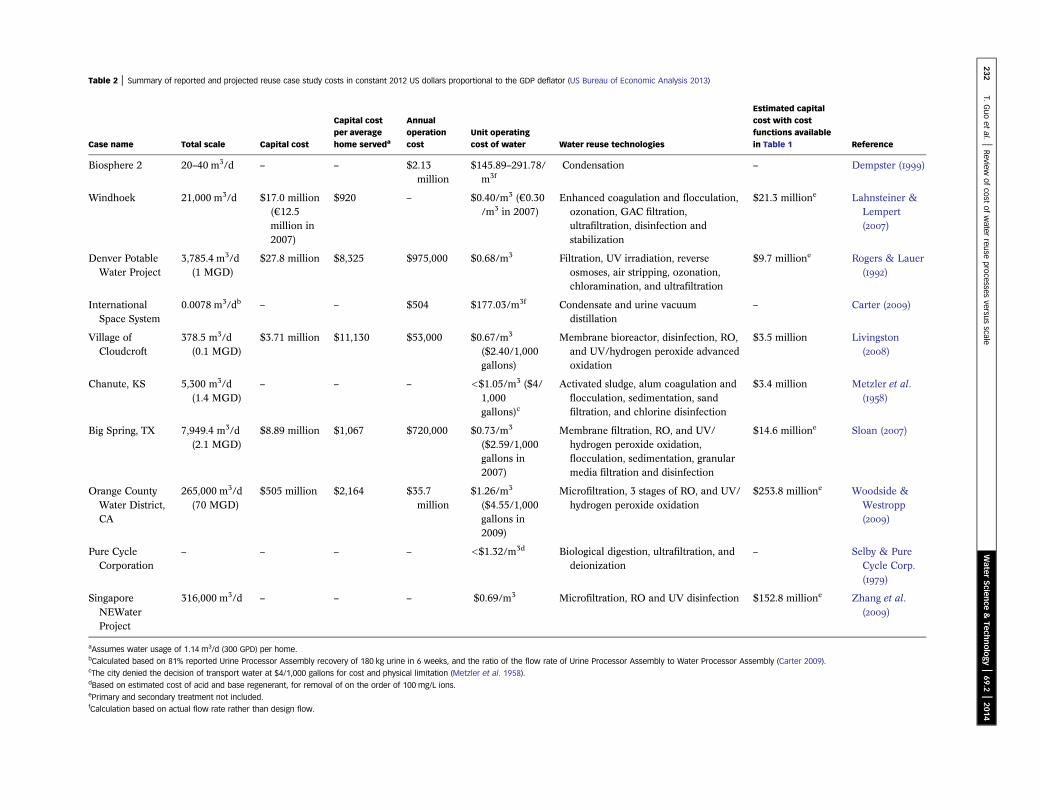
Table 2 | Summary of reported and projected reuse case study costs in constant 2012 US dollars proportional to the GDP deflator (US Bureau of Economic Analysis 2013)
Case name Total scale Capital cost
Capital costper averagehome serveda
Annualoperationcost
Unit operatingcost of water Water reuse technologies
Estimated capitalcost with costfunctions availablein Table 1 Reference
Biosphere 2 20–40 m3/d – – $2.13million
$145.89–291.78/m3f
Condensation – Dempster ()
Windhoek 21,000 m3/d $17.0 million(€12.5million in2007)
$920 – $0.40/m3 (€0.30/m3 in 2007)
Enhanced coagulation and flocculation,ozonation, GAC filtration,ultrafiltration, disinfection andstabilization
$21.3 millione Lahnsteiner &Lempert()
Denver PotableWater Project
3,785.4 m3/d(1 MGD)
$27.8 million $8,325 $975,000 $0.68/m3 Filtration, UV irradiation, reverseosmoses, air stripping, ozonation,chloramination, and ultrafiltration
$9.7 millione Rogers & Lauer()
InternationalSpace System
0.0078 m3/db – – $504 $177.03/m3f Condensate and urine vacuumdistillation
– Carter ()
Village ofCloudcroft
378.5 m3/d(0.1 MGD)
$3.71 million $11,130 $53,000 $0.67/m3
($2.40/1,000gallons)
Membrane bioreactor, disinfection, RO,and UV/hydrogen peroxide advancedoxidation
$3.5 million Livingston()
Chanute, KS 5,300 m3/d(1.4 MGD)
– – – <$1.05/m3 ($4/1,000gallons)c
Activated sludge, alum coagulation andflocculation, sedimentation, sandfiltration, and chlorine disinfection
$3.4 million Metzler et al.()
Big Spring, TX 7,949.4 m3/d(2.1 MGD)
$8.89 million $1,067 $720,000 $0.73/m3
($2.59/1,000gallons in2007)
Membrane filtration, RO, and UV/hydrogen peroxide oxidation,flocculation, sedimentation, granularmedia filtration and disinfection
$14.6 millione Sloan ()
Orange CountyWater District,CA
265,000 m3/d(70 MGD)
$505 million $2,164 $35.7million
$1.26/m3
($4.55/1,000gallons in2009)
Microfiltration, 3 stages of RO, and UV/hydrogen peroxide oxidation
$253.8 millione Woodside &Westropp()
Pure CycleCorporation
– – – – <$1.32/m3d Biological digestion, ultrafiltration, anddeionization
– Selby & PureCycle Corp.()
SingaporeNEWaterProject
316,000 m3/d – – – $0.69/m3 Microfiltration, RO and UV disinfection $152.8 millione Zhang et al.()
aAssumes water usage of 1.14 m3/d (300 GPD) per home.bCalculated based on 81% reported Urine Processor Assembly recovery of 180 kg urine in 6 weeks, and the ratio of the flow rate of Urine Processor Assembly to Water Processor Assembly (Carter 2009).cThe city denied the decision of transport water at $4/1,000 gallons for cost and physical limitation (Metzler et al. 1958).dBased on estimated cost of acid and base regenerant, for removal of on the order of 100 mg/L ions.ePrimary and secondary treatment not included.fCalculation based on actual flow rate rather than design flow.
232T.
Guo
etal. |
Reviewof
costof
water
reuseprocesses
versusscale
Water
Science
&Tech
nology
|69.2
|2014

233 T. Guo et al. | Review of cost of water reuse processes versus scale Water Science & Technology | 69.2 | 2014
CONCLUSIONS
The applicability of distributed DPR systems will likely
depend in part on local topographic, demographic, andhydrologic characteristics, on needs for reductions inenergy consumption for water conveyance, and on projectedincreases in water demand. When substantial investment has
previously been made in centralized water/wastewater treat-ment systems, the scaling of potable water reuse systemsmay be largely determined by existing infrastructure. How-
ever, much of the water/wastewater infrastructure in theUSA today is in need of repair and/or replacement, and there-fore information on the cost of current technologies versus
system scale will be needed. In particular, the following con-clusions were drawn based on the literature reviewed.
1. A logarithmic variant of the Williams Law cost functionappears to apply satisfactorily to both capital and O&Mcost of water reuse technologies, over orders of magni-
tude in system capacity.2. The cost functions found in the literature and derived in
this work were roughly demonstrated versus availabledata on DPR systems.
3. Results indicate that economies of scale apply for manyunit processes. However, capital and operating costsfor collection/distribution networks counterbalance these
economies in centralized systems. Therefore, study of theoptimal scale of distributed DPR systems is recommended,along with further study of the costs of emerging processes.
ACKNOWLEDGEMENTS
The support of the US National Science Foundation (AwardNo. 1038527) for this work is gratefully acknowledged. Also,anonymous reviewers are thanked for their input and con-
structive suggestions regarding earlier versions of the paper.
REFERENCES
Akgul, D., Cakmakcr, M., Kayaalp, N. & Koyuncu, I. Costanalysis of seawater desalination with reverse osmosis inTurkey. Desalination 220, 123–131.
Asano, T., Burton, F. L., Leverenz, H. L., Tsuchihashi, R. &Tchobanoglous, G. Water Reuse: Issues, Technologies,and Applications. McGraw-Hill, New York, USA.
Bayramoglu, M., Kobya, M., Can, O. T. & Sozbir, M. Operating cost analysis of electrocoagulation of textile dyewastewater. Sep. Purif. Technol. 37, 117–125.
Bixio, D., Heyder, B. D., Cikurel, H., Muston, M., Miska, V.,Joksimovic, D., Schäfer, A. I., Ravazzini, A., Aharoni, A., Savic,D. & Thoeye, C. Municipal wastewater reclamation:where do we stand? An overview of treatment technology andmanagement practice. Water Sci. Technol. 5, 77–85.
Butts, T. A.&Evans, R. L. Cost ofMunicipal Sewage TreatmentPlants in Illinois. Illinois State Water Survey, IllinoisDepartment of Registration and Education, Urbana, IL, USA.
Canizares, P., Paz, R., Saez, C. & Rodrigo, M. A. Costs of theelectrochemical oxidation of wastewaters: a comparison withozonation and Fenton oxidation processes. J. Environ.Manage. 90 (1), 410–420.
Carter, D. L. Status of the Regenerative ECLSS Water RecoverySystem. Paper No. 2009-01-2352. NASA Marshall Space FlightCenter, Huntsville, AL. In 39th International Conference onEnvironmental Systems, July 12–16, 2009, Savannah, GA, USA.
Clark, R. M. Evaluating the cost and performance of field-scale granular activated carbon systems. Environ. Sci.Technol. 21 (6), 573–580.
Clark, R. M. & Lykins, B. W. Granular Activated Carbon:Design, Operation and Cost. Lewis Publishers, Chelsea, MI,USA.
Crittenden, J. C., Trussell, R. R., Hand, D. W., Howe, K. J. &Tchobanoglous, G. MWH’s Water Treatment: Principlesand Design. Wiley, Hoboken, NJ, USA.
Cohen, R., Nelson, B.&Wolff, G. EnergyDown theDrain: TheHidden Costs of California’s Water Supply.Natural ResourcesDefense Council, Pacific Institute, Oakland, CA, USA.
Côté, P. & Liu, M. MBR beats tertiary filtration for indirectwater reuse. Desalin. Water Reuse 13 (4), 32–37.
Côté, P., Siverns, S. & Monti, S. Comparison of membrane-based solutions for water reclamation and desalination.Desalination 182, 251–257.
COWI Consulting Rural Cost Functions for Water Supply andSanitation: Technology Overview and Cost Functions. ReportNo. P-60777-A-1. Issue No. 1. Organisation for Economic Co-operation and Development, Paris, France.
DeCarolis, J., Adham, S., Grounds, J., Pearce, B. & Wasserman, L. Cost analysis for MBR systems for water reclamation. InProceedings of WEFTEC 2004 Conference, October 2–6,2004, New Orleans, LA, USA.
DeCarolis, J., Adham, S., Pearce, W. R., Hirani, Z., Lacy, S. &Stephenson, R. Cost trends of MBR systems formunicipal wastewater treatment. In Proceedings of WEFTEC2007 Conference, October 13–17, 2007, San Diego, CA, USA.
Dempster, W. F. Biosphere 2 engineering design. Ecol. Eng.13, 31–42.
Deshmukh, S. The Groundwater Replenishment System.Newkirk Center, University of California, Irvine, CA. http://www.newkirkcenter.uci.edu/green_development/Shijavi_Deshmukh.pdf (accessed 30 June 2013).
Drouiche, M., Lounici, H., Belhocine, D., Grib, H., Piron, D. &Nameri, N. Economic study of the treatment of surfacewater by small ultrafiltration units.Water SA 27 (2), 199–204.
Englehardt, J., Wu, T. & Tchobanoglous, G. Urban net-zerowater treatment and mineralization: system modeling anddesign. Water Res. 47 (13), 4680–4691.

234 T. Guo et al. | Review of cost of water reuse processes versus scale Water Science & Technology | 69.2 | 2014
Gillot, S., Clercq, B. D., Defour, D., Simoens, F., Gernaey, K. &Vanrolleghem, P. A. Optimization of wastewatertreatment plant design and operation using simulation andcost analysis. In CiteSeerX, College of Information Sciencesand Technology, Pennsylvania State University. http://citeseerx.ist.psu.edu/viewdoc/summary?doi=10.1.1.33.8861(accessed 30 June 2013).
Hinomoto, H. Determination of Investment Cost Functions ofWater Treatment Plants: Final Report. Project No. A-055-ILL.Water Resources Center, University of Illinois, Urbana, IL,USA.
ICF Consulting Water and Sustainability: U.S. ElectricityConsumption for Water Supply & Treatment – the Next HalfCentury. Report No.: 1006787. EPRI, Palo Alto, CA, USA.
Lahnsteiner, J. & Lempert, G. Water management inWindhoek, Namibia. Water Sci. Technol. 55 (1–2), 441–448.
Lauer, W. C. Denver’s Direct Potable Water ReuseDemonstration Project: Final Report. Denver WaterDepartment, Denver, CO, USA.
Livingston, E. Village of Cloudcroft, NM PUReWater project.In Proceedings of WaterSmart Innovations Conference andExposition, October 8–10, 2008, Las Vegas, NV, USA.
Mangan, G. F. Reuse of waste water: impact on water supplyplanning. Hydrolog. Sci. J. 23 (2), 235–244.
Markus, M. R., Patel, M., Deshmukh, S. & Dunivin, W. R. The groundwater replenishment system. In Proceedings of2008 UNESCO UCI Groundwater Conference, Irvine, CA,USA.
Marquardt, D. An algorithm for least-squares estimationof nonlinear parameters. SIAM J. Appl. Math. 11 (2),431–441.
Metzler, D. F., Culp, R. L., Stoltenberg, H. A., Woodward, R. L.,Walton, G., Chang, S. L., Clarke, N. A., Palmer, C. M. &Middleton, F. M. Emergency use of reclaimed water forpotable supply at Chanute, Kansas. J. Am Water Works Ass.50, 1021–1057.
National Research Council Water Reuse: Potential forExpanding the Nation’s Water Supply through Reuse ofMunicipal Wastewater. The National Academies Press,Washington, DC, USA.
Nelson, M., Finn, M., Wilson, C., Zabel, B., Thillo, M., Hawes, P.& Fernandez, R. Bioregenerative recycling ofwastewater in Biosphere 2 using a constructed wetland: 2-year results. Ecol. Eng. 13, 189–197.
Ni, C. H., Chen, J. N., Tsai, Y. C., Chen, T. K., Chen, W. B. & Chen,C. H. Recycling and reuse of wastewater from a newdeveloped community using sand filtration, ultrafiltration,and ozone. J. Environ. Sci. Health A 38 (10), 2339–2348.
Pickering, K. D. & Wiesner, M. R. Cost model for low-pressure membrane filtration. J. Environ. Eng. -ASCE 119 (5),772–797.
Rogers, S. E. & Lauer, W. C. Denver demonstration ofpotable water reuse: water quality and health effects testing.Water Sci. Technol. 26 (7–8), 1555–1564.
Sauer, P. & Kimber, A. Energy Consumption and Costs toTreat Water and Wastewater in Iowa. Iowa Association ofMunicipal Utilities, Ankeny, IA, USA.
Selby, H. W., inventor; Pure Cycle Corp., assignee Waterrecycling system. United States Patent US 4145279. March20, 1979.
SingaporeWater Reclamation Study Expert Panel Review andFinds. Public Utility Board, Singapore, Singapore, June 2002.http://www.pub.gov.sg/water/newater/NEWaterOverview/Documents/review.pdf (accessed 30 June 2103).
Sloan, D. W. Big Spring Regional Water Reclamation Project:Preliminary Design Report. Report No.: CMD04249. ContractNo.: 2005483550. Freese and Nichols, Fort Worth, TX, USA.
Sloan, D. W., Wingert, C. & Cadena, I. Potable reuse in thePermian Basin. In Proceedings of 25th Annual Water ReuseSymposium, September 12–15, 2010, Washington, DC, USA.
Tchobanoglous, G., Leverenz, H., Nellor, M. H. & Crook, J. Direct Potable Reuse: A Path Forward. Water ReuseResearch Foundation, Alexandria, VA, USA.
The Metropolitan Water District of Southern California, andJames M. Montgomery, Consulting Engineers, Inc. Pilot-scale Evaluation of Ozone and Peroxone. American WaterWorks Association, Denver, CO, USA.
Timmeren, A. Waste equals energy: decentralised anaerobicwaste treatment and local reuse of return flows. WIT Trans.Ecol. Environ. 105, 267–276.
Tyteca, D. Cost functions for wastewater conveyance systems.J. Water Pollut. Control Fed. 48, 2120–2130.
US Bureau of Economic Analysis NIPA Table 1.1.9: Implicitprice deflators for gross domestic product. http://www.bea.gov/iTable/iTable.cfm?ReqID=9&step=1 (accessed 15January 2013).
US EPA Simultaneous Compliance Guidance Manual for theLong Term 2 and Stage 2 DBP Rules. Report No: EPA 815-R-07-017. US Environmental Protection Agency Office ofWater, Washington, DC, USA.
Water Research Foundation Simultaneous Compliance Tool.http://www.simultaneouscompliancetool.org/SCTool1/jsp/modules/welcome/welcome.jsp (accessed 30 June 2013).
Williams Jr, R. Six-tenths factor aids in approximating costs.Chem. Eng. 54 (12), 124–125.
Wolff, G., Gaur, S. & Winslow, M. Water to Air Models: UserManual for the Pacific Institute. The Pacific Institute,Oakland, CA, USA.
Woodside, G. &Westropp, M. Orange County Water DistrictGroundwater Management Plan 2009 update. http://maecourses.ucsd.edu/mae125b/GWMPJuly2009UpdateFinal.pdf (accessed 30 June 2013).
Wu, T. Excess Ozone Single Organic Peroxone AdvancedOxidation Model. Unpublished notes.
Zhang, T. C., Hu, Z., Surampalli, R. Y., Tyagi, R. D., Lai, K. C. &Lo, I. M. Nanotechnologies for Water EnvironmentApplications.American Society of Civil Engineers, Reston, VA,USA.
First received 22 July 2013; accepted in revised form 28 October 2013. Available online 11 November 2013