review of fishery and aquaculture development potentials ... · pdf filereview of fishery and...
TRANSCRIPT

Review of fisheRy and aquacultuRe development potentials in the Republic of moldova
fao fisheries and aquaculture circular no. 1055/3 Reu/c1055/3(en)issn 2070-6065

Copies of FAO publications can be requested from:Sales and Marketing GroupOffice of Knowledge Exchange, Research and ExtensionFood and Agriculture Organizationof the United NationsE-mail: [email protected]: +39 06 57053360Web site: www.fao.org/icatalog/inter-e.htm
Review of fishery and aquaculture development potentials in the Republic of Moldova
food and aGRicultuRe oRGaniZation of the united nations Rome, 2013
Elena ZubcovHead of LaboratoryLaboratory of Hydrobiology and Ecotoxicology, Institute of Zoology, Academy of Sciences of Moldova
Galina Curcubet Director Chisinau Branch of the State Enterprise on Research and Production of Water Bio-resources Aquaculture – Moldova
Lucia BiletchiLeading Scientific ResearcherLaboratory of Hydrobiology and Ecotoxicology, Institute of Zoology, Academy of Sciences of Moldova
Vasili DomanciucHead of Laboratory Laboratory of Selection and Reproduction of Fish, Chisinau Branch of the State Enterprise on Research and Production of Water Bio-resources Aquaculture – Moldova
Marin UsatiiHead of Laboratory Laboratory of Ichthyology and Aquaculture, Institute of Zoology, Academy of Sciences of Moldova
Ludmila BarbaianiResearcherChisinau Branch of the State Enterprise on Research and Production of Water Bio-resources Aquaculture-Moldova
Éva KovácsJunior Aquaculture OfficerFAO Subregional Office for Central and Eastern Europe
Thomas Moth-PoulsenFishery OfficerFAO Subregional Office for Central and Eastern Europe
András WoynarovichFAO Consultant
FAO Fisheries and Aquaculture Circular No. 1055/3 REU/C1055/3(En)

The designations employed and the presentation of material in thisinformation product do not imply the expression of any opinion whatsoeveron the part of the Food and Agriculture Organization of the United Nations(FAO) concerning the legal or development status of any country, territory, cityor area or of its authorities, or concerning the delimitation of its frontiers orboundaries. The mention of specific companies or products of manufacturers,whether or not these have been patented, does not imply that these havebeen endorsed or recommended by FAO in preference to others of a similarnature that are not mentioned.
The views expressed in this information product are those of the author(s) anddo not necessarily reflect the views or policies of FAO.
ISBN 978-92-5-107722-1 (print)E-ISBN 978-92-5-107723-8 (PDF)
© FAO 2013
FAO encourages the use, reproduction and dissemination of material in thisinformation product. Except where otherwise indicated, material may becopied, downloaded and printed for private study, research and teachingpurposes, or for use in non-commercial products or services, provided thatappropriate acknowledgement of FAO as the source and copyright holder isgiven and that FAO’s endorsement of users’ views, products or services is notimplied in any way.
All requests for translation and adaptation rights, and for resale and othercommercial use rights should be made via www.fao.org/contact-us/licencerequestor addressed to [email protected].
FAO information products are available on the FAO website (www.fao.org/publications) and can be purchased through [email protected].

v
preparation of this document
The objectives in producing this document were to record the present state and conditions of the fisheries and aquaculture sector in the Republic of Moldova, as well as to point out those entry points that could ensure its further sustainable development.
Data and information were provided by two professional teams headed by Dr Elena Zubcov, Head of the Laboratory of Hydrobiology and Ecotoxicology, Academy of Sciences of Moldova, and Dr Galina Curcubet, Director of the Chisinau Branch of the State Enterprise on Research and Production of Water Bio-resources Aquaculture – Moldova. The teams embraced the envisaged themes including the physical, social, economic and administrative background and structure of the sector.
This review is based on the results obtained from a range of research projects conducted by the Institute of Zoology, and funded by the Academy of Sciences of Moldova. These projects were:
• The study of biodiversity, functioning of hydrobiocenoses for determining the carrying capacity of aquatic ecosystems both fluvial and lacustrine, in dependence on natural and anthropogenic factors (Project No. 06.411.012F).
• Estimating the role of groups of terrestrial, aquatic animals, zoo- and phyto parasites of economic interest, the development of measures of monitoring, sustainable utilization of useful species and control of harmful once (Project No. 06.411.014A).
• Revealing the water quality and the state of aquatic ecosystems in Lower Prut (Project No. 09.832.08.07A).
• Regularities of intraspecific variability of the structure and dynamics of population of cyprinids (the example species Abramis brama L.) in Moldova and the European part of Russia (Project No. 08.820-04-22 RF).
• CRDF-MRDA Assessment of current status of biodiversity and water quality in Dniester River (Project No. MBI-3002).
• Elaboration of growth technology of Kefal pelingas (Project No. BPP-03-06).In the preparation of this document, FAO guidelines on the elaboration of similar
fisheries and aquaculture country reviews were followed. The review has been endorsed by the Ministry of Agriculture and Food Industry of the Republic of Moldova, which is the ministry responsible for fisheries and aquaculture.
vi
abstract
The Republic of Moldova is rich in retained water resources. Comparing the size of the country and the total area of water reservoirs and ponds, it has the largest resources of artificial waterbodies among the countries of Central and Eastern Europe. The water reservoirs and ponds are owned by public local authorities, irrigation associations, the State and private owners.
The Ministry of the Environment is responsible for the administrative supervision of the natural waters and water reservoirs, while fish production issues are coordinated and supported by the Ministry of Agriculture and Food Industry.
Although the total area of ponds is considerable, fish production and the proportion of high-value and low-value fish species remain well below expectations.
This present document provides an inventory of the physical, social, financial and economic background of the fishery and aquaculture sector.
Zubcov, E., Curcubet, G., Biletchi, L., Domanciuc, V., Usatii, M., Barbaiani, L., Kovács, É., Moth-Poulsen, T. & Woynarovich, A. 2013. Review of fishery and aquaculture development potentials in the Republic of Moldova.FAO Fisheries and Aquaculture Circular No. 1055/3. Rome, FAO. 93 pp.
vii
contents
Preparation of this document vAbstract viAcknowledgements xExecutive summary xi
1. introduction 12. historical background of the fishery sector 33. actual and potential resources of fishery and aquaculture 7
3.1 PEOPlE 7
3.2 GEOGRAPhy ANd CliMAtE 7
3.3 AGRiCUltURE 9
3.4 WAtER REsOURCEs 12
3.5 FishEs OF thE REPUbliC OF MOldOvA 22
4. status of fisheries and aquaculture production 25
4.1 CAPtURE FishERiEs ANd AqUACUltURE 25
4.2 RECREAtiONAl FishERiEs 30
4.3 FACilitAtiNG iNdUstRy 30
5. status of processing and trade of fish and fishery products 31
5.1 Fish PROCEssiNG ANd stORAGE 31
5.2 distRibUtiON, MARkEtiNG ANd tRAdE OF Fish ANd FishERy PROdUCts 31
5.3 Fish dEMANd ANd CONsUMPtiON 33
6. Governance and institutional frameworks of the fisheries and aquaculture sector 35
6.1 AdMiNistRAtiON 35
6.2 EdUCAtiON, tRAiNiNG, ExtENsiON ANd REsEARCh 36
6.3 stAtistiCs 37
6.4 iNstitUtiONs 38
6.5 iNtERNAtiONAl COOPERAtiON iN FishERiEs ANd AqUACUltURE dEvElOPMENt ANd MANAGEMENt 38
7. policies, regulatory and management frameworks in use 43
7.1 FishERiEs ANd AqUACUltURE POliCiEs ANd PlANNiNG 43
7.2 FishERiEs ANd AqUACUltURE lEGAl ANd REGUlAtORy FRAMEWORk ANd MANAGEMENt 44
8. social and economic aspects of fisheries and aquaculture 45
8.1 FishERiEs ANd AqUACUltURE EMPlOyMENt 45
8.2 ECONOMiCs OF CAPtURE FishERiEs ANd AqUACUltURE 45
8.3 CREdit ANd iNvEstMENt iN FishERiEs ANd AqUACUltURE 46
8.4 ROlE OF FishERiEs ANd AqUACUltURE iN FOOd sECURity ANd POvERty AllEviAtiON 46
viii
9. development potentials in the fishery and aquaculture sector 49
9.1 dEvElOPMENt POtENtiAls OF CAPtURE FishERiEs 49
9.2 dEvElOPMENt POtENtiAls OF AqUACUltURE 52
10. conclusions and recommendations 53References 55
ANNEx 1 – GENERAl dAtA ON thE REPUbliC OF MOldOvA 57
ANNEx 2 – WAtER REsOURCE, Fish FARMs ANd Fish sPECiEs OF thE REPUbliC OF MOldOvA 65
ANNEx 3 – ECONOMiC dAtA ON thE FishERiEs ANd AqUACUltURE sECtOR OF thE REPUbliC OF MOldOvA 89
tables
1. introduction of new fish species in the aquaculture of the Republic of Moldova (until 1991) 5
2. Population of the Republic of Moldova by area, sex and age group as of 1 January 2010 7
3. Geographical position of the Republic of Moldova 8
4. Air temperature on Moldovan territory 8
5. Precipitation on Moldovan territory 8
6. Available land by use in the Republic of Moldova as of 1 January 2010 9
7. structure of agricultural lands by ownership as of 1 January 2010 9
8. Agricultural production in the Republic of Moldova, all categories of producers 11
9. summarized data of employment in the different agriculture sectors the Republic of Moldova, 2009 11
10. Average annual water flow of major rivers in the black sea basin 13
11. Characteristics of main water reservoirs in the Republic of Moldova 13
12. quantitative composition of fish-breeding complexes of the Republic of Moldova 15
13. list of fish-breeding and reproduction farms in the Republic of Moldova 21
14. Reproductive and fish-breeding indices of common carp strains in the Republic of Moldova 27
15. External trade of fish, crustaceans, molluscs and other aquatic invertebrates according to the Nomenclature of Goods, 2001–09 32
16. External trade of fish, crustaceans and molluscs according to the standard international trade Classification, 2001–09 32
17. Main profitability indicators of economic units and their activities 48
18. Average price of fresh fish on local market in the Republic of Moldova 48
19. stocking of the Costesti-stanca reservoir 50

ix
figures
1. Agricultural production in the Republic of Moldova, by producer category as a percentage of total production 10
2. Water map of the Republic of Moldova 12
3. Geographical distribution by size of the most important fish farms in the Republic of Moldova 15
4. Geographical distribution by production of the most important fish farms in the Republic of Moldova 15
5. dynamics of sustainable growth of fish pond production in the Republic of Moldova 26
6. Results of capture fisheries and aquaculture in the Republic of Moldova, 2000–2011 32
7. Retail sale of fish, crustaceans and molluscs in the Republic of Moldova, 2005–2010 33
8. development directions of the aquaculture sector in the Republic of Moldova 43
9. Excess of wholesale and retail prices over cost 45
10. Fishing and fish culture enterprises that ended 2009 with financial losses 47
11. development of entrepreneurship activities in the field of fishing and fish culture 47
12. Revenue from sales of fishing and fish culture enterprises in 2009 48
13. stocking of dubasari reservoir, 1998–2010 51
boxes
1. National breeds of common carp in the Republic of Moldova 4
2. black caviar and sturgeon production in the Republic of Moldova 38
Contents

x
acknowledgements
This review is based on the results obtained in the frame of a range of research projects funded by SCSTD (projects No. 06.411.012F; 06.411.014A; 09.832.08.07A; 08.820-04-22 RF), CRDF and MRDA (projects No. MBI-3002; BPP -03-06).
xi
executive summary
According to the information gained from sector-related FAO documents and statistics, the Republic of Moldova is rich in retained water resources. Comparing the size of the country with the total area of artificial water reservoirs and ponds, it has the largest such resources among countries of Central and Eastern Europe. These stored relatively huge water resources combined with the unique topography and the climate of the country should ensure a more prominent status of the fisheries and aquaculture sector within the agricultural branches. This is especially the case as because fisheries and aquaculture has many links not only to the environment and the management and sharing of water resources but also to the well-being of the population.
The present document provides a concise summary of the key information needed in order to understand the present situation of the sector and understand the recommendations of the most-competent professional teams of the Republic of Moldova. The most important recommendations are:
• Fish farming in the Republic of Moldova has the potential to reduce poverty in rural areas. Renting and using small lakes and ponds for growing fish creates jobs, brings income to rural areas and increases the sales of fresh fish in villages. As farmers very often lack a proper knowledge of fisheries and aquaculture techniques, the improvement of efficient, market-economy-based extension services is required.
• Efficient extension services supported by the government should include information and advisory systems by which knowledge, skills and modern management abilities of farmers can be enhanced. The aforementioned subjects should be integral parts of farmer training.
• In order to increase the efficiency of fish enterprises, state support should be offered for developing modern entrepreneurial, financial and investment frameworks according to the principles of a market economy.
• Sustainable development of the fishery and aquaculture sector could be achieved by intensifying fish farming, acclimatizing valuable new fish species and breeds and by developing methods and schemes to stabilize and improve the economic and financial situation of enterprises in the sector.
• The national cadastre of waterbodies needs to be completed with data on their ecological status. The current ecological state of waterbodies is a main cause of their inadequate utilization and so is responsible for increased production costs and, hence, the high price of fresh fish.
• The multipurpose integrated use of irrigation water reservoirs is a feasible option for increasing fish production.
• A set of measures needs to be taken in order to protect and conserve the environment and to use existing recourses for fishery purposes in a sustainable way, including the improvement of the fishery resources of the Dniester River.

Review of fishery and aquaculture development potentials in the Republic of Moldova 1
1. introduction
The Republic of Moldova is framed by two large rivers and a few middle-sized ones, and it is webbed by several thousand other rivers and water flows. Both the topography and water resources of the country are ideal for the construction of small water reservoirs and fish ponds. This is why the total artificial water surface in the country is so large. There are 41 707 ha of water reservoirs and ponds, of which 20 507 ha (49.2 percent) are used as fish farms.
The present document contains a detailed inventory of the physical, social, economic and administrative background and components of the fisheries and aquaculture sector of the Republic of Moldova. On the basis of the presentation of sector-related facts, conclusions are drawn and recommendations are presented in order to highlight the entry points to ensure the further sustainable development of the sector.

Review of fishery and aquaculture development potentials in the Republic of Moldova 3
2. historical background of the fishery sector
Intensification of the development of aquaculture in the Republic of Moldova (then known as the Moldavian Soviet Socialist Republic) accelerated after 1945. At that time, its fish-producing waterbodies had a total surface area of 30 000 ha, of which 12 000 ha was fish ponds. This fact determined the direction of fish culture development and explains why pond fish culture has remained the main culture system in the country. In 1945, the development of fishery sciences in the country began with the founding of the state institute known as the Biological Experimental Station for Fisheries, now called the Chisinau Branch of the State Enterprise on Research and Production of Water Bio-resources Aquaculture – Moldova.
By 1950, the Biological Experimental Station for Fisheries had 9 ponds with a total area of 283 ha. In this period, annual fish production was 34.7 tonnes.
By 1957, the yearly production of fish farms had grown to 168 tonnes. Later, in 1964, owing to the establishment of the state fishery sector, the yearly production of fish ponds increased to 250 tonnes.
In 1970, the Directorate of Fish Farming, under the Council of Ministers of the Moldavian Soviet Socialist Republic, became the central administration body of fisheries. Ponds of kolkhozes and sovhozes not used for fish culture were transferred to the Directorate of Fish Farming. In addition, 14 new fish farms were established; hence, fish production in ponds increased considerably from 1 983 tonnes in 1970 to 4 570 and 6 500 tonnes in 1975 and 1980, respectively.
The most rapid development of fish farming activities took place in the 1980s and 1990s, when the necessary scientific and logistic background of fish production was established. In this period, the average yearly fish production varied between 1.4 and 2.4 tonnes/ha. These results made the Moldavian Soviet Socialist Republic the second-most-important fish-producing republics of the then Soviet Union.
In the 1980s, parallel to the intensification of pond fish farming, fishery management of small water reservoirs also started. In 1985, the amount of fish produced in ponds and in small water reservoirs was about 8 539 tonnes, which increased to 9 053 tonnes by 1990. In this period, the average yearly fish production was about 1 tonne/ha.
Development of fish production in cages started in 1968 and it had already achieved good results by the 1990s. Cage culture of common carp in the warm water of the Cuciurgan reservoir1 increasingly contributed to national table fish production with 5, 22, 44 and 150 tonnes in 1968, 1971, 1987 and 1988, respectively. At that time, the recorded maximum production of cages was 189 kg/m3. Cage culture of common carp was also developed in Goieni Bay of the Dubasari, reservoir where an annual production of 723.5 tonnes (58 kg/m3) was reached by 1990.
In the late 1980s, work began on an intensive tank culture enterprise on the shore of the Cuciurgan reservoir with a planned yearly production capacity of 1 000 tonnes of common carp. It was also planned to increase the capacity of cage farms in this period. However, owing to the political and economic changes in the early 1990s, neither of these plans was completed. Separation of the Transnistria region and the transferring of control of the Moldovan Hydropower Plant to a joint-stock company were among
1 The Cuciurgan reservoir is the cooling reservoir of the Moldovan Hydropower Plant.
Review of fishery and aquaculture development potentials in the Republic of Moldova4
the components that characterized the situation of at the time when the Soviet Union broke up. The often-changing owners of the Moldovan Hydropower Plant paid little attention to the cages.
Before 1951, traditional species in aquaculture were the local forms of common carp (Cyprinus carpio) and silver Prussian carp (Carassius gibelio). In 1951, a breeding programme, developed by the Fisheries Scientific Research Station, started, and this resulted in two national common carp lines by 1978. These were the scaly Kuboltskiy carp and the Myndykskiy carp with scattered type of scales (Box 1).
bOx 1national breeds of common carp in the Republic of moldova
The forming of national broodstocks of common carp started in 1951, when improved strains were introduced into the Republic of Moldova (then the Moldavian Soviet Socialist Republic). They were from two regions of Ukraine: 15 nests of eggs of Nivchansk carp brought from Vinnytsia region: and 40 nests of eggs of Kursk carp from the Belgorod region. In 1978, breeding established two autochthon common carp lines, which created the initial broodstocks of the later selected and developed two national common carp stocks.
Between 1981 and 2003, and with the participation of the Russian scientist of ARRIFFF, Dr Y. Ilyasov, Moldovan researchers at the Fisheries Scientific Research Station (Dr Galina Curcubet, Dr V. Domanciuc and Dr V. Lobcenco) created two new breeds of common carp: carp Teleneshtskiy scaly, and carp Teleneshtskiy frame.
They were formed on the base of the breeding group of carp fresinet, which included strains of Ukrainian frame carps and Hungarian frame and scaly carps, as well as cefa carp. Both breeds were created on the same fish breeding farm of the Teleneshty Branch of the State Enterprise Aquaculture – Moldova.
Taking into account the susceptibility of initially selected material to diseases, such as aeromonas, a special selection programme for increased resistance to infectious diseases was designed and implemented.
These breeds of common carp are remarkable because their productive and reproductive characteristics exceed present norms. Their good body indices and increased resistance to infectious diseases are also among those characteristics that make them so productive:
• carp Kuboltskiy scaly was bred by G. Curcubet, V. Lobcenco, V. Domanciuc and V. Epur. This breed is remarkable for its hardiness, high survival rate and advanced ability to utilize natural fish food resources.
• carp Myndykskiy with scattered-type scales is at the testing stage and is characterized by winter hardiness and high survival rate. Its edible parts are also above average.
These breeds originate from a state-owned selective-breeding farm – the Kubolta Branch of the State Enterprise Aquaculture – Moldova.
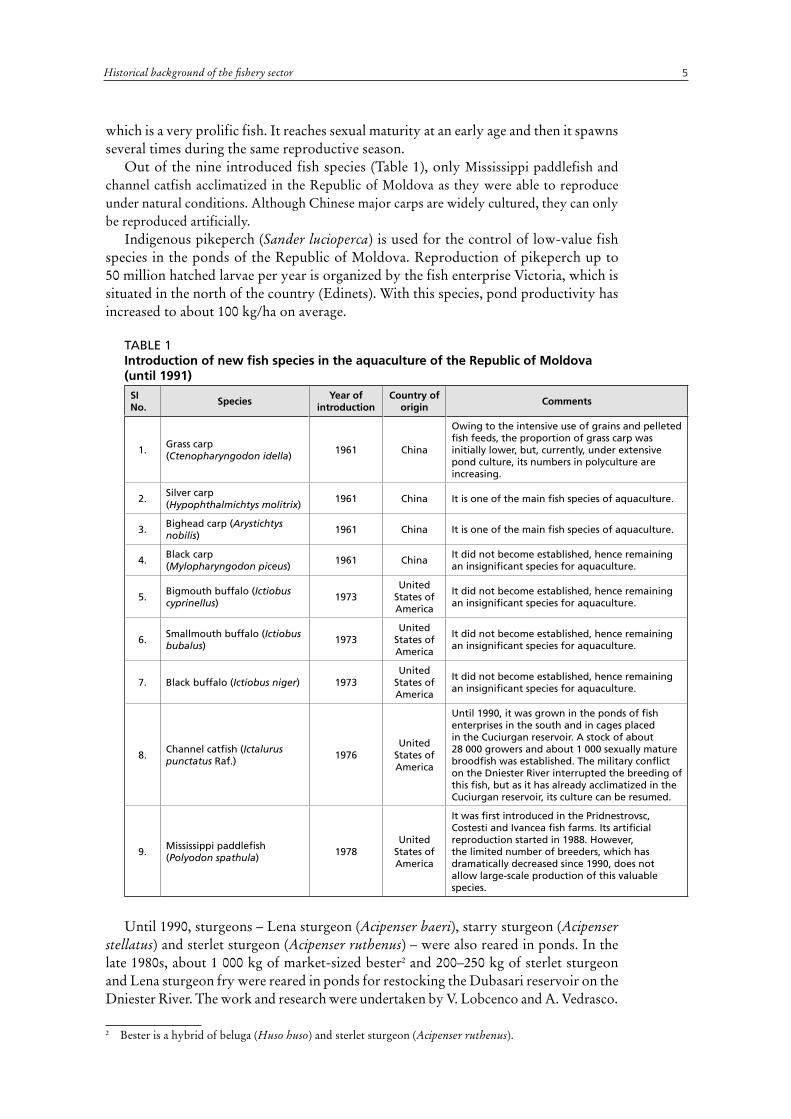
Introduction of new fish species in Moldovan waters started in 1961 (Table 1) when larvae of Chinese major carps were introduced from China. By volume, these carps (silver carp, grass carp and bighead carp) became the main species in aquaculture in the Republic of Moldova in the 1980s.
The basics of common carp and Chinese major carp polyculture in the Republic of Moldova were developed by S. Tyutyunik under the leadership of Prof Grimalskiy. Later, other scientists such as T. Kojokaru and V. Ulianov of the Hydrobiology Laboratory of the Moldovan Fisheries Scientific Research Station improved and refined these technologies.
Together with the larvae of Chinese major carps, an unwanted small cyprinid species was also introduced accidentally, namely the topmouth gudgeon (Pseudorasbora parva),
5Historical background of the fishery sector
which is a very prolific fish. It reaches sexual maturity at an early age and then it spawns several times during the same reproductive season.
Out of the nine introduced fish species (Table 1), only Mississippi paddlefish and channel catfish acclimatized in the Republic of Moldova as they were able to reproduce under natural conditions. Although Chinese major carps are widely cultured, they can only be reproduced artificially.
Indigenous pikeperch (Sander lucioperca) is used for the control of low-value fish species in the ponds of the Republic of Moldova. Reproduction of pikeperch up to 50 million hatched larvae per year is organized by the fish enterprise Victoria, which is situated in the north of the country (Edinets). With this species, pond productivity has increased to about 100 kg/ha on average.
tAblE 1introduction of new fish species in the aquaculture of the Republic of moldova (until 1991)
si no.
speciesyear of
introductioncountry of
origincomments
1.Grass carp (Ctenopharyngodon idella)
1961 China
Owing to the intensive use of grains and pelleted fish feeds, the proportion of grass carp was initially lower, but, currently, under extensive pond culture, its numbers in polyculture are increasing.
2.silver carp (Hypophthalmichtys molitrix)
1961 China it is one of the main fish species of aquaculture.
3.bighead carp (Arystichtys nobilis)
1961 China it is one of the main fish species of aquaculture.
4.black carp (Mylopharyngodon piceus)
1961 Chinait did not become established, hence remaining an insignificant species for aquaculture.
5.bigmouth buffalo (Ictiobus cyprinellus)
1973United
states of America
it did not become established, hence remaining an insignificant species for aquaculture.
6.smallmouth buffalo (Ictiobus bubalus)
1973United
states of America
it did not become established, hence remaining an insignificant species for aquaculture.
7. black buffalo (Ictiobus niger) 1973United
states of America
it did not become established, hence remaining an insignificant species for aquaculture.
8.Channel catfish (Ictalurus punctatus Raf.)
1976United
states of America
Until 1990, it was grown in the ponds of fish enterprises in the south and in cages placed in the Cuciurgan reservoir. A stock of about 28 000 growers and about 1 000 sexually mature broodfish was established. the military conflict on the dniester River interrupted the breeding of this fish, but as it has already acclimatized in the Cuciurgan reservoir, its culture can be resumed.
9.Mississippi paddlefish (Polyodon spathula)
1978United
states of America
it was first introduced in the Pridnestrovsc, Costesti and ivancea fish farms. its artificial reproduction started in 1988. however, the limited number of breeders, which has dramatically decreased since 1990, does not allow large-scale production of this valuable species.
Until 1990, sturgeons – Lena sturgeon (Acipenser baeri), starry sturgeon (Acipenser stellatus) and sterlet sturgeon (Acipenser ruthenus) – were also reared in ponds. In the late 1980s, about 1 000 kg of market-sized bester2 and 200–250 kg of sterlet sturgeon and Lena sturgeon fry were reared in ponds for restocking the Dubasari reservoir on the Dniester River. The work and research were undertaken by V. Lobcenco and A. Vedrasco.
2 Bester is a hybrid of beluga (Huso huso) and sterlet sturgeon (Acipenser ruthenus).
Review of fishery and aquaculture development potentials in the Republic of Moldova6
Researchers of the Institute of Zoology (I. Kubrac, M. Statova, A. Zelenin, O. Krepis, M. Usatyi, E. Zubcov, etc.) elaborated a range of procedures for the artificial propagation of the above-mentioned fish species. By doing so, they ensured a steady supply of advanced fry of these species. Furthermore, a crustacean, the Japanese shrimp (Macrobrachium nipponense, De Haan) was introduced into the Cuciurgan reservoir.
Researchers (P. Aricov, V. Domanciuc, V. Ulianov and A. Vedrasco) of the Chisinau Branch of the State Enterprise on Research and Production of Water Bio-resources Aquaculture – Moldova created broodstocks of pond populations of European catfish and paddlefish through the elaboration and application of improved techniques of artificial propagation. They also developed and introduced the method for mass production of sturgeon fry.
7
3. actual and potential resources of fishery and aquaculture
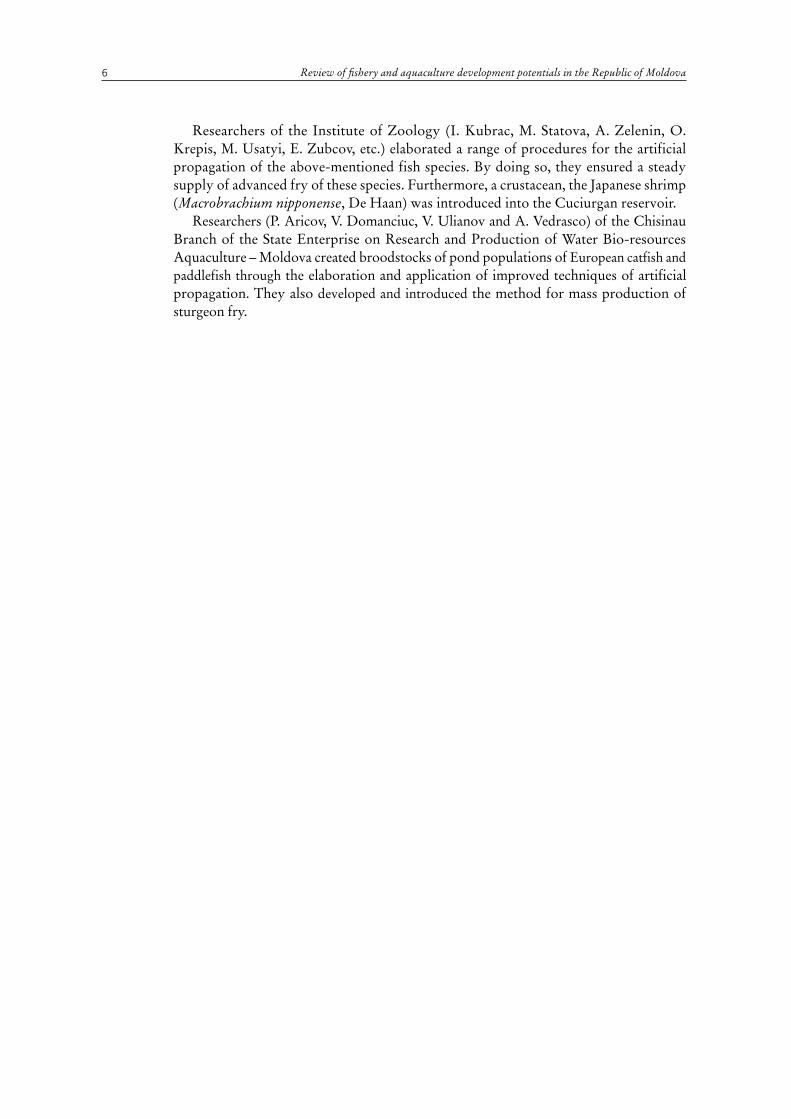
3.1 peopleIn 2010, the Republic of Moldova had 3 563 700 inhabitants, of whom 1 476 700 (41.4 percent) were urban residents and 2 087 000 (58.6 percent) were rural people. In general, a slight (2.2 percent) decrease in population was recorded for the last decade (2010 in comparison with 2000). This trend was due to both a natural decrease (about –0.4/1 000 inhabitants in 2009) and the emigration of those seeking new employment opportunities abroad.
The ratio between the total number of males and females is 48.1 percent to 51.9 percent, or 108 women per 100 men (Table 2).
tAblE 2population of the Republic of moldova by area, sex and age group as of 1 January 2010
Groupstotal urban Rural
both sexes females both sexes females both sexes females
Men and women 0–15 years 649 100 316 000 227 400 109 800 421 700 206 200
Men 16–61 years, women 16–56 years
2 371 200 1 157 300 1 042 800 527 300 1 328 400 630 000
Men 62 years and over, women 57 years and over
543 400 376 900 206 500 145 100 336 900 231 800
total 3 563 700 1 850 200 1 476 700 782 200 2 087 000 1 068 000
source: National bureau of statistics of the Republic of Moldova (2010).
According to Table 2, 66.5 percent of the total population is of working age (men of 16–61 years old and women of 16–56 years old).
In 2009, the proportion of economically active population including both the employed and unemployed was 35.5 percent of the total population. The employment rate in urban areas was higher (43.6 percent) than in rural areas (37.1 percent) (see the tables in Annex 1).
According to the population census 2004, Moldovans constitute a majority in the country, representing 75.8 percent of the total population. They are followed by Ukrainians 8.4 percent, Russians 5.9 percent, Gagauzians 4.4 percent, Romanians 2 percent, Bulgarians 2 percent and other nationalities. Russian and Ukrainian groups are concentrated in major cities and in the Transnistria region. The population of a few villages in the north of the country is also dominated by Ukrainians. The Gagauzian ethnic group lives in the south of the country and in 1994 they received a special legal status establishing the Autonomous Territorial Unit of Gagauzia (Gagauz Yeri). In addition, an administrative region was established for a Bulgarian minority in the south.
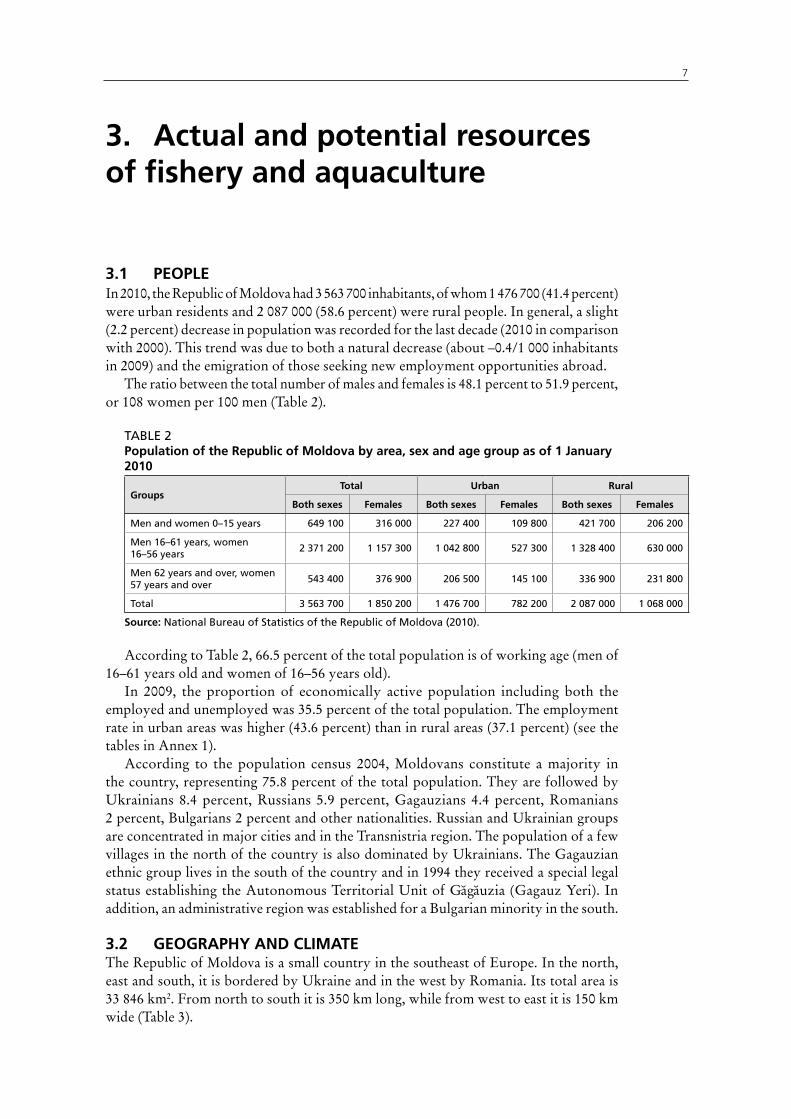
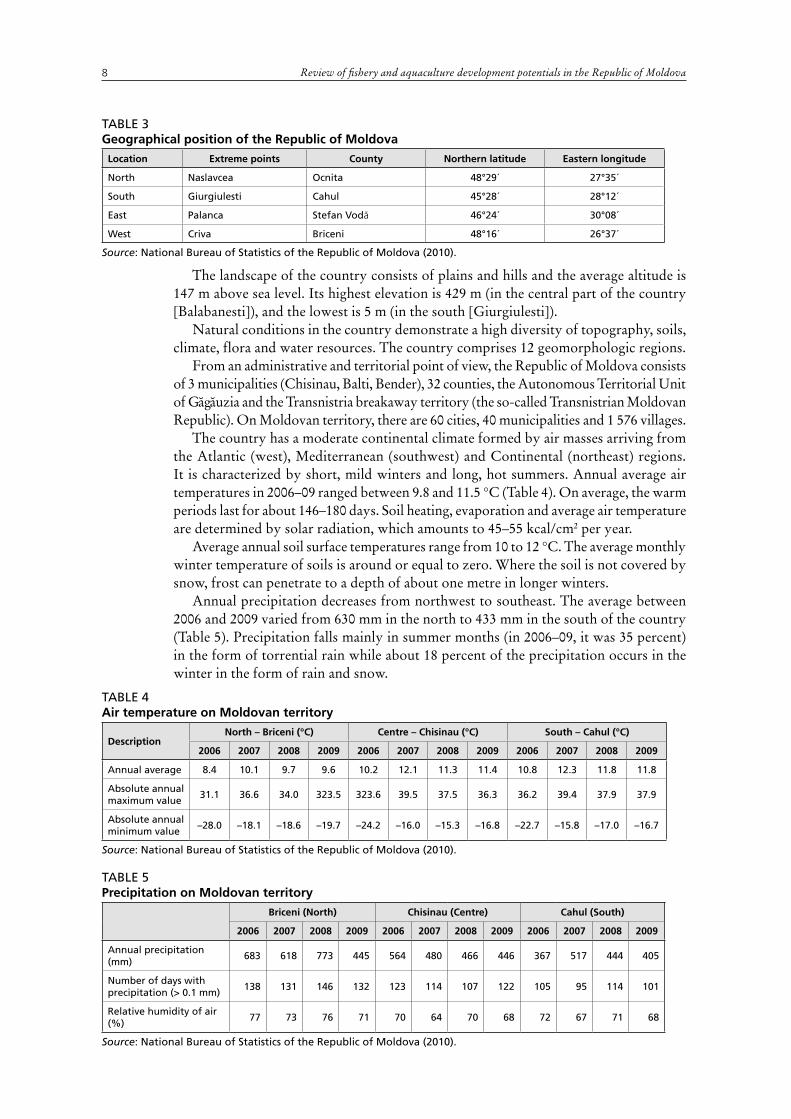
3.2 GeoGRaphy and climateThe Republic of Moldova is a small country in the southeast of Europe. In the north, east and south, it is bordered by Ukraine and in the west by Romania. Its total area is 33 846 km2. From north to south it is 350 km long, while from west to east it is 150 km wide (Table 3).
Review of fishery and aquaculture development potentials in the Republic of Moldova8
The landscape of the country consists of plains and hills and the average altitude is 147 m above sea level. Its highest elevation is 429 m (in the central part of the country [Balabanesti]), and the lowest is 5 m (in the south [Giurgiulesti]).
Natural conditions in the country demonstrate a high diversity of topography, soils, climate, flora and water resources. The country comprises 12 geomorphologic regions.
From an administrative and territorial point of view, the Republic of Moldova consists of 3 municipalities (Chisinau, Balti, Bender), 32 counties, the Autonomous Territorial Unit of Gagauzia and the Transnistria breakaway territory (the so-called Transnistrian Moldovan Republic). On Moldovan territory, there are 60 cities, 40 municipalities and 1 576 villages.
The country has a moderate continental climate formed by air masses arriving from the Atlantic (west), Mediterranean (southwest) and Continental (northeast) regions. It is characterized by short, mild winters and long, hot summers. Annual average air temperatures in 2006–09 ranged between 9.8 and 11.5 °C (Table 4). On average, the warm periods last for about 146–180 days. Soil heating, evaporation and average air temperature are determined by solar radiation, which amounts to 45–55 kcal/cm2 per year.
Average annual soil surface temperatures range from 10 to 12 °C. The average monthly winter temperature of soils is around or equal to zero. Where the soil is not covered by snow, frost can penetrate to a depth of about one metre in longer winters.
Annual precipitation decreases from northwest to southeast. The average between 2006 and 2009 varied from 630 mm in the north to 433 mm in the south of the country (Table 5). Precipitation falls mainly in summer months (in 2006–09, it was 35 percent) in the form of torrential rain while about 18 percent of the precipitation occurs in the winter in the form of rain and snow.
tAblE 3Geographical position of the Republic of moldova
location extreme points county northern latitude eastern longitude
North Naslavcea Ocnita 48°29´ 27°35´
south Giurgiulesti Cahul 45°28´ 28°12´
East Palanca stefan vodă 46°24´ 30°08´
West Criva briceni 48°16´ 26°37´
Source: National bureau of statistics of the Republic of Moldova (2010).
tAblE 4air temperature on moldovan territory
descriptionnorth – briceni (°c) centre – chisinau (°c) south – cahul (°c)
2006 2007 2008 2009 2006 2007 2008 2009 2006 2007 2008 2009
Annual average 8.4 10.1 9.7 9.6 10.2 12.1 11.3 11.4 10.8 12.3 11.8 11.8
Absolute annual maximum value
31.1 36.6 34.0 323.5 323.6 39.5 37.5 36.3 36.2 39.4 37.9 37.9
Absolute annual minimum value
–28.0 –18.1 –18.6 –19.7 –24.2 –16.0 –15.3 –16.8 –22.7 –15.8 –17.0 –16.7
Source: National bureau of statistics of the Republic of Moldova (2010).
tAblE 5precipitation on moldovan territory
briceni (north) chisinau (centre) cahul (south)
2006 2007 2008 2009 2006 2007 2008 2009 2006 2007 2008 2009
Annual precipitation (mm)
683 618 773 445 564 480 466 446 367 517 444 405
Number of days with precipitation (> 0.1 mm)
138 131 146 132 123 114 107 122 105 95 114 101
Relative humidity of air (%)
77 73 76 71 70 64 70 68 72 67 71 68
Source: National bureau of statistics of the Republic of Moldova (2010).

9Actual and potential resources of fishery and aquaculture
In general, there are mainly light winds, thus strong winds are very rare. For example, in the period from 2006 to 2009, the average annual wind speed in the country varied from 2.5 to 23.0 m/s. In 2009, this number was slightly higher (at 23.8 m/s) in the south of the country.
3.3 aGRicultuReThe most important natural wealth of the Republic of Moldova is its soil resources which are various types of chernozem soils. These are found in the northern and central regions of the country and comprise 75 percent of all agricultural land. In the south of the country, the soils are generally desertified and, consequently, less productive.
In the past 100 years, the average humus content of the country’s soils has decreased by 6–23.2 percent as a consequence of human activities. Exploitative and inappropriate agricultural practices accelerate soil losses. The topography, together with the climate, advances soil erosion. Today, about 2 million ha are affected by erosion.
The increased frequency of landslides is also a major problem. The total area affected by landslides is about 55 500 ha. Specialists calculate that in the last few years the area affected by landslides has grown by about 1 000 ha annually. The most affected region is the central part of the country.
Alkalinized and salinized soils, which comprise 107 500 ha and 112 200 ha, respectively, are used as arable lands and pastures.
According to recent statistical data, 73.9 percent of the total area of the country is agricultural land, mainly arable (Table 6). About 228 300 ha, mostly arable, were irrigated in 2010, which is only 6.7 percent of the total area of the country.
tAblE 6available land by use in the Republic of moldova as of 1 January 2010
area (1 000 ha) structure (%)
Agricultural lands 2 486.1 73.5
Arable land 1 816.7 53.7
Perennial plantations, of which: 286 8.5
Orchards 132.5 3.9
vineyards 153.5 4.5
Pastures 352.1 10.4
hayfields 2.2 0.1
Fallow lands 29.1 0.9
Forests and lands covered with forestry vegetation 462.8 13.7
Rivers, lakes, reservoirs and bogs1 96.4 2.8
Other lands 324.3 9.6
total area of the country 3 384.6 100.0
1 Available lands of water funds, as of 1 January 2010, 86 800.Source: National bureau of statistics of the Republic of Moldova (2010).
tAblE 7structure of agricultural lands by ownership as of 1 January 2010
public private
1 000 ha % 1 000 ha %
Arable land 264.5 40.3 1 552.2 84.2
Perennial plantations 37.8 5.8 2 623.2 14.3
Pastures 348.5 53.0 23.6 0.2
hayfields 1.6 0.2 0.6 0.0
Fallow lands 4.7 0.7 24.4 1.3
total of agricultural lands 657.1 100.0 1 844.0 100.0
Source: National bureau of statistics of the Republic of Moldova (2010).

Review of fishery and aquaculture development potentials in the Republic of Moldova10
In the Republic of Moldova, agricultural land is owned both by the State and by private people. According to recent data (2010), the area of state-owned agricultural land is 657 100 ha (26.3 percent), while private owners have a total of 1 844 000 ha (73.7 percent). There are large differences between the usage of public and private agricultural lands. Public land is used mainly as pastures and arable lands, while privately owned land is utilized mainly as arable land and only a much smaller part is used as orchards or vineyards (Table 7).
There are three categories of agricultural producers in the Republic of Moldova: agricultural enterprises, farms and households. In the period 2002–09, households played the main role in agricultural production (Figure 1).
The bulk of the country’s agricultural output comes from plant production – mainly cereals and grapes. Vegetables, potatoes and sunflower also constitute an important share of the country’s agricultural output.
In 2009, the animal husbandry sector generated 31.9 percent of the gross value of the country’s agricultural output, half of which was accounted for by livestock and poultry (Table 8).
The per capita production of main agricultural products for 2009 was:• cereals: 610 kg (after processing);• sunflowers: 80 kg;• sugar beet (industrial): 95 kg;• potatoes: 73 kg;• vegetables: 86 kg, and fruits and berries: 86 kg;• meat: 25 kg (slaughter weight), milk: 161 kg, and eggs: 180 pcs.
FiGURE 1agricultural production in the Republic of moldova, by producer category as a percentage of total production
Source: National bureau of statistics of the Republic of Moldova (2010).
28.90% 24.70% 32.00% 29.20% 28.20% 28.10%
35.60% 30.50%
21.80% 20.30%
22.00% 20.80% 20.20% 17.90%
21.80% 21.60%
49.30% 55.00%
48.00% 55.00% 51.60% 54.00%
42.60% 47.90%
0%
10%
20%
30%
40%
50%
60%
70%
80%
90%
100%
2002 2003 2004 2005 2006 2007 2008 2009
Agricultural enterprises Farm Households
11Actual and potential resources of fishery and aquaculture
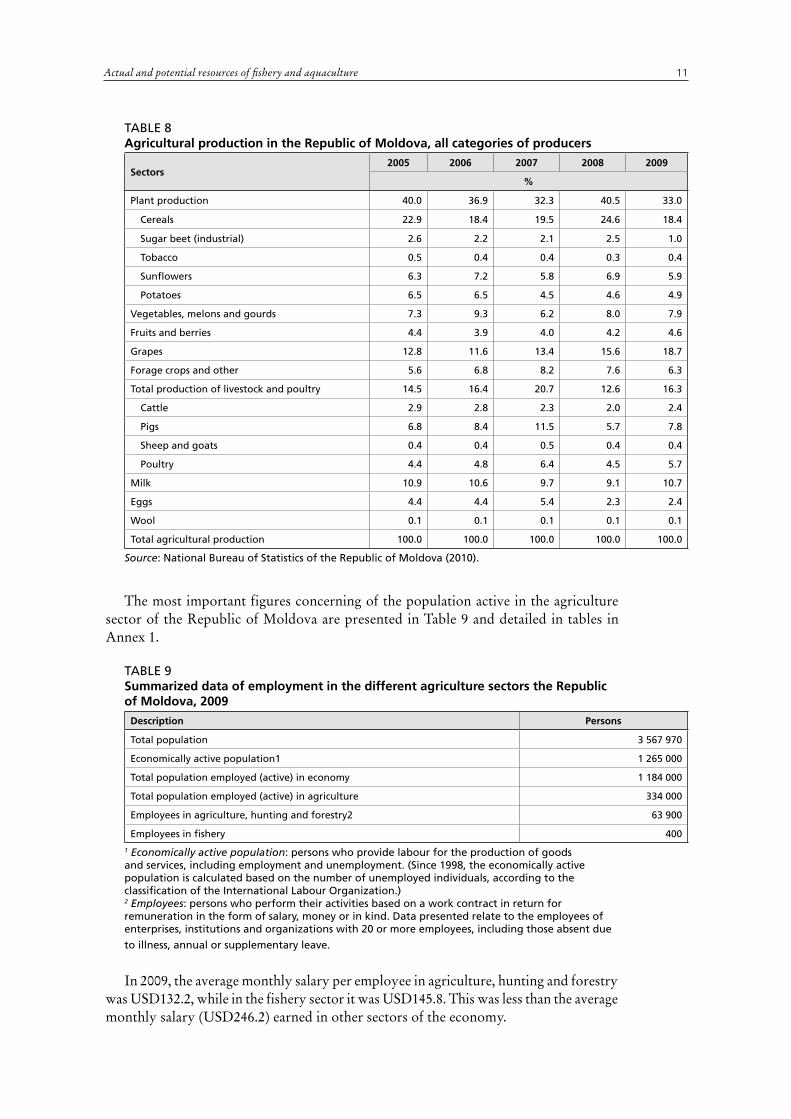
tAblE 8agricultural production in the Republic of moldova, all categories of producers
sectors2005 2006 2007 2008 2009
%
Plant production 40.0 36.9 32.3 40.5 33.0
Cereals 22.9 18.4 19.5 24.6 18.4
sugar beet (industrial) 2.6 2.2 2.1 2.5 1.0
tobacco 0.5 0.4 0.4 0.3 0.4
sunflowers 6.3 7.2 5.8 6.9 5.9
Potatoes 6.5 6.5 4.5 4.6 4.9
vegetables, melons and gourds 7.3 9.3 6.2 8.0 7.9
Fruits and berries 4.4 3.9 4.0 4.2 4.6
Grapes 12.8 11.6 13.4 15.6 18.7
Forage crops and other 5.6 6.8 8.2 7.6 6.3
total production of livestock and poultry 14.5 16.4 20.7 12.6 16.3
Cattle 2.9 2.8 2.3 2.0 2.4
Pigs 6.8 8.4 11.5 5.7 7.8
sheep and goats 0.4 0.4 0.5 0.4 0.4
Poultry 4.4 4.8 6.4 4.5 5.7
Milk 10.9 10.6 9.7 9.1 10.7
Eggs 4.4 4.4 5.4 2.3 2.4
Wool 0.1 0.1 0.1 0.1 0.1
total agricultural production 100.0 100.0 100.0 100.0 100.0
Source: National bureau of statistics of the Republic of Moldova (2010).
The most important figures concerning of the population active in the agriculture sector of the Republic of Moldova are presented in Table 9 and detailed in tables in Annex 1.
tAblE 9summarized data of employment in the different agriculture sectors the Republic of moldova, 2009
description persons
total population 3 567 970
Economically active population1 1 265 000
total population employed (active) in economy 1 184 000
total population employed (active) in agriculture 334 000
Employees in agriculture, hunting and forestry2 63 900
Employees in fishery 400
1 Economically active population: persons who provide labour for the production of goods and services, including employment and unemployment. (since 1998, the economically active population is calculated based on the number of unemployed individuals, according to the classification of the international labour Organization.)2 Employees: persons who perform their activities based on a work contract in return for remuneration in the form of salary, money or in kind. data presented relate to the employees of enterprises, institutions and organizations with 20 or more employees, including those absent due
to illness, annual or supplementary leave.
In 2009, the average monthly salary per employee in agriculture, hunting and forestry was USD132.2, while in the fishery sector it was USD145.8. This was less than the average monthly salary (USD246.2) earned in other sectors of the economy.
Review of fishery and aquaculture development potentials in the Republic of Moldova12
3.4 wateR ResouRcesAccording to the latest edition of the State Water Cadastre of the Republic of Moldova published in 2010, the total water volume used in the country decreased by 6.5 percent, from 849 million m3 to 793.5 million m3 between 2000 and 2008. In contrast, the discharge of polluted wastewater rose from 8.7 million m3 to 14.1 million m3, an increase of 62 percent.
In 2008, of the total volume of 793.5 million m3 of water used, 684.5 million m3 (86.3 percent) was surface water and 109.5 million m3 (13.7 percent) was underground water.
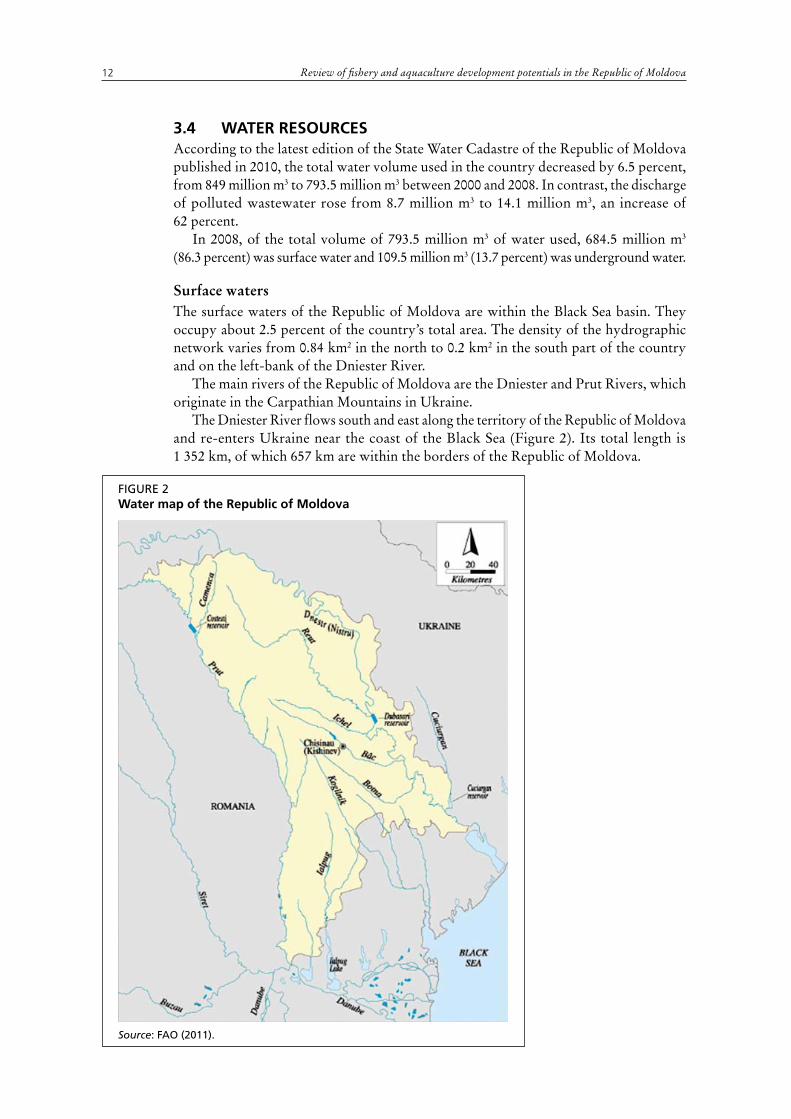
Surface watersThe surface waters of the Republic of Moldova are within the Black Sea basin. They occupy about 2.5 percent of the country’s total area. The density of the hydrographic network varies from 0.84 km2 in the north to 0.2 km2 in the south part of the country and on the left-bank of the Dniester River.
The main rivers of the Republic of Moldova are the Dniester and Prut Rivers, which originate in the Carpathian Mountains in Ukraine.
The Dniester River flows south and east along the territory of the Republic of Moldova and re-enters Ukraine near the coast of the Black Sea (Figure 2). Its total length is 1 352 km, of which 657 km are within the borders of the Republic of Moldova.
FiGURE 2water map of the Republic of moldova
Source: FAO (2011).
13Actual and potential resources of fishery and aquaculture
A peculiarity of the Dniester basin is that it lacks large tributaries but has numerous small streams instead. Its hydrographic network is dominated by more than 14 000 small rivers that are up to 10 km long. The average annual discharge rate of the Dniester River (Table 10), measured at the entrance and exit points of the Republic of Moldova, ranges from 224 to 245 m3/s.
The Dniester River is the main source of drinking-water in the Republic of Moldova, and it is no less important for a significant part of Ukraine, particularly in the Odessa region. Based on its flow collection pattern, water regime and physical and geographical characteristics, the Dniester River is generally divided into three parts:
• Upper Carpathian Dniester (286 km long). This section is from the river source to the village of Nizhny and to the Tlumach River inflow (2 km downstream of the mouth of the Zolota Lypa River).
• Middle Podol Dniester (715 km long). It stretches from the village of Nizhny to Dubossary.
• Lower Dniester (351 km long). This section is between the Dubossary Hydropower Station dam and the estuary.
In the Soviet era, the Dniester basin was managed as a single water system that covered the entire water catchment basis of the river. However, in 1991, the Republic of Moldova and Ukraine took over separately and divided up the management of the river basin.
The potential of the Dniester River for hydropower generation is considered to be relatively low owing to its flat channel slopes and, hence, the minimal fall of water flow produced on the river. In spite of this, two hydropower plants (HPPs) have constructed on the river. These are the Dubossary HPP (1954) and the Novodnestrovsc HPP (1983).
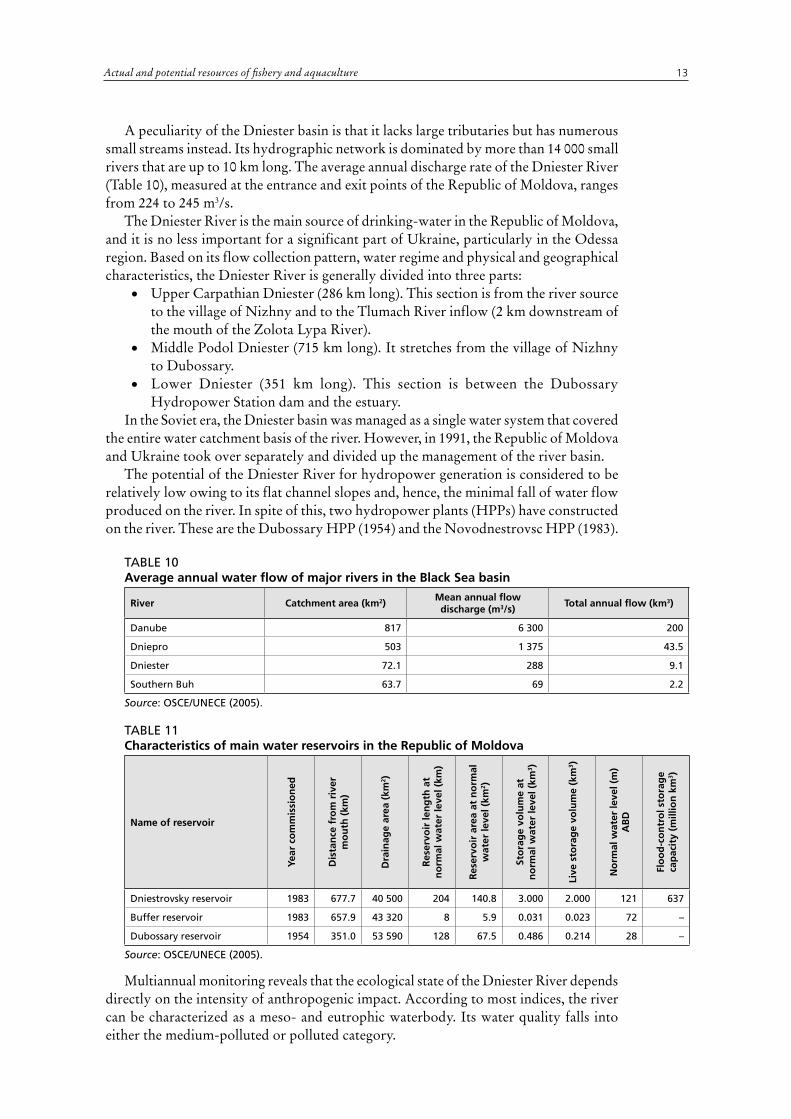
tAblE 10average annual water flow of major rivers in the black sea basin
River catchment area (km2)mean annual flow
discharge (m3/s)total annual flow (km3)
danube 817 6 300 200
dniepro 503 1 375 43.5
dniester 72.1 288 9.1
southern buh 63.7 69 2.2
Source: OsCE/UNECE (2005).
tAblE 11characteristics of main water reservoirs in the Republic of moldova
name of reservoir
year
co
mm
issi
on
ed
dis
tan
ce f
rom
riv
er
mo
uth
(km
)
dra
inag
e ar
ea (
km2 )
Res
ervo
ir le
ng
th a
t n
orm
al w
ater
leve
l (km
)
Res
ervo
ir a
rea
at n
orm
al
wat
er le
vel (
km2 )
sto
rag
e vo
lum
e at
n
orm
al w
ater
leve
l (km
3 )
live
sto
rag
e vo
lum
e (k
m3 )
no
rmal
wat
er le
vel (
m)
ab
d
flo
od
-co
ntr
ol s
tora
ge
cap
acit
y (m
illio
n k
m3 )
dniestrovsky reservoir 1983 677.7 40 500 204 140.8 3.000 2.000 121 637
buffer reservoir 1983 657.9 43 320 8 5.9 0.031 0.023 72 –
dubossary reservoir 1954 351.0 53 590 128 67.5 0.486 0.214 28 –
Source: OsCE/UNECE (2005).
Multiannual monitoring reveals that the ecological state of the Dniester River depends directly on the intensity of anthropogenic impact. According to most indices, the river can be characterized as a meso- and eutrophic waterbody. Its water quality falls into either the medium-polluted or polluted category.

Review of fishery and aquaculture development potentials in the Republic of Moldova14
The Prut River drains about 24 percent of the country and forms the Republic of Moldova’s western border with Romania until it discharges into the Danube River. Its average annual flow varies from 85 m3/s in the north to 110 m3/s at its confluence with the Danube River. The Prut River is regulated by Costesti-Stanca reservoir, which is situated in the northwest of the Republic of Moldova and jointly operated by the Republic of Moldova and Romania.
Because of the springs and snowmelt runoffs in the Carpathian Mountains, the maximum flows of Dniester and Prut Rivers occur normally in spring.
In the south of the country, the Republic of Moldova has a narrow entrance to the Danube River. In addition to the large rivers, there are numerous smaller rivers in the territory of the Republic of Moldova, but only nine have a length exceeding 100 km (see Table A2.3 in Annex 2). The whole river network consists of about 3 600 water courses, which measure a total of about 16 000 km. The average length of more than 3 000 streams, mostly seasonal and ephemeral, is less than 15 km.
In general, the Republic of Moldova does not have large lakes (see Table A2.4 of Annex 2). There are 57 natural lakes with a total surface of 62 km2. Most of the natural lakes are less than 1 km2. The majority of them are situated in the valleys of the Prut River, correspondingly, the Danube river basin system, and the Dniester River.
About 3 500 water reservoirs with a total surface are of 333 km2 have been built. The estimated total storage capacity of these small reservoirs3 is about 1.5 billion m3. About 100 reservoirs have capacity in excess of 1 million m3. The main water reservoirs are listed in Table 11 (and in Table A2.5 of Annex 2). Unlike with the Dubasari, Costesti-Stanca and Cuciurgan reservoirs there is no power plant on the Ghidighici reservoir built on the Bic River (a tributary of the Dniester River). However, this reservoir is important as a recreational site as it is situated not far from the capital, Chisinau.
Underground watersAccording to statistical data of the period 2002–09, the average annual volume of water received from natural water resources was 862 million m3, of which 132.5 million m3 came from underground springs.
About 7 000 boreholes of different depths can be found in the Republic of Moldova. Deep groundwater – especially from the Lower Baden Sarmat aquifer4 – is a major underground source of domestic and industrial water. Natural recharge of this aquifer is limited and there is also a threat of both overexploitation and permanent loss of capacity.
The quality of the groundwater is largely influenced by geological and geochemical conditions but human factors are also playing an increasingly important role in the pollution of deep groundwater aquifers via infiltration of polluted water from the surface and through abandoned boreholes. In some locations, natural anomalies of fluoride, strontium and selenium have been identified. For example, fluoride levels often reach 8–10 mg/litre, which is many times higher than the guideline limit of 1.5 mg/litre indicated by the World Health Organization.
Shallow groundwater is present throughout the country in recent quaternary sediments, which consists mostly of sand, sandstone and occasionally gravel. The capacity of shallow wells is limited because this type of groundwater is fed by precipitation. This shallow groundwater is highly vulnerable to human impacts. The majority of water samples (up to 80 percent) collected from shallow wells show deviation from the maximum allowable concentration of nitrate for drinking-water.
3 In some neighbouring countries, such small reservoirs are called barrage ponds and are used mainly for fish culture. 4 The Lower Baden Sarmat aquifer is a regional aquifer that lies under the entire country.
15Actual and potential resources of fishery and aquaculture
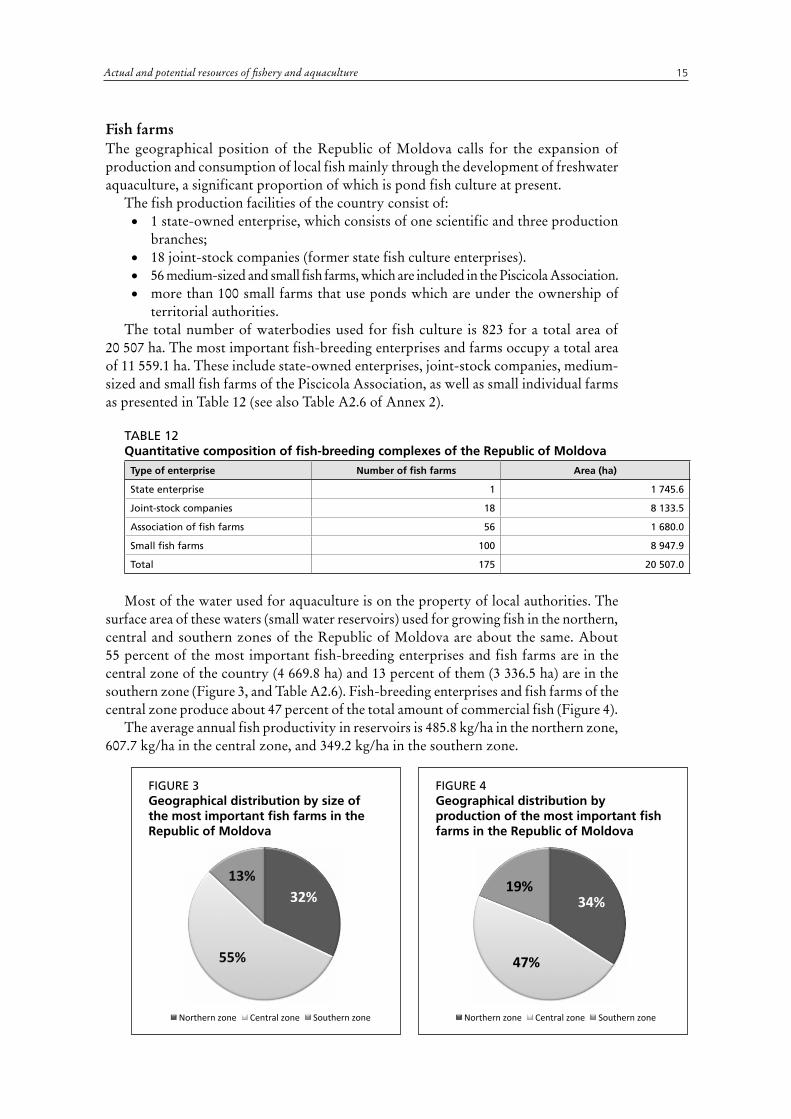
Fish farmsThe geographical position of the Republic of Moldova calls for the expansion of production and consumption of local fish mainly through the development of freshwater aquaculture, a significant proportion of which is pond fish culture at present.
The fish production facilities of the country consist of:• 1 state-owned enterprise, which consists of one scientific and three production
branches;• 18 joint-stock companies (former state fish culture enterprises).• 56 medium-sized and small fish farms, which are included in the Piscicola Association.• more than 100 small farms that use ponds which are under the ownership of
territorial authorities.The total number of waterbodies used for fish culture is 823 for a total area of
20 507 ha. The most important fish-breeding enterprises and farms occupy a total area of 11 559.1 ha. These include state-owned enterprises, joint-stock companies, medium-sized and small fish farms of the Piscicola Association, as well as small individual farms as presented in Table 12 (see also Table A2.6 of Annex 2).
tAblE 12quantitative composition of fish-breeding complexes of the Republic of moldova
type of enterprise number of fish farms area (ha)
state enterprise 1 1 745.6
Joint-stock companies 18 8 133.5
Association of fish farms 56 1 680.0
small fish farms 100 8 947.9
total 175 20 507.0
Most of the water used for aquaculture is on the property of local authorities. The surface area of these waters (small water reservoirs) used for growing fish in the northern, central and southern zones of the Republic of Moldova are about the same. About 55 percent of the most important fish-breeding enterprises and fish farms are in the central zone of the country (4 669.8 ha) and 13 percent of them (3 336.5 ha) are in the southern zone (Figure 3, and Table A2.6). Fish-breeding enterprises and fish farms of the central zone produce about 47 percent of the total amount of commercial fish (Figure 4).
The average annual fish productivity in reservoirs is 485.8 kg/ha in the northern zone, 607.7 kg/ha in the central zone, and 349.2 kg/ha in the southern zone.
FiGURE 3Geographical distribution by size of the most important fish farms in the Republic of moldova
FiGURE 4Geographical distribution by production of the most important fish farms in the Republic of moldova
32%
55%
13%
Northern zone Central zone Southern zone
34%
47%
19%
Northern zone Central zone Southern zone
Review of fishery and aquaculture development potentials in the Republic of Moldova16
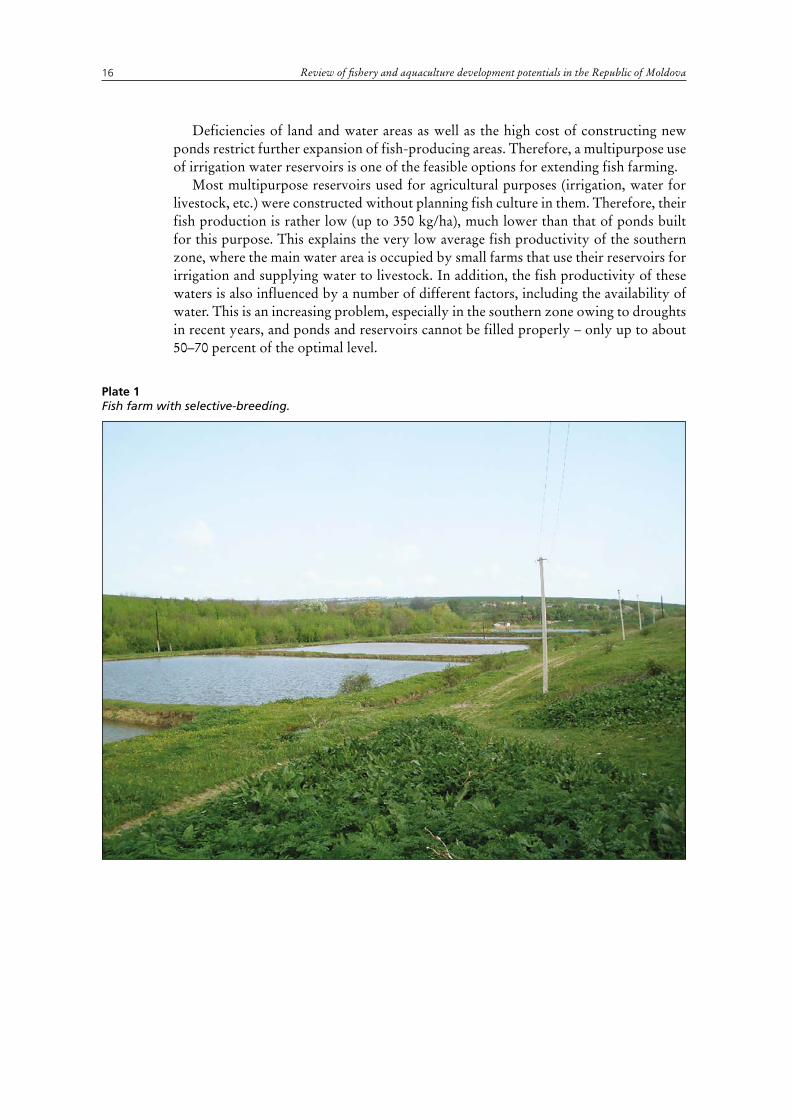
Deficiencies of land and water areas as well as the high cost of constructing new ponds restrict further expansion of fish-producing areas. Therefore, a multipurpose use of irrigation water reservoirs is one of the feasible options for extending fish farming.
Most multipurpose reservoirs used for agricultural purposes (irrigation, water for livestock, etc.) were constructed without planning fish culture in them. Therefore, their fish production is rather low (up to 350 kg/ha), much lower than that of ponds built for this purpose. This explains the very low average fish productivity of the southern zone, where the main water area is occupied by small farms that use their reservoirs for irrigation and supplying water to livestock. In addition, the fish productivity of these waters is also influenced by a number of different factors, including the availability of water. This is an increasing problem, especially in the southern zone owing to droughts in recent years, and ponds and reservoirs cannot be filled properly – only up to about 50–70 percent of the optimal level.
plate 1Fish farm with selective-breeding.
17Actual and potential resources of fishery and aquaculture
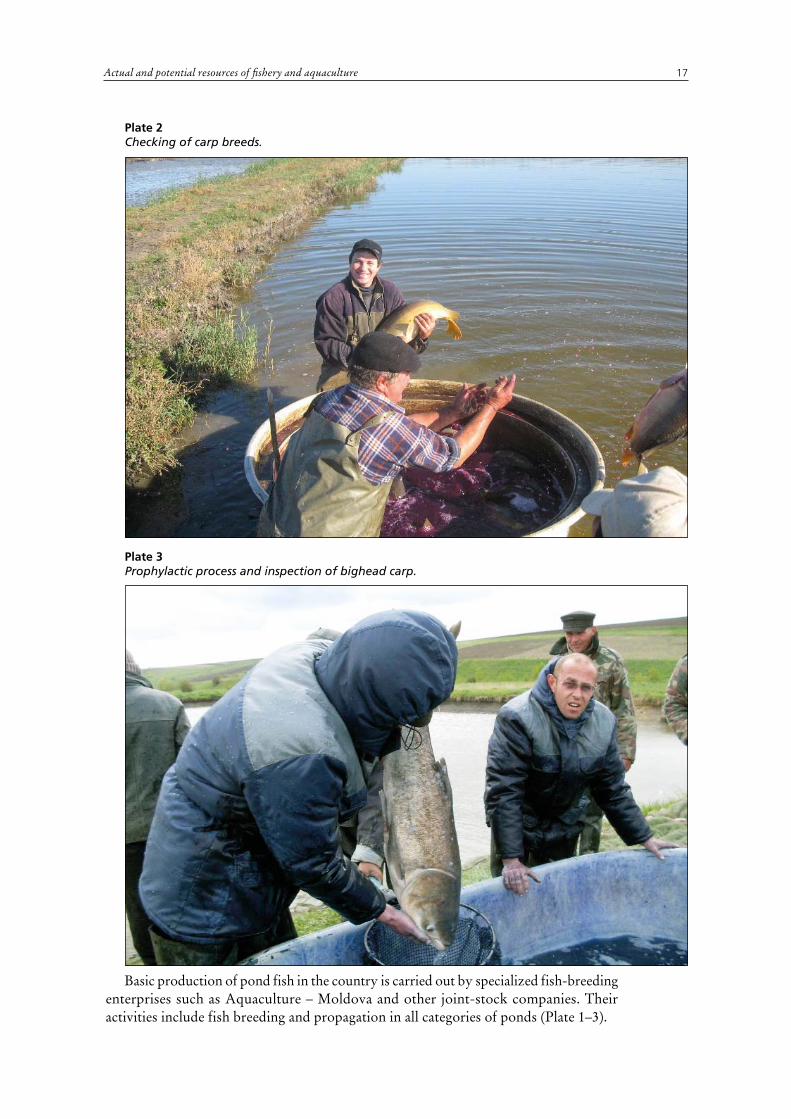
plate 2Checking of carp breeds.
plate 3Prophylactic process and inspection of bighead carp.
Basic production of pond fish in the country is carried out by specialized fish-breeding enterprises such as Aquaculture – Moldova and other joint-stock companies. Their activities include fish breeding and propagation in all categories of ponds (Plate 1–3).

Review of fishery and aquaculture development potentials in the Republic of Moldova18
plate 4Marking of common carp with an electronic microchip to follow-up individual performance.
plate 5Reading the electronic microchip in a selected common carp.
19Actual and potential resources of fishery and aquaculture
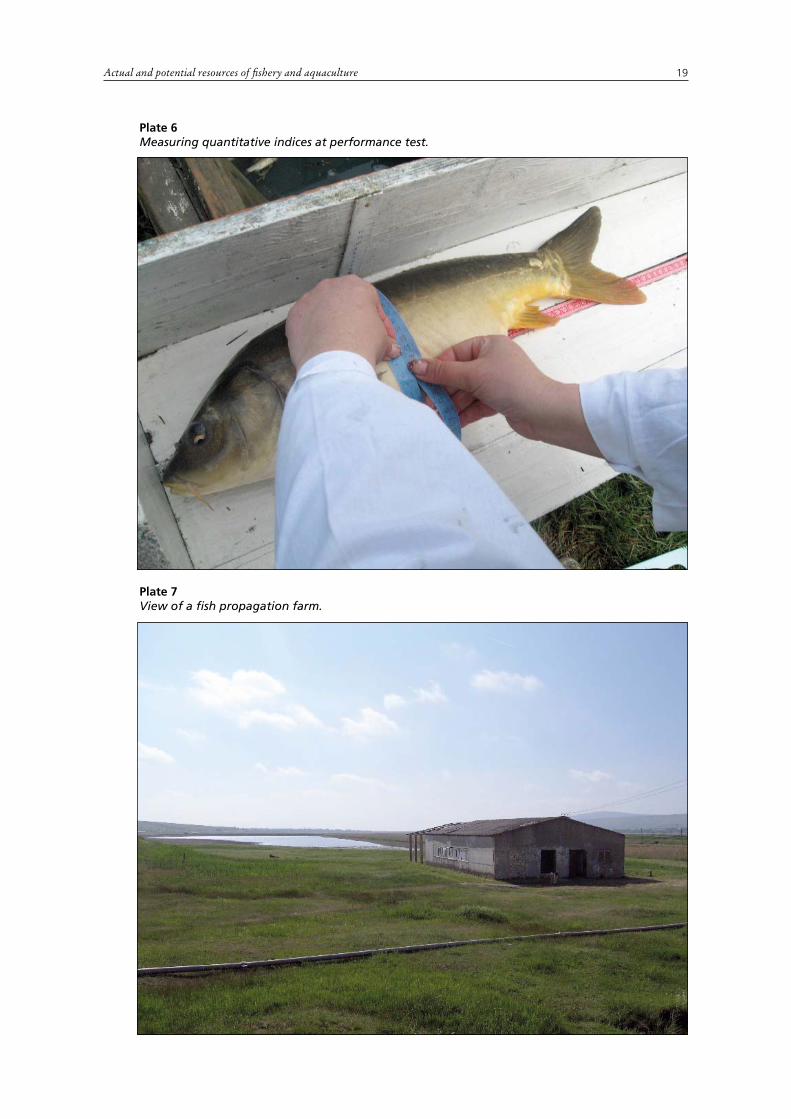
plate 6Measuring quantitative indices at performance test.
plate 7View of a fish propagation farm.
Review of fishery and aquaculture development potentials in the Republic of Moldova20
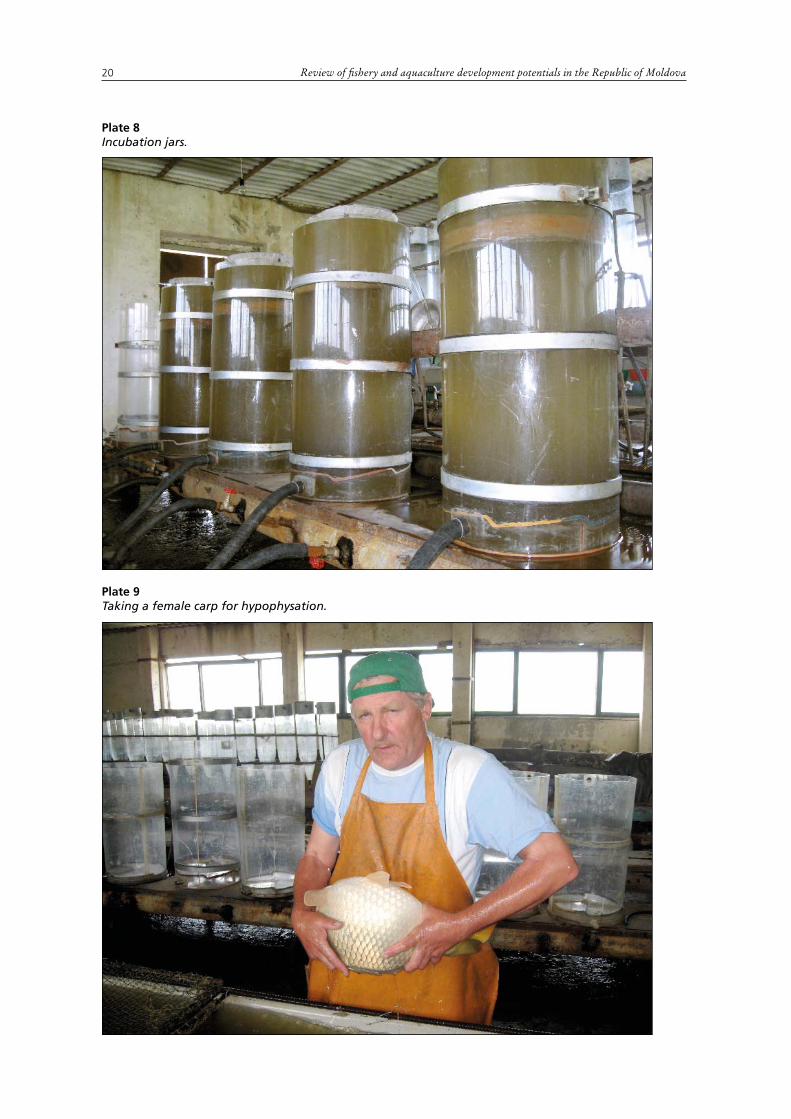
plate 8Incubation jars.
plate 9Taking a female carp for hypophysation.

21Actual and potential resources of fishery and aquaculture
Today, there are five certified fish breeding farms in the Republic of Moldova. Two of them are state-owned. These are the Teleneshty Branch and Kubolta Branch of Aquaculture – Moldova. It is here where the three certified common carp breeds (Teleneshtskiy scaly, Teleneshtskiy frame and the Kuboltskiy scaly) were developed, together with a fourth breed which is in the testing stage. This is the Myndykskiy carp, which is a scattered-scaled type (Table 13 and Plates 4–13).
Three fish-breeding complexes have been privatized and certified to breed herbivorous species. These enterprises carry out the selection, reproduction and growing of breeding and stocking material both for their own farms and for the farms of others.
Four fish-breeding complexes produce larvae of carp and herbivorous fish on a large scale to stock their own ponds and to sell to other farms. They provide larvae, advanced fry and yearlings not only for fish-breeding enterprises but also for almost all of the small fish farms, as these small farms produce only table fish. This is because they have only a few ponds with an average area of 20 ha; therefore, they cannot afford to occupy fish pond area with rearing their own stocking materials. Thus, they must rely on the fish breeding complexes (FBCs) or reproductive complexes (RCs). Therefore, the development of individual farms is currently possible only by the following scheme: FBC (RC) → specialized fish seed production enterprises → individual fish farms.
tAblE 13list of fish-breeding and reproduction farms in the Republic of moldova
name and owner of fish farm selection line of fish species direction of activity
state-owned fish-breeding farms:
Cubolta branch of the state Enterprise Aquaculture –Moldova
Carp kuboltskiy scaly Carp Myndykskiy scattered scales CatfishPike
broodfishbreeding and industrial fish larvaeselection and industrial stocking material of fish
telenesti branch of the state Enterprise Aquaculture –Moldova
Carp teleneshtskiy scaly,Carp teleneshtskiy frame,Carp kuboltskiy scaly, Catfish
broodfishbreeding and industrial fish larvaeselection and industrial stocking material of fish
private fish-breeding farms:
s.A. Gura-bîculuisilver carpbighead carpGrass carp
broodfishbreeding and industrial fish larvaeselection and industrial stocking material of fish
s.A. victoria (private property)
silver carpbighead carpGrass carp Crucian
broodfishbreeding and industrial fish larvaeselection and industrial stocking material of fish
s.A. Costeşti (private property)silver carpbighead carpGrass carp
broodfishbreeding and industrial fish larvaeselection and industrial stocking material of fish
complexes (private) of fish reproduction:
i.E. Russ
silver carpbighead carpGrass carp Common carp
industrial fish larvaeindustrial stocking material of fish
s.A. Ghidrin Common carpindustrial fish larvaeindustrial stocking material of fish
s.A. Pescăruş-dănceni
silver carpbighead carpGrass carp Common carp
industrial fish larvaeindustrial stocking material of fish
s.A. Acvariumsilver carpbighead carpGrass carp
industrial fish larvaeindustrial stocking material of fish
Review of fishery and aquaculture development potentials in the Republic of Moldova22
3.5 fishes of the Republic of moldovaIn view of their importance to conservation of biodiversity, the Dniester River, the Prut River and water reservoirs located in their basins are regarded as higher-category fishery waterbodies. Their main gene pools of valuable fish species belong to the below families:
• Acipenseridae: Huso huso, Acipenser gueldenstaedtii, Acipenser stellatus and Acipenser ruthenus;
• Cyprinidae: Abramis brama, Barbus barbus, Cyprinus carpio, Aspius aspius, Rutilus frisii, Vimba vimba, Tinca tinca, etc.;
• Clupeidae: Alosa immaculata and Alosa caspia;• Percidae: Sander lucioperca, Sander volgensis, Perca fluviatilis, Zingel zingel and
Zingel streber;• Species of other families such as Silurus glanis, Esox lucius, Lota lota, Hucho
hucho and Salmo labrax.The fish fauna of the Republic of Moldova comprises more than 92 species (see
Table A2.8). These species belong to 14 orders and 23 families. Considering the number of species, the country has a rich fish fauna and, therefore, high amounts of catches could be expected. However, the catch is determined not only by the density of species but also by many other biotic and abiotic factors. The fishery of each waterbody depends on the fish fauna, the value of the species caught, the composition and structure of the fish populations, the reproduction conditions, nutrition, and the geographical and seasonal distribution of species. Hence, a functional ichthyocenosis is required. If this is out of balance, it leads to quantitative and qualitative disproportions of intraspecific and interspecific relationships.
Before river training, many more fish species lived in the Dniester and Prut Rivers. In the second half of the twentieth century, catches declined considerably, especially in the case of sturgeons. At the same time, the quantities of Barbus barbus, Vimba vimba, Sander lucioperca, Cyprinus carpio, Aspius aspius, Silurus glanis, Tinca tinca and Rutilus frisii also decreased. Currently, Acipenser gueldenstaedtii, Huso huso and Acipenser stellatus are found and registered irregularly.
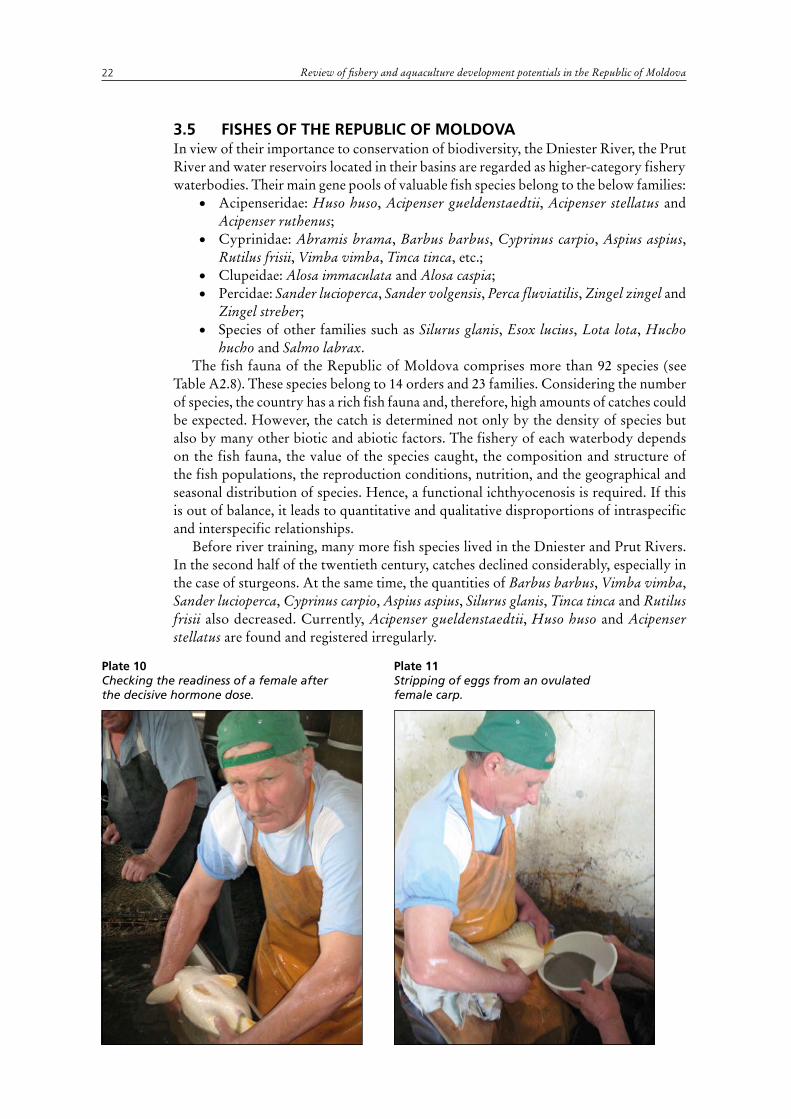
plate 10Checking the readiness of a female after the decisive hormone dose.
plate 11Stripping of eggs from an ovulated female carp.
23Actual and potential resources of fishery and aquaculture
The disappearance of sturgeons and other valuable species has been influenced by human factors as the conditions of breeding, feeding and growth of fishes have changed considerably. The most significant human factors influencing the changes have been:
• Regulation of water flows by the construction of Dubasari, Novodnestrovsc and Costesti-Stanca dams. These reduced the area of the floodplains of the Dniester and Prut Rivers that were the natural breeding grounds of many fish species. The reduced area of the floodplains also influenced the feeding grounds of developing fry and fingerlings of different fish species.
• The extraction of sand and stone from river beds and the use of water for agricultural, industrial and household purposes did not consider fish fauna and its needs.
• Pollution of waterbodies with untreated wastewater of agricultural and industrial enterprises polluted waters with pesticides, herbicides and other chemical substances.
• Unplanned exploitation of fish resources through unregulated and illegal fishing and poaching.
• Lack of provisions designed to protect and improve fisheries of different waterbodies.
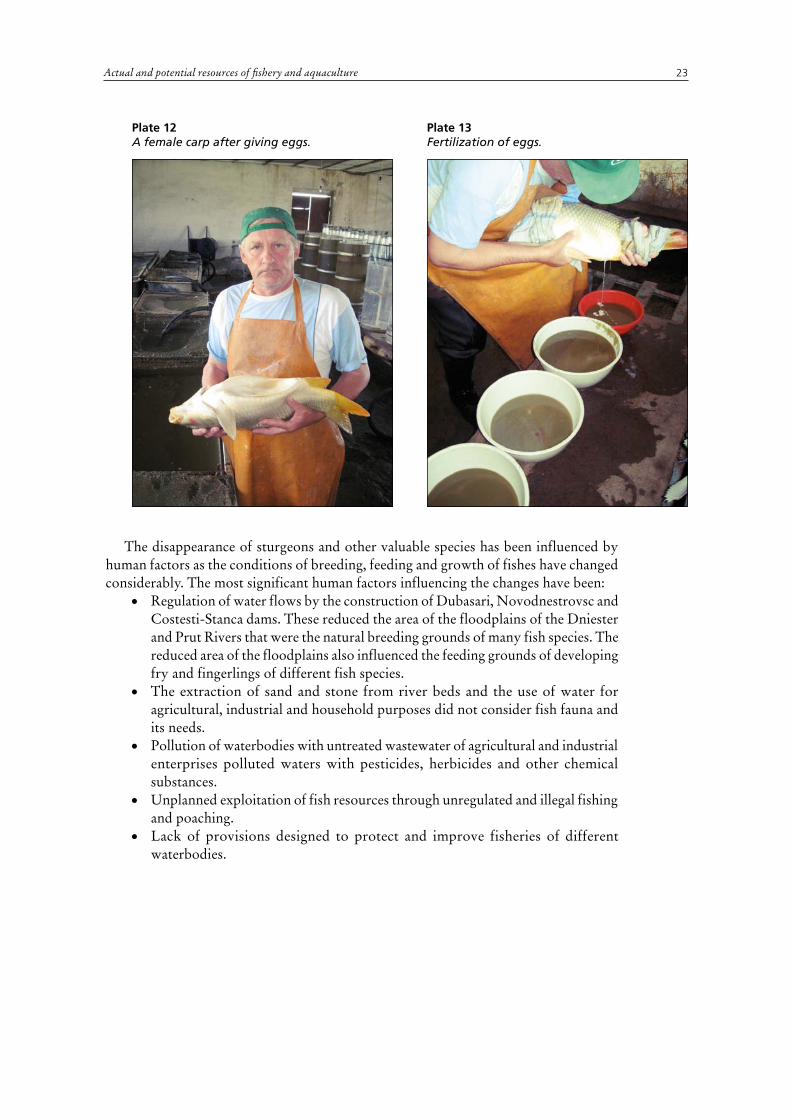
plate 12A female carp after giving eggs.
plate 13Fertilization of eggs.


25
4. status of fisheries and aquaculture production
4.1 captuRe fisheRies and aquacultuRe
Capture fisheriesDetails of the total production of capture fisheries in the natural waters of the Republic of Moldova between 1991 and 2010 are presented in Annex 3 (Tables A3.1–A3.5). Analyses of catches in water reservoirs show that the largest (177 tonnes) and smallest (7 tonnes) amounts of fish were caught in 1991 and 1998, respectively. Within this period, commercial fishing in reservoirs was based on the capture of the following fish species: Cyprinus carpio carpio, Abramis brama, Sander lucioperca, Carassius gibelio, Rutilus rutilus, Rutilus heckeli, Aspius aspius, Vimba vimba, Silurus glanis and Chinese major carps. Among these species, Chinese major carps and bream (Abramis brama) were the most frequently registered fishes in the catches, e.g. 38.8 tonnes and 35 tonnes, respectively, in 1995.
In rivers, the core of industrial fishing included Cyprinus carpio carpio, Abramis brama, Sander lucioperca, Carassius gibelio, Rutilus rutilus, Rutilus heckeli, Pelecus cultratus, Silurus glanis, Esox lucius, Perca fluviatilis and Blicca bjoerkna. The largest catch of fish (27 tonnes) was recorded in 2005, with Abramis brama accounting for more than half of the catch (14.6 tonnes). At different times, an important contribution has been made by species such as Rutilus rutilus, Rutilus heckeli (a combined total of 9.9 tonnes in 1995), and Carassius gibelio (4.1 tonnes in 2010).
AquacultureAs only an insignificant proportion of the country’s water resources is used for fish culture, total aquaculture production in ponds and water reservoirs is relatively small. Therefore, fish farming is not among the leading prioritized agricultural activities. However, as an activity with very specific techniques, it has the potential to become a relatively cheap and very valuable source of protein for the population.
Between 2002 and 2010, the aim of the development programme of the fish culture industry was to increase the production of table fish. The target was to increase production to 7 600 tonnes by 2010. In fact, by 2010, the total production of fish ponds was 8 813 tonnes, about 5.1 and 7.3 times higher than in 2000 and 1997, respectively.
In the transition period to the new economy, which was marked by production declines in many industries (including aquaculture), fish producers had no access to public financial support. This had several effects, including:
• The organizational and technological levels of fish enterprises decreased.• Intensive fish farming methods were changed to extensive ones.• Demand for new scientific results to be applied in aquaculture practically
disappeared. All these led to a sharp decrease in fish production. The number of ponds for farmed
fish also decreased significantly, which negatively affected the consumption of fish and fish products. Between 1994 and 2002, production was extensive on almost all fish farms. Later, there was a gradual improvement. Specialized fish enterprises and medium-sized
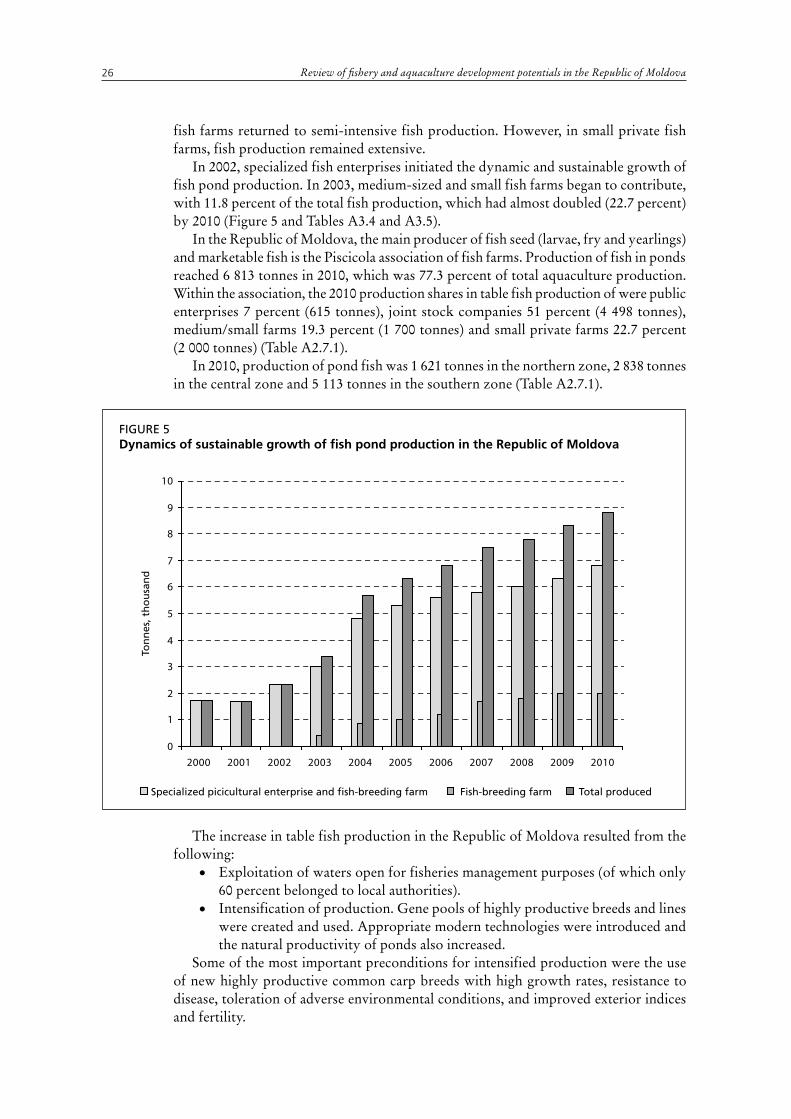
Review of fishery and aquaculture development potentials in the Republic of Moldova26
fish farms returned to semi-intensive fish production. However, in small private fish farms, fish production remained extensive.
In 2002, specialized fish enterprises initiated the dynamic and sustainable growth of fish pond production. In 2003, medium-sized and small fish farms began to contribute, with 11.8 percent of the total fish production, which had almost doubled (22.7 percent) by 2010 (Figure 5 and Tables A3.4 and A3.5).
In the Republic of Moldova, the main producer of fish seed (larvae, fry and yearlings) and marketable fish is the Piscicola association of fish farms. Production of fish in ponds reached 6 813 tonnes in 2010, which was 77.3 percent of total aquaculture production. Within the association, the 2010 production shares in table fish production of were public enterprises 7 percent (615 tonnes), joint stock companies 51 percent (4 498 tonnes), medium/small farms 19.3 percent (1 700 tonnes) and small private farms 22.7 percent (2 000 tonnes) (Table A2.7.1).
In 2010, production of pond fish was 1 621 tonnes in the northern zone, 2 838 tonnes in the central zone and 5 113 tonnes in the southern zone (Table A2.7.1).
The increase in table fish production in the Republic of Moldova resulted from the following:
• Exploitation of waters open for fisheries management purposes (of which only 60 percent belonged to local authorities).
• Intensification of production. Gene pools of highly productive breeds and lines were created and used. Appropriate modern technologies were introduced and the natural productivity of ponds also increased.
Some of the most important preconditions for intensified production were the use of new highly productive common carp breeds with high growth rates, resistance to disease, toleration of adverse environmental conditions, and improved exterior indices and fertility.
FiGURE 5dynamics of sustainable growth of fish pond production in the Republic of moldova
0
1
2
3
4
5
6
7
8
9
10
2000 2001 2002 2003 2004 2005 2006 2007 2008 2009 2010
Specialized picicultural enterprise and fish-breeding farm Fish-breeding farm Total produced
Ton
nes
, th
ou
san
d
27Status of fisheries and aquaculture production
For the first time in the practice of carp breeding in the Republic of Moldova, researchers and scientists of the Fisheries Scientific Research Station (now the Chisinau Branch of the State Enterprise Aquaculture – Moldova) worked out a programme of selection that focused on the feature of increased resistance to infectious diseases. In other words, genetic methods of preventive health care were used. This programme was started as a result of mainly two factors: increased pollution of ponds, and high receptivity to infections, especially to aeromonas.
Since 2003, the carp breeds Teleneshtskiy scaly, Teleneshtskiy frame and Kuboltskiy scaly have been widely introduced into production as part of the Development Programme of Fisheries Industry of Moldova. As these carp breeds form more than 75 percent of the common carp broodstock in the country, they ensure high-quality fish-stocking material for most fish farms under the different forms of ownership. Intensive production results are: Teleneshtskiy scaly are 1 800 kg/ha, Teleneshtskiy frame 1 570 kg/ha, and Kuboltskiy scaly 1 470 kg/ha. In semi-intensive conditions, these numbers are 700–780 kg/ha, 680–750 kg/ha and 650–700 kg/ha, respectively (Table 14).
In order to ensure the maximization of the production potentials of pond fish farming, the technique of carp polyculture is used. This includes silver carp, bighead carp and grass carp as well as predatory species such as pikeperch, pike and/or catfish.
As a result of successful introduction and acclimatization in the late 1960s, Chinese major carps occupy an important part of fish farming in the Republic of Moldova and account for 65 percent of the total production of fish ponds. Currently, the fifth generation of broodstocks of silver carp and bighead carp and the fourth generation of grass carp are already present. They serve as pedigree material of different age groups of new lines.
tAblE 14Reproductive and fish-breeding indices of common carp strains in the Republic of moldova
indices
carp breeds (generations)
teleneshtskiy scaly (5)
teleneshtskiy frame (5)
Kuboltskiy scaly (5)
Average weight of females (g) 5 280 5 360 5 300
Weight of ovulating eggs per female (g) 970 1 010 900
Working fecundity (1 000 eggs/female) 720 760 670
Relative fecundity (1 000 eggs/1 kg of female bW) 136 142 126
Fertilization (%) 93.0 90.0 94.0
development of eggs (%) 82.0 80.0 83.0
yield of three-day larvae (1 000) 410 430 390
yield of hatched larvae (%) 57.0 56.6 58.0
Annual fish productivity (100 kg/ha) – intensive method of cultivation
18.0 15.7 14.7
Annual fish productivity (100 kg/ha) – semi-intensive method of cultivation
7.0–7.8 6.8–7.5 6.5–7.0
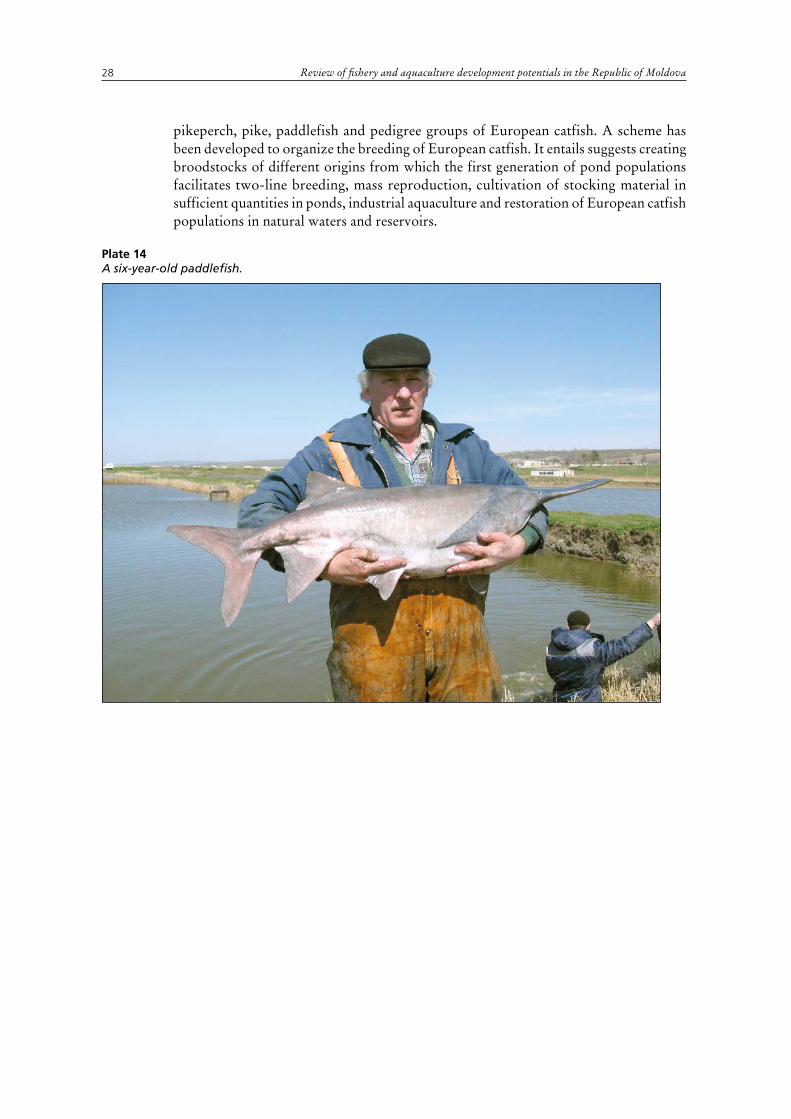
At the present stage of the development of pond aquaculture, the main aim is to introduce low-cost technologies for a more economic production of commercially valuable fish species. In this process, scientists have found that paddlefish could be suitable for a partial replacement for bighead carp in a polyculture system. The technology of paddlefish cultivation in polyculture with other traditional carp species has been developed and implemented (Plate 14). In the Republic of Moldova, the average seasonal growth of a two-year-old paddlefish is as high as 1 320–1 400 g.
On fish-breeding farms, broodstocks of the following species have been developed:
Review of fishery and aquaculture development potentials in the Republic of Moldova28
pikeperch, pike, paddlefish and pedigree groups of European catfish. A scheme has been developed to organize the breeding of European catfish. It entails suggests creating broodstocks of different origins from which the first generation of pond populations facilitates two-line breeding, mass reproduction, cultivation of stocking material in sufficient quantities in ponds, industrial aquaculture and restoration of European catfish populations in natural waters and reservoirs.
plate 14A six-year-old paddlefish.
Review of fishery and aquaculture development potentials in the Republic of Moldova 29
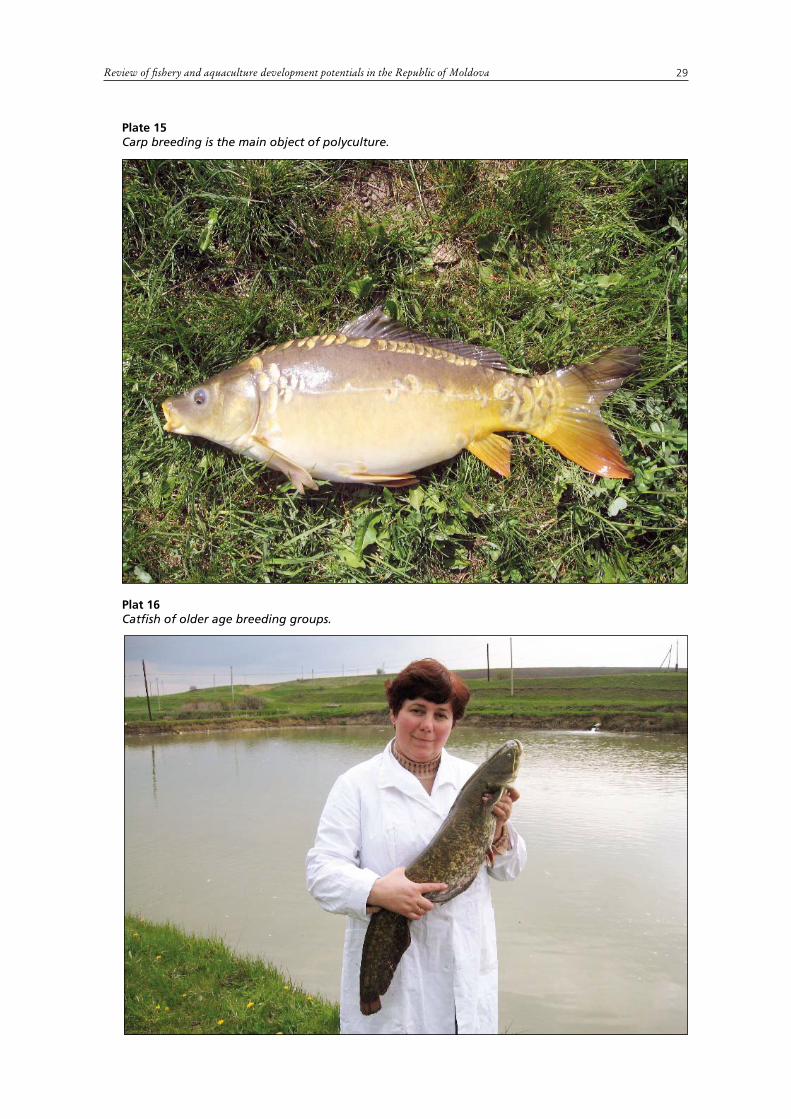
plate 15Carp breeding is the main object of polyculture.
plat 16Catfish of older age breeding groups.

Review of fishery and aquaculture development potentials in the Republic of Moldova30
4.2 RecReational fisheRiesThe National Federation of Sport and Amateur Fishing of Moldova was founded by fishers and non-governmental organizations (NGOs). It was formed in order to promote sport fishing, to attract foreign tourists and also to protect and preserve fisheries resources of the country, as well as to combat poaching. Its priorities include the organization of sport fishing events, and national and international sport and amateur fishing competitions, especially of predator species of natural waterbodies.
The Federation has recently developed an international ecotourism centre for sport fishing and family recreation on the Dniester River. The centre consists of a hotel, entertainment facilities, boat stations and a scientific laboratory for the study of water quality and fish populations.
Another organization, the Society of Hunters and Fishers, manages nine waterbodies where sport and amateur fishing events are organized. The total area of these waterbodies is 1 102 ha. The largest one is Lake Ghidighici (800 ha) while the smallest is the Javpari pond (18 ha) at the village of Javpari in Cimislia County. The society also has a 24 ha farm for fingerling production to stock its waterbodies.
Waterbodies used for angling are stocked annually with Cyprinus carpio, Carassius gibelio, Scardinius erythrophthalmus, Abramis brama, Perca fluviatilis and Rutilus rutilus. Some of the waterbodies are also stocked with Sander lucioperca and Esox lucius.
4.3 facilitatinG industRyTo date, no facilitating industry for the fishery and aquaculture sector has developed in the Republic of Moldova. However, in recent years, some fish farms have set up minilines to produce fish feeds for their own use.
An important step in the development of the aquaculture sector could be the establishment of low-value fish production based on fish feed production in the country.

31
5. status of processing and trade of fish and fishery products
5.1 fish pRocessinG and stoRaGeToday, similar to the situation in most countries of Central and Eastern Europe, the fish processing industry in the Republic of Moldova is underdeveloped. Locally produced fish are sold mostly alive, chilled or in partially processed form as mince, fillet and portions.
For storing and easy catching of live fish for sale in winter, fish farms with appropriate pond infrastructure harvest all table fish from fattening ponds before the freezing period starts and move them into wintering ponds of 0.3–1.0 ha. From these wintering ponds, fish are caught in smaller quantities for both wholesalers and retailers.
Processing, such as salting, marinating and smoking, is frequent in the case of certain marine fish species (mainly herring and mackerel) imported in frozen form.
5.2 distRibution, maRKetinG and tRade of fish and fisheRy pRoducts The fish products available at markets in the Republic of Moldova are of two types: imports, mostly marine species; and inland fishes captured in fisheries or produced by national aquaculture enterprises. The main source of local fish is freshwater aquaculture, more precisely pond fish culture.
Fish caught in natural waters and reservoirs (the Dubasari and Costesti-Stinca reservoirs and the Lower Dniester, Medium Dniester and Lower Prut Rivers, and Lake Cahul) constitute a very small proportion of total local fish production. This proportion was 0.3 percent in 2007–09, increasing to 1.7 percent by 2001–03.
The largest volumes of fish caught and delivered to local market appeared in 2003, 2004, 2005 and 2006 (Table A3.5). The production and sale of pond fish marked by dynamic sustainable growth had a noticeable impact on the consumption of native fish.
The fish species in most demand are the common carp, pikeperch, crucian carp, catfish, grass carp, bighead carp and silver carp, in that order.
The main channels for the sale of fish and fish products are markets, specialized stores and supermarkets. Regional and metropolitan markets are responsible for about 65 percent of fish sales.
Local freshwater fishes are sold mostly alive, fresh, chilled and in partially processed form (mince, fillet, cut into portions). The peak in the consumption of local fish species is in October and November – accounting for 70 percent of total annual consumption.
Locally caught fish and aquaculture products constitute 8 857.4 tonnes/year, or about 24.5 percent of the total volume of fish and fish products consumed in the Republic of Moldova in 2010.
The cost of fresh fish from ponds depends on the species, producers, technology, etc. and varies from USD0.69/kg (silver and bighead carps) to USD1.83/kg (catfish). This has an impact on wholesale and retail prices (Table A3.7), which have seasonal fluctuations.
Imported fish enters the markets of the Republic of Moldova in the following forms: fresh, chilled or frozen, fish fillets and other fish meat, flours, powders and pellets of fish, prepared or preserved fish (dried, salted or smoked), caviar and substitutes of fish eggs (see Table A3.6).

Review of fishery and aquaculture development potentials in the Republic of Moldova32
Fishery products mainly consist of crustaceans, molluscs and other aquatic invertebrates (live, fresh, chilled, frozen, dried, salted, prepared or preserved).
In the past 11 years the peak in sales of imported fish on the markets of the Republic of Moldova was 34 114.8 tonnes in 2008 (Tables 15 and 16). By 2010, this value had decreased to 27 309.6 tonnes (Figure 6).
FiGURE 6Results of capture fisheries and aquaculture in the Republic of moldova, 2000–2011
tAblE 15external trade of fish, crustaceans, molluscs and other aquatic invertebrates according to the nomenclature of Goods, 2001–09
2001 2002 2003 2004 2005 2006 2007 2008 2009
usd1 000
Exports 1 423.6 537.0 723.6 151.0 184.7 134.3 96.2 105.7 275.2
imports 7 517.2 7 832.9 6 191.4 8 599.6 12 168.1 15 372.5 23 050.1 36 699.6 29 382.3
Note: information is presented without data on enterprises and organization from the left side of the dniester River and the municipality of bender.Source: National bureau of statistics of the Republic of Moldova (www.statistica.md).
tAblE 16external trade of fish, crustaceans and molluscs according to the standard international trade classification, 2001–09
2001 2002 2003 2004 2005 2006 2007 2008 2009
usd1 000
Exports 8.7 440.4 – 423.5 201.9 80.2 35.5 6.0 180.6
imports 81 623.9 9 184.0 8 712.6 13 107.1 18 171.4 22 218.3 31 391.8 48 534.7 38 281.4
Note: information is presented without data on enterprises and organization from the left side of the dniester River and the municipality of bender.Source: National bureau of statistics of the Republic of Moldova (www.statistica.md).
0
5
10
15
20
25
30
35
40
2000 2001 2002 2003 2004 2005 2006 2007 2008 2009 2010
Tonn
es, t
hous
and
f ishing fish culture total: f ish products import
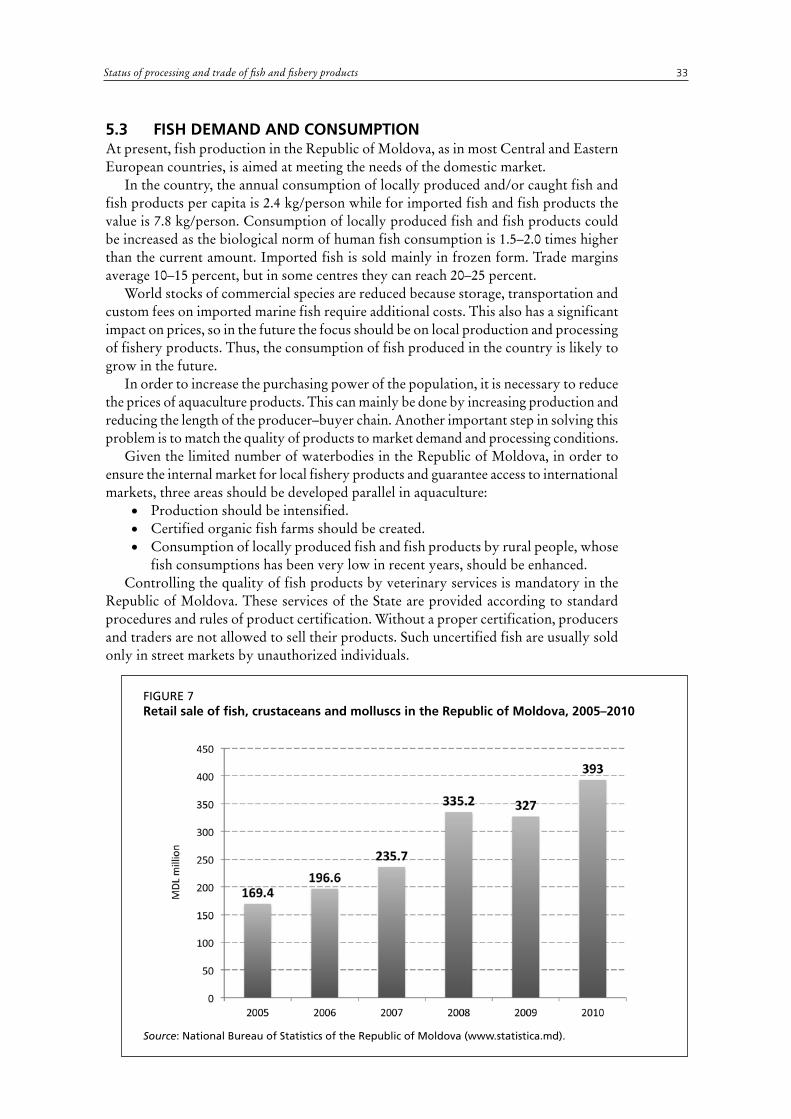
33Status of processing and trade of fish and fishery products
5.3 fish demand and consumptionAt present, fish production in the Republic of Moldova, as in most Central and Eastern European countries, is aimed at meeting the needs of the domestic market.
In the country, the annual consumption of locally produced and/or caught fish and fish products per capita is 2.4 kg/person while for imported fish and fish products the value is 7.8 kg/person. Consumption of locally produced fish and fish products could be increased as the biological norm of human fish consumption is 1.5–2.0 times higher than the current amount. Imported fish is sold mainly in frozen form. Trade margins average 10–15 percent, but in some centres they can reach 20–25 percent.
World stocks of commercial species are reduced because storage, transportation and custom fees on imported marine fish require additional costs. This also has a significant impact on prices, so in the future the focus should be on local production and processing of fishery products. Thus, the consumption of fish produced in the country is likely to grow in the future.
In order to increase the purchasing power of the population, it is necessary to reduce the prices of aquaculture products. This can mainly be done by increasing production and reducing the length of the producer–buyer chain. Another important step in solving this problem is to match the quality of products to market demand and processing conditions.
Given the limited number of waterbodies in the Republic of Moldova, in order to ensure the internal market for local fishery products and guarantee access to international markets, three areas should be developed parallel in aquaculture:
• Production should be intensified.• Certified organic fish farms should be created. • Consumption of locally produced fish and fish products by rural people, whose
fish consumptions has been very low in recent years, should be enhanced.Controlling the quality of fish products by veterinary services is mandatory in the
Republic of Moldova. These services of the State are provided according to standard procedures and rules of product certification. Without a proper certification, producers and traders are not allowed to sell their products. Such uncertified fish are usually sold only in street markets by unauthorized individuals.
FiGURE 7Retail sale of fish, crustaceans and molluscs in the Republic of moldova, 2005–2010
Source: National bureau of statistics of the Republic of Moldova (www.statistica.md).

Review of fishery and aquaculture development potentials in the Republic of Moldova34
Data on the value of retail trade of fish, crustaceans and molluscs reveal increasing consumption of these products in recent years. For example, in 2010 the value of retail sales was 2.3 times higher than in 2005 (Figure 7).
People prefer live fish, especially of species such as carp, pike and catfish. However, Chinese major carps make up the largest share of fish production of the country, and are also somewhat cheaper and more affordable for poor or poorer people. Among frozen imported marine fish species, hake and sea bream are the cheapest ones.
35
6. Governance and institutional frameworks of the fisheries and aquaculture sector
6.1 administRationDifferent state bodies and institutions have different responsibilities relating to the administration of the fishery and aquaculture sector of the Republic of Moldova.
The responsibilities of the Ministry of Environment are:• development of state policies on the creation and protection of fish stocks;• establishment of procedures and methods for the study of aquatic biological
resources, with the participation of the Academy of Sciences of Moldova;• elaboration of the methodology for calculating the damage caused to aquatic
biological resources;• ensuring monitoring in fisheries and conservation of aquatic biological resources
in natural waterbodies and large water reservoirs;• state supervision through the Fisheries Service in compliance with normative
acts on natural aquatic fisheries bodies;• at the proposal of the Ichthyologic Board, approval of introduction and
acclimatization of new fish species and bans on fishing for rare and endangered fish species in natural waters.
The responsibilities of the Fisheries Service are:• providing protection for aquatic biological resources in natural fishery
waterbodies;• regulation of fisheries, including implementation of measures on the improvement
of fishery and reproduction sites of fishes and other aquatic organisms;• prevention and suppression of violations of legislation;• keeping records of hydrobiotopes;• together with relevant scientific institutions, evaluation of the state of aquatic
biological resources;• approval of catch quotas;• determining damage caused by different human activities to aquatic biological
resources.In order to develop fish farming, the Ministry of Agriculture and Food Industry
elaborates and ensures implementation of development strategies for fish culture in different waterbodies regardless of their form of ownership and operational organization. It operates with the participation of the Academy of Sciences and the State Enterprise on Research and Production of Water Bio-resources Aquaculture – Moldova. Tasks of the ministry are:
• coordinating the implementation of biotechnologies in fish reproduction and rearing;
• conducting follow-up investigations and carrying out inspection work on artificial reproduction and breeding, including keeping records of the above-mentioned activities;
• coordinating activities regarding introduction and acclimatization of valuable fish species in artificial waterbodies;

Review of fishery and aquaculture development potentials in the Republic of Moldova36
• taking measures to stimulate creation of fish farming facilities specialized in the reproduction and cultivation of fishes and other aquatic organisms.
With the participation of Aquaculture – Moldova and breeders of fish-breeding farms, the Department of Marketing Policies in the Zootechnical Sector of the Ministry of Agriculture and Food Industry is responsible for state regulations on pedigree affairs in livestock and fish farming. Its tasks include:
• design, development and implementation of breeding programmes;• improvement of breeding and productive qualities of a given breed;• utilization and conservation of gene pools;• establishment of certification procedures of breeding and other types of farms;• coordinating programmes of international cooperation in livestock and fish
farming;• conducting public testing of achieved breeding results;• issuing state certifications for breeding farms;• approving regulations on livestock breeding;• monitoring breeding records in accordance with requirements of relevant
normative documents.Responsibilities of Aquaculture – Moldova are:• determining strategy and prediction of aquaculture development;• carrying out scientifically sound technical and technology policies in aquaculture;• developing and implementing economic standards representing public and
state interests in this area, and regulating the relations between production and marketing of fishery products;
• managing the established order of the fish farming enterprise with full or partial state capital;
• developing international relationships in the field of aquaculture. The organization coordinating fish culture activities in the Republic of Moldova is
the Piscicola Association. Its objectives are to present and protect the industry’s interests in state bodies, as well as in judicial, national and international organizations.
The Ichthyologic Board is an advisory body under the Ministry of Environment whose duty is to coordinate work and scientific investigations in the field of protection, conservation and rational use of aquatic biological resources. The board includes representatives of various research institutions, higher education institutions, public administration authorities and associations of the sector.
6.2 education, tRaininG, extension and ReseaRchAt present, no higher educational institute offers the opportunity to specialize in the field of fisheries and aquaculture.
Students of the Faculty of Biology and Soil Sciences of Moldova State University, who specialize in biology or ecology, can prepare their licentiate and master thesis in the field of hydrobiology, ichthyology, fisheries and aquaculture. However, since 2005, when the education system of the Republic of Moldova was modified according to the Bologna Process (the length of licentiate studies was reduced to three years5), no special courses have been available in the university.
Students of the Faculty of Animal Husbandry and Biotechnologies of the Agrarian State University of Moldova can specialize in animal husbandry, biotechnology in animal reproduction and production and processing of animal products. Within these areas, they can also specialize in fish.
5 Before 2005, students at Moldova State University had to study five years and then prepare a licentiate theses.
37Governance and institutional frameworks of the fisheries and aquaculture sector
The Institute of Zoology of the Academy of Sciences of Moldova and the Moldova State University offer PhD studies in fisheries and aquaculture that are accredited as doctoral studies in specialty 03.00.18, hydrobiology and ichthyology. The Agrarian State University of Moldova is accredited to provide doctoral studies in specialities of zoo-engineering such as breeding and biotechnology for reproduction of farm animals (06.02.01) and zoo-technique and technology of livestock production (06.02.04). In fact, only for the speciality 03.00.18, hydrobiology and ichthyology, have doctoral and postdoctoral theses been officially presented and approved containing at least some elements that could be implemented in fisheries and aquaculture. The date on the most recent one is 2004.
Research studies on fishery and aquaculture are carried out mainly by two institutes: the Laboratory of Ichthyology and Aquaculture, and the Laboratory of Hydrobiology and Ecotoxicology within the Institute of Zoology of the Academy of Sciences of Moldova and the Chisinau Branch of the State Enterprise on Research and Production of Water Bio-resources Aquaculture – Moldova.
The first institute concentrates its activities in two main fields: the study of ecological and biological aspects of the functioning of fish populations and managing population abundance; and the elaboration of eco-industrial methods for reproduction, acclimation and re-acclimation of valuable, vulnerable, endangered and critically endangered aquatic species.
The second institute conducts its research in the field of creating new fish breeds, lines, hybrids and in developing new reproduction and breeding technologies, as well as the conservation of gene pools of valuable fish species (recently of spiny lobster).
Adult and community trainings in the form of lectures, seminars and workshops on fisheries management and aquaculture are carried out by staff of the Chisinau Branch of the State Enterprise on Research and Production of Water Bio-resources Aquaculture – Moldova and of the Institute of Zoology in the frame programme of the Piscicola Association.
Recently, the National Agency for Rural Development has also participated in the implementation of the above-mentioned training programmes. This agency is an NGO whose mission is the sustainable development of rural communities through the setting up and development of a professional network of information, consultancy and training services for agricultural producers and rural entrepreneurs.
6.3 statisticsThe Fisheries Service is responsible for collecting data on fisheries in natural waterbodies and presenting these in different reports to the Ministry of Environment.
In the aquaculture sector, Aquaculture – Moldova prepares statistics on table fish production, as well as stocking and breeding material.
The Piscicola Association prepares reports on all fish farming enterprises.Reporting on the production of commercial fish and fish-stocking material is the
responsibility of the Department of Marketing Policies in the Zootechnical Sector of the Ministry of Agriculture and Food Industry. It also monitors breeding records in the database of the Chisinau Branch of the State Enterprise on Research and Production of Water Bio-resources Aquaculture – Moldova and district inspections.
It is difficult to keep production records of small individual fish farms. On the basis of pond size (area and depth), natural feeds and fish-stocking material in fish farms, the Chisinau Branch of the State Enterprise on Research and Production of Water Bio-resources Aquaculture – Moldova estimates the volume of produced marketable fish.

Review of fishery and aquaculture development potentials in the Republic of Moldova38
6.4 institutionsThere are only a few fishery and aquaculture institutions of in the Republic of Moldova:
• the Chisinau Branch of the State Enterprise on Research and Production of Water Bio-resources Aquaculture – Moldova, which is the successor of the Biological Experimental Station for Fisheries (1945–1990) and the Fisheries Scientific Research Station (1990–2007);
• the Institute of Zoology of the Academy of Sciences of Moldova;• the Piscicola Association, which is subordinated to the Ministry of Agriculture
and Food Industry;• the Fishery Service, which is subordinated to the Ministry of Environment;• the Society of Hunters and Fishers of the Republic of Moldova;• Aquatir Ltd (Box 2).
bOx 2black caviar and sturgeon production in the Republic of moldova
Aquatir Ltd. is a new company representing a large-scale industrial complex on sturgeon breeding in the Transnistria region. The main activities of the project are producing, processing and trading black caviar and sturgeons. It produces 5 tonnes of black caviar per year and 80–100 tonnes of sturgeon meat. Cultivation of Russian sturgeon (Acipenser gueldenstadtii), beluga (Huso huso), sterlet (Acipenser ruthenus) and bester (Huso huso x Acipenser ruthenus) http://www.aquatir.md/?do=cat&category=variety - #takes place in a large recirculated system. The production technology was developed by experts of the Russian Federal State Unitary Enterprise SPC BIOS Russia, Astrakhan, the Russian Federation. The company has its own well-qualified personnel and a scientific laboratory for making water chemistry, physiological and biochemical analyses. Thus, it provides continuous monitoring of all important conditions and influencing factors of production.
There are also a few NGOs with the necessary potential to carry out projects in the fisheries and aquaculture sector:
• Society of Bioremediation of Aquatic Ecosystems and Anthropogenic Amphibians EURIBIONT;
• Association of Ecotoxicologists of Moldova ECOTOX;• Society of Hydrobiologists and Ichthyologists of Moldova Argonaut.
6.5 inteRnational coopeRation in fisheRies and aquacultuRe development and manaGementThe Republic of Moldova has signed a range of international conventions and agreements in the field of environment. These aim both directly and indirectly to protect natural fish resources and their habitats (below). As stated above, the Dniester and Prut Rivers are transboundary rivers, and the Government of the Republic of Moldova has signed some regional agreements (below) that support environment protection in the region and the management of the waters and biological resources of the Dniester and Prut Rivers.
International conventions and agreementsThe international conventions and agreements signed by the Government of the Republic of Moldova on environment and fisheries are:
• Convention on Environmental Impact Assessment in a Transboundary Context (Espoo, 1991). Joined by Parliament Decision No. 1546-XII of 23 June 1993.
39Governance and institutional frameworks of the fisheries and aquaculture sector
• Convention on Access to Information, Public Participation in Decision-making and Access to Justice in Environmental Matters (Aarhus, 1998). Ratified by Parliament Decision No. 346-XIV of 7 April 1999.
• Convention on the Protection and Use of Transboundary Watercourses and International Lakes (Helsinki, 1992). Joined by Parliament Decision No. 1546-XII of 23 June 1993.
• Protocol on Water and Health to the Convention on the Protection and Use of Transboundary Watercourses and International Lakes (London, 1999). Ratified by Law No. 207-XVI of 29 July 2005.
• Convention on Biological Diversity (Rio de Janeiro, 1992). Ratified by Parliament Decision No. 1546-XII of 23 June 1993.
• Cartagena Protocol on Biosafety to the Convention on Biological Diversity (Montreal, 2000). Ratified by Law No. 1381-XV of 11 October 2002.
• Convention on Wetlands of International Importance (Ramsar, 1971). Ratified by Parliament Decision No. 504-XIV of 14 July 1999.
• Convention on International Trade in Endangered Species of Wild Fauna and Flora (CITES), (Washington, 1973). Joined by Law No. 1246-XIV of 28 September 2000.
• Convention on the Conservation of European Wildlife and Natural Habitats (Berne, 1979). Joined by Parliament Decision No. 1546-XII of 23 June 1993.
• Convention on the Conservation of Migratory Species of Wild Animals (CMS) (Bonn, 1979) Joined by Law No. 1244-XIV of 28 September 2000.
• Agreement on the Conservation of African-Eurasian Migratory Waterbirds (the Hague, 1995). Joined by Law No. 1244-XIV of 28 September 2000.
• Agreement on the Conservation of Bats in Europe (London, 1991). Joined by Law No. 1244-XIV of 28 September 2000.
• European Landscape Convention (Florence, 2000). Ratified by Law No. 536-XV of 12 October 2001.
• Convention on Cooperation for the Protection and Sustainable Use of the Danube River (Sofia, 1994). Ratified by Parliament Decision No. 323-XIV of 17 March 1999.
• Convention on the Transboundary Effects of Industrial Accidents (Helsinki, 1992). Joined by Parliament Decision No. 1546-XII of 23 June 1993.
• United Nations Framework Convention on Climate Change (CCNUSC) (New York, 1992). Ratified by Parliament Decision No. 404-XIII of 16 March 1995.
• Protocol to the United Nations Framework Convention on Climate Change (Kyoto, 1997). Joined by Law No. 29-XV of 13 February 2003.
• Convention for the Protection of the Ozone Layer (Vienna, 1985). Joined by Parliament Decision No. 966-XIII of 24 July 1996.
• Protocol on Substances that Deplete the Ozone Layer (Montreal, 1987). Joined by Parliament Decision No. 966-XIII of 24 July 1996.
• United Nations Convention to Combat Desertification in those Countries Experiencing Serious Drought and/or Desertification, Particularly in Africa (Paris, 1994). Joined by Parliament Decision No. 257-XIV of 24 December 1998.
• Convention on the Control of Transboundary Movements of Hazardous Wastes and Their Disposal (Basel, 1989). Joined by Parliament Decision No. 1599-XIII of 10 March 1998.
• Convention on Long-range Transboundary Air Pollution (Geneva, 1979). Joined by Parliament Decision No. 399-X III of 16 March 1995.
• Convention on the Prior Informed Consent Procedure for Certain Hazardous

Review of fishery and aquaculture development potentials in the Republic of Moldova40
Chemicals and Pesticides in International Trade (Rotterdam, 1998). Joined by Law No. 389-XV of 25 November 2004.
• Convention on Persistent Organic Pollutants (Stockholm, 2001). Ratified by Law No. 40-XV of 19 February 2004.
• Protocol on Pollutant Release and Transfer Registers (Kiev, 2003) to the Convention on Access to Information, Public Participation in Decision-making and Access to Justice in Environmental Matters. Signed on 21 May 2003.
• Protocol on Civil Liability for Damage and Compensation for Damage Caused by Transboundary Effects of Industrial Accidents on Transboundary Waters (Kiev, 2003) to the Convention on the Transboundary Effects of Industrial Accidents and to the Convention on the Protection and Use of Transboundary Watercourses and International lakes. Signed on 21 May 2003.
• Protocol on Strategic Environmental Assessment (Kiev, 2003) to the Convention on Environmental Impact Assessment in a Transboundary Context. Signed on 21 May 2003.
• Protocol on Persistent Organic Pollutants (Aarhus, 1998) to the Convention on Long-range Transboundary Air Pollution. Ratified by Law No. 1018-XV of 25 April 2002.
• Protocol on Heavy Metals (Aarhus, 1998) to the Convention on Long-range Transboundary Air Pollution. Ratified by Law No. 1018-XV of 25 April 2002.
• Protocol to Abate Acidification, Eutrophication and Ground-level Ozone (Gothenburg, 1999) to the Convention on Long-range Transboundary Air Pollution. Signed on 23 May 2000.
Regional agreementsThe regional agreements relating to fisheries and aquaculture are:
• Agreement between the Government of the Republic of Moldova and the Government of Romania concerning Cooperation on the Protection and Sustainable Use of Prut River and Danube River Waters (Chisinau, 2010).
• Agreement between the Government of Romania and the Government of the Republic of Moldova with Regard to the Cooperation in the Area of Protection of Fish Resources and the Regulating of Fishing in the Prut River and Stanca-Costesti Artificial Lake (Stanca-Costesti, 2003).
• Agreement between the Ministry of Waters, Forests and Environmental Protection of Romania, the Ministry of Environment and Territorial Development of the Republic of Moldova, and the Ministry of Environment and Natural Resources of Ukraine Concerning Cooperation in the Zone of the Danube Delta and Lower River Prut Nature-Protected Areas (Bucharest, 2000).
• Agreement between the Ministry of Waters, Forests and Environmental Protection of Romania and the Department of Environmental Protection of the Republic of Moldova Concerning Cooperation in Environmental Protection and Sustainable Use of Natural Resources (1997).
• Memorandum of Understanding on Cooperation in the Field of Sustainable Use and Protection of Dniester River Basin between the State Department of Environmental Protection and Natural Resources of the Republic of Moldova and the Ministry of Environmental Protection and Nuclear Safety of Ukraine (1997).
• Memorandum of Understanding on Cooperation at River Prut and Danube River between the National Administration Apele Romane and Apele Moldovei (1995).
• Agreement between the Government of the Republic of Moldova and the Government of Ukraine on Joint Use and Protection of Transboundary Waters (1994).
41Governance and institutional frameworks of the fisheries and aquaculture sector
• Protocol between the Government of the Republic of Moldova and the Government of Ukraine on cooperation in the field of environmental protection (1993)
• Regulation on Operation and Maintenance of the Hydrotechnic Knot Stanca-Costesti on the Prut River (1985).
Cooperation within the Network of Aquaculture Centres in Central-Eastern EuropeThe Network of Aquaculture Centres in Central-Eastern Europe (NACEE) currently consists of 38 institutions from 15 countries. Two Moldovan research institutions, the Institute of Zoology of the Academy of Sciences of Moldova and the Chisinau Branch of the State Enterprise on Research and Production of Water Bio-resources Aquaculture – Moldova, are members of the NACEE. The network’s mission is to facilitate the research and development sphere in Central-Eastern Europe in order to become an integral part of the European Research Area. Moldovan NACEE members continuously share information in the field by exchanging scientists in the frame of bilateral visiting programmes and joint conferences and meetings. The 2011 annual meeting of the Board of Directors of the NACEE was hosted by Moldovan institutions.
Cooperation with the European Union (Member Organization)The Republic of Moldova has considerable possibilities to cooperate with other countries in economic, social and environmental fields. It also has the potential to develop its fishery and aquaculture sector in the frame of European Neighbourhood and Partnership Instrument (ENPI) of the European Union (Member Organization). In the budget period 2007–2013, the Republic of Moldova is eligible for the following transnational and cross-border programmes of the European Union (Member Organization):
• Joint Operational Programme Romania–Ukraine–Republic of Moldova (www.ro-ua-md.net);
• South East Europe Transnational Cooperation Programme (www.southeast-europe.net);
• Black Sea Basin Joint Operational Programme (www.blacksea-cbc.net).
International projectsIn the last decade, international scientific cooperation in ichthyology, fishery and aquaculture has been undertaken through the Institute of Zoology of the Academy of Sciences of Moldova within the framework of some successful research projects:
• INCO-COPERNICUS “Quality monitoring and quality assurance of freshwater and seawater aquaculture fish” – joint project with teams from Greece, Hungary and the United Kingdom of Great Britain and Northern Ireland, 1999–2002;
• CRDF/MRDA6 “Assessment of current status of biodiversity and water quality in Dniester river”, 2001–03;
• CRDF/MRDA “Accumulation and effect of trace elements on fish growth and development”, 2005–07;
• CRDF/MRDA “Elaboration of growth technology of Kefal pelingas”, 2005–06;• Bilateral Moldovan–Russian research project “Regularities of the structure and
dynamics of intraspecific variability in populations of cyprinids (on the example of the bream Abramis brama) in the Republic of Moldova and the European part of Russia”, 2008–09.
6 The CRDF/MRDA projects were carried out together with researchers from the United States of America.

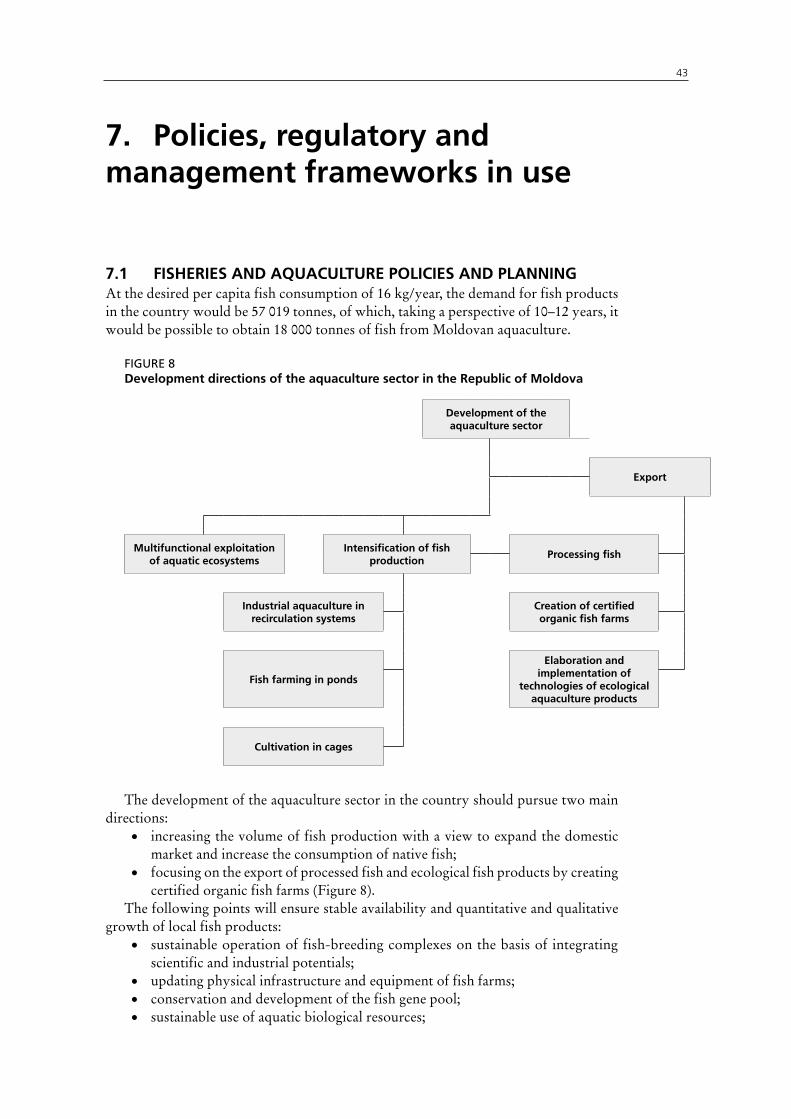
43
7. policies, regulatory and management frameworks in use
7.1 fisheRies and aquacultuRe policies and planninGAt the desired per capita fish consumption of 16 kg/year, the demand for fish products in the country would be 57 019 tonnes, of which, taking a perspective of 10–12 years, it would be possible to obtain 18 000 tonnes of fish from Moldovan aquaculture.
FiGURE 8development directions of the aquaculture sector in the Republic of moldova
development of the aquaculture sector
export
multifunctional exploitation of aquatic ecosystems
intensification of fish production
processing fish
industrial aquaculture in recirculation systems
creation of certified organic fish farms
fish farming in ponds
elaboration and implementation of
technologies of ecological aquaculture products
cultivation in cages
The development of the aquaculture sector in the country should pursue two main directions:
• increasing the volume of fish production with a view to expand the domestic market and increase the consumption of native fish;
• focusing on the export of processed fish and ecological fish products by creating certified organic fish farms (Figure 8).
The following points will ensure stable availability and quantitative and qualitative growth of local fish products:
• sustainable operation of fish-breeding complexes on the basis of integrating scientific and industrial potentials;
• updating physical infrastructure and equipment of fish farms;• conservation and development of the fish gene pool;• sustainable use of aquatic biological resources;
Review of fishery and aquaculture development potentials in the Republic of Moldova44
• elaboration and introduction of advanced modern technologies;• development of the processing industry through the adaptation of fish processing
technologies.
7.2 fisheRies and aquacultuRe leGal and ReGulatoRy fRamewoRK and manaGementThe fishery and aquaculture sector is regulated in the Republic of Moldova by normative acts as detailed below.
The Law on Fisheries Fund, Fisheries and Aquaculture No. 149 of 8 June 20067 It regulates: procedures and conditions of the establishment and protection of fish stocks; reproduction, cultivation and harvest of aquatic organisms; and amelioration of fishery waterbodies. It defines principles of public authorities who have the right to manage aquatic biological resources. According to the law, the competences of the Ministry of Environment, Ministry of Agriculture and Food Industry, Academy of Sciences of Moldova and other research institutions local public administration bodies are as summarized in Chapter 6.
Water Code No. 1532 of 22 June 19938
It regulates responsibilities of legal entities and individuals who are water users of fishery waterbodies to:
• carry out amelioration and take technical measures that ensure the improvement of the status of waterbodies, conditions of fish stocks, reproduction and maintenance of waterbodies under proper sanitary conditions;
• implement measures for the protection and reproduction of fish stocks;• keep a state inventory of water resources.
Law on Foodstuffs No. 78-XV of 18 March 20049
This law establishes:• a legal framework for the production, processing and distribution of foodstuffs;• basic conditions governing the circuit of these products, including safety standards
to protect human health and consumers’ interests in relation to foodstuffs.It also promotes fair practices in the field of food trade.
7 Published: 11 August 2006 in the Official Monitor of the Republic of Moldova No. 126-130, article No. 597.8 Published: 1 October 1993 in the Parliament Monitor No. 10, article No. 287.9 Published: 28 March 2004 in the Official Monitor of the Republic of Moldova No. 83-87, article No. 431.
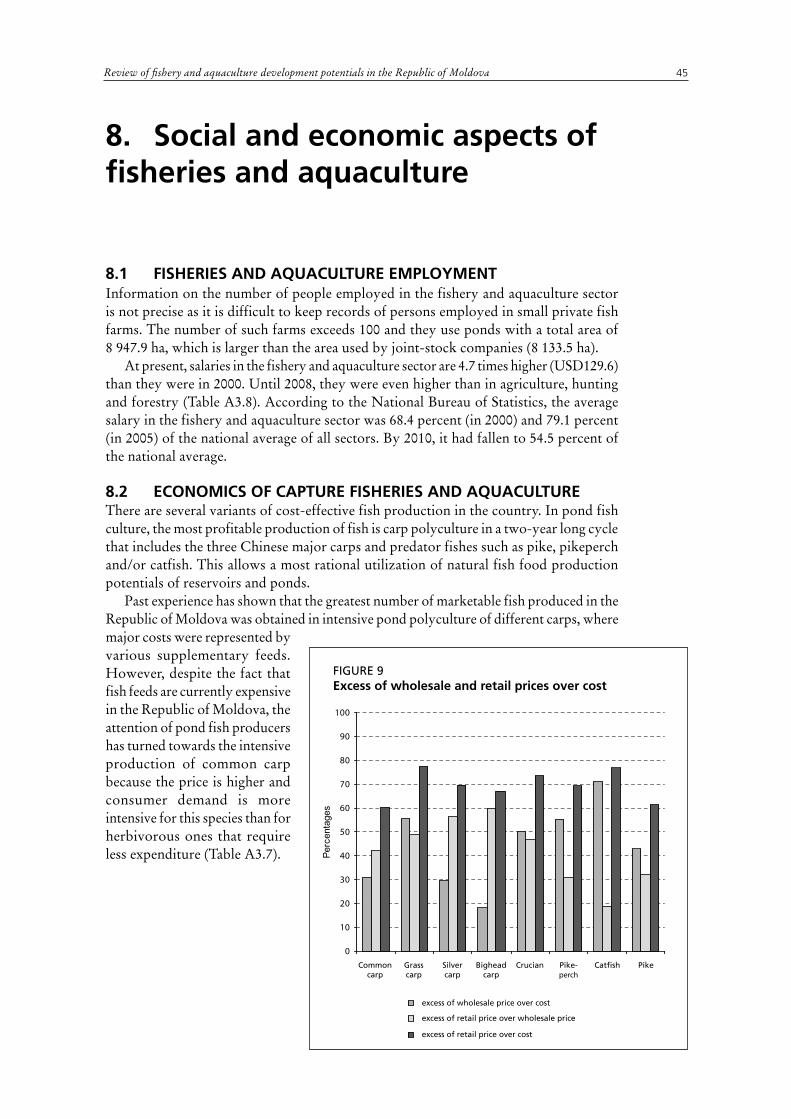
Review of fishery and aquaculture development potentials in the Republic of Moldova 45
8. social and economic aspects of fisheries and aquaculture
8.1 fisheRies and aquacultuRe employment Information on the number of people employed in the fishery and aquaculture sector is not precise as it is difficult to keep records of persons employed in small private fish farms. The number of such farms exceeds 100 and they use ponds with a total area of 8 947.9 ha, which is larger than the area used by joint-stock companies (8 133.5 ha).
At present, salaries in the fishery and aquaculture sector are 4.7 times higher (USD129.6) than they were in 2000. Until 2008, they were even higher than in agriculture, hunting and forestry (Table A3.8). According to the National Bureau of Statistics, the average salary in the fishery and aquaculture sector was 68.4 percent (in 2000) and 79.1 percent (in 2005) of the national average of all sectors. By 2010, it had fallen to 54.5 percent of the national average.
8.2 economics of captuRe fisheRies and aquacultuRe There are several variants of cost-effective fish production in the country. In pond fish culture, the most profitable production of fish is carp polyculture in a two-year long cycle that includes the three Chinese major carps and predator fishes such as pike, pikeperch and/or catfish. This allows a most rational utilization of natural fish food production potentials of reservoirs and ponds.
Past experience has shown that the greatest number of marketable fish produced in the Republic of Moldova was obtained in intensive pond polyculture of different carps, where major costs were represented by various supplementary feeds. However, despite the fact that fish feeds are currently expensive in the Republic of Moldova, the attention of pond fish producers has turned towards the intensive production of common carp because the price is higher and consumer demand is more intensive for this species than for herbivorous ones that require less expenditure (Table A3.7).
FiGURE 9excess of wholesale and retail prices over cost
0
10
20
30
40
50
60
70
80
90
100
Perc
enta
ges
Commoncarp
Grasscarp
Silvercarp
Bigheadcarp
Crucian Pike-perch
Catfish Pike
excess of wholesale price over cost
excess of retail price over wholesale price
excess of retail price over cost
Review of fishery and aquaculture development potentials in the Republic of Moldova46
Fish-breeding enterprises with a substantial volume of production but at a considerable distance from large cities often sell fish on the spot at wholesale prices. The excess of wholesale prices over cost (profit enterprises) in semi-intensive cultivation methods varies from 31 percent (on carp) to 71.2 percent (on catfish). A high income is also noted for grass carp even if it is lower than that of common carp and pikeperch in intensive ponds (Figure 9). There is a demand for highly profitable species of fish although in terms of total production they represent only a small amount.
It is important to emphasize that the difference between wholesale and retail prices is significant and expands from 19.1 percent (catfish) to 59.9 percent (bighead carp). On average, the excess margin on sold fish is about 42.1 percent. Producers receive the same percentage of income for producing two- or three-year-old table fish (44.3 percent). The excess of market value over cost ranges from 60.2 percent (common carp) to 77.4 percent (grass carp).
To increase consumption, it would be necessary to improve market mechanisms for selling fish and fish products. As one of the first steps, the distance between producers and consumers should be reduced by reducing the intermediaries. A reduced number of traders would lead to lower prices and, hence, to increased consumption of fish and fish products.
8.3 cRedit and investment in fisheRies and aquacultuRe According to the law on state budget, the fund of the Ministry of Agriculture and Food Industry of Moldova allocated for subsidizing agricultural producers is used in three different areas:
• To promote loans of commercial banks to the fish farmers. These consist of credits of up to one year given as working capital for feeds, fertilizers, etc. and credits of up to 7 years given for investment in fixed assets.
• To support covering insurance risks in agricultural production. In the case of a valid risk and loss insurance of a fish farm, insurance companies recover 20 percent, while the State allocates the remaining 80 percent of due payments to cover the losses of the insured products such as fish seed (larvae, fry and yearlings) and table fish. The intervention of the State is done on the basis of the decision of a special commission.
• To purchase breeding animals and ensure the preservation of the gene pools. This is to create and maintain genetic pools of valuable high-performing brooders of farmed animals, including fish. It is allocated through the Ministry of Agriculture and Food Industry on the basis of applications submitted by fish farms. The decisions of the special commission are made according to funding regulations.
8.4 Role of fisheRies and aquacultuRe in food secuRity and poveRty alleviation The contribution of fishing and fish culture to the gross domestic product of the Republic of Moldova is extremely low. Between 2001 and 2003, it was only 0.1 percent, and even less between 2004 and 2010. The root of the problem is the low economic efficiency of many fishing and fish culture enterprises: 49 enterprises (out of 80) ended 2009 with financial losses (Figure 10 and Table 17). However, Figure 11 shows that all micro fishing and fish culture enterprises successfully managed to increase their activities between 2005 and 2009.
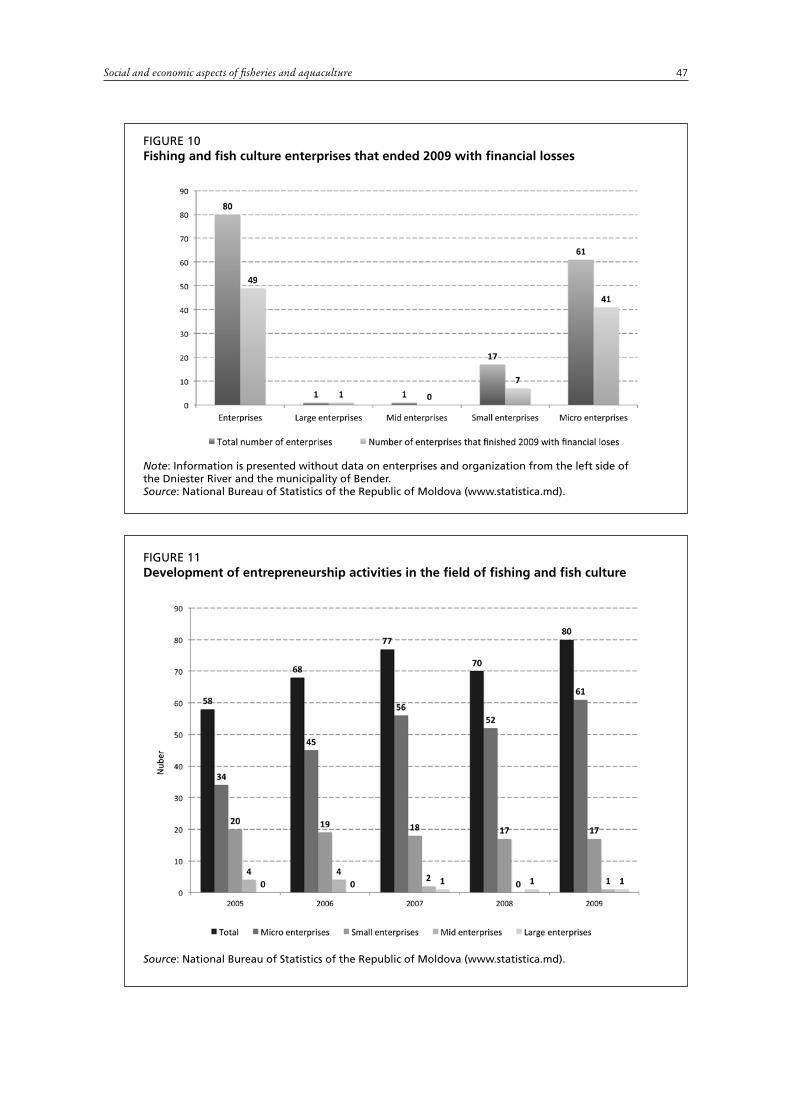
47Social and economic aspects of fisheries and aquaculture
FiGURE 10fishing and fish culture enterprises that ended 2009 with financial losses
Note: information is presented without data on enterprises and organization from the left side of the dniester River and the municipality of bender.Source: National bureau of statistics of the Republic of Moldova (www.statistica.md).
FiGURE 11development of entrepreneurship activities in the field of fishing and fish culture
Source: National bureau of statistics of the Republic of Moldova (www.statistica.md).

Review of fishery and aquaculture development potentials in the Republic of Moldova48
6.45
1.7
13
4.92 Large enterprises
Mid enterprises
Small enterprises
Micro enterprises
The number of micro enterprises is the higher but their total revenue from sales is much lower than that of small enterprises (Figure 12).
FiGURE 12Revenue from sales of fishing and fish culture enterprises in 2009
Note: values are in Mdl million.Source: National bureau of statistics of the Republic of Moldova (www.statistica.md).
tAblE 17main profitability indicators of economic units and their activities
economic activitiessales profitability (%) economic profitability (%)
2005 2006 2007 2008 2009 2005 2006 2007 2008 2009
Agriculture, hunting and forestry
16.0 16.2 16.8 17.9 19.3 5.9 5.8 10.4 11.2 2.5
Fishing and fish culture 25.8 21.2 21.7 26.1 21.8 –0.7 –5.7 – –2.3 –2.8
Source: National bureau of statistics of the Republic of Moldova (2010).
tAblE 18average price of fresh fish on local market in the Republic of moldova
1997 1998 1999 2000 2001 2002 2003 2004 2005 2006 2010
Mdl/kg 5.0 5.5 6.6 8. 5 12.1 124 15.2 17.4 20.8 24.2 45*
* Calculated by the authors.
In 2010, prices of fresh fish ranged between MDL25–85/kg depending on species (Table 18). Fresh red fish was MDL233–450/kg.
The data presented show that there is a strong need for state support in the fishery and aquaculture sector. Development and modernization of the sector will bring considerable benefits to all participants in the process:
• population – growing employment opportunities and a continuous increase of wages;
• entrepreneurs – a real increase in profits and enhancement of competitiveness in foreign markets;
• State – growing local and state revenues, which ensure better chances for solving social problems.
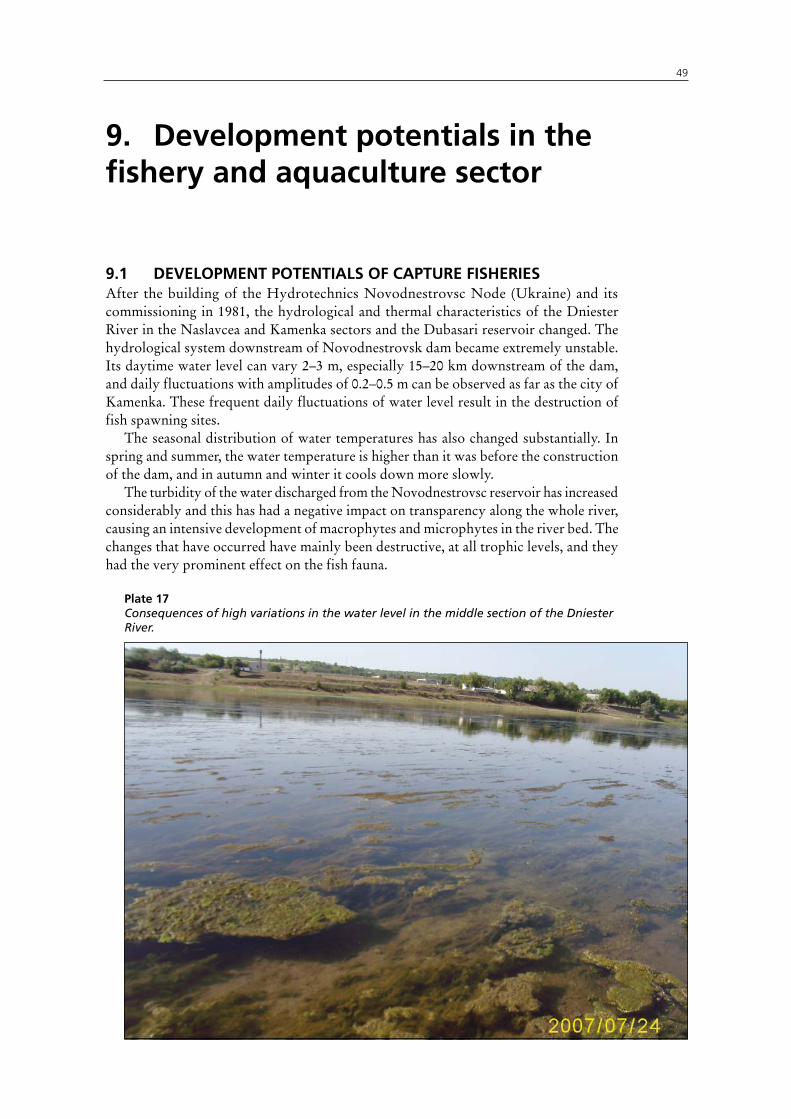
49
9. development potentials in the fishery and aquaculture sector
9.1 development potentials of captuRe fisheRies After the building of the Hydrotechnics Novodnestrovsc Node (Ukraine) and its commissioning in 1981, the hydrological and thermal characteristics of the Dniester River in the Naslavcea and Kamenka sectors and the Dubasari reservoir changed. The hydrological system downstream of Novodnestrovsk dam became extremely unstable. Its daytime water level can vary 2–3 m, especially 15–20 km downstream of the dam, and daily fluctuations with amplitudes of 0.2–0.5 m can be observed as far as the city of Kamenka. These frequent daily fluctuations of water level result in the destruction of fish spawning sites.
The seasonal distribution of water temperatures has also changed substantially. In spring and summer, the water temperature is higher than it was before the construction of the dam, and in autumn and winter it cools down more slowly.
The turbidity of the water discharged from the Novodnestrovsc reservoir has increased considerably and this has had a negative impact on transparency along the whole river, causing an intensive development of macrophytes and microphytes in the river bed. The changes that have occurred have mainly been destructive, at all trophic levels, and they had the very prominent effect on the fish fauna.
plate 17Consequences of high variations in the water level in the middle section of the Dniester River.

Review of fishery and aquaculture development potentials in the Republic of Moldova50
In the middle sector of Dniester River (Plate 17), more than 30 species of fish used to reproduce annually in the period 1959–1983 and 180–200 million fry, including advanced fry and yearlings, used to migrate downstream to the Dubasari reservoir. Fish resources in this section are currently reduced by 94 percent, and the migration of juveniles from spawning sites has decreased by 84 percent. A continuous, undesired replacement of valuable species (sterlet, common barbel, pikeperch, common bream, carp, Rutilus heckeli) with other less-valuable species can be observed. These species (e.g. common dace, European chub, common roach, common rudd and common nase) are able to adapt better to changed thermal conditions.
The existence of potentials for development of fishery in the Republic of Moldova, especially in reservoirs, is shown by the data presented in Table A3.1 in Annex 3. The fish capture in reservoirs ranged between 78 and 177 tonnes/year in the period 1991–95. After this time, in the period 1996–2000, catches suddenly decreased to 14 tonnes, most probably because of commissioning two additional turbines at the Naslavcea node. The capacity of this fishery has still not been restored. In 2008–2010, the fish capture ranged from 16 to 27 tonnes/year. This is a huge fall as before 1986 the catch in the Dubasari reservoir exceeded 200 tonnes/year. Moreover, it decline is in spite of the multiannual research work carried out by the Institute of Zoology of Academy of Sciences of Moldova that has demonstrated the existence of sufficient natural fish food in the form of phytoplankton, zooplankton and zoobenthos in the reservoirs of the Republic of Moldova.
State organizations continuously make efforts to improve the management of fisheries resources by stocking waterbodies of important fishing sites. Thus, the Fishery Service has a special account designed to cover damage caused to aquatic biological resources through annual restocking of natural waterbodies with valuable fish species such as bighead carp, silver carp, grass carp and common carp. Other species used for this purpose are pikeperch, silver crucian carp, breams and common roach (Table 19).
tAblE 19stocking of the costesti-stanca reservoir
year
fry (1 000) yearling (1 000)two–summer–old fish
(1 000)
pike–perch
commonbream
common carp
chinese major carps
common carp
silver crucian
carp
common roach
common carp
chinese major carps
1984 600 400 – 239 328 348 – – –
1985 600 400 – – 300 370 – – –
1986 600 400 – 250 250 250 – – –
1987 600 400 – 250 250 250 – – –
1988 600 400 – 250 250 250 – – –
1989 1 000 – – 340 340 300 – – –
1990 2 000 1 500 2 000 50 30 170 – 700 63
1991 – – – – – – – 120 180
1992 60 000 – – 7 – – – – –
1993 20 000 – 10 000 – – – – 50 120
1994 – – – 350 – – – – –
1999 3 000 – – 5.4 1.0 6.0 – – –
2004 – – – – – – 100 6.2 31.3
2005 – – – 180 50 – – – –
2006 – – – 35.5 54.7 55.8 50.1 – 12.5
2009 – – – – – – – 18.5 88.9

51Development potentials in the fishery and aquaculture sector
Figure 13 shows that the quantity of fish used for stocking in the Dubasari reservoir decreased after 2007.
FiGURE 13stocking of dubasari reservoir, 1998–2010
In order to increase the effect of stocking, it is necessary to control the negative impact of water birds as they are able to consume a large amount of stocked fish in a short period (Plate 18).
plate 18Cormorants feeding in the Costesti-Stanca reservoir immediately after fish release.

Review of fishery and aquaculture development potentials in the Republic of Moldova52
It can be concluded that, with appropriate measurements and primary regulation of the hydrologic regime of the Dniester River within the framework of bilateral agreements between the Republic of Moldova and Ukraine, as well as the restoration of fish stocking in the necessary amounts, the production of capture fisheries of natural waters and large water reservoirs could be increased considerably.
9.2 development potentials of aquacultuReFluctuations in fish production results in the past and present indicate that a well-prepared, researched and coordinated plan for the optimal utilization of natural, social and economic resources could consolidate fish production on a higher level in the country.
In addition to the better utilization of resources, the introduction of new fish species in culture-based fisheries and pond polyculture is also a feasible option. Currently, work on the introduction of grey mullet (or kefal pelingas [Mugil so-iuy Basilewsky]) is being carried out in the Republic of Moldova (Plate 19). In 2004, researchers of the Institute of Zoology together with fish farmers from Falesti (in the north of the country) brought about 1 000 mullet fingerlings with an average body weight of 5.3 g from Ukraine. By November 2004, their average weight had reached 80 g, and after two years individuals had reached about 2 kg.
Grey mullet is of interest as a new species in the Republic of Moldova because it can be bred in polyculture with valuable species (Cyprinus carpio, Aristichthys nobilis, Hypophtalmichtys molitrix and Ctenopharingodon idella). Yearlings feed on detritus and zoobenthos; hence, they find proper conditions for their growth in fish ponds and also in water reservoirs.
plate 19The market size of kefal pelingas (Mugil so-iuy Basilewsky) varies between 700 and 800 g.
Researchers of the Institute of Zoology have patented a procedure for artificial reproduction of grey mullet as well as for a procedure of growing the same species in polyculture with common carp and Chinese major carps.
53
10. conclusions and recommendations
Fish farming in the Republic of Moldova has become an efficient, employment- and income-generating activity to reduce poverty in rural areas. Renting and using small lakes and ponds for growing fish creates jobs, brings income to rural areas and increases the sales of fresh fish in villages. However, farmers often lack the necessary technical knowledge and, therefore, they often suffer economic losses.
At present, there is no full national cadastre, a documented and registered list of lakes and ponds that would include not only the numbers and sizes but also data about their ecological status. The unsatisfactory ecological state of waterbodies is a main cause of the low profitability of many fish farms. This factor is also responsible for increased costs and, hence, the high price of fresh fish.
A set of measures needs to be taken in order to protect and conserve the environment and to use existing recourses for fishery purposes in a sustainable way. These measures are:
• studying fish fauna (qualitative and quantitative structure of fish populations, location of breeding and wintering sites, etc.);
• carrying out complex monitoring of aquatic ecosystems, which would also include monitoring of water quality and state of aquatic organisms in general and those of the natural fish food (nutrient sources) of fish in particular;
• developing and implementing projects to restore and use fishery resources in a sustainable way;
• raising awareness about the importance of protecting physical and biological aquatic resources and encouraging the parties concerned to make responsible decisions about them.
Taking into account its transboundary status, quality improvement of the state of the Dniester River and its fishery resources requires specific actions:
• working out a model for optimal water release from the Novodnestrovsk hydrocomplex in order to meet needs of the ecosystems in the Middle and Lower Dniester River.
• developing joint Moldovan–Ukrainian programmes in the field of fishery resources of the Dniester River;
• exchanging information regarding ichthyological observations;• elaborating programmes for restoring populations of valuable and threatened
fish species and other aquatic biological resources;• strengthening the control and increasing the activity of state bodies responsible
for the protection of fish resources in the fight against poaching and other illegal actions affecting fishery resources of the Dniester River basin.
In order to improve sustainable fish production, it is necessary to monitor the ecological state of lakes, reservoirs and ponds.
Concerning increasing the efficiency of fish enterprises, state support should be offered through developing modern entrepreneurial, financial and investment frameworks according to the principles of the market economy.
Government could also help farmers with efficient extension services, which should include information and advisory systems through which the knowledge, skills and modern management abilities of farmers could be increased. The following subjects should be integral parts of farmer training:
Review of fishery and aquaculture development potentials in the Republic of Moldova54
• sustainable use of aquatic resources during the entire process of fish production in lakes, reservoirs and ponds;
• implementation of new methods for fish breeding and fish seed production;• implementation of new table-fish production methods in ponds;• methods of water quality assessment including on-site (field) analysis methods;• physical and financial planning and evaluation of fish production;• fish storage and selling;• ways to receive grants and contracts for developing the aquaculture sector.
A sustainable development of the fishery and aquaculture sector can be achieved by:• creating an inventory of all waterbodies regardless of the ownership;• using unenclosed water areas of up to 10 000 ha for fish farming;• elaborating guidelines for the biological, technical and economic feasibility of
fisheries and fish farming;• developing methods and schemes to stabilize and improve the economic and
financial situation of enterprises of the sector;• intensifying fish farming on the basis of implementing new profitable technologies;• introduction and acclimatizing of valuable new fish species and breeds;• developing and implementing breeding programmes, improving breeding and
productive qualities of breeds and using gene pool conservation;• establishing fish feed production;• developing the fish processing industry;• creating/improving and correctly executing market development programmes
for fish products;• creating certified organic fish farms, and elaborating and implementing
technologies for ecologically sound fish products;• developing schemes to improve fiscal and credit policy in the fishery and
aquaculture sector;• organizing training and retraining in the industry;• developing both internal and external relations and attracting national and
international investors to develop the industry.
55
References
Central Intelligence Agency (CIA). 2010. The World Factbook. In: CIA [online]. [Cited 4 April 2013]. www.cia.gov/library/publications/download/download-2010/
FAO. 2011. AQUASTAT, 2010. In: FAO Fisheries and Aquaculture Department [online]. Rome. [Cited 4 April 2013]. www.fao.org/nr/water/aquastat/main/index.stm
FAO/Network of Aquaculture Centres in Central-Eastern Europe (NACEE). 2007. Regional review on aquaculture development. 5. Central and Eastern European region – 2005. FAO Fisheries Circular. No. 1017/5. FAO, Rome. 2007. 84 pp. (also available at ftp://ftp.fao.org/docrep/fao/010/a1356e/a1356e00.pdf)
National Bureau of Statistics of the Republic of Moldova. 2010. Statistical Yearbook of the Republic of Moldova, 2010. Chisinau.
Organization for Security and Co-operation in Europe / United Nations Economic Commission for Europe (OSCE/UNECE). 2005. Transboundary diagnostic study for the Dniester River Basin [online]. OSCE/UNECE Project: Transboundary Co-operation and Sustainable Management of the Dniester River. [Cited 4 April 2013]. www.osce.org/eea/38320
Zubcov E.I. Current ecological state of the Dniester River. Current fundamental problems of hydrochemistry and monitoring of quality of surface waters of Russia. Proceedings of the scientific-practical conference with international participation, Azov, June 8-June 10, 2009, pp.96-99 (Russian)
Zubcov E., Bagrin N., Zubcov N., Bogonin Z., Munjiu O., Borodin N., Biletchi L., Lebedenco L. Hydroecological researches of the Dniester within Moldova, 2008-2009. Transboundary river basin management and international cooperation for healthy Dniester River. Proceedings of the International Conference, Odessa, September 30-October 1, 2009, pp.77-82 (Russian)


57
annex 1
GeneRal data on the Republic of moldova
tab
le 1
.1: t
ota
l, l
an
d a
nd
wa
teR
aR
ea o
f m
old
ov
a
co
un
try
tota
l are
a (k
m2)
(1)
tota
l lan
d
area
(km
2)
wat
er a
rea
(1)
cu
ltiv
ated
are
afi
sh p
on
ds
(2)
tota
l are
a (k
m2)
tota
l are
a (h
a)a
s %
of
tota
l are
ah
a%
are
a (h
a)a
s %
of
tota
l are
a
mo
ldo
va
33
851
32
891
960
9
6 00
0 2
,8
2 1
23 0
00
64,
5 2
7 00
0 0
,798
mo
ldo
va (
offi
cial
sta
tist
ics)
3
3 84
6 3
2 97
8 8
68
86
800
2,6
2
319
200
6
8,5
28
600
0,8
45
Min
imu
m o
f C
EE c
ou
ntr
ies
Mo
nte
neg
ro
Mo
nte
neg
ro
ser
bia
s
erb
ia
ser
bia
M
on
ten
egro
s
love
nia
s
love
nia
b
elar
us
13
812
13
452
-
-
-
190
000
1
0,1
316
0
,002
Ave
rag
e o
f C
EE c
ou
ntr
ies
114
569
1
11 1
11
3 4
59
345
853
2
,6
4 5
60 4
74
31,
7 1
8 24
5 0
,173
Max
imu
m o
f C
EE c
ou
ntr
ies
Ukr
ain
e U
krai
ne
Ukr
ain
e U
krai
ne
Est
on
ia
Ukr
ain
e M
old
ova
R
om
ania
M
old
ova
603
550
5
79 3
30
24
220
2 4
22 0
00
6,3
3
3 33
3 00
0 6
4,5
84
500
0,7
98
Ob
serv
atio
n:
1/ W
ater
to
tal a
rea
= la
nd
s o
f w
ater
fu
nd
s2/
Fis
h p
on
d a
reas
wer
e es
tim
ated
.So
urc
e:N
atio
nal
Bu
reau
of
Stat
isti
cs o
f th
e R
epu
blic
of
Mo
ldo
va a
nd
au
tho
rs c
alcu
lati
on
C
IA W
orl
d F
act
Bo
ok,
201
0 an
d F
AO
/Net
wo
rk o
f A
qu
acu
ltu
re C
entr
es in
Cen
tral
-Eas
tern
Eu
rop
e (N
AC
EE),
200
5
tab
le 1
.2: p
opu
lati
on
of
mo
ldo
va
co
un
try
to
tal p
op
ula
tio
n
1988
-199
219
93-1
997
1998
-200
220
03-2
007
2008
-201
0pe
rso
ns
per
km
2 in
200
3-20
07pe
rso
ns
per
km
2 in
200
8-20
10
mo
ldo
va (
fao
so
urc
e) 4
379
000
4
266
000
3
961
000
3
667
000
1
08
mo
ldo
va (
offi
cial
sta
tist
ics)
4 3
43 8
15
4 3
38 2
26
3 6
42 5
08
3 5
99 4
46
3 5
67 9
70
106
1
05
Min
imu
m o
f C
EE c
ou
ntr
ies
Est
on
ia
Est
on
ia
Est
on
ia
Mo
nte
neg
ro
Est
on
ia
1 5
27 0
00
1 4
02 0
00
1 3
57 0
00
621
000
3
0
Ave
rag
e o
f C
EE c
ou
ntr
ies
10
967
938
10
729
294
10
489
647
9 7
58 2
63
84
Max
imu
m o
f C
EE c
ou
ntr
ies
Ukr
ain
e U
krai
ne
Ukr
ain
e U
krai
ne
Cze
ch R
epu
blic
51
572
000
50
296
000
48
029
000
46
289
000
130
Ob
serv
atio
n: s
ince
199
8 -
info
rmat
ion
is p
rese
nte
d w
ith
ou
t th
e d
ata
on
dis
tric
ts f
rom
th
e le
ft s
ide
of
the
rive
r N
istr
u a
nd
mu
nic
ipal
ity
ben
der
Sou
rce:
Nat
ion
al b
ure
au o
f st
atis
tics
of
the
Rep
ub
lic o
f M
old
ova
an
d a
uth
ors
cal
cula
tio
n a
nd
FA
O A
qU
Ast
At,
201
0
Review of fishery and aquaculture development potentials in the Republic of Moldova58
tab
le 1
.3: R
uR
al
popu
lati
on
of
mo
ldo
va
co
un
try
Ru
ral p
op
ula
tio
n
1988
-199
219
93-1
997
1998
-200
220
03-2
007
pers
on
s p
er
km2
in 2
003-
2007
% o
f to
tal
po
pu
lati
on
in
2003
-200
720
08-2
010
pers
on
s p
er
km2
in 2
008-
2010
% o
f to
tal
po
pu
lati
on
in
2008
-201
0
mo
ldo
va
2 3
39 0
00
2 3
12 0
00
2 2
27 0
00
2 1
29 0
00
63
58
mo
ldo
va (
offi
cial
sta
tist
ics)
2 3
18 1
64
2 33
3 00
62
137
412
2 1
22 2
59
63
59
2 0
91 6
73
62
59
Min
imu
m o
f C
EE c
ou
ntr
ies
Est
on
ia
Est
on
ia
Est
on
ia
Mo
nte
neg
ro
Est
on
ia
bel
aru
s
449
000
4
24 0
00
415
000
2
46 0
00
9
27
Ave
rag
e o
f C
EE c
ou
ntr
ies
4 2
29 6
88
4 0
27 1
18
3 9
17 1
76
3 6
54 0
53
34
40
Max
imu
m o
f C
EE c
ou
ntr
ies
Ukr
ain
e U
krai
ne
Ukr
ain
e U
krai
ne
Mo
ldo
va
Mo
ldo
va
17
104
000
16
583
000
15
714
000
14
867
000
63
58
Sou
rce:
Nat
ion
al b
ure
au o
f st
atis
tics
of
the
Rep
ub
lic o
f M
old
ova
an
d a
uth
ors
cal
cula
tio
n a
nd
FA
O A
qU
Ast
At,
201
0
tab
les
1.4:
ec
on
om
ica
lly
ac
tiv
e po
pula
tio
n o
f m
old
ov
a
tab
le 1
.4.1
: eco
no
mic
ally
act
ive
po
pu
lati
on
of
mo
ldo
va -
1
co
un
try
to
tal e
con
om
ical
ly a
ctiv
e p
op
ula
tio
n
198
8-19
92
199
3-19
97
199
8-20
02
200
3-20
07
pers
on
s p
er k
m2
in 2
003-
2007
mo
ldo
va
2 0
48 0
00
1 8
76 0
00
1 5
98 0
00
1 3
89 0
00
41
mo
ldo
va (
offi
cial
sta
tist
ics)
2 0
71 0
00
1 6
90 4
00
1 6
75 6
00
1 3
99 8
00
41
Min
imu
m o
f C
EE c
ou
ntr
ies
Est
on
ia
Est
on
ia
Est
on
ia
Mo
nte
neg
ro
Est
on
ia
763
000
6
80 0
00
665
000
3
01 0
00
15
Ave
rag
e o
f C
EE c
ou
ntr
ies
5 2
48 9
38
5 1
41 3
53
4 8
85 3
53
4 6
15 8
95
39
Max
imu
m o
f C
EE c
ou
ntr
ies
Ukr
ain
e U
krai
ne
Ukr
ain
e U
krai
ne
Cze
ch R
ep.
25
421
000
25
878
000
22
989
000
23
190
000
66
Ob
serv
atio
n:
Sin
ce 1
998
- In
form
atio
n is
pre
sen
ted
wit
ho
ut
the
dat
a o
n d
istr
icts
fro
m t
he
left
sid
e o
f th
e ri
ver
Nis
tru
an
d m
un
icip
alit
y B
end
er
Sin
ce 1
998
the
eco
no
mic
ally
act
ive
po
pu
lati
on
is c
alcu
late
d b
ased
on
th
e n
um
ber
of
un
emp
loym
ent,
acc
ord
ing
ILO
cla
ssifi
cati
on
. So
urc
e: N
atio
nal
bu
reau
of
stat
isti
cs o
f th
e R
epu
blic
of
Mo
ldo
va a
nd
FA
O A
qU
Ast
At,
201
0

59Annex 1
tab
le 1
.4.2
: eco
no
mic
ally
act
ive
po
pu
lati
on
of
mo
ldo
va -
2
year
s 20
0020
0120
0220
0320
0420
0520
0620
0720
0820
09
Nu
mb
er o
f p
erso
ns
1 6
54 7
00
1 6
16 7
00
1 6
15 0
00
1 4
73 6
00
1 4
32 5
00
1 4
22 3
00
1 3
57 2
00
1 3
13 9
00
1 3
02 8
00
1 2
65 3
00
Pers
on
s p
er k
m2
49,
0 4
7,8
47,
8 4
3,6
42,
4 4
2,1
40,
2 3
8,9
38,
5 3
7,4
Ob
serv
atio
n: s
ince
199
8 -
info
rmat
ion
is p
rese
nte
d w
ith
ou
t th
e d
ata
on
dis
tric
ts f
rom
th
e le
ft s
ide
of
the
rive
r N
istr
u a
nd
mu
nic
ipal
ity
ben
der
Sou
rse:
Nat
ion
al b
ure
au o
f st
atis
tics
of
the
Rep
ub
lic o
f M
old
ova
an
d a
uth
ors
cal
cula
tio
n
tab
les
1.5:
ec
on
om
ica
lly
ac
tiv
e po
pula
tio
n in
aG
Ric
ult
uR
e o
f m
old
ov
a
tab
le 1
.5.1
: eco
no
mic
ally
act
ive
po
pu
lati
on
in a
gri
cult
ure
of
mo
ldo
va -
1
co
un
try
to
tal e
con
om
ical
ly a
ctiv
e p
op
ula
tio
n in
ag
ricu
ltu
re
198
8-19
92
199
3-19
97
199
8-20
02
200
3-20
07
pers
on
s p
er k
m2
in
200
3-20
07pe
rso
ns
per
km
2 in
200
9
mo
ldo
va
629
000
4
78 0
00
334
000
2
35 0
00
7
mo
ldo
va (
offi
cial
sta
tist
ics)
496
720
1
5 1
0
Min
imu
m o
f C
EE c
ou
ntr
ies
slo
ven
ia
slo
ven
ia
slo
ven
ia
slo
ven
ia
slo
ven
ia
41
000
26
000
15
000
9 0
00
0,4
Ave
rag
e o
f C
EE c
ou
ntr
ies
1 0
57 8
63
852
941
6
85 2
94
557
368
5
Max
imu
m o
f C
EE c
ou
ntr
ies
Ukr
ain
e U
krai
ne
Po
lan
d
Po
lan
d
Alb
ania
4 7
49 0
00
4 0
72 0
00
3 5
76 0
00
3 1
80 0
00
22
Ob
serv
atio
n: s
ince
199
8 -
info
rmat
ion
is p
rese
nte
d w
ith
ou
t th
e d
ata
on
dis
tric
ts f
rom
th
e le
ft s
ide
of
the
rive
r N
istr
u a
nd
mu
nic
ipal
ity
ben
der
Sou
rce:
Nat
ion
al b
ure
au o
f st
atis
tics
of
the
Rep
ub
lic o
f M
old
ova
an
d F
AO
Aq
UA
stA
t, 2
010
tab
le 1
.5.2
: eco
no
mic
ally
act
ive
po
pu
lati
on
in a
gri
cult
ure
of
mo
ldo
va -
2
year
s 20
0020
0120
0220
0320
0420
0520
0620
0720
0820
09
Nu
mb
er o
f p
erso
ns
770
400
7
64 8
00
747
100
5
83 2
00
532
900
5
36 5
00
422
400
4
08 6
00
388
600
3
33 7
00
Pers
on
s p
er k
m2
22,
8 2
2,6
22,
1 1
7,3
15,8
15,9
12,5
12,1
11,5
9,9
Ob
serv
atio
n: s
ince
199
8 -
info
rmat
ion
is p
rese
nte
d w
ith
ou
t th
e d
ata
on
dis
tric
ts f
rom
th
e le
ft s
ide
of
the
rive
r N
istr
u a
nd
mu
nic
ipal
ity
ben
der
Sou
rse:
Nat
ion
al b
ure
au o
f st
atis
tics
of
the
Rep
ub
lic o
f M
old
ova
an
d a
uth
ors
cal
cula
tio
n
Review of fishery and aquaculture development potentials in the Republic of Moldova60
tab
les
1.6:
pR
opo
Rti
on
of
the
eco
no
mic
all
y a
cti
ve
popu
lati
on
of
mo
ldo
va
wit
hin
th
e to
tal
popu
lati
on
of
mo
ldo
va
tab
le 1
.6.1
: pro
po
rtio
n o
f th
e ec
on
om
ical
ly a
ctiv
e p
op
ula
tio
n o
f m
old
ova
- 1
co
un
try
pro
po
rtio
n o
f ec
on
om
ical
ly a
ctiv
e p
op
ula
tio
n o
f m
old
ova
(%
)
198
8-19
92
199
3-19
97
199
8-20
02
200
3-20
07
mo
ldo
va
46,
8 4
4,0
40,
3 3
7,9
mo
ldo
va (
offi
cial
sta
tist
ics)
47,7
3946
38,
9
Min
imu
m o
f C
EE c
ou
ntr
ies
Alb
ania
h
un
gar
y M
old
ova
M
old
ova
41,
3 3
9,7
40,
3 3
7,9
Ave
rag
e o
f C
EE c
ou
ntr
ies
47,
4 4
6,5
46,
3 4
7,2
Max
imu
m o
f C
EE c
ou
ntr
ies
slo
vaki
a R
om
ania
C
zech
Rep
ub
lic
lat
via
52,
3 5
2,2
50,
5 5
2,1
Ob
serv
atio
n: s
ince
199
8 -
info
rmat
ion
is p
rese
nte
d w
ith
ou
t th
e d
ata
on
dis
tric
ts f
rom
th
e le
ft s
ide
of
the
rive
r N
istr
u a
nd
mu
nic
ipal
ity
ben
der
Sou
rce:
Nat
ion
al b
ure
au o
f st
atis
tics
of
the
Rep
ub
lic o
f M
old
ova
an
d F
AO
Aq
UA
stA
t, 2
010
tab
le 1
.6.2
: pro
po
rtio
n o
f th
e ec
on
om
ical
ly a
ctiv
e p
op
ula
tio
n o
f m
old
ova
- 2
year
s 20
0020
0120
0220
0320
0420
0520
0620
0720
0820
09
Perc
enta
ge
(%)
45,4
44,5
44,5
40,7
39,7
39,5
37,8
36,7
36,5
35,5
Ob
serv
atio
n: s
ince
199
8 -
info
rmat
ion
is p
rese
nte
d w
ith
ou
t th
e d
ata
on
dis
tric
ts f
rom
th
e le
ft s
ide
of
the
rive
r N
istr
u a
nd
mu
nic
ipal
ity
ben
der
Sou
rse:
Nat
ion
al b
ure
au o
f st
atis
tics
of
the
Rep
ub
lic o
f M
old
ova
an
d a
uth
ors
cal
cula
tio
n

61Annex 1
tab
les
1.7:
pR
opo
Rti
on
of
the
ac
tiv
e po
pula
tio
n in
aG
Ric
ult
uR
e w
ith
in t
he
tota
l po
pula
tio
n o
f m
old
ov
a
tab
le 1
.7.1
: pro
po
rtio
n o
f th
e ac
tive
po
pu
lati
on
in a
gri
cult
ure
wit
hin
th
e to
tal p
op
ula
tio
n o
f m
old
ova
- 1
co
un
try
pro
po
rtio
n o
f ac
tive
po
pu
lati
on
in a
gri
cult
ure
wit
hin
th
e to
tal p
op
ula
tio
n (
%)
198
8-19
92
199
3-19
97
199
8-20
02
200
3-20
07
mo
ldo
va
14,
4 1
1,2
8,4
6
,4
mo
ldo
va (
offi
cial
sta
tist
ics)
13,
8
Min
imu
m o
f C
EE c
ou
ntr
ies
slo
ven
ia
slo
ven
ia
slo
ven
ia
slo
ven
ia
2,1
1
,3
0,8
0
,4
Ave
rag
e o
f C
EE c
ou
ntr
ies
8,8
7
,0
5,8
5
,2
Max
imu
m o
f C
EE c
ou
ntr
ies
Alb
ania
A
lban
ia
Alb
ania
A
lban
ia
22,
0 2
0,8
20,
1 1
9,8
Sou
rce:
Nat
ion
al b
ure
au o
f st
atis
tics
of
the
Rep
ub
lic o
f M
old
ova
an
d a
uth
ors
cal
cula
tio
n a
nd
FA
O A
qU
Ast
At,
201
0
tab
le 1
.7.2
: pro
po
rtio
n o
f th
e ac
tive
po
pu
lati
on
in a
gri
cult
ure
wit
hin
th
e to
tal p
op
ula
tio
n o
f m
old
ova
- 2
year
s 20
0020
0120
0220
0320
0420
0520
0620
0720
0820
09
Pro
po
rtio
n (
%)
21,1
2120
,616
,114
,814
,911
,811
,410
,19,
4
Ob
serv
atio
n: s
ince
199
8 -
info
rmat
ion
is p
rese
nte
d w
ith
ou
t th
e d
ata
on
dis
tric
ts f
rom
th
e le
ft s
ide
of
the
rive
r N
istr
u a
nd
mu
nic
ipal
ity
ben
der
Sou
rse:
Nat
ion
al b
ure
au o
f st
atis
tics
of
the
Rep
ub
lic o
f M
old
ova
an
d a
uth
ors
cal
cula
tio
n

Review of fishery and aquaculture development potentials in the Republic of Moldova62
tab
les
1.8:
pR
opo
Rti
on
of
the
ac
tiv
e po
pula
tio
n in
aG
Ric
ult
uR
e w
ith
in t
he
ac
tiv
e po
pula
tio
n o
f m
old
ov
a
tab
le 1
.8.1
: pro
po
rtio
n o
f th
e ac
tive
po
pu
lati
on
in a
gri
cult
ure
wit
hin
th
e ac
tive
po
pu
lati
on
of
mo
ldo
va -
1
co
un
try
pro
po
rtio
n o
f ac
tive
po
pu
lati
on
in a
gri
cult
ure
wit
hin
th
e ac
tive
po
pu
lati
on
(%
)
198
8-19
92
199
3-19
97
199
8-20
02
200
3-20
07
mo
ldo
va
30,
7 2
5,5
20,
9 1
6,9
mo
ldo
va (
offi
cial
sta
tist
ics)
35,
4
Min
imu
m o
f C
EE c
ou
ntr
ies
slo
ven
ia
slo
ven
ia
slo
ven
ia
slo
ven
ia
4,7
2
,7
1,5
0
,9
Ave
rag
e o
f C
EE c
ou
ntr
ies
18,
8 1
5,4
12,
9 1
1,3
Max
imu
m o
f C
EE c
ou
ntr
ies
Alb
ania
A
lban
ia
Alb
ania
A
lban
ia
53,
3 5
0,2
46,
9 4
3,8
Sou
rce:
Nat
ion
al b
ure
au o
f st
atis
tics
of
the
Rep
ub
lic o
f M
old
ova
an
d a
uth
ors
cal
cula
tio
n a
nd
FA
O A
qU
Ast
At,
201
0
tab
le 1
.8.2
: pro
po
rtio
n o
f th
e ac
tive
po
pu
lati
on
in a
gri
cult
ure
wit
hin
th
e ac
tive
po
pu
lati
on
of
mo
ldo
va -
2
year
s 20
0020
0120
0220
0320
0420
0520
0620
0720
0820
09
Pro
po
rtio
n (
%)
46,
6 4
7,3
46,
3 3
9,6
37,5
37,
7 3
1,1
31,
1 2
9,8
26,
4
Ob
serv
atio
n: s
ince
199
8 -
info
rmat
ion
is p
rese
nte
d w
ith
ou
t th
e d
ata
on
dis
tric
ts f
rom
th
e le
ft s
ide
of
the
rive
r N
istr
u a
nd
mu
nic
ipal
ity
ben
der
Sou
rse:
Nat
ion
al b
ure
au o
f st
atis
tics
of
the
Rep
ub
lic o
f M
old
ova
an
d a
uth
ors
cal
cula
tio
n
63Annex 1
tab
les
1.9:
Gd
p o
f m
old
ov
a c
alc
ula
ted
on
pu
Rc
ha
se p
ow
eR p
aR
ity
(pp
p)
tab
les
1.9:
Gd
p o
f m
old
ova
cal
cula
ted
on
pu
rch
ase
po
wer
par
ity
(ppp
)
co
un
try
esti
mat
ed G
dp
(in
1 0
00 0
00 u
sd)
Gd
p -
per
cap
ita
(2
009
esti
mat
ion
) G
dp
- co
mp
osi
tio
n b
y se
cto
r (%
) (2
009
esti
mat
ion
)
2007
2008
2009
ag
ricu
ltu
rein
du
stry
serv
ices
mo
ldo
va 1
0 05
0 1
0 83
0 1
0 13
0 2
300
1
6,0
19,
9 6
4,1
mo
ldo
va (
offi
cial
sta
tist
ics)
9 7
40
10
724
10
203
2 8
61
Min
imu
m o
f C
EE c
ou
ntr
ies
Mo
nte
neg
ro
Mo
nte
neg
ro
Mo
nte
neg
ro
Mo
ldo
va
Cze
ch R
epu
blic
A
lban
ia
bel
aru
s
6 5
38
6 9
89
6 5
90
2 3
00
2,2
1
9,4
49,
0
Ave
rag
e o
f C
EE c
ou
ntr
ies
128
093
1
33 4
39
126
751
1
3 93
2 7
,9
29,
1 6
2,9
Max
imu
m o
f C
EE c
ou
ntr
ies
Po
lan
d
Po
lan
d
Po
lan
d
slo
ven
ia
Alb
ania
b
elar
us
lat
via
644
000
6
76 8
00
688
300
2
7 60
0 2
1,4
41,
8 7
4,3
Sou
rse:
Nat
ion
al b
ure
au o
f st
atis
tics
of
the
Rep
ub
lic o
f M
old
ova
an
d C
iA t
he
Wo
rld
Fac
t b
oo
k, 2
010
tab
le 1
.9.2
: Gd
p o
f m
old
ova
cal
cula
ted
on
pu
rch
ase
po
wer
par
ity
(ppp
) -
2
co
un
try
esti
mat
ed G
Rp
(in
bill
ion
usd
) G
pp p
er c
apit
a (2
010
est)
, usd
c
om
po
siti
on
by
sect
or
(%)
(201
0 es
t.)
2008
2009
2010
agri
cult
ure
ind
ust
ryse
rvic
es
Mo
ldo
va (
Offi
cial
sta
tist
ics)
10,
7 1
0,2
11,
0 3
088
1
6,3
20,
1 6
3,6
Ob
serv
atio
n: s
ince
199
8 -
info
rmat
ion
is p
rese
nte
d w
ith
ou
t th
e d
ata
on
dis
tric
ts f
rom
th
e le
ft s
ide
of
the
rive
r N
istr
u a
nd
mu
nic
ipal
ity
ben
der
Sou
rse:
Nat
ion
al b
ure
au o
f st
atis
tics
of
the
Rep
ub
lic o
f M
old
ova

Review of fishery and aquaculture development potentials in the Republic of Moldova64
tab
les
1.10
: po
pula
tio
n b
elo
w p
ov
eRty
lin
e in
mo
ldo
va
tab
les
1.10
: po
pu
lati
on
bel
ow
po
vert
y lin
e in
mo
ldo
va
co
un
try
pro
po
rtio
n o
f p
op
ula
tio
n b
elo
w p
ove
rty
line
%
ob
serv
atio
n
mo
ldo
va
29,
5 in
200
5
mo
ldo
va (
offi
cial
sta
tist
ics)
26,
3 in
200
9
Min
imu
m o
f C
EE c
ou
ntr
ies
lit
hu
ania
4,0
Ave
rag
e o
f C
EE c
ou
ntr
ies
19,
2
Max
imu
m o
f C
EE c
ou
ntr
ies
Ukr
ain
e
35,
0
Sou
rce:
Nat
ion
al b
ure
au o
f st
atis
tics
of
the
Rep
ub
lic o
f M
old
ova
an
d C
iA t
he
Wo
rld
Fac
t b
oo
k, 2
010
tab
le 1
.10.
2: p
rop
ort
ion
of
po
pu
lati
on
bel
ow
th
e ab
solu
te n
atio
nal
po
vert
y lin
e (r
ate
of
abso
lute
po
vert
y)
year
s 20
0020
0120
0220
0320
0420
0520
0620
0720
0820
09
Pro
po
rtio
n (
%)
67,
8 5
4,6
40,
4 2
9,0
26,
5 2
9,1
30,
2 2
5,8
26,
4 2
6,3
Ob
serv
atio
n: s
ince
199
8 -
info
rmat
ion
is p
rese
nte
d w
ith
ou
t th
e d
ata
on
dis
tric
ts f
rom
th
e le
ft s
ide
of
the
rive
r N
istr
u a
nd
mu
nic
ipal
ity
ben
der
Sou
rse:
Nat
ion
al b
ure
au o
f st
atis
tics
of
the
Rep
ub
lic o
f M
old
ova
an
d a
uth
ors
cal
cula
tio
n
65
annex 2
wateR ResouRce, fish faRms and fish species of the Republic of moldova
tab
le 2
.1: w
ate
R R
eso
uR
ces
of
mo
ldo
va
co
un
try
ave
rag
e p
reci
pit
atio
n
wat
er p
rod
uce
d in
tern
al
(km
3/yr
)G
rou
nd
wat
er: p
rod
uce
d
inte
rnal
ly (
km3/
yr)
ove
rlap
: su
rfac
e w
ater
an
d
gro
un
dw
ater
(k
m3/
yr)
wat
er r
eso
urc
es :
tota
l in
tern
al r
enew
able
wat
er r
eso
urc
es: t
ota
l re
new
able
(ac
tual
)d
epen
den
cy
rati
o (
%)
in d
epth
(m
m/y
r)in
vo
lum
e (k
m3/
yr)
surf
ace
wat
erG
rou
nd
w
ater
km3/
yrpe
r ca
pit
a (m
3/in
hab
/yr
)(k
m3/
yr)
per
cap
ita
(m3/
inh
ab/
yr)
mo
ldo
va
(200
3 -
2007
) 4
50
15,
2 1
,0
0,4
0
,4
1,0
2
73
11,
7 3
177
9
1,4
mo
ldo
va
(200
6-20
09)
517
1
7,5
1,0
0
,4
0,4
1
,0
280
8
,6
2 4
14
Min
imu
m o
f C
EE c
ou
nti
res
(200
3 -
2007
)
Mo
ldo
va
Mo
ldo
va
Mo
ldo
va
Mo
ldo
va
Mo
ldo
va
Mo
ldo
va
Mo
ldo
va
Mac
edo
nia
C
zech
R
epu
blic
E
sto
nia
450
1
5,2
1,0
0
,4
0,4
1
,0
273
6
,4
1 2
81
0,7
Ave
rag
e o
f C
EE c
ou
nti
res
(200
3 -
2007
) 7
59
79,
4 2
2,1
7,5
6
,2
24,
1 4
441
5
6,9
8 5
89
44,
1
Max
imu
m o
f C
EE c
ou
nti
res
(200
3 -
2007
)
Alb
ania
U
krai
ne
Po
lan
d
Ukr
ain
e b
elar
us
Po
lan
d
Est
on
ia
Ro
man
ia
Cro
atia
h
un
gar
y
1 4
85
341
,0
53,
1 2
0,0
18,
0 5
3,6
9 4
64
211
,9
23
820
94,
2
Ob
serv
atio
n:
Dn
iest
er a
nd
Pru
t ar
e tr
ansb
ou
nd
ary
rive
rs, f
or
Mo
ldo
va a
re d
isp
on
ible
on
ly 5
0% o
f w
ater
vo
lum
To
tal w
ater
res
ou
rces
in D
nie
ster
+Pr
ut+
Loca
l riv
ers
and
Dan
ub
e =
1715
0 m
ln m
3, a
nd
dis
po
nib
le f
or
Mo
ldo
va -
861
0 m
ln m
3 V
olu
me
of
use
d w
ater
is 7
86 m
ln.m
3 So
urc
e: N
atio
nal
rep
ort
(d
ata
of
2006
- 2
009)
an
d F
AO
Aq
UA
stA
t, 2
010
(dat
a o
f 20
03 -
200
7)

Review of fishery and aquaculture development potentials in the Republic of Moldova66
tab
le 2
.2: w
ate
R R
eso
uR
ces
peR
un
it a
Rea
in m
old
ov
a (
2003
- 2
007)
co
un
try
ave
rag
e p
reci
pit
atio
n in
vo
lum
e (m
3 /km
2 /yr
)
wat
er p
rod
uce
d in
tern
al (
m3 /
km2 /
yr)
ove
rlap
: su
rfac
e w
ater
an
d g
rou
nd
wat
er
(m3 /
km2 /
yr)
wat
er r
eso
urc
es:
tota
l in
tern
al r
enew
able
(m
3 /km
2 /yr
)
wat
er r
eso
urc
es:
tota
l ren
ewab
le (
actu
al)
(m3 /
km2 /
yr)
surf
ace
wat
erG
rou
nd
wat
er
mo
ldo
va
449
913
2
9 54
1 1
1 81
6 1
1 81
6 2
9 54
1 3
44 1
55
mo
ldo
va (
offi
cial
sta
tist
ics)
5
17 0
48
29
546
11
818
11
818
29
546
254
092
Min
imu
m o
f C
EE c
ou
nti
res
Mo
ldo
va
Mo
ldo
va
Mo
ldo
va
Cro
atia
M
old
ova
C
zech
Rep
ub
lic
449
913
2
9 54
1 1
1 81
6 8
835
2
9 54
1 1
66 7
36
Ave
rag
e o
f C
EE c
ou
nti
res
758
702
2
78 9
61
106
594
8
1 85
6 3
25 1
67
677
689
Max
imu
m o
f C
EE c
ou
nti
res
Alb
ania
s
love
nia
s
love
nia
s
love
nia
A
lban
ia
Cro
atia
1 4
84 9
73
913
530
6
65 9
10
658
511
9
35 7
17
1 8
64 1
55
Sou
rce:
Nat
ion
al b
ure
au o
f st
atis
tics
of
the
Rep
ub
lic o
f M
old
ova
an
d F
AO
Aq
UA
stA
t, 2
010
tab
le 2
.3: R
iveR
s o
f m
old
ov
a
Riv
er s
yste
m
nam
e o
f ri
ver
to
tal l
eng
th (
km)
len
gth
in m
old
ova
(km
)
bla
k se
e C
ahu
l (1)
39
39
bla
k se
e C
ain
ari
113
1
13
bla
k se
e C
og
ilnic
(1)
243
1
25
bla
k se
e ia
lpu
g (
1) 1
42
135
to
tal
537
4
12
dan
ub
e C
iuh
ur
97
97
dan
ub
e d
anu
be
(1)
2 8
57
1
dan
ub
e Pr
ut
(1)
976
6
95
to
tal
3 9
30
793
dn
iest
er
bic
155
1
55
dn
iest
er
bo
tna
152
1
52
dn
iest
er
Cu
bo
lta
100
1
00
dn
iest
er
dn
iest
er (
1) 1
352
6
57
dn
iest
er
ich
el 1
01
101
dn
iest
er
Rau
t 2
86
286
to
tal
2 1
46
1 4
51
Gra
nd
to
tal
6 6
13
2 6
56
Ob
serv
atio
n: 1
/ tra
nsb
ou
nd
ary
rive
rs
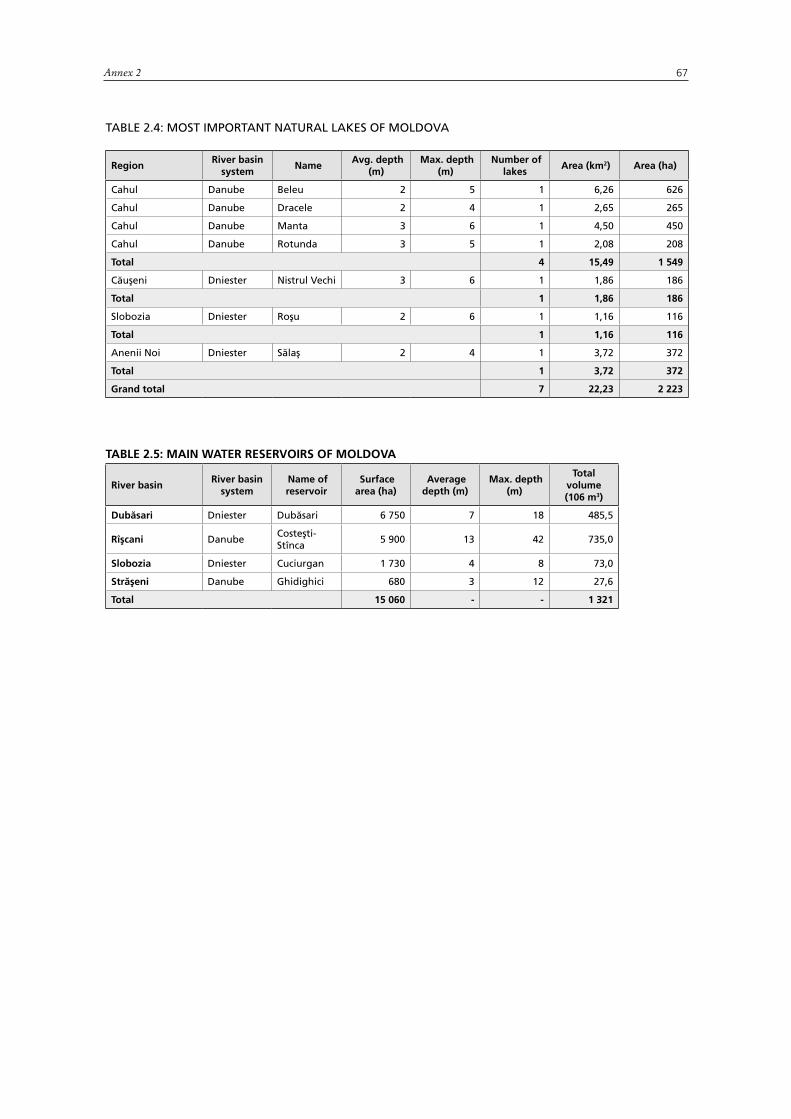
67Annex 2
tAblE 2.4: MOst iMPORtANt NAtURAl lAkEs OF MOldOvA
Region River basin
system name
avg. depth (m)
max. depth (m)
number of lakes
area (km2) area (ha)
Cahul danube beleu 2 5 1 6,26 626
Cahul danube dracele 2 4 1 2,65 265
Cahul danube Manta 3 6 1 4,50 450
Cahul danube Rotunda 3 5 1 2,08 208
total 4 15,49 1 549
Căuşeni dniester Nistrul vechi 3 6 1 1,86 186
total 1 1,86 186
slobozia dniester Roşu 2 6 1 1,16 116
total 1 1,16 116
Anenii Noi dniester sălaş 2 4 1 3,72 372
total 1 3,72 372
Grand total 7 22,23 2 223
table 2.5: main wateR ReseRvoiRs of moldova
River basin River basin
system name of reservoir
surface area (ha)
average depth (m)
max. depth (m)
total volume (106 m3)
Dubăsari dniester dubăsari 6 750 7 18 485,5
Rîşcani danube Costeşti-stînca
5 900 13 42 735,0
Slobozia dniester Cuciurgan 1 730 4 8 73,0
Străşeni danube Ghidighici 680 3 12 27,6
total 15 060 - - 1 321
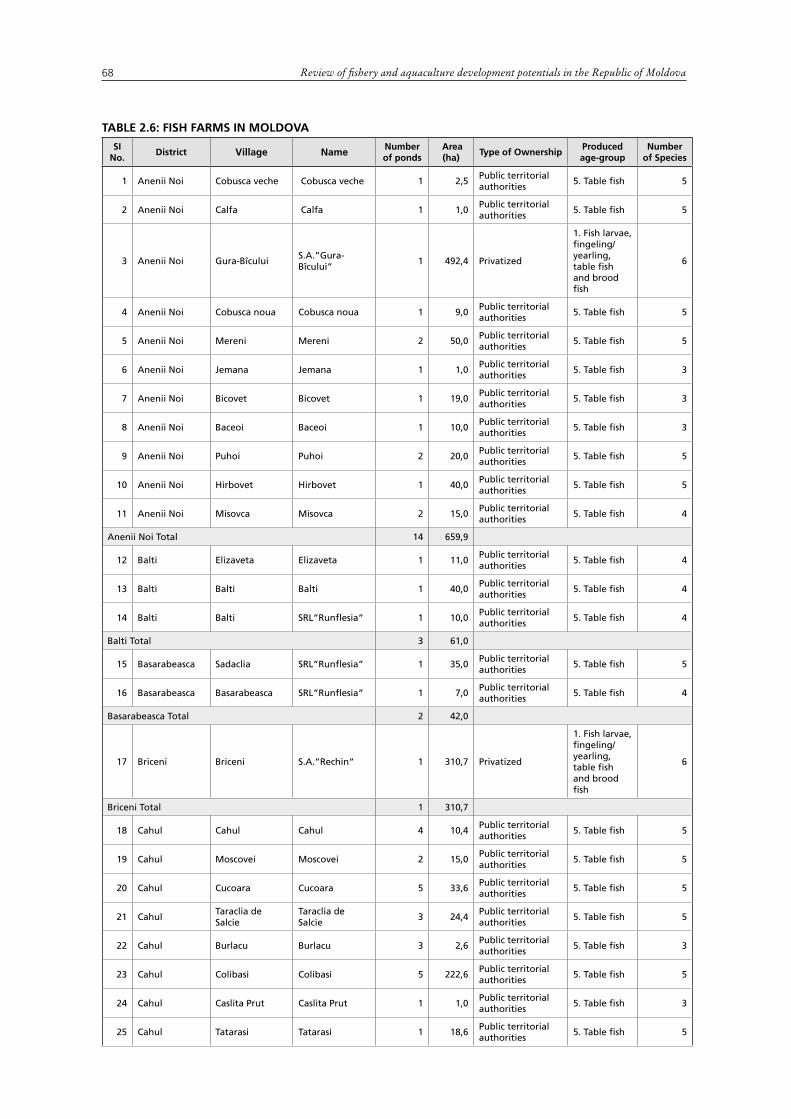
Review of fishery and aquaculture development potentials in the Republic of Moldova68
table 2.6: fish faRms in moldova
si no.
district village name number of ponds
area (ha)
type of ownershipproduced age-group
number of species
1 Anenii Noi Cobusca veche Cobusca veche 1 2,5 Public territorial authorities
5. table fish 5
2 Anenii Noi Calfa Calfa 1 1,0 Public territorial authorities
5. table fish 5
3 Anenii Noi Gura-Bîcului S.A.”Gura-Bîcului”
1 492,4 Privatized
1. Fish larvae, fingeling/yearling, table fish and brood fish
6
4 Anenii Noi Cobusca noua Cobusca noua 1 9,0 Public territorial authorities
5. table fish 5
5 Anenii Noi Mereni Mereni 2 50,0 Public territorial authorities
5. table fish 5
6 Anenii Noi Jemana Jemana 1 1,0 Public territorial authorities
5. table fish 3
7 Anenii Noi Bicovet Bicovet 1 19,0 Public territorial authorities
5. table fish 3
8 Anenii Noi Baceoi Baceoi 1 10,0 Public territorial authorities
5. table fish 3
9 Anenii Noi Puhoi Puhoi 2 20,0 Public territorial authorities
5. table fish 5
10 Anenii Noi Hirbovet Hirbovet 1 40,0 Public territorial authorities
5. table fish 5
11 Anenii Noi Misovca Misovca 2 15,0 Public territorial authorities
5. table fish 4
Anenii Noi total 14 659,9
12 balti Elizaveta Elizaveta 1 11,0 Public territorial authorities
5. table fish 4
13 balti Balti Balti 1 40,0 Public territorial authorities
5. table fish 4
14 balti Balti SRL”Runflesia” 1 10,0 Public territorial authorities
5. table fish 4
balti total 3 61,0
15 basarabeasca Sadaclia SRL”Runflesia” 1 35,0 Public territorial authorities
5. table fish 5
16 basarabeasca Basarabeasca SRL”Runflesia” 1 7,0 Public territorial authorities
5. table fish 4
basarabeasca total 2 42,0
17 briceni Briceni S.A.”Rechin” 1 310,7 Privatized
1. Fish larvae, fingeling/yearling, table fish and brood fish
6
briceni total 1 310,7
18 Cahul Cahul Cahul 4 10,4 Public territorial authorities
5. table fish 5
19 Cahul Moscovei Moscovei 2 15,0 Public territorial authorities
5. table fish 5
20 Cahul Cucoara Cucoara 5 33,6 Public territorial authorities
5. table fish 5
21 CahulTaraclia de Salcie
Taraclia de Salcie
3 24,4 Public territorial authorities
5. table fish 5
22 Cahul Burlacu Burlacu 3 2,6 Public territorial authorities
5. table fish 3
23 Cahul Colibasi Colibasi 5 222,6 Public territorial authorities
5. table fish 5
24 Cahul Caslita Prut Caslita Prut 1 1,0 Public territorial authorities
5. table fish 3
25 Cahul Tatarasi Tatarasi 1 18,6 Public territorial authorities
5. table fish 5

69Annex 2
si no.
district village name number of ponds
area (ha)
type of ownershipproduced age-group
number of species
26 Cahul Valeni Valeni 4 18,0 Public territorial authorities
5. table fish 4
Cahul total 28 346,2
27 Cainari Pervomaiscoie Pervomaiscoie 1 22,0 Public territorial authorities
5. table fish 5
28 Cainari Plop Plop 1 30,0 Public territorial authorities
5. table fish 5
29 Cainari Plop Sabutei Plop Sabutei 1 43,0 Public territorial authorities
5. table fish 5
30 Cainari Cascalia Cascalia 1 26,0 Public territorial authorities
5. table fish 4
Cainari total 4 121,0
31 Calarasi Calarasi Calarasi 1 4,5 Public territorial authorities
5. table fish 5
32 Calarasi Temeleuti Temeleuti 1 4,5 Public territorial authorities
5. table fish 5
33 Calarasi CălăraşiS.A.”Piscicola-Bîc”
1 29,0 Privatized
3. Fingeling/yearling, table fish and fingeling
6
34 Calarasi Niscani Niscani 1 10,0 Public territorial authorities
5. table fish 5
35 Calarasi Parsjolteni Parsjolteni 1 4,0 Public territorial authorities
5. table fish 5
36 Calarasi Calarasi SRL “Vigi” 1 10,0 Public territorial authorities
5. table fish 5
37 Calarasi Leordoaia Leordoaia 1 3,5 Public territorial authorities
5. table fish 3
38 Calarasi Frumoasa Frumoasa 4 22,0 Public territorial authorities
5. table fish 4
39 Calarasi Raciula Raciula 1 10,0 Public territorial authorities
5. table fish 3
40 Calarasi Tibirica Tibirica 1 15,0 Public territorial authorities
5. table fish 3
41 Calarasi Pitusca Pitusca 1 14,0 Public territorial authorities
5. table fish 3
42 Calarasi Sadova Sadova 1 5,0 Public territorial authorities
5. table fish 4
43 Calarasi Meriseni Meriseni 1 5,0 Public territorial authorities
5. table fish 4
Calarasi total 16 136,5
44 Cantemir Visneovka Visneovka 1 60,0 Public territorial authorities
5. table fish 5
Cantemir total 1 60,0
45 Causeni Ucrainca Ceaga 1 163,0 Public territorial authorities
5. table fish 5
46 Causeni Căuşeni S.A.”Acvatic” 1 163,5 Public territorial authorities
3. Fingeling/yearling, table fish and fingeling
5
Causeni total 2 326,5
47 Chisinau Chisinau Soldatscoie 1 20,0 Public territorial authorities
5. table fish 5
48 Chisinau Gratiesti Gratiesti 1 12,0 Public territorial authorities
5. table fish 5
49 Chisinau Colonita Colonita 1 11,0 Public territorial authorities
5. table fish 3
50 Chisinau ChisinăuS.R.L. “Ihtiocom”
1 160,0 Public territorial authorities
3. Fingeling/yearling, table fish and fingeling
7
51 Chisinau Goiani 3 Goiani 1 3,0 Public territorial authorities
5. table fish 5
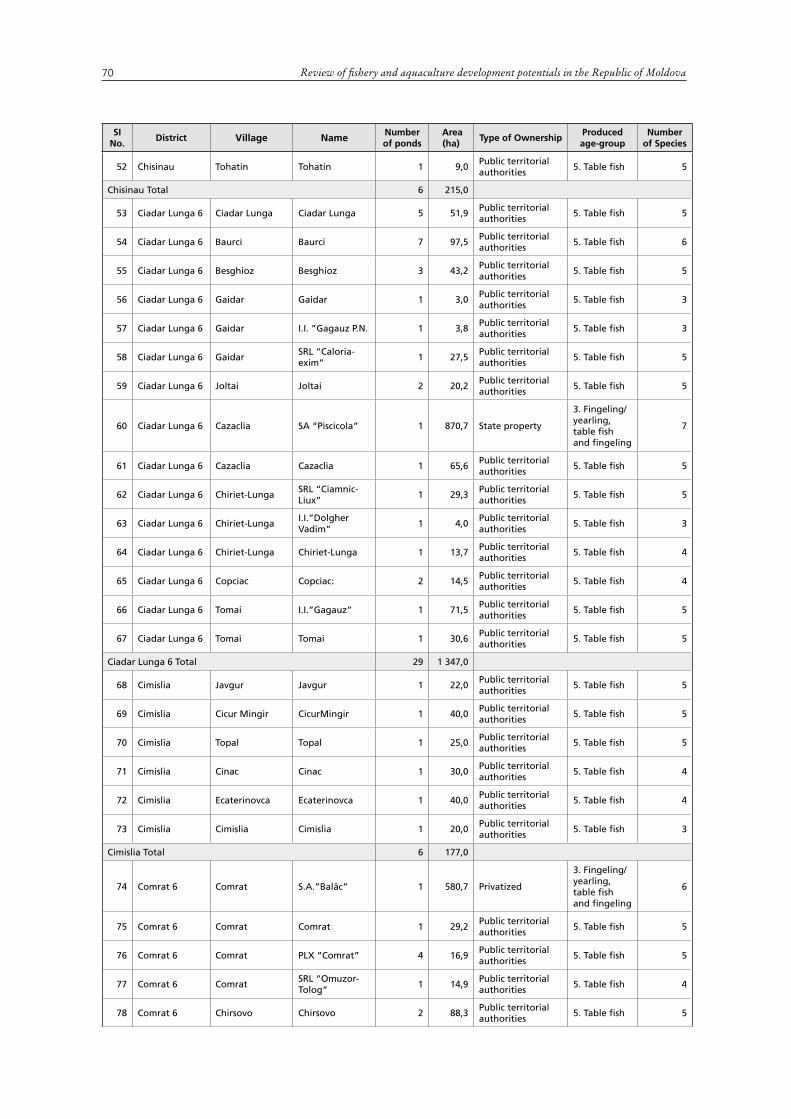
Review of fishery and aquaculture development potentials in the Republic of Moldova70
si no.
district village name number of ponds
area (ha)
type of ownershipproduced age-group
number of species
52 Chisinau Tohatin Tohatin 1 9,0 Public territorial authorities
5. table fish 5
Chisinau total 6 215,0
53 Ciadar lunga 6 Ciadar Lunga Ciadar Lunga 5 51,9 Public territorial authorities
5. table fish 5
54 Ciadar lunga 6 Baurci Baurci 7 97,5 Public territorial authorities
5. table fish 6
55 Ciadar lunga 6 Besghioz Besghioz 3 43,2 Public territorial authorities
5. table fish 5
56 Ciadar lunga 6 Gaidar Gaidar 1 3,0 Public territorial authorities
5. table fish 3
57 Ciadar lunga 6 Gaidar I.I. ”Gagauz P.N. 1 3,8 Public territorial authorities
5. table fish 3
58 Ciadar lunga 6 GaidarSRL “Caloria-exim”
1 27,5 Public territorial authorities
5. table fish 5
59 Ciadar lunga 6 Joltai Joltai 2 20,2 Public territorial authorities
5. table fish 5
60 Ciadar lunga 6 Cazaclia SA “Piscicola” 1 870,7 state property
3. Fingeling/yearling, table fish and fingeling
7
61 Ciadar lunga 6 Cazaclia Cazaclia 1 65,6 Public territorial authorities
5. table fish 5
62 Ciadar lunga 6 Chiriet-LungaSRL “Ciamnic-Liux”
1 29,3 Public territorial authorities
5. table fish 5
63 Ciadar lunga 6 Chiriet-LungaI.I.”Dolgher Vadim”
1 4,0 Public territorial authorities
5. table fish 3
64 Ciadar lunga 6 Chiriet-Lunga Chiriet-Lunga 1 13,7 Public territorial authorities
5. table fish 4
65 Ciadar lunga 6 Copciac Copciac: 2 14,5 Public territorial authorities
5. table fish 4
66 Ciadar lunga 6 Tomai I.I.”Gagauz” 1 71,5 Public territorial authorities
5. table fish 5
67 Ciadar lunga 6 Tomai Tomai 1 30,6 Public territorial authorities
5. table fish 5
Ciadar lunga 6 total 29 1 347,0
68 Cimislia Javgur Javgur 1 22,0 Public territorial authorities
5. table fish 5
69 Cimislia Cicur Mingir CicurMingir 1 40,0 Public territorial authorities
5. table fish 5
70 Cimislia Topal Topal 1 25,0 Public territorial authorities
5. table fish 5
71 Cimislia Cinac Cinac 1 30,0 Public territorial authorities
5. table fish 4
72 Cimislia Ecaterinovca Ecaterinovca 1 40,0 Public territorial authorities
5. table fish 4
73 Cimislia Cimislia Cimislia 1 20,0 Public territorial authorities
5. table fish 3
Cimislia total 6 177,0
74 Comrat 6 Comrat S.A.”Balâc” 1 580,7 Privatized
3. Fingeling/yearling, table fish and fingeling
6
75 Comrat 6 Comrat Comrat 1 29,2 Public territorial authorities
5. table fish 5
76 Comrat 6 Comrat PLX “Comrat” 4 16,9 Public territorial authorities
5. table fish 5
77 Comrat 6 ComratSRL “Omuzor-Tolog”
1 14,9 Public territorial authorities
5. table fish 4
78 Comrat 6 Chirsovo Chirsovo 2 88,3 Public territorial authorities
5. table fish 5

71
si no.
district village name number of ponds
area (ha)
type of ownershipproduced age-group
number of species
79 Comrat 6 Congazcik II”Uzun N” 2 35,1 Public territorial authorities
5. table fish 4
80 Comrat 6 Dezginja Dezginja 2 35,4 Public territorial authorities
5. table fish 4
81 Comrat 6 Besalma Besalma 4 39,8 Public territorial authorities
5. table fish 5
82 Comrat 6 Congaz II”Palic Fiodor” 1 14,3 Public territorial authorities
5. table fish 5
83 Comrat 6 Cotovskoe Cotovskoe 1 82,0 Public territorial authorities
5. table fish 5
84 Comrat 6 FerapontevkaSRL”Tomai Vinex”
1 11,5 Public territorial authorities
5. table fish 5
85 Comrat 6 Svetlii CAT “Svetlii” 1 10,0 state property 5. table fish 3
86 Comrat 6 Avdarma Avdarma 2 25,0 Public territorial authorities
5. table fish 4
87 Comrat 6 Borogani Borogani 2 60,0 Public territorial authorities
5. table fish 5
88 Comrat 6 Sadic Sadic 1 40,0 Public territorial authorities
5. table fish 5
89 Comrat 6 Bascalia Bascalia 1 5,0 Public territorial authorities
5. table fish 3
90 Comrat 6 Cioc-Maidan Cioc-Maidan 1 30,0 Public territorial authorities
5. table fish 5
Comrat 6 total 28 1 118,1
91 Criuleni Rascova Rascova 1 17,0 Public territorial authorities
5. table fish 5
92 Criuleni Magdacesti Magdacesti 1 2,5 Public territorial authorities
5. table fish 5
93 Criuleni Borogan Borogan 1 45,0 Public territorial authorities
5. table fish 5
94 Criuleni Baltata Baltata 1 3,0 Public territorial authorities
5. table fish 5
95 Criuleni Malaesti Malaesti 1 12,0 Public territorial authorities
5. table fish 3
96 Criuleni Cimiseni Cimiseni 1 40,0 Public territorial authorities
5. table fish 5
97 Criuleni Cricova Cricova 1 5,0 Public territorial authorities
5. table fish 3
98 Criuleni Pascani Pascani 1 20,0 Public territorial authorities
5. table fish 4
99 Criuleni Micauti Micauti 1 40,0 Public territorial authorities
5. table fish 4
100 Criuleni Drasliceni Drasliceni 1 30,0 Public territorial authorities
5. table fish 4
101 Criuleni Tohatin Tohatin 1 9,0 Public territorial authorities
5. table fish 4
Criuleni total 11 223,5
102 donduseni Orinesti Orinesti 4 8,5 Public territorial authorities
5. table fish 4
103 donduseni Baraboi Baraboi 4 41,5 Public territorial authorities
5. table fish 5
104 donduseni Cernoliovca Cernoliovca 1 43,0 Public territorial authorities
5. table fish 5
105 donduseni Corbu Corbu 7 25,0 Public territorial authorities
5. table fish 3
106 donduseni v. Donduseni v. Donduseni 11 47,5 Public territorial authorities
5. table fish 3
107 donduseni Elizavetovca Elizavetovca 3 7,8 Public territorial authorities
5. table fish 4
108 donduseni Horodisti Horodisti 3 8,0 Public territorial authorities
5. table fish 4
Annex 2
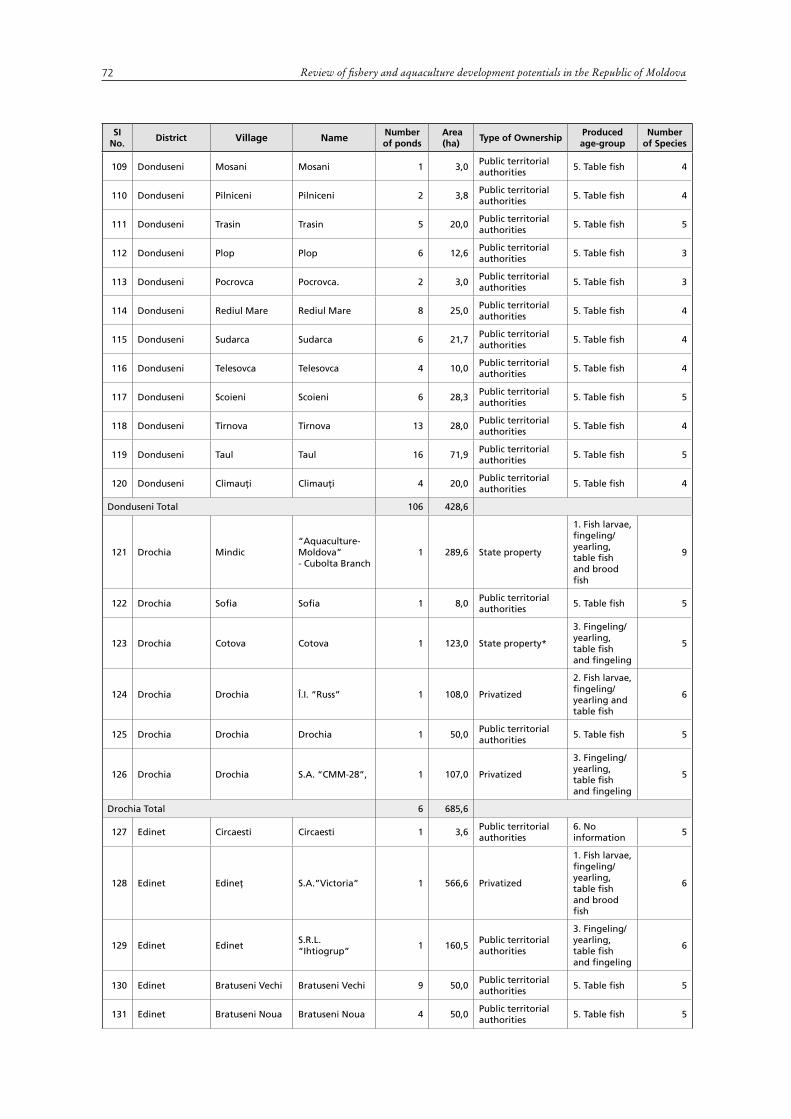
Review of fishery and aquaculture development potentials in the Republic of Moldova72
si no.
district village name number of ponds
area (ha)
type of ownershipproduced age-group
number of species
109 donduseni Mosani Mosani 1 3,0 Public territorial authorities
5. table fish 4
110 donduseni Pilniceni Pilniceni 2 3,8 Public territorial authorities
5. table fish 4
111 donduseni Trasin Trasin 5 20,0 Public territorial authorities
5. table fish 5
112 donduseni Plop Plop 6 12,6 Public territorial authorities
5. table fish 3
113 donduseni Pocrovca Pocrovca. 2 3,0 Public territorial authorities
5. table fish 3
114 donduseni Rediul Mare Rediul Mare 8 25,0 Public territorial authorities
5. table fish 4
115 donduseni Sudarca Sudarca 6 21,7 Public territorial authorities
5. table fish 4
116 donduseni Telesovca Telesovca 4 10,0 Public territorial authorities
5. table fish 4
117 donduseni Scoieni Scoieni 6 28,3 Public territorial authorities
5. table fish 5
118 donduseni Tirnova Tirnova 13 28,0 Public territorial authorities
5. table fish 4
119 donduseni Taul Taul 16 71,9 Public territorial authorities
5. table fish 5
120 donduseni Climauţi Climauţi 4 20,0 Public territorial authorities
5. table fish 4
donduseni total 106 428,6
121 drochia Mindic“Aquaculture-Moldova” - Cubolta Branch
1 289,6 state property
1. Fish larvae, fingeling/yearling, table fish and brood fish
9
122 drochia Sofia Sofia 1 8,0 Public territorial authorities
5. table fish 5
123 drochia Cotova Cotova 1 123,0 state property*
3. Fingeling/yearling, table fish and fingeling
5
124 drochia Drochia Î.I. “Russ” 1 108,0 Privatized
2. Fish larvae, fingeling/yearling and table fish
6
125 drochia Drochia Drochia 1 50,0 Public territorial authorities
5. table fish 5
126 drochia Drochia S.A. “CMM-28”, 1 107,0 Privatized
3. Fingeling/yearling, table fish and fingeling
5
drochia total 6 685,6
127 Edinet Circaesti Circaesti 1 3,6 Public territorial authorities
6. No information
5
128 Edinet Edineţ S.A.”Victoria” 1 566,6 Privatized
1. Fish larvae, fingeling/yearling, table fish and brood fish
6
129 Edinet EdinetS.R.L. “Ihtiogrup”
1 160,5 Public territorial authorities
3. Fingeling/yearling, table fish and fingeling
6
130 Edinet Bratuseni Vechi Bratuseni Vechi 9 50,0 Public territorial authorities
5. table fish 5
131 Edinet Bratuseni Noua Bratuseni Noua 4 50,0 Public territorial authorities
5. table fish 5
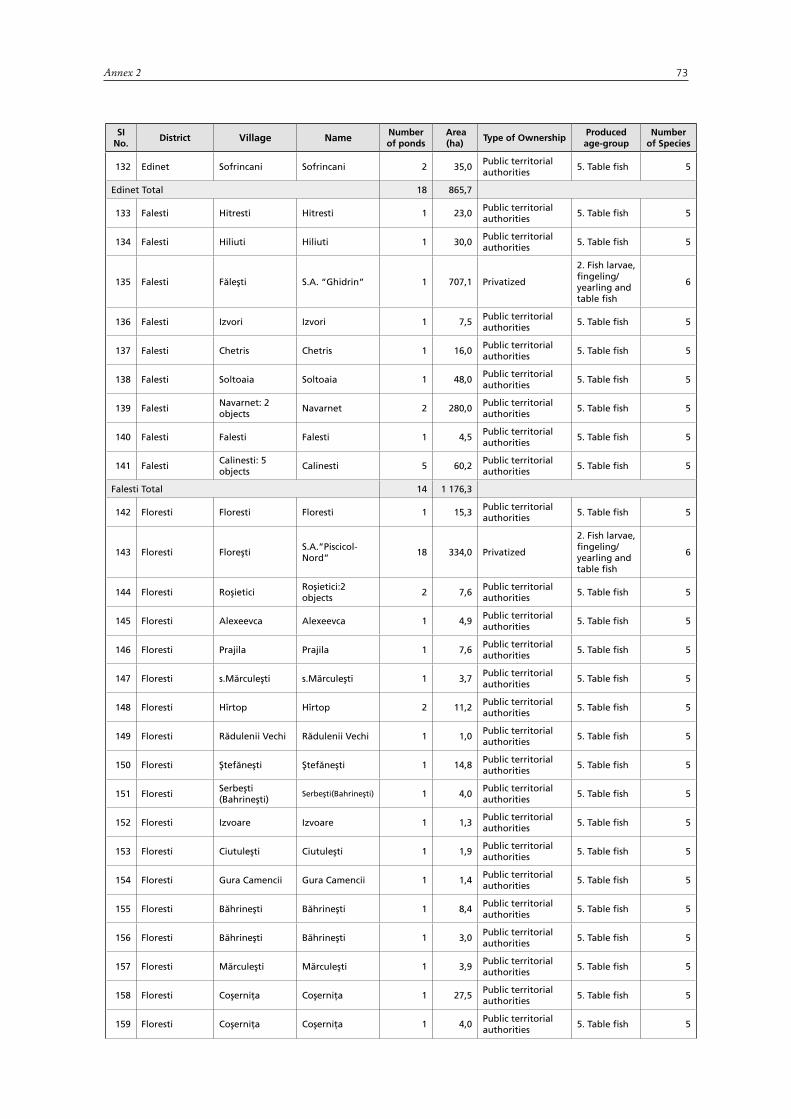
73
si no.
district village name number of ponds
area (ha)
type of ownershipproduced age-group
number of species
132 Edinet Sofrincani Sofrincani 2 35,0 Public territorial authorities
5. table fish 5
Edinet total 18 865,7
133 Falesti Hitresti Hitresti 1 23,0 Public territorial authorities
5. table fish 5
134 Falesti Hiliuti Hiliuti 1 30,0 Public territorial authorities
5. table fish 5
135 Falesti Făleşti S.A. “Ghidrin” 1 707,1 Privatized
2. Fish larvae, fingeling/yearling and table fish
6
136 Falesti Izvori Izvori 1 7,5 Public territorial authorities
5. table fish 5
137 Falesti Chetris Chetris 1 16,0 Public territorial authorities
5. table fish 5
138 Falesti Soltoaia Soltoaia 1 48,0 Public territorial authorities
5. table fish 5
139 FalestiNavarnet: 2 objects
Navarnet 2 280,0 Public territorial authorities
5. table fish 5
140 Falesti Falesti Falesti 1 4,5 Public territorial authorities
5. table fish 5
141 FalestiCalinesti: 5 objects
Calinesti 5 60,2 Public territorial authorities
5. table fish 5
Falesti total 14 1 176,3
142 Floresti Floresti Floresti 1 15,3 Public territorial authorities
5. table fish 5
143 Floresti FloreştiS.A.”Piscicol-Nord”
18 334,0 Privatized
2. Fish larvae, fingeling/yearling and table fish
6
144 Floresti RoşieticiRoşietici:2 objects
2 7,6 Public territorial authorities
5. table fish 5
145 Floresti Alexeevca Alexeevca 1 4,9 Public territorial authorities
5. table fish 5
146 Floresti Prajila Prajila 1 7,6 Public territorial authorities
5. table fish 5
147 Floresti s.Mărculeşti s.Mărculeşti 1 3,7 Public territorial authorities
5. table fish 5
148 Floresti Hîrtop Hîrtop 2 11,2 Public territorial authorities
5. table fish 5
149 Floresti Rădulenii Vechi Rădulenii Vechi 1 1,0 Public territorial authorities
5. table fish 5
150 Floresti Ştefăneşti Ştefăneşti 1 14,8 Public territorial authorities
5. table fish 5
151 FlorestiSerbeşti (Bahrineşti)
Serbeşti(Bahrineşti) 1 4,0 Public territorial authorities
5. table fish 5
152 Floresti Izvoare Izvoare 1 1,3 Public territorial authorities
5. table fish 5
153 Floresti Ciutuleşti Ciutuleşti 1 1,9 Public territorial authorities
5. table fish 5
154 Floresti Gura Camencii Gura Camencii 1 1,4 Public territorial authorities
5. table fish 5
155 Floresti Băhrineşti Băhrineşti 1 8,4 Public territorial authorities
5. table fish 5
156 Floresti Băhrineşti Băhrineşti 1 3,0 Public territorial authorities
5. table fish 5
157 Floresti Mărculeşti Mărculeşti 1 3,9 Public territorial authorities
5. table fish 5
158 Floresti Coşerniţa Coşerniţa 1 27,5 Public territorial authorities
5. table fish 5
159 Floresti Coşerniţa Coşerniţa 1 4,0 Public territorial authorities
5. table fish 5
Annex 2

Review of fishery and aquaculture development potentials in the Republic of Moldova74
si no.
district village name number of ponds
area (ha)
type of ownershipproduced age-group
number of species
160 Floresti Cerniţa Cerniţa 1 13,7 Public territorial authorities
5. table fish 5
161 Floresti Cerniţa Cerniţa 1 6,3 Public territorial authorities
5. table fish 5
162 Floresti Cerniţa Cerniţa 1 2,1 Public territorial authorities
5. table fish 5
163 Floresti Domulgeni Domulgeni 1 2,4 Public territorial authorities
5. table fish 5
164 Floresti Ştefăneşti Ştefăneşti 1 11,9 Public territorial authorities
5. table fish 5
165 Floresti Caşunca Caşunca 1 12,5 Public territorial authorities
5. table fish 5
166 Floresti Vărvăreuca Vărvăreuca 1 4,2 Public territorial authorities
5. table fish 5
167 Floresti Vărvăreuca Vărvăreuca 1 2,3 Public territorial authorities
5. table fish 5
168 Floresti Gura Camencii Gura Camencii 1 10,4 Public territorial authorities
5. table fish 5
169 Floresti Gura Camencii Gura Camencii 1 2,5 Public territorial authorities
5. table fish 5
170 Floresti Gura Camencii Gura Camencii 1 2,7 Public territorial authorities
5. table fish 5
171 FlorestiBobuleşti Gura Camencii
Bobuleşti Gura Camencii
1 14,4 Public territorial authorities
5. table fish 5
172 Floresti Domulgeni Domulgeni 1 19,5 Public territorial authorities
5. table fish 5
173 Floresti Frumuşica Frumuşica 1 2,8 Public territorial authorities
5. table fish 5
174 Floresti Frumuşica Frumuşica 1 7,8 Public territorial authorities
5. table fish 5
175 Floresti Frumuşica Frumuşica 1 6,7 Public territorial authorities
5. table fish 5
176 Floresti Bezeni (Izvoare) Bezeni (Izvoare) 1 5,2 Public territorial authorities
5. table fish 5
177 Floresti Bezeni (Izvoare) Bezeni (Izvoare) 1 3,2 Public territorial authorities
5. table fish 5
178 Floresti Izvoare Izvoare 1 2,5 Public territorial authorities
5. table fish 5
179 Floresti Izvoare Izvoare 1 4,0 Public territorial authorities
5. table fish 5
180 Floresti Trifăneşti Trifăneşti 1 3,0 Public territorial authorities
5. table fish 5
181 Floresti Trifăneşti Trifăneşti 1 9,8 Public territorial authorities
5. table fish 5
182 Floresti Trifăneşti Trifăneşti 1 1,7 Public territorial authorities
5. table fish 5
183 Floresti Sevirova Sevirova 1 2,5 Public territorial authorities
5. table fish 5
184 Floresti Sevirova Sevirova 1 4,2 Public territorial authorities
5. table fish 5
185 Floresti Prajila Prajila 1 3,1 Public territorial authorities
5. table fish 5
186 Floresti Prajila Prajila 1 2,9 Public territorial authorities
5. table fish 5
187 Floresti Prajila Prajila 1 2,5 Public territorial authorities
5. table fish 5
188 Floresti Prajila Prajila 1 2,3 Public territorial authorities
5. table fish 5
189 Floresti Prajila Prajila 1 5,3 Public territorial authorities
5. table fish 5
190 FlorestiAntonovca (Prajila)
Antonovca (Prajila)
1 4,2 Public territorial authorities
5. table fish 5
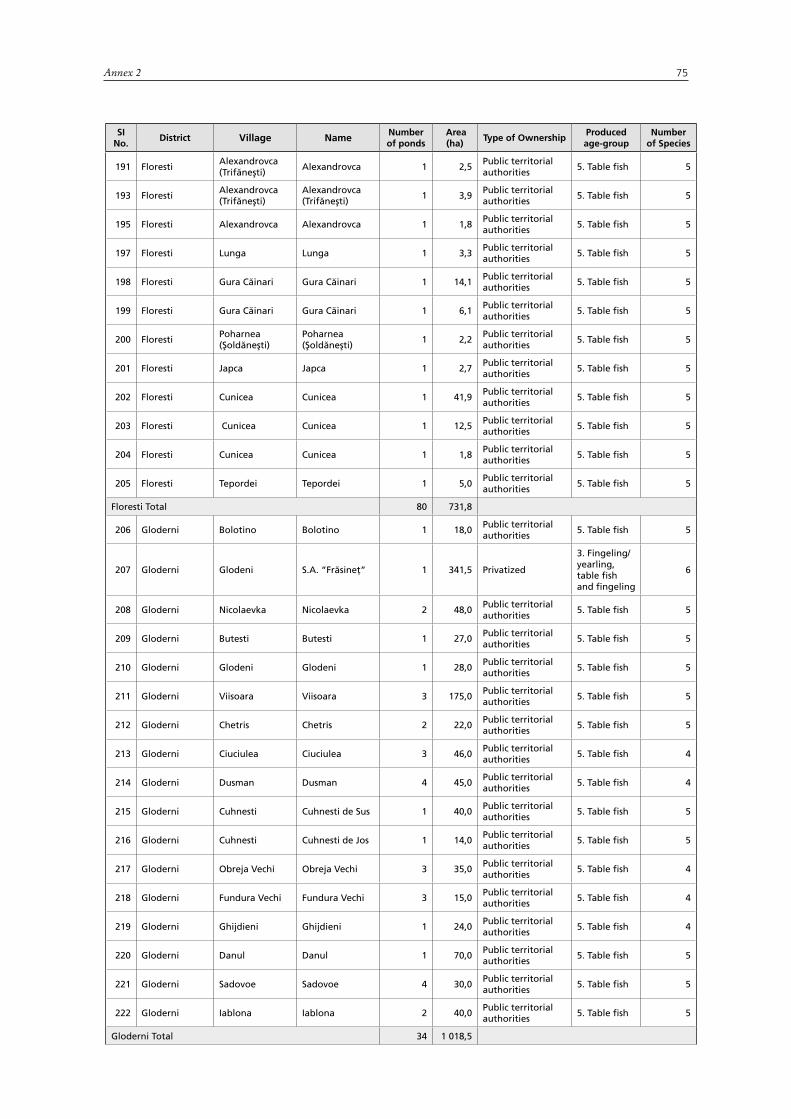
75
si no.
district village name number of ponds
area (ha)
type of ownershipproduced age-group
number of species
191 FlorestiAlexandrovca (Trifăneşti)
Alexandrovca 1 2,5 Public territorial authorities
5. table fish 5
193 FlorestiAlexandrovca (Trifăneşti)
Alexandrovca (Trifăneşti)
1 3,9 Public territorial authorities
5. table fish 5
195 Floresti Alexandrovca Alexandrovca 1 1,8 Public territorial authorities
5. table fish 5
197 Floresti Lunga Lunga 1 3,3 Public territorial authorities
5. table fish 5
198 Floresti Gura Căinari Gura Căinari 1 14,1 Public territorial authorities
5. table fish 5
199 Floresti Gura Căinari Gura Căinari 1 6,1 Public territorial authorities
5. table fish 5
200 FlorestiPoharnea (Şoldăneşti)
Poharnea (Şoldăneşti)
1 2,2 Public territorial authorities
5. table fish 5
201 Floresti Japca Japca 1 2,7 Public territorial authorities
5. table fish 5
202 Floresti Cunicea Cunicea 1 41,9 Public territorial authorities
5. table fish 5
203 Floresti Cunicea Cunicea 1 12,5 Public territorial authorities
5. table fish 5
204 Floresti Cunicea Cunicea 1 1,8 Public territorial authorities
5. table fish 5
205 Floresti Tepordei Tepordei 1 5,0 Public territorial authorities
5. table fish 5
Floresti total 80 731,8
206 Gloderni Bolotino Bolotino 1 18,0 Public territorial authorities
5. table fish 5
207 Gloderni Glodeni S.A. “Frăsineţ” 1 341,5 Privatized
3. Fingeling/yearling, table fish and fingeling
6
208 Gloderni Nicolaevka Nicolaevka 2 48,0 Public territorial authorities
5. table fish 5
209 Gloderni Butesti Butesti 1 27,0 Public territorial authorities
5. table fish 5
210 Gloderni Glodeni Glodeni 1 28,0 Public territorial authorities
5. table fish 5
211 Gloderni Viisoara Viisoara 3 175,0 Public territorial authorities
5. table fish 5
212 Gloderni Chetris Chetris 2 22,0 Public territorial authorities
5. table fish 5
213 Gloderni Ciuciulea Ciuciulea 3 46,0 Public territorial authorities
5. table fish 4
214 Gloderni Dusman Dusman 4 45,0 Public territorial authorities
5. table fish 4
215 Gloderni Cuhnesti Cuhnesti de Sus 1 40,0 Public territorial authorities
5. table fish 5
216 Gloderni Cuhnesti Cuhnesti de Jos 1 14,0 Public territorial authorities
5. table fish 5
217 Gloderni Obreja Vechi Obreja Vechi 3 35,0 Public territorial authorities
5. table fish 4
218 Gloderni Fundura Vechi Fundura Vechi 3 15,0 Public territorial authorities
5. table fish 4
219 Gloderni Ghijdieni Ghijdieni 1 24,0 Public territorial authorities
5. table fish 4
220 Gloderni Danul Danul 1 70,0 Public territorial authorities
5. table fish 5
221 Gloderni Sadovoe Sadovoe 4 30,0 Public territorial authorities
5. table fish 5
222 Gloderni Iablona Iablona 2 40,0 Public territorial authorities
5. table fish 5
Gloderni total 34 1 018,5
Annex 2
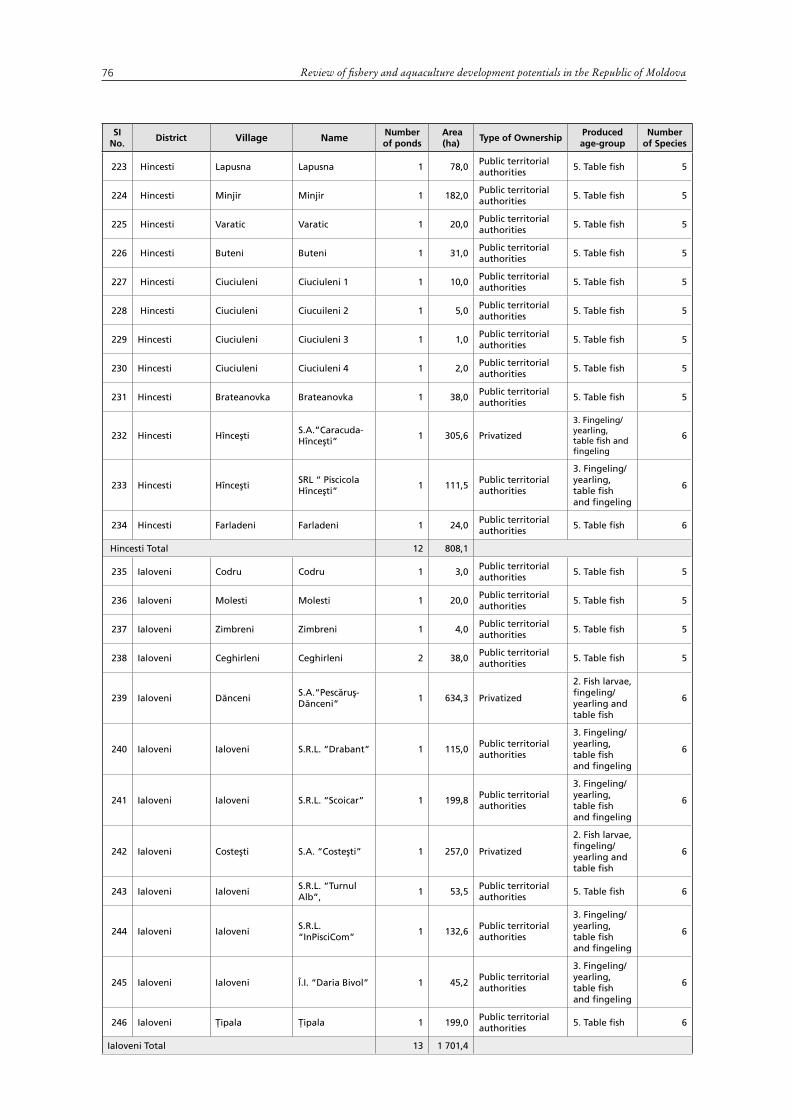
Review of fishery and aquaculture development potentials in the Republic of Moldova76
si no.
district village name number of ponds
area (ha)
type of ownershipproduced age-group
number of species
223 hincesti Lapusna Lapusna 1 78,0 Public territorial authorities
5. table fish 5
224 hincesti Minjir Minjir 1 182,0 Public territorial authorities
5. table fish 5
225 hincesti Varatic Varatic 1 20,0 Public territorial authorities
5. table fish 5
226 hincesti Buteni Buteni 1 31,0 Public territorial authorities
5. table fish 5
227 hincesti Ciuciuleni Ciuciuleni 1 1 10,0 Public territorial authorities
5. table fish 5
228 hincesti Ciuciuleni Ciucuileni 2 1 5,0 Public territorial authorities
5. table fish 5
229 hincesti Ciuciuleni Ciuciuleni 3 1 1,0 Public territorial authorities
5. table fish 5
230 hincesti Ciuciuleni Ciuciuleni 4 1 2,0 Public territorial authorities
5. table fish 5
231 hincesti Brateanovka Brateanovka 1 38,0 Public territorial authorities
5. table fish 5
232 hincesti HînceştiS.A.”Caracuda-Hînceşti”
1 305,6 Privatized
3. Fingeling/yearling, table fish and fingeling
6
233 hincesti HînceştiSRL “ Piscicola Hînceşti”
1 111,5 Public territorial authorities
3. Fingeling/yearling, table fish and fingeling
6
234 hincesti Farladeni Farladeni 1 24,0 Public territorial authorities
5. table fish 6
hincesti total 12 808,1
235 ialoveni Codru Codru 1 3,0 Public territorial authorities
5. table fish 5
236 ialoveni Molesti Molesti 1 20,0 Public territorial authorities
5. table fish 5
237 ialoveni Zimbreni Zimbreni 1 4,0 Public territorial authorities
5. table fish 5
238 ialoveni Ceghirleni Ceghirleni 2 38,0 Public territorial authorities
5. table fish 5
239 ialoveni DănceniS.A.“Pescăruş-Dănceni”
1 634,3 Privatized
2. Fish larvae, fingeling/yearling and table fish
6
240 ialoveni Ialoveni S.R.L. “Drabant” 1 115,0 Public territorial authorities
3. Fingeling/yearling, table fish and fingeling
6
241 ialoveni Ialoveni S.R.L. “Scoicar” 1 199,8 Public territorial authorities
3. Fingeling/yearling, table fish and fingeling
6
242 ialoveni Costeşti S.A. “Costeşti” 1 257,0 Privatized
2. Fish larvae, fingeling/yearling and table fish
6
243 ialoveni IaloveniS.R.L. “Turnul Alb”,
1 53,5 Public territorial authorities
5. table fish 6
244 ialoveni IaloveniS.R.L. “InPisciCom”
1 132,6 Public territorial authorities
3. Fingeling/yearling, table fish and fingeling
6
245 ialoveni Ialoveni Î.I. “Daria Bivol” 1 45,2 Public territorial authorities
3. Fingeling/yearling, table fish and fingeling
6
246 ialoveni Ţipala Ţipala 1 199,0 Public territorial authorities
5. table fish 6
ialoveni total 13 1 701,4
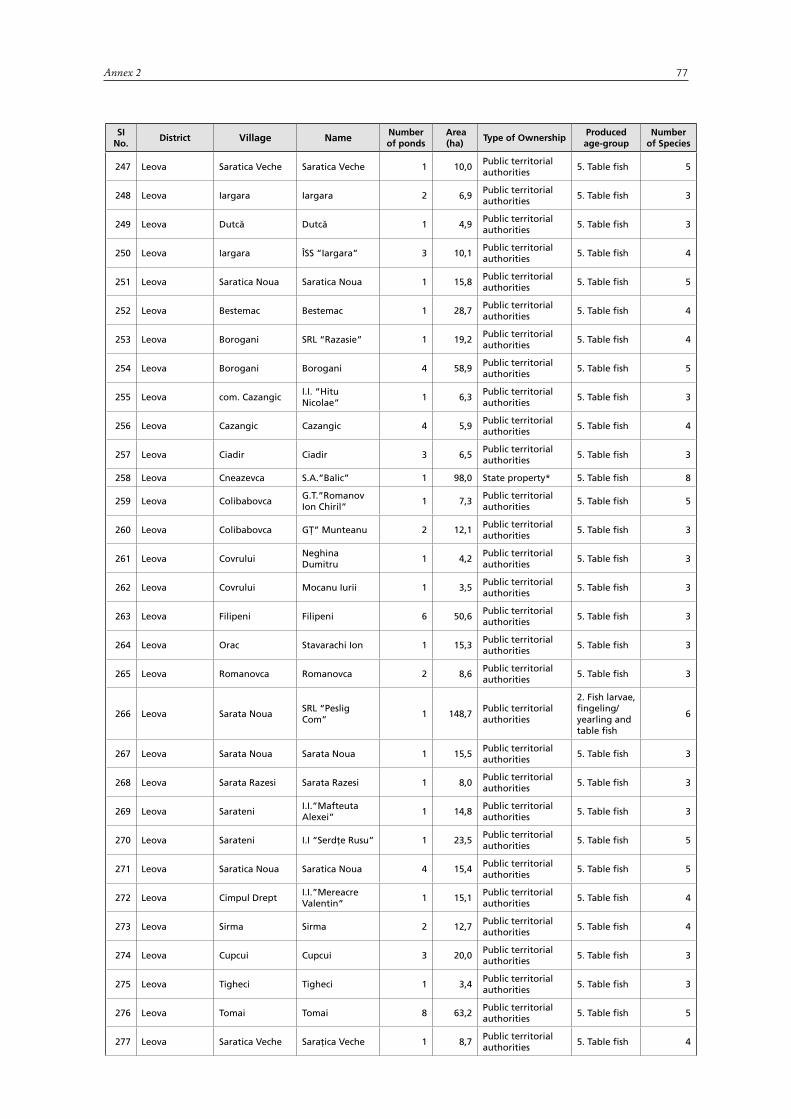
77
si no.
district village name number of ponds
area (ha)
type of ownershipproduced age-group
number of species
247 leova Saratica Veche Saratica Veche 1 10,0 Public territorial authorities
5. table fish 5
248 leova Iargara Iargara 2 6,9 Public territorial authorities
5. table fish 3
249 leova Dutcă Dutcă 1 4,9 Public territorial authorities
5. table fish 3
250 leova Iargara ÎSS “Iargara” 3 10,1 Public territorial authorities
5. table fish 4
251 leova Saratica Noua Saratica Noua 1 15,8 Public territorial authorities
5. table fish 5
252 leova Bestemac Bestemac 1 28,7 Public territorial authorities
5. table fish 4
253 leova Borogani SRL “Razasie” 1 19,2 Public territorial authorities
5. table fish 4
254 leova Borogani Borogani 4 58,9 Public territorial authorities
5. table fish 5
255 leova com. CazangicI.I. “Hitu Nicolae”
1 6,3 Public territorial authorities
5. table fish 3
256 leova Cazangic Cazangic 4 5,9 Public territorial authorities
5. table fish 4
257 leova Ciadir Ciadir 3 6,5 Public territorial authorities
5. table fish 3
258 leova Cneazevca S.A.”Balic” 1 98,0 state property* 5. table fish 8
259 leova ColibabovcaG.T.”Romanov Ion Chiril”
1 7,3 Public territorial authorities
5. table fish 5
260 leova Colibabovca GŢ” Munteanu 2 12,1 Public territorial authorities
5. table fish 3
261 leova CovruluiNeghina Dumitru
1 4,2 Public territorial authorities
5. table fish 3
262 leova Covrului Mocanu Iurii 1 3,5 Public territorial authorities
5. table fish 3
263 leova Filipeni Filipeni 6 50,6 Public territorial authorities
5. table fish 3
264 leova Orac Stavarachi Ion 1 15,3 Public territorial authorities
5. table fish 3
265 leova Romanovca Romanovca 2 8,6 Public territorial authorities
5. table fish 3
266 leova Sarata NouaSRL “Peslig Com”
1 148,7 Public territorial authorities
2. Fish larvae, fingeling/yearling and table fish
6
267 leova Sarata Noua Sarata Noua 1 15,5 Public territorial authorities
5. table fish 3
268 leova Sarata Razesi Sarata Razesi 1 8,0 Public territorial authorities
5. table fish 3
269 leova SarateniI.I.”Mafteuta Alexei”
1 14,8 Public territorial authorities
5. table fish 3
270 leova Sarateni I.I “Serdţe Rusu” 1 23,5 Public territorial authorities
5. table fish 5
271 leova Saratica Noua Saratica Noua 4 15,4 Public territorial authorities
5. table fish 5
272 leova Cimpul DreptI.I.”Mereacre Valentin”
1 15,1 Public territorial authorities
5. table fish 4
273 leova Sirma Sirma 2 12,7 Public territorial authorities
5. table fish 4
274 leova Cupcui Cupcui 3 20,0 Public territorial authorities
5. table fish 3
275 leova Tigheci Tigheci 1 3,4 Public territorial authorities
5. table fish 3
276 leova Tomai Tomai 8 63,2 Public territorial authorities
5. table fish 5
277 leova Saratica Veche Saraţica Veche 1 8,7 Public territorial authorities
5. table fish 4
Annex 2
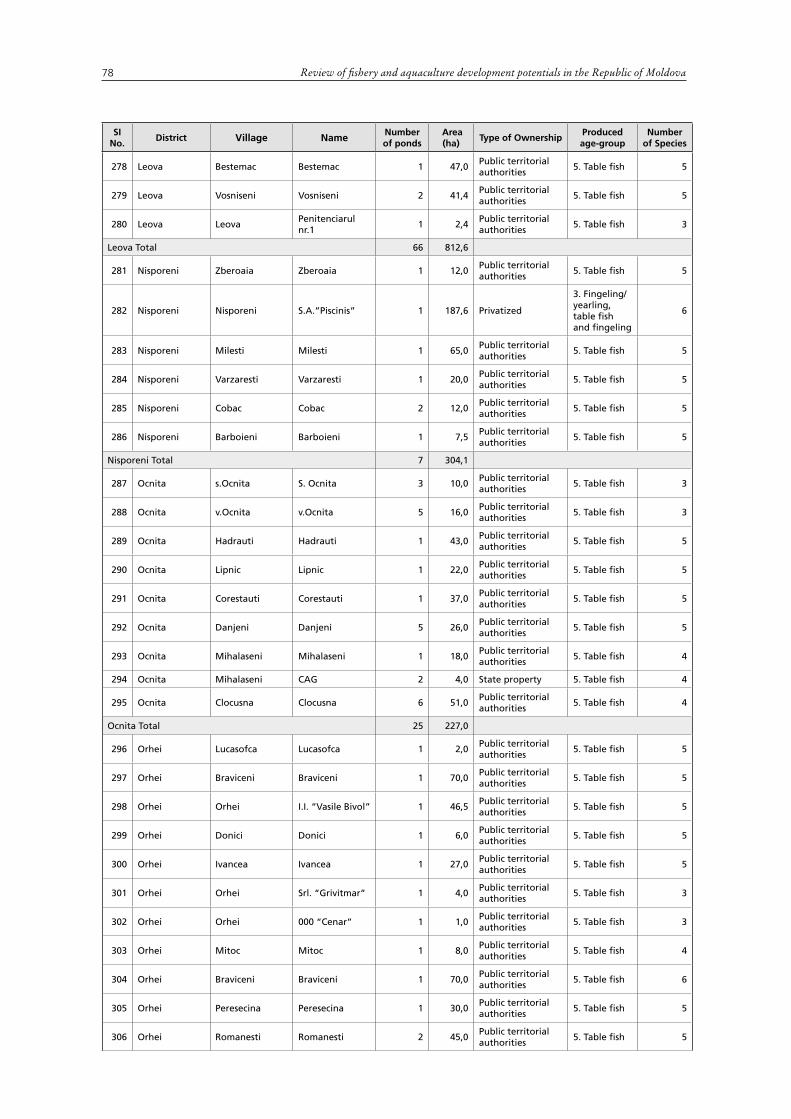
Review of fishery and aquaculture development potentials in the Republic of Moldova78
si no.
district village name number of ponds
area (ha)
type of ownershipproduced age-group
number of species
278 leova Bestemac Bestemac 1 47,0 Public territorial authorities
5. table fish 5
279 leova Vosniseni Vosniseni 2 41,4 Public territorial authorities
5. table fish 5
280 leova LeovaPenitenciarul nr.1
1 2,4 Public territorial authorities
5. table fish 3
leova total 66 812,6
281 Nisporeni Zberoaia Zberoaia 1 12,0 Public territorial authorities
5. table fish 5
282 Nisporeni Nisporeni S.A.”Piscinis” 1 187,6 Privatized
3. Fingeling/yearling, table fish and fingeling
6
283 Nisporeni Milesti Milesti 1 65,0 Public territorial authorities
5. table fish 5
284 Nisporeni Varzaresti Varzaresti 1 20,0 Public territorial authorities
5. table fish 5
285 Nisporeni Cobac Cobac 2 12,0 Public territorial authorities
5. table fish 5
286 Nisporeni Barboieni Barboieni 1 7,5 Public territorial authorities
5. table fish 5
Nisporeni total 7 304,1
287 Ocnita s.Ocnita S. Ocnita 3 10,0 Public territorial authorities
5. table fish 3
288 Ocnita v.Ocnita v.Ocnita 5 16,0 Public territorial authorities
5. table fish 3
289 Ocnita Hadrauti Hadrauti 1 43,0 Public territorial authorities
5. table fish 5
290 Ocnita Lipnic Lipnic 1 22,0 Public territorial authorities
5. table fish 5
291 Ocnita Corestauti Corestauti 1 37,0 Public territorial authorities
5. table fish 5
292 Ocnita Danjeni Danjeni 5 26,0 Public territorial authorities
5. table fish 5
293 Ocnita Mihalaseni Mihalaseni 1 18,0 Public territorial authorities
5. table fish 4
294 Ocnita Mihalaseni CAG 2 4,0 state property 5. table fish 4
295 Ocnita Clocusna Clocusna 6 51,0 Public territorial authorities
5. table fish 4
Ocnita total 25 227,0
296 Orhei Lucasofca Lucasofca 1 2,0 Public territorial authorities
5. table fish 5
297 Orhei Braviceni Braviceni 1 70,0 Public territorial authorities
5. table fish 5
298 Orhei Orhei I.I. “Vasile Bivol” 1 46,5 Public territorial authorities
5. table fish 5
299 Orhei Donici Donici 1 6,0 Public territorial authorities
5. table fish 5
300 Orhei Ivancea Ivancea 1 27,0 Public territorial authorities
5. table fish 5
301 Orhei Orhei Srl. “Grivitmar” 1 4,0 Public territorial authorities
5. table fish 3
302 Orhei Orhei 000 “Cenar” 1 1,0 Public territorial authorities
5. table fish 3
303 Orhei Mitoc Mitoc 1 8,0 Public territorial authorities
5. table fish 4
304 Orhei Braviceni Braviceni 1 70,0 Public territorial authorities
5. table fish 6
305 Orhei Peresecina Peresecina 1 30,0 Public territorial authorities
5. table fish 5
306 Orhei Romanesti Romanesti 2 45,0 Public territorial authorities
5. table fish 5

79
si no.
district village name number of ponds
area (ha)
type of ownershipproduced age-group
number of species
307 Orhei Ciocolteni Ciocolteni 1 6,0 Public territorial authorities
5. table fish 4
308 Orhei Cucuruzeni Cucuruzeni 3 10,0 Public territorial authorities
5. table fish 4
309 Orhei Clisova Clisova 1 6,0 Public territorial authorities
5. table fish 3
Orhei total 17 331,5
310 Rezina Buseuca Buseuca 2 10,0 Public territorial authorities
5. table fish 4
311 RezinaSlobozia Horodiste
Slobozia Horodiste
1 2,2 Public territorial authorities
5. table fish 3
312 Rezina Horodiste Horodiste 2 5,2 Public territorial authorities
5. table fish 3
313 RezinaSlobozia Horodiste
Slobozia Horodiste
3 15,4 Public territorial authorities
5. table fish 4
314 Rezina Lalova Lalova 2 2,0 Public territorial authorities
5. table fish 3
315 Rezina Minceni de Jos Minceni de Jos 1 9,0 Public territorial authorities
5. table fish 3
316 Rezina Papauti Papauti 1 1,0 Public territorial authorities
5. table fish 3
317 Rezina Cuizauca Cuizauca 1 3,8 Public territorial authorities
5. table fish 3
318 Rezina Cogalnice Cogalnice 1 6,4 Public territorial authorities
5. table fish 4
319 Rezina Otac Otac 1 3,5 Public territorial authorities
5. table fish 3
320 Rezina Saharna Noua Saharna Noua 2 8,4 Public territorial authorities
5. table fish 4
321 Rezina Tahnauti Tahnauti 1 24,4 Public territorial authorities
5. table fish 5
322 Rezina Tareuca Tareuca 1 9,8 Public territorial authorities
5. table fish 5
323 Rezina Pecistea Pecistea 1 2,2 Public territorial authorities
5. table fish 3
324 Rezina Pripiceni Pripiceni 2 19,1 Public territorial authorities
5. table fish 3
325 Rezina Trifesti Trifesti 1 18,4 Public territorial authorities
5. table fish 5
326 Rezina Ciniseuti Ciniseuti 3 8,8 Public territorial authorities
5. table fish 4
327 Rezina EchimautiEchimauti: 5objects
5 10,3 Public territorial authorities
5. table fish 4
328 Rezina Roscana Roscana 1 10,4 Public territorial authorities
5. table fish 4
329 Rezina Pecistea Pecistea 1 4,4 Public territorial authorities
5. table fish 4
330 Rezina Ghiduleni Ghiduleni 1 5,0 Public territorial authorities
5. table fish 5
331 Rezina Boseuca Boseuca 1 2,2 Public territorial authorities
5. table fish 5
Rezina total 35 181,9
332 Riscani Riscani S.A.”Acvarium” 1 499,5 Privatized
2. Fish larvae, fingeling/yearling and table fish
6
Riscani total 1 499,5
333 singerei Singerei Sangerei 18 103,8 Public territorial authorities
5. table fish 5
334 singerei Singerei S.A.”Peşte” 1 619,1 Privatized
3. Fingeling/yearling, table fish and fingeling
6
Annex 2
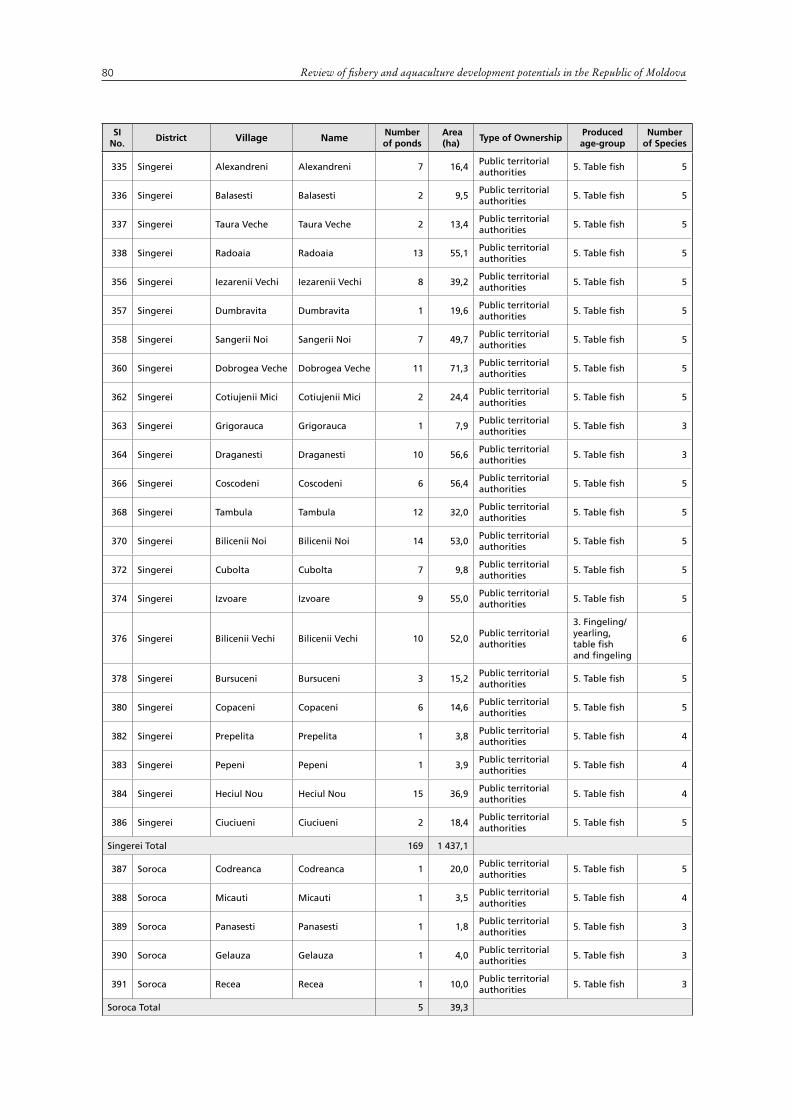
Review of fishery and aquaculture development potentials in the Republic of Moldova80
si no.
district village name number of ponds
area (ha)
type of ownershipproduced age-group
number of species
335 singerei Alexandreni Alexandreni 7 16,4 Public territorial authorities
5. table fish 5
336 singerei Balasesti Balasesti 2 9,5 Public territorial authorities
5. table fish 5
337 singerei Taura Veche Taura Veche 2 13,4 Public territorial authorities
5. table fish 5
338 singerei Radoaia Radoaia 13 55,1 Public territorial authorities
5. table fish 5
356 singerei Iezarenii Vechi Iezarenii Vechi 8 39,2 Public territorial authorities
5. table fish 5
357 singerei Dumbravita Dumbravita 1 19,6 Public territorial authorities
5. table fish 5
358 singerei Sangerii Noi Sangerii Noi 7 49,7 Public territorial authorities
5. table fish 5
360 singerei Dobrogea Veche Dobrogea Veche 11 71,3 Public territorial authorities
5. table fish 5
362 singerei Cotiujenii Mici Cotiujenii Mici 2 24,4 Public territorial authorities
5. table fish 5
363 singerei Grigorauca Grigorauca 1 7,9 Public territorial authorities
5. table fish 3
364 singerei Draganesti Draganesti 10 56,6 Public territorial authorities
5. table fish 3
366 singerei Coscodeni Coscodeni 6 56,4 Public territorial authorities
5. table fish 5
368 singerei Tambula Tambula 12 32,0 Public territorial authorities
5. table fish 5
370 singerei Bilicenii Noi Bilicenii Noi 14 53,0 Public territorial authorities
5. table fish 5
372 singerei Cubolta Cubolta 7 9,8 Public territorial authorities
5. table fish 5
374 singerei Izvoare Izvoare 9 55,0 Public territorial authorities
5. table fish 5
376 singerei Bilicenii Vechi Bilicenii Vechi 10 52,0 Public territorial authorities
3. Fingeling/yearling, table fish and fingeling
6
378 singerei Bursuceni Bursuceni 3 15,2 Public territorial authorities
5. table fish 5
380 singerei Copaceni Copaceni 6 14,6 Public territorial authorities
5. table fish 5
382 singerei Prepelita Prepelita 1 3,8 Public territorial authorities
5. table fish 4
383 singerei Pepeni Pepeni 1 3,9 Public territorial authorities
5. table fish 4
384 singerei Heciul Nou Heciul Nou 15 36,9 Public territorial authorities
5. table fish 4
386 singerei Ciuciueni Ciuciueni 2 18,4 Public territorial authorities
5. table fish 5
singerei total 169 1 437,1
387 soroca Codreanca Codreanca 1 20,0 Public territorial authorities
5. table fish 5
388 soroca Micauti Micauti 1 3,5 Public territorial authorities
5. table fish 4
389 soroca Panasesti Panasesti 1 1,8 Public territorial authorities
5. table fish 3
390 soroca Gelauza Gelauza 1 4,0 Public territorial authorities
5. table fish 3
391 soroca Recea Recea 1 10,0 Public territorial authorities
5. table fish 3
soroca total 5 39,3

81
si no.
district village name number of ponds
area (ha)
type of ownershipproduced age-group
number of species
392 soldanesti Vadul Rascov Vadul Rascov 1 2,0 Public territorial authorities
5. table fish 3
soldanesti total 1 2,0
393 stefan voda Volontirovka Volontirovka 1 45,0 Public territorial authorities
5. table fish 5
394 stefan voda Volontiri Hadjilar 1 250,0 state property* 5. table fish 6
395 stefan voda Stefan VodăS.R.L. “Comnival”
1 253,4 Public territorial authorities
3. Fingeling/yearling, table fish and fingeling
6
396 stefan voda Stefan Voda Stefan Voda 1 8,0 Public territorial authorities
5. table fish 5
397 stefan voda Stefanesti Stefanesti 1 20,0 Public territorial authorities
5. table fish 5
398 stefan voda Carahasani Karahasani 1 7,0 Public territorial authorities
5. table fish 5
399 stefan voda Caplani Caplani 1 185,0 state property* 5. table fish 6
stefan voda total 7 768,4
400 straseni Codreanca Codreanca 1 20,0 Public territorial authorities
5. table fish 4
401 straseni VartraG.T.”Victoria Stavila”
1 23,4 Public territorial authorities
5. table fish 5
402 straseni Micauţi Micauţi 1 3,5 Public territorial authorities
5. table fish 4
403 straseni Panasesti Panasesti 1 1,8 Public territorial authorities
5. table fish 3
404 straseni Nigresti Nigresti 1 5,0 Public territorial authorities
5. table fish 5
405 straseni Ghelauza Ghelauza 1 4,0 Public territorial authorities
5. table fish 4
406 straseni Recea Recea 1 10,0 Public territorial authorities
5. table fish 4
straseni total 7 67,7
407 taraclia Musait Musait 1 25,0 Public territorial authorities
5. table fish 5
408 taraclia Taraclia“Aquaculture-Moldova” - Taraclia Branch
1 890,0 state property4. table fish and brood fish
8
409 taraclia Salcia Salcia 1 60,0 state property* 5. table fish 6
410 taraclia TaracliaStalin’s upper pond
1 8,0 Public territorial authorities
5. table fish 3
411 taraclia TaracliaStalin’s lower pond
1 17,0 Public territorial authorities
5. table fish 4
412 taraclia Cairaclia upper Cairaclia upper 1 8,0 Public territorial authorities
5. table fish 4
413 taraclia Cairaclia lower Cairaclia lower 1 6,0 Public territorial authorities
5. table fish 3
414 taraclia Valea Pergei Valea Pergei 1 50,0 Public territorial authorities
5. table fish 5
415 taraclia Vinogradovca Vinogradovca 1 10,0 Public territorial authorities
5. table fish 3
416 taraclia Vinogradovca Mussait 1 25,0 Public territorial authorities
5. table fish 5
417 taraclia Corten Corten 1 50,0 Public territorial authorities
5. table fish 5
418 taraclia Tvardita Tvardita 2 18,0 Public territorial authorities
5. table fish 5
taraclia total 13 1 167,0
419 telenesti Codru Nou Codru Nou 1 16,0 Public territorial authorities
5. table fish 5
Annex 2

Review of fishery and aquaculture development potentials in the Republic of Moldova82
si no.
district village name number of ponds
area (ha)
type of ownershipproduced age-group
number of species
420 telenesti Suhuluceni Suhuluceni 1 30,0 Public territorial authorities
6. No information
5
421 telenesti Vasieni Vasieni 2 14,0 Public territorial authorities
5. table fish 4
422 telenesti Crasnoseni Crasnoseni 1 20,0 Public territorial authorities
5. table fish 5
423 telenesti Crasnoseni Crasnoseni 2 40,0 Public territorial authorities
5. table fish 5
424 telenesti Budai Budai 2 33,0 Public territorial authorities
5. table fish 4
425 telenesti Codru Codru 1 20,0 Public territorial authorities
5. table fish 4
426 telenesti Mindresti Mindresti 2 16,0 Public territorial authorities
5. table fish 4
427 telenesti Mihalasa Mihalasa 1 10,0 Public territorial authorities
5. table fish 3
428 telenesti Cozaesti Cozesti 1 4,0 Public territorial authorities
5. table fish 3
429 telenesti Giliceni Giliceni 1 4,0 Public territorial authorities
5. table fish 3
430 telenesti Chitcani Chitcani 1 20,0 Public territorial authorities
5. table fish 4
431 telenesti Chistelinita Chistelinita 1 50,0 Public territorial authorities
5. table fish 5
432 telenesti Scorteni Scorteni 1 40,0 Public territorial authorities
5. table fish 5
433 telenesti Ignatei Ignatei 1 24,0 Public territorial authorities
5. table fish 5
434 telenesti Telenesti “Aquaculture-Moldova” - Telenesti Branch
1 566,0 state property
1. Fish larvae, fingeling/yearling, table fish and brood fish
9
telenesti total 20 907,0
435 Ungheni Sinesti: 2 objects Sinesti 2 14,0 Public territorial authorities
5. table fish 3
436 Ungheni Ungheni S.A.”Piscicultorul” 1 459,2 Privatized
3. Fingeling/yearling, table fish and fingeling
6
437 UngheniGrazanca graznca
S.R.L..„UNSEDOR”
1 15,0 Public territorial authorities
6. No information
4
438 Ungheni Todoresti S.R.L.„Alcat” 1 20,0 Public territorial authorities
6. No information
4
439 Ungheni ZagoranceaSRL „Scoropad Alexandr”
1 82,0 Public territorial authorities
5. table fish 5
440 Ungheni UngheniSRL „Plaga Noua”
1 28,0 Public territorial authorities
6. No information
4
441 Ungheni Ungheni “Comsomoliscoe” 1 100,0 Public territorial authorities
5. table fish 7
442 Ungheni Busilo Busilo 1 40,0 Public territorial authorities
5. table fish 5
Ungheni total 9 758,2
443 vulcanesti Vulcanesti Vulcanesti 1 37,6 Public territorial authorities
5. table fish 5
444 vulcanesti Cismicoi Cismicoi 1 134,5 Public territorial authorities
5. table fish 5
445 vulcanesti Etulia Etulia 1 267,1 Public territorial authorities
3. Fingeling/yearling, table fish and fingeling
6
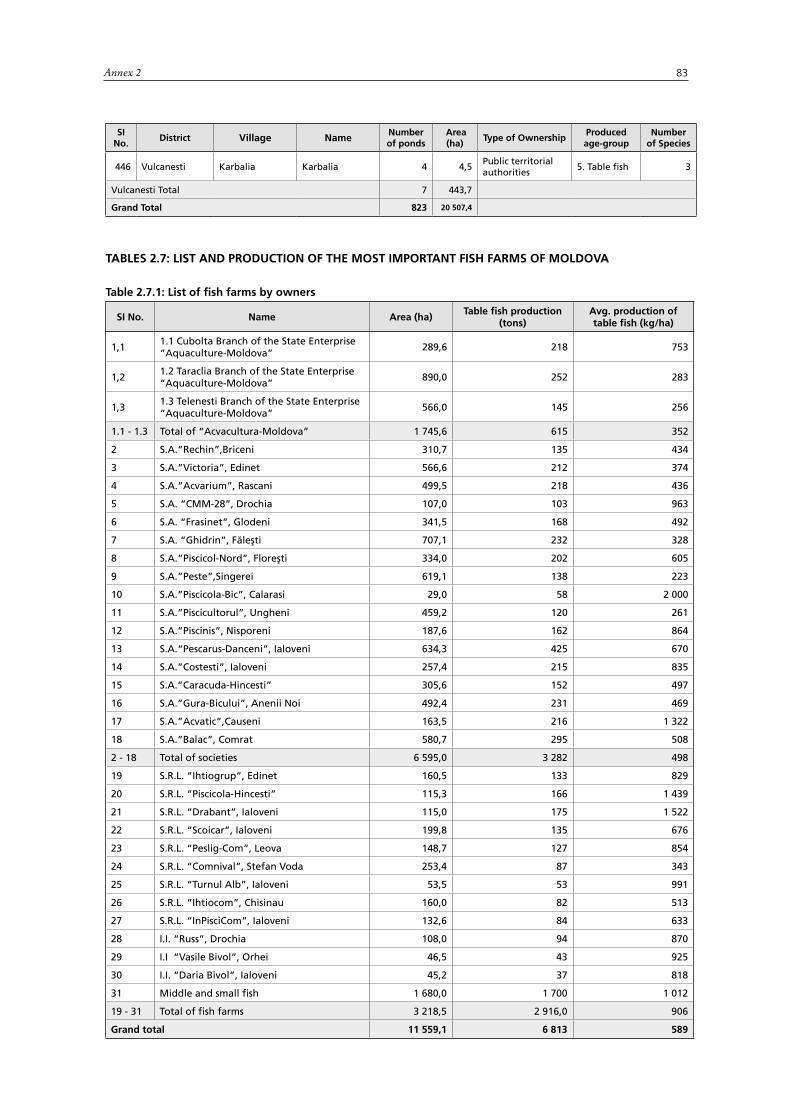
83
si no.
district village name number of ponds
area (ha)
type of ownershipproduced age-group
number of species
446 vulcanesti Karbalia Karbalia 4 4,5 Public territorial authorities
5. table fish 3
vulcanesti total 7 443,7
Grand total 823 20 507,4
tables 2.7: list and pRoduction of the most impoRtant fish faRms of moldova
table 2.7.1: list of fish farms by owners
si no. name area (ha)table fish production
(tons)avg. production of table fish (kg/ha)
1,11.1 Cubolta Branch of the State Enterprise “Aquaculture-Moldova”
289,6 218 753
1,21.2 Taraclia Branch of the State Enterprise “Aquaculture-Moldova”
890,0 252 283
1,31.3 Telenesti Branch of the State Enterprise “Aquaculture-Moldova”
566,0 145 256
1.1 - 1.3 Total of “Acvacultura-Moldova” 1 745,6 615 352
2 S.A.”Rechin”,Briceni 310,7 135 434
3 S.A.”Victoria”, Edinet 566,6 212 374
4 S.A.”Acvarium”, Rascani 499,5 218 436
5 S.A. “CMM-28”, Drochia 107,0 103 963
6 S.A. “Frasinet”, Glodeni 341,5 168 492
7 S.A. “Ghidrin”, Făleşti 707,1 232 328
8 S.A.”Piscicol-Nord”, Floreşti 334,0 202 605
9 S.A.”Peste”,Singerei 619,1 138 223
10 S.A.”Piscicola-Bic”, Calarasi 29,0 58 2 000
11 S.A.”Piscicultorul”, Ungheni 459,2 120 261
12 S.A.”Piscinis”, Nisporeni 187,6 162 864
13 S.A.“Pescarus-Danceni”, Ialoveni 634,3 425 670
14 S.A.”Costesti”, Ialoveni 257,4 215 835
15 S.A.”Caracuda-Hincesti” 305,6 152 497
16 S.A.”Gura-Bicului”, Anenii Noi 492,4 231 469
17 S.A.”Acvatic”,Causeni 163,5 216 1 322
18 S.A.”Balac”, Comrat 580,7 295 508
2 - 18 Total of societies 6 595,0 3 282 498
19 S.R.L. “Ihtiogrup”, Edinet 160,5 133 829
20 S.R.L. “Piscicola-Hincesti” 115,3 166 1 439
21 S.R.L. “Drabant”, Ialoveni 115,0 175 1 522
22 S.R.L. “Scoicar”, Ialoveni 199,8 135 676
23 S.R.L. “Peslig-Com”, Leova 148,7 127 854
24 S.R.L. “Comnival”, Stefan Voda 253,4 87 343
25 S.R.L. “Turnul Alb”, Ialoveni 53,5 53 991
26 S.R.L. “Ihtiocom”, Chisinau 160,0 82 513
27 S.R.L. “InPisciCom”, Ialoveni 132,6 84 633
28 I.I. “Russ”, Drochia 108,0 94 870
29 I.I “Vasile Bivol”, Orhei 46,5 43 925
30 I.I. “Daria Bivol”, Ialoveni 45,2 37 818
31 Middle and small fish 1 680,0 1 700 1 012
19 - 31 Total of fish farms 3 218,5 2 916,0 906
Grand total 11 559,1 6 813 589
Annex 2
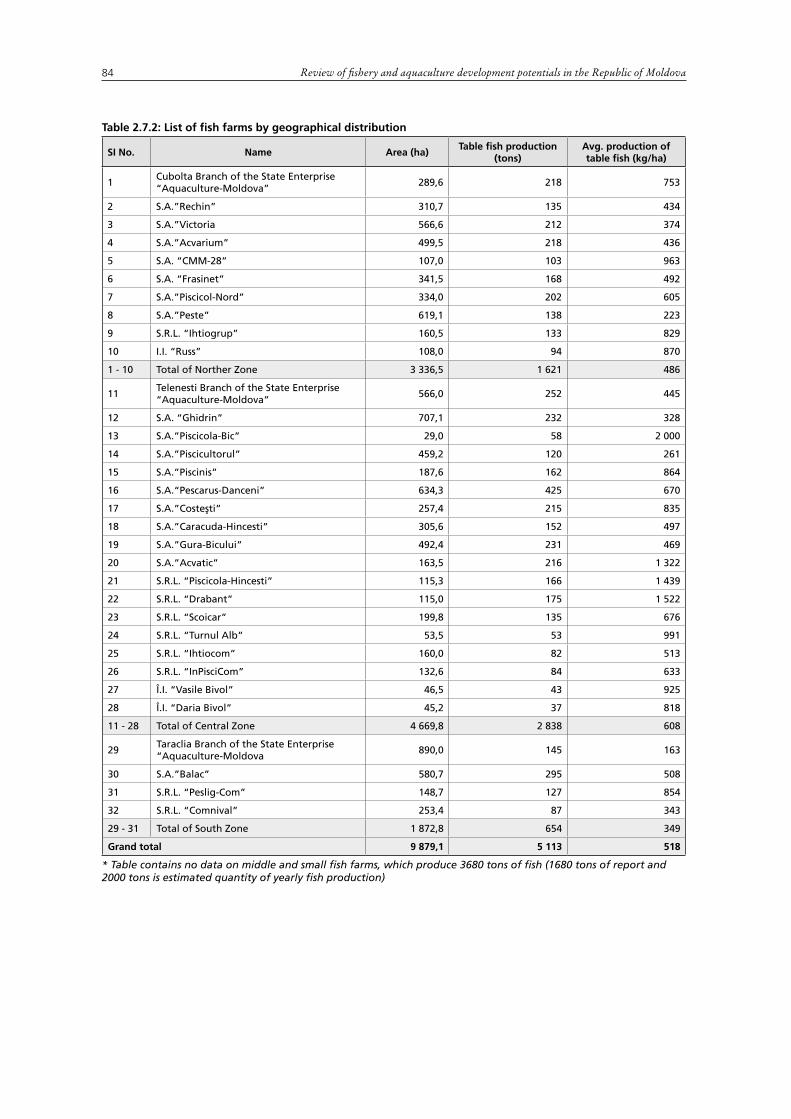
Review of fishery and aquaculture development potentials in the Republic of Moldova84
table 2.7.2: list of fish farms by geographical distribution
si no. name area (ha)table fish production
(tons)avg. production of table fish (kg/ha)
1Cubolta Branch of the State Enterprise “Aquaculture-Moldova”
289,6 218 753
2 S.A.”Rechin” 310,7 135 434
3 S.A.”Victoria 566,6 212 374
4 S.A.”Acvarium” 499,5 218 436
5 S.A. “CMM-28” 107,0 103 963
6 S.A. “Frasinet” 341,5 168 492
7 S.A.”Piscicol-Nord” 334,0 202 605
8 S.A.”Peste” 619,1 138 223
9 S.R.L. “Ihtiogrup” 160,5 133 829
10 I.I. “Russ” 108,0 94 870
1 - 10 Total of Norther Zone 3 336,5 1 621 486
11Telenesti Branch of the State Enterprise “Aquaculture-Moldova”
566,0 252 445
12 S.A. “Ghidrin” 707,1 232 328
13 S.A.”Piscicola-Bic” 29,0 58 2 000
14 S.A.”Piscicultorul” 459,2 120 261
15 S.A.”Piscinis” 187,6 162 864
16 S.A.“Pescarus-Danceni” 634,3 425 670
17 S.A.”Costeşti” 257,4 215 835
18 S.A.”Caracuda-Hincesti” 305,6 152 497
19 S.A.”Gura-Bicului” 492,4 231 469
20 S.A.”Acvatic” 163,5 216 1 322
21 S.R.L. “Piscicola-Hincesti” 115,3 166 1 439
22 S.R.L. “Drabant” 115,0 175 1 522
23 S.R.L. “Scoicar” 199,8 135 676
24 S.R.L. “Turnul Alb” 53,5 53 991
25 S.R.L. “Ihtiocom” 160,0 82 513
26 S.R.L. “InPisciCom” 132,6 84 633
27 Î.I. “Vasile Bivol” 46,5 43 925
28 Î.I. “Daria Bivol” 45,2 37 818
11 - 28 Total of Central Zone 4 669,8 2 838 608
29Taraclia Branch of the State Enterprise “Aquaculture-Moldova
890,0 145 163
30 S.A.”Balac” 580,7 295 508
31 S.R.L. “Peslig-Com” 148,7 127 854
32 S.R.L. “Comnival” 253,4 87 343
29 - 31 Total of South Zone 1 872,8 654 349
Grand total 9 879,1 5 113 518
* Table contains no data on middle and small fish farms, which produce 3680 tons of fish (1680 tons of report and 2000 tons is estimated quantity of yearly fish production)

85Annex 2
table 2.8: fishes of moldova according to different sources
order - latin family - latin scientific nameboth
sourcesfishbase
institute of Zoology
total
acipenserifirmes AcipenseridaeAcipenser guldenstaedtii
- - 1 1
acipenserifirmes Acipenseridae Acipenser nudiventris - 1 - 1
acipenserifirmes Acipenseridae Acipenser ruthenus 1 - - 1
acipenserifirmes Acipenseridae Acipenser stellatus 1 - - 1
acipenserifirmes Acipenseridae huso huso 1 - - 1
acipenserifirmes Acipenseridae total 3 1 1 5
acipenserifirmes Polyodonidae Polyodon spathula - - 1 1
acipenserifirmes Polyodonidae total - - 1 1
acipenserifirmes total 3 1 2 6
anguilliformes Anguillidae Anguilla anguilla 1 - - 1
anguilliformes Anguillidae total 1 - - 1
anguilliformes total 1 - - 1
clupeiformes Clupeidae Alosa caspia caspia - - 1 1
clupeiformes Clupeidae Alosa immaculata - - 1 1
clupeiformes ClupeidaeClupeonella cultriventris
- - 1 1
clupeiformes Clupeidae total - - 3 3
clupeiformes total - - 3 3
cypriniformes Cobitidaesabanejewia aurata aurata
- - 1 1
cypriniformes Cobitidae Cobitis taenia - - 1 1
cypriniformes CobitidaeCobitis rossomeridionalis
- 1 - 1
cypriniformes Cobitidae Misgurnus fossilis 1 - - 1
cypriniformes Cobitidae total 1 1 2 4
cypriniformes balitoridae barbatula barbatula 1 - - 1
cypriniformes balitoridae total 1 - - 1
cypriniformes Cyprinidae Abramis brama 1 - - 1
cypriniformes CyprinidaeAlburnoides bipunctatus
1 - - 1
cypriniformes Cyprinidae Alburnus alburnus 1 - - 1
cypriniformes Cyprinidaehypophthalmichthys nobilis
1 - - 1
cypriniformes Cyprinidae Aspius aspius 1 - - 1
cypriniformes Cyprinidae ballerus ballerus 1 - - 1
cypriniformes Cyprinidae ballerus sapa 1 - - 1
cypriniformes Cyprinidae barbus barbus 1 - - 1
cypriniformes Cyprinidae barbus meridionalis 1 - - 1
cypriniformes Cyprinidae barbus cyclolepis 1 - - 1
cypriniformes Cyprinidae blicca bjoerkna 1 - - 1
cypriniformes CyprinidaeCarassius auratus auratus
1 - - 1
cypriniformes Cyprinidae Carassius carassius 1 - - 1
cypriniformes Cyprinidae Carassius gibelio 1 - - 1
cypriniformes Cyprinidae Chondrostoma nasus 1 - - 1
cypriniformes CyprinidaeCtenopharyngodon idella
1 - - 1
cypriniformes CyprinidaeCyprinus carpio carpio
1 - - 1
cypriniformes Cyprinidae Gobio gobio 1 - - 1
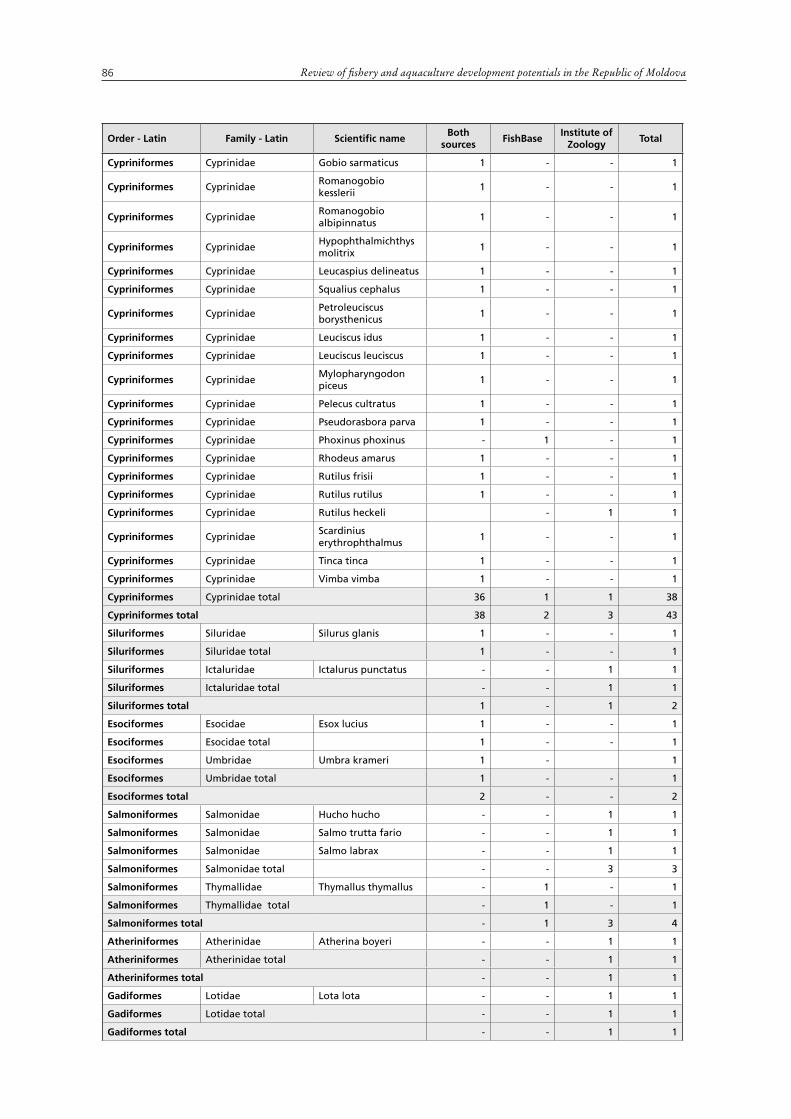
Review of fishery and aquaculture development potentials in the Republic of Moldova86
order - latin family - latin scientific nameboth
sourcesfishbase
institute of Zoology
total
cypriniformes Cyprinidae Gobio sarmaticus 1 - - 1
cypriniformes CyprinidaeRomanogobio kesslerii
1 - - 1
cypriniformes CyprinidaeRomanogobio albipinnatus
1 - - 1
cypriniformes Cyprinidaehypophthalmichthys molitrix
1 - - 1
cypriniformes Cyprinidae leucaspius delineatus 1 - - 1
cypriniformes Cyprinidae squalius cephalus 1 - - 1
cypriniformes CyprinidaePetroleuciscus borysthenicus
1 - - 1
cypriniformes Cyprinidae leuciscus idus 1 - - 1
cypriniformes Cyprinidae leuciscus leuciscus 1 - - 1
cypriniformes CyprinidaeMylopharyngodon piceus
1 - - 1
cypriniformes Cyprinidae Pelecus cultratus 1 - - 1
cypriniformes Cyprinidae Pseudorasbora parva 1 - - 1
cypriniformes Cyprinidae Phoxinus phoxinus - 1 - 1
cypriniformes Cyprinidae Rhodeus amarus 1 - - 1
cypriniformes Cyprinidae Rutilus frisii 1 - - 1
cypriniformes Cyprinidae Rutilus rutilus 1 - - 1
cypriniformes Cyprinidae Rutilus heckeli - 1 1
cypriniformes Cyprinidaescardinius erythrophthalmus
1 - - 1
cypriniformes Cyprinidae tinca tinca 1 - - 1
cypriniformes Cyprinidae vimba vimba 1 - - 1
cypriniformes Cyprinidae total 36 1 1 38
cypriniformes total 38 2 3 43
siluriformes siluridae silurus glanis 1 - - 1
siluriformes siluridae total 1 - - 1
siluriformes ictaluridae ictalurus punctatus - - 1 1
siluriformes ictaluridae total - - 1 1
siluriformes total 1 - 1 2
esociformes Esocidae Esox lucius 1 - - 1
esociformes Esocidae total 1 - - 1
esociformes Umbridae Umbra krameri 1 - 1
esociformes Umbridae total 1 - - 1
esociformes total 2 - - 2
salmoniformes salmonidae hucho hucho - - 1 1
salmoniformes salmonidae salmo trutta fario - - 1 1
salmoniformes salmonidae salmo labrax - - 1 1
salmoniformes salmonidae total - - 3 3
salmoniformes thymallidae thymallus thymallus - 1 - 1
salmoniformes thymallidae total - 1 - 1
salmoniformes total - 1 3 4
atheriniformes Atherinidae Atherina boyeri - - 1 1
atheriniformes Atherinidae total - - 1 1
atheriniformes total - - 1 1
Gadiformes lotidae lota lota - - 1 1
Gadiformes lotidae total - - 1 1
Gadiformes total - - 1 1

87
order - latin family - latin scientific nameboth
sourcesfishbase
institute of Zoology
total
Gasterosteiformes GasterosteidaeGasterosteus aculeatus aculeatus
1 - - 1
Gasterosteiformes Gasterosteidae Pungitius platigaster 1 - - 1
Gasterosteiformes Gasterosteidae total 2 - - 2
Gasterosteiformes total 2 - - 2
syngnathiformes syngnathidae syngnathus abaster - - 1 1
syngnathiformes syngnathidae syngnathus typhle - - 1 1
syngnathiformes syngnathidae total - - 2 2
syngnathiformes total - - 2 2
scorpaeniformes Cottidae Cottus gobio - 1 - 1
scorpaeniformes Cottidae Cottus poecilopus - 1 - 1
scorpaeniformes Cottidae total - 2 - 2
scorpaeniformes total - 2 - 2
perciformes Percidae Perca fluviatilis 1 - - 1
perciformes Percidae Percarina demidoffi - 1 - 1
perciformes Percidae sander lucioperca - - 1 1
perciformes Percidae sander volgensis - - 1 1
perciformes Percidae Gymnocephalus cernua - - 1 1
perciformes PercidaeGymnocephalus acerina
- - 1 1
perciformes PercidaeGymnocephalus schraetser
- - 1 1
perciformes Percidae Zingel streber - - 1 1
perciformes Percidae Zingel zingel 1 - - 1
perciformes Percidae total 2 1 6 9
perciformes Centrarchidae lepomis gibbosus 1 - - 1
perciformes Centrarchidae total 1 - - 1
perciformes Gobiidae benthophilus stellatus 1 - - 1
perciformes Gobiidae benthophilus nudus - 1 - 1
perciformes Gobiidae Caspiosoma caspium - 1 1 2
perciformes Gobiidaeknipowitschia longecaudata
- - 1 1
perciformes GobiidaeMesogobius batrachocephalus
- - 1 1
perciformes Gobiidae Ponticola kessleri 1 - - 1
perciformes Gobiidae Neogobius fluviatilis - - 1 1
perciformes GobiidaeNeogobius gymnotrachelus
- - 1 1
perciformes GobiidaeNeogobius melanostomus
- - 1 1
perciformes GobiidaeProterorhinus semilunaris
1 - - 1
perciformes GobiidaeZosterisessor ophiocephalus
- - 1 1
perciformes Gobiidae total 3 2 7 12
perciformes Eliotrididae Perccottus glenii - - 1 1
perciformes Eliotrididae total - - 1 1
perciformes total 6 3 14 23
mugiliformes Mugilidae Mugil soiuy - - 1 1
mugiliformes Mugilidae total - - 1 1
mugiliformes total - - 1 1
Ray-finned fishes total 53 9 31 93
Source: institute of Zoology 2006-2010 report
Annex 2


89
annex 3
economic data on the fisheRies and aquacultuRe sectoR of the Republic of moldova
table 3.1: Results of captuRe fisheRies in ReseRvoiRs and RiveRs of moldova between 1991 and 2010
type of waters
1991 1992 1993 1994 1995 1996 1997 1998 1999 2000 2001 2002 2003 2004 2005 2006 2007 2008 2009 2010
tons
Reservoirs 77 112 78 108 115 14 10 7 8 12 23 27 40 68 29 27 12 21 16 27
Rivers 15 12 12 10 12 12 16 14 3 13 6 11 19 16 27 25 13 15 11 17
total 92 24 90 18 127 26 26 21 11 25 29 38 59 84 56 52 25 36 27 44
Source: institute of Zoology 2006-2010 report
table 3.2: the dynamics of industRial fishinG in RiveRs of moldova between 1991 and 2010
years
cyp
rinu
s carpio
carpio
ab
ramis b
rama
sand
er lucio
perca
Ru
tilus ru
tilus, R
utilu
s h
eckeli
carassiu
s gib
elio
pelecus cu
ltratus
siluru
s glan
is
esox lu
cius
perca flu
viatilis
blicca b
joerkn
a
oth
er species
total
tons
1991 1,2 1,6 0,7 9,2 2,3 - - - - - - 15
1992 0,1 6,3 0,1 3,7 1,8 - - - - - - 12
1993 0,1 6,4 0,1 4,6 0,8 - - - - - - 12
1994 - 6,2 0,1 2,2 0,7 - - 0,8 - - - 10
1995 - 0,3 - 9,9 0,8 0,5 0,5 - - - - 12
1996 0,6 9,3 - 1,2 0,9 - - - - - - 12
1997 0,3 11,0 0,5 2,8 1,4 - - - - - - 16
1998 0,3 9,2 - 0,5 4,0 - - - - - - 14
1999 - 2,1 - 0,2 0,7 - - - - - - 3
2000 - 9,5 - 2,5 0,5 - - - - - 0,5 13
2001 0,3 1,7 - 2,4 0,7 - 0,5 - - - 0,4 6
2002 0,5 3,2 0,2 1,9 1,5 - 0,5 0,7 0,4 0,6 1,5 11
2003 0,9 5,6 0,3 3,1 2,0 - 1,0 1,2 1,3 0,8 2,8 19
2004 0,7 4,8 0,5 3,4 2,4 0,8 1,0 2,4 16
2005 1,3 14,6 1,7 2,3 - 0,7 1,0 1,2 4,2 27
2006 1,5 9,6 1,4 3,2 1,8 0,5 0,6 1,2 1,3 3,9 25
2007 1,1 3,7 0,9 3,3 2,2 0,1 0,3 0,6 0,6 0,2 13
2008 1,3 3,9 1,1 1,0 2,1 0,2 0,4 0,7 0,6 3,7 15
2009 1,1 4,3 1,2 0,8 2,3 0,1 0,3 0,3 0,2 0,4 11
2010 1,8 7,0 1,6 0,5 4,1 - 0,2 0,7 0,4 - 0,7 17
Source: institute of Zoology 2006-2010 report
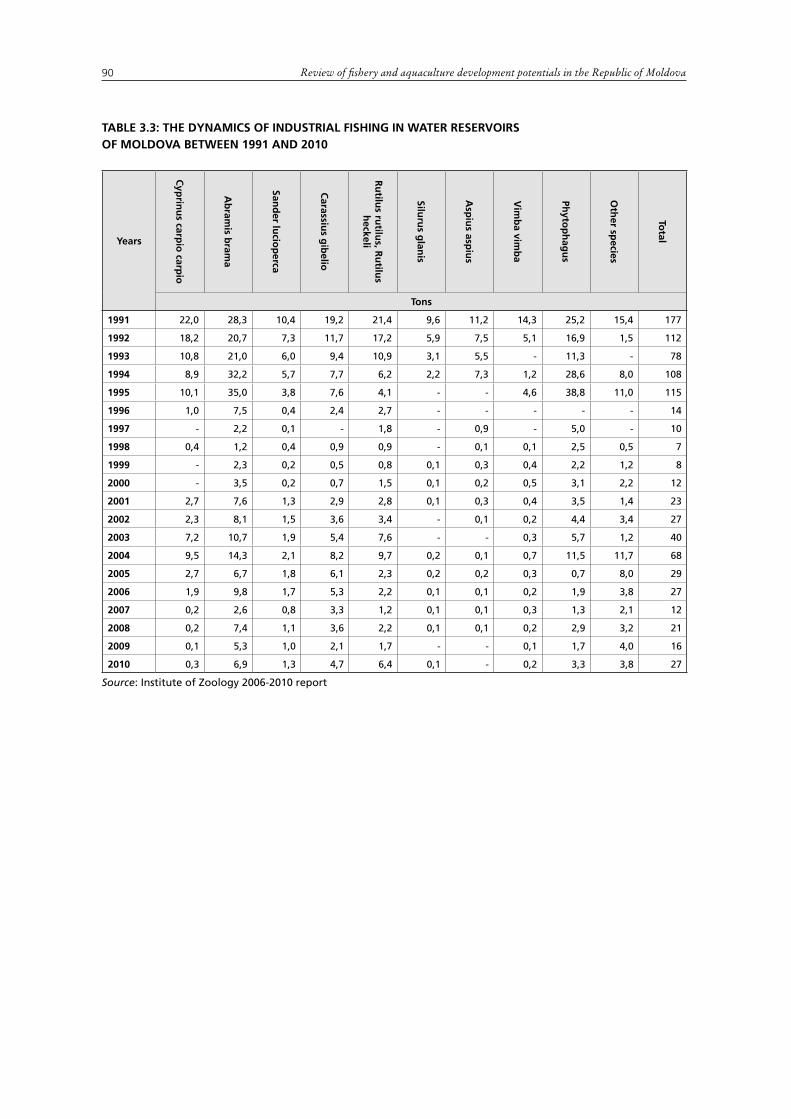
Review of fishery and aquaculture development potentials in the Republic of Moldova90
table 3.3: the dynamics of industRial fishinG in wateR ReseRvoiRs of moldova between 1991 and 2010
years
cyp
rinu
s carpio
carpio
ab
ramis b
rama
sand
er lucio
perca
carassiu
s gib
elio
Ru
tilus ru
tilus, R
utilu
s h
eckeli
siluru
s glan
is
asp
ius asp
ius
vim
ba vim
ba
phyto
ph
agu
s
oth
er species
total
tons
1991 22,0 28,3 10,4 19,2 21,4 9,6 11,2 14,3 25,2 15,4 177
1992 18,2 20,7 7,3 11,7 17,2 5,9 7,5 5,1 16,9 1,5 112
1993 10,8 21,0 6,0 9,4 10,9 3,1 5,5 - 11,3 - 78
1994 8,9 32,2 5,7 7,7 6,2 2,2 7,3 1,2 28,6 8,0 108
1995 10,1 35,0 3,8 7,6 4,1 - - 4,6 38,8 11,0 115
1996 1,0 7,5 0,4 2,4 2,7 - - - - - 14
1997 - 2,2 0,1 - 1,8 - 0,9 - 5,0 - 10
1998 0,4 1,2 0,4 0,9 0,9 - 0,1 0,1 2,5 0,5 7
1999 - 2,3 0,2 0,5 0,8 0,1 0,3 0,4 2,2 1,2 8
2000 - 3,5 0,2 0,7 1,5 0,1 0,2 0,5 3,1 2,2 12
2001 2,7 7,6 1,3 2,9 2,8 0,1 0,3 0,4 3,5 1,4 23
2002 2,3 8,1 1,5 3,6 3,4 - 0,1 0,2 4,4 3,4 27
2003 7,2 10,7 1,9 5,4 7,6 - - 0,3 5,7 1,2 40
2004 9,5 14,3 2,1 8,2 9,7 0,2 0,1 0,7 11,5 11,7 68
2005 2,7 6,7 1,8 6,1 2,3 0,2 0,2 0,3 0,7 8,0 29
2006 1,9 9,8 1,7 5,3 2,2 0,1 0,1 0,2 1,9 3,8 27
2007 0,2 2,6 0,8 3,3 1,2 0,1 0,1 0,3 1,3 2,1 12
2008 0,2 7,4 1,1 3,6 2,2 0,1 0,1 0,2 2,9 3,2 21
2009 0,1 5,3 1,0 2,1 1,7 - - 0,1 1,7 4,0 16
2010 0,3 6,9 1,3 4,7 6,4 0,1 - 0,2 3,3 3,8 27
Source: institute of Zoology 2006-2010 report
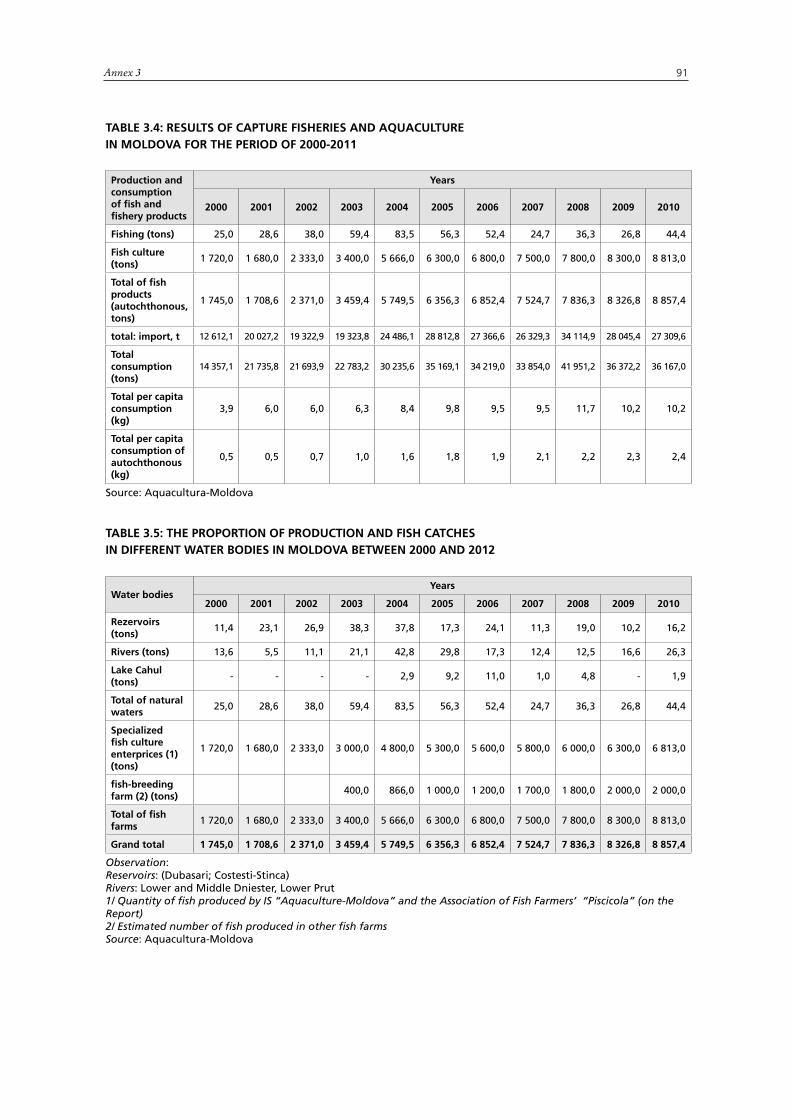
91Annex 3
table 3.4: Results of captuRe fisheRies and aquacultuRe in moldova foR the peRiod of 2000-2011
production and consumption of fish and fishery products
years
2000 2001 2002 2003 2004 2005 2006 2007 2008 2009 2010
fishing (tons) 25,0 28,6 38,0 59,4 83,5 56,3 52,4 24,7 36,3 26,8 44,4
fish culture (tons)
1 720,0 1 680,0 2 333,0 3 400,0 5 666,0 6 300,0 6 800,0 7 500,0 7 800,0 8 300,0 8 813,0
total of fish products (autochthonous, tons)
1 745,0 1 708,6 2 371,0 3 459,4 5 749,5 6 356,3 6 852,4 7 524,7 7 836,3 8 326,8 8 857,4
total: import, t 12 612,1 20 027,2 19 322,9 19 323,8 24 486,1 28 812,8 27 366,6 26 329,3 34 114,9 28 045,4 27 309,6
total consumption (tons)
14 357,1 21 735,8 21 693,9 22 783,2 30 235,6 35 169,1 34 219,0 33 854,0 41 951,2 36 372,2 36 167,0
total per capita consumption (kg)
3,9 6,0 6,0 6,3 8,4 9,8 9,5 9,5 11,7 10,2 10,2
total per capita consumption of autochthonous (kg)
0,5 0,5 0,7 1,0 1,6 1,8 1,9 2,1 2,2 2,3 2,4
source: Aquacultura-Moldova
table 3.5: the pRopoRtion of pRoduction and fish catches in diffeRent wateR bodies in moldova between 2000 and 2012
water bodiesyears
2000 2001 2002 2003 2004 2005 2006 2007 2008 2009 2010
Rezervoirs (tons)
11,4 23,1 26,9 38,3 37,8 17,3 24,1 11,3 19,0 10,2 16,2
Rivers (tons) 13,6 5,5 11,1 21,1 42,8 29,8 17,3 12,4 12,5 16,6 26,3
lake cahul (tons)
- - - - 2,9 9,2 11,0 1,0 4,8 - 1,9
total of natural waters
25,0 28,6 38,0 59,4 83,5 56,3 52,4 24,7 36,3 26,8 44,4
specialized fish culture enterprices (1) (tons)
1 720,0 1 680,0 2 333,0 3 000,0 4 800,0 5 300,0 5 600,0 5 800,0 6 000,0 6 300,0 6 813,0
fish-breeding farm (2) (tons)
400,0 866,0 1 000,0 1 200,0 1 700,0 1 800,0 2 000,0 2 000,0
total of fish farms
1 720,0 1 680,0 2 333,0 3 400,0 5 666,0 6 300,0 6 800,0 7 500,0 7 800,0 8 300,0 8 813,0
Grand total 1 745,0 1 708,6 2 371,0 3 459,4 5 749,5 6 356,3 6 852,4 7 524,7 7 836,3 8 326,8 8 857,4
Observation:Reservoirs: (dubasari; Costesti-stinca)Rivers: lower and Middle dniester, lower Prut1/ Quantity of fish produced by IS “Aquaculture-Moldova” and the Association of Fish Farmers’ “Piscicola” (on the Report)2/ Estimated number of fish produced in other fish farmsSource: Aquacultura-Moldova

Review of fishery and aquaculture development potentials in the Republic of Moldova92
tab
le 3
.6: i
mpo
Rts
of
fish
an
d f
ish
eRy
pR
od
uc
ts b
etw
een
200
0 a
nd
201
0
co
de
pro
du
ct n
ame
Go
od
s20
0020
0120
0220
0320
0420
0520
0620
0720
0820
0920
10
qu
anti
ty (
kg)
302
fish
, fre
sh o
r ch
illed
100
2
637
6
6 35
5 4
1 21
8 4
7 75
7 6
2 58
6 3
5 64
1 1
03 2
03
303
fro
zen
fis
h 1
1 07
1 36
3 1
6 91
1 47
4 1
4 57
8 60
7 1
3 66
2 38
0 1
6 47
8 15
1 1
8 93
5 97
2 1
7 70
5 60
8 1
5 84
8 91
9 1
9 44
9 90
5 1
6 87
0 53
3 1
8 36
8 45
4
304
fish
fille
ts a
nd
oth
er fi
sh m
eat
(wh
eth
er o
r n
ot
min
ced
), f
resh
, ch
illed
or
fro
zen
87
585
104
023
2
12 1
91
255
625
7
62 9
97
974
507
1
342
316
2
853
956
5
492
290
4
655
429
3
224
718
305
fish
, dri
ed, s
alte
d, s
mo
ked
, fl
ou
rs,
po
wd
ers
and
pel
lets
of
fish
fo
r h
um
an c
on
sum
pti
on
814
389
1
907
614
2
118
315
5
43 5
85
304
489
2
56 0
30
452
627
4
41 3
36
524
637
4
01 4
38
521
263
306
cru
stac
ean
s, in
sh
ell o
r n
ot,
liv
e, f
resh
, ch
illed
, fro
zen
, dri
e,
salt
ed in
th
e sh
ell,
cru
stac
ean
s,
po
wd
ers
and
pel
lets
of
cru
stac
ean
s
6 1
69
8 1
64
9 9
93
24
654
49
996
81
542
126
682
1
68 0
47
225
579
1
72 7
84
227
382
307
mo
llusk
s in
sh
ell o
r n
ot,
live
, fr
esh
, ch
illed
, fro
zen
, dri
ed,
flo
urs
, po
wd
er a
nd
pel
lets
of
inve
rteb
rate
s
2 4
75
3 3
60
5 7
12
23
481
70
123
157
857
9
9 92
2 6
2 44
6 1
50 3
81
40
524
67
653
1604
prep
ared
or
pre
serv
ed fi
sh,
cavi
ar (
cavi
ar)
and
su
bst
itu
tes
fro
m fi
sh e
gg
s 6
26 0
99
1 0
89 7
56
2 3
86 9
97
4 8
04 2
65
6 8
02 3
42
8 3
19 2
20
7 5
79 0
84
6 8
77 6
19
8 1
52 6
47
5 8
34 2
68
4 7
47 2
39
1605
cru
stac
ean
s, m
ollu
sks
and
o
ther
aq
uat
ic in
vert
ebra
tes,
p
rep
ared
or
pre
serv
ed 4
057
2
798
1
0 99
0 9
770
1
5 39
8 2
1 32
3 1
9 12
5 2
9 18
7 5
6 83
3 3
4 74
0 4
9 65
2
tota
l 1
2 61
2 13
7 2
0 02
7 18
8 1
9 32
2 90
4 1
9 32
3 76
0 2
4 48
6 13
2 2
8 81
2 80
6 2
7 36
6 58
0 2
6 32
9 26
6 3
4 11
4 85
8 2
8 04
5 35
6 2
7 30
9 56
5
Sou
rce:
Aq
uac
ult
ura
-Mo
ldo
va, 1
011

Review of fishery and aquaculture development potentials in the Republic of Moldova 93
table 3.7: wholesale and Retail pRice of fResh oR live fish
fish species cost (usd/kg) wholesale (usd/kg) Retail (usd/kg)
common carp 1,56 2,26 3,92
Grass carp 0,69 1,56 3,05
silver carp 0,69 0,98 2,26
bighead carp 0,86 1,05 2,62
crucian 0,69 1,39 2,62
pike-perch 1,74 3,90 5,67
catfish 1,83 6,35 7,85
pike 1,74 3,05 4,50
Source: Aquacultura-Moldova, 2011
table 3.8: waGes and salaRies in the fisheRy and aquacultuRe sectoR between 2000 and 2010
salaries in the fishery and aquaculture sector
years
2000 2001 2002 2003 2004 2005 2006 2007 2008 2009 2010
fish culture (usd)
27,3 30,3 33,9 41,5 69,9 82,8 91,6 103,3 131,5 145,9 129,6
agriculture, hunting and forestry (usd)
20,3 24,6 29,4 35,3 52,2 59,0 70,3 88,0 142,7 132,3 131,1
the average annual wage in the country (usd)
39,9 42,5 51,6 63,2 89,7 104,7 130,5 166,5 243,2 247,5 237,7
fish culture/average annual wage in the country (%)
68,4 71,3 65,4 65,7 77,9 79,1 70,2 62,0 54,1 58,9 54,5
Source: Aquacultura-Moldova, 2011


I3326E/1/06.13
ISBN 978-92-5-107722-1 ISSN 2070-6065
9 7 8 9 2 5 1 0 7 7 2 2 1