review of fsis risk assessment for listeria...
TRANSCRIPT

Food and Chemicals
Review of FSIS Risk Assessment for Listeria monocytogenes in Deli Meats

Review of FSIS Risk Assessment for Listeria monocytogenes in Deli Meats Project No. WD00822.000 Prepared for The American Meat Institute American Meat Institute Foundation 1150 Connecticut Ave., NW 12th Floor Washington, Dc 20036 Prepared by Exponent 1700 Rhode Island Ave, NW Washington, DC 20036 September 2005

September 26, 2005
WD00822.000 A0F0 0805 0001 i
Contents
List of Figures ii
List of Tables iii
Acronyms and Abbreviations iv
1 Introduction 5
2 Model/Algorithm Checks 7
2.1 Correlations between plant size, lot produced and FCS area 7
2.2 The mass balance approach is correctly implemented in the model 9
2.3 The distribution of Listeria contamination at retail used in the model is similar to that summarized in FDA’s assessment 9
2.4 Minimum number of runs needed to stabilize estimates 10
2.5 The distribution of added listeria contamination used by FSIS is not necessarily the “best” distribution 11
3 Alternative Model Input Assumptions 13
3.1 Impact on Model Calibration 13 3.1.1 Variables Examined 14 3.1.2 Findings 23
3.2 Impact on FSIS Conclusions 26
4 Conclusions 31

September 26, 2005
WD00822.000 A0F0 0805 0001 ii
List of Figures
Page
Figure 1: Distribution of food contact surface area and lot size for all plants 8
Figure 2: Distribution of food contact surface area and lot size for very small plants 8
Figure 3: Time between events (days) 17
Figure 4: Days between contamination events – a comparison of FSIS assumption and industry reported data 19
Figure 5: Duration of a contamination event (days) 20
Figure 6: Quantiles of LM at retail for tested intervention scenarios 28
September 26, 2005
WD00822.000 A0F0 0805 0001 iii
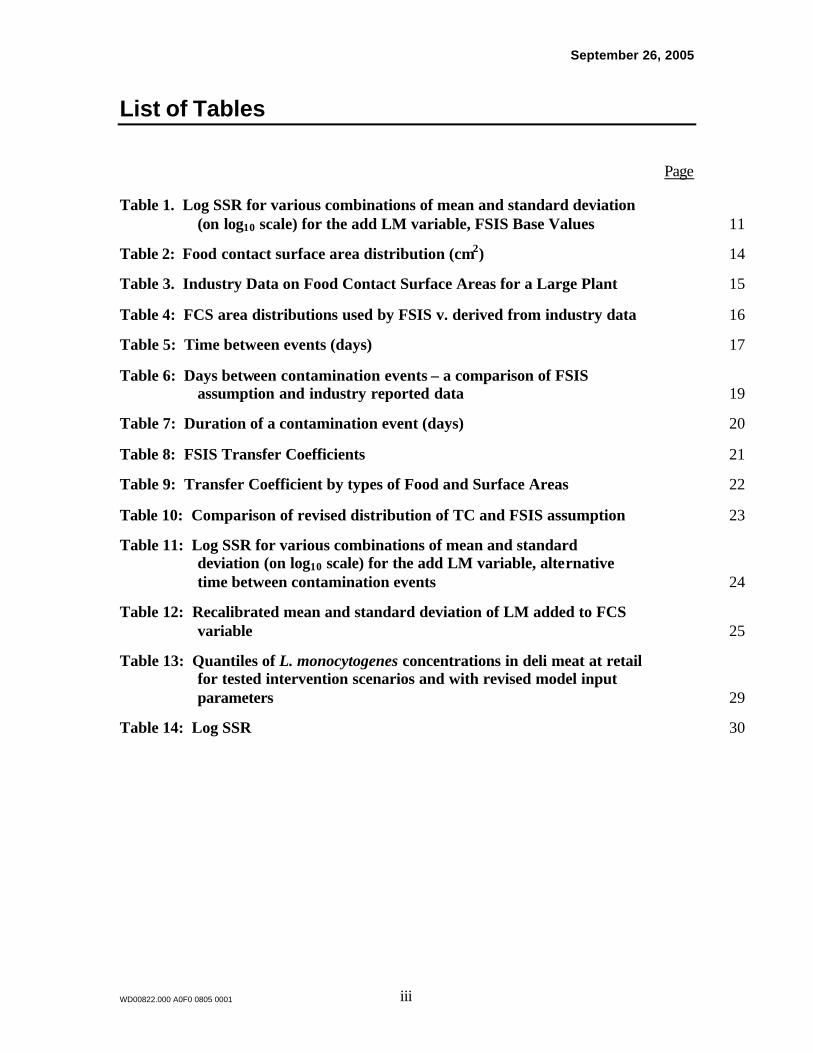
List of Tables
Page
Table 1. Log SSR for various combinations of mean and standard deviation (on log10 scale) for the add LM variable, FSIS Base Values 11
Table 2: Food contact surface area distribution (cm2) 14
Table 3. Industry Data on Food Contact Surface Areas for a Large Plant 15
Table 4: FCS area distributions used by FSIS v. derived from industry data 16
Table 5: Time between events (days) 17
Table 6: Days between contamination events – a comparison of FSIS assumption and industry reported data 19
Table 7: Duration of a contamination event (days) 20
Table 8: FSIS Transfer Coefficients 21
Table 9: Transfer Coefficient by types of Food and Surface Areas 22
Table 10: Comparison of revised distribution of TC and FSIS assumption 23
Table 11: Log SSR for various combinations of mean and standard deviation (on log10 scale) for the add LM variable, alternative time between contamination events 24
Table 12: Recalibrated mean and standard deviation of LM added to FCS variable 25
Table 13: Quantiles of L. monocytogenes concentrations in deli meat at retail for tested intervention scenarios and with revised model input parameters 29
Table 14: Log SSR 30

September 26, 2005
WD00822.000 A0F0 0805 0001 iv
Acronyms and Abbreviations
AMI The American Meat Institute FSIS Food Safety and Inspection Services LM Listeria monocytogenes
September 26, 2005
WD00822.000 A0F0 0805 0001 5
1 Introduction
At the request of the American Meat Institute (AMI), Exponent conducted a review of the
FSIS Risk Assessment for Listeria monocytogenes (LM) in Deli Meats. As described in
the FSIS report,1 the model is a dynamic in-plant Monte Carlo model (referred to as the
in-plant model) quantitatively characterizing the relationship between Listeria species in
the in-plant environment and LM in deli meats at retail.
The in-plant model incorporates several parameters, such as plant size, interval between
contamination events, duration of contamination events, transfer coefficient, cleaning
efficiency, contamination event levels, food contact surface testing, product testing,
sanitation, pre- and post-packaging interventions, and the effect of growth inhibitors etc.
and generates a distribution of concentrations of LM in deli meats at retail. Data from the
literature or information provided by industry or expert opinion were used to estimate the
parameters of the model, except for the number of LM transferred to food contact surface
during each lot production. This parameter was estimated in the calibration of the base
model. Specifically, the distribution used to represent the variable LM concentration
(cfu/cm2) added to the food contact surface (during a contamination event) was changed
until the model provided a distribution of LM concentration that is similar to the
distribution of LM at retail that was used in FDA’s risk assessment. The following
assumptions were made in the calibration of the FSIS in-plant model:
• All distributions for the model input variables (except for the LM added variable)
were held constant, hence assumed as having been correctly parameterized.
• None of the plants have in place post-processing interventions, which can reduce the
concentration of L. monocytogenes in the RTE lot or use growth inhibition product
formulation and packaging.
1 Gallagher, D.L., Ebel, E.D, and Kause, J.R. FSIS Risk Assessment for Listeria monocytogenes in Deli
Meats, May 2003.

September 26, 2005
WD00822.000 A0F0 0805 0001 6
In subsequent “what if” and “sensitive analyses,” the distribution of LM concentration
added that were derived from the calibration step was used. Conclusions based on these
subsequent analyses could be misleading if any of the input variables were incorrectly
parameterized. Thus, if some of the assumptions used in the base model were incorrect
then the estimated distribution of LM concentration added to the food contact surface
would be biased. The direction of bias would be dependent the direction of bias of the
input variables. Further, if inaccurately calibrated, the LM concentration variable could
have an impact on the results of subsequent assessments.
In the review of the FSIS in-plant model, Exponent conducted analyses aiming at:
1. Determining if the model works as described
2. Examining the impact of alternative model input assumptions on:
a. Model calibration, and
b. Intervention options and conclusions

September 26, 2005
WD00822.000 A0F0 0805 0001 7
2 Model/Algorithm Checks
Exponent checked the following model/algorithm:
1. Whether the model incorporates correlations between plant size, lot produced and
FCS area, as stated in the report
2. Whether the mass balance approach indeed functions as described in the report
3. Whether the distribution of listeria contamination at retail used in the model is indeed
similar to that summarized in FDA’s assessment
4. What minimum number of runs is needed to stabilize estimates
5. Whether the distribution of added listeria contamination used by FSIS is the “best”
distribution
Based on our examination, the following was found:
2.1 Correlations between plant size, lot produced and FCS area
The model assumes that 48% of all ready-to-eat deli meats and frankfurters are produced
by “Large” plants, 48% by “Small” plants, and the remaining 4% by “Very small” plants.
These three categories of plants are assumed to have different distributions of lot sizes
(i.e., amounts produced per shift), and food contact surface area sizes. The model does
not explicitly incorporate a correlation between plant size, lot produced and FCS area.
However, the parameters of the uniform distribution used to represent the FCS area for
“small” and medium” plants are proportionally smaller than those used for the large
plants. The values used for the smaller plants are derived by multiplying the values used
for large plants by the ratio of the mean values used for the distribution of lot sizes.
Figure 1 illustrates the resulting distributions for the three size plants, while Figure 2
displays the distributions for very small plants. Figure 1 indicates that the parameters
used to represent the distributions of lot size and FCS are correlated to the plant size,
however, Figure 2 indicates that there is no correlation between lot size and FCS within
plant size category, for ins tance the model assumes that it is possible to have plants with

September 26, 2005
WD00822.000 A0F0 0805 0001 8
FCS of about 23,000 cm2 and 140,000 cm2, respectively, produce lots of size 20,000 lbs
and 2,000 lbs, respectively.
Figure 1: Distribution of food contact surface area and lot size for all plants
Figure 2: Distribution of food contact surface area and lot size for very small plants
0
10000
20000
30000
40000
50000
60000
70000
0 200000 400000 600000 800000 1000000 1200000
FCSArea (cm2)
Lo
tMas
s (l
b)
Large plants
Small plants
Very small plants
0
5000
10000
15000
20000
25000
30000
35000
0 20000 40000 60000 80000 100000 120000 140000 160000
FCSArea (cm2)
Lo
tMas
s (l
b)
Very small plants

September 26, 2005
WD00822.000 A0F0 0805 0001 9
2.2 The mass balance approach is correctly implemented in the model
Exponent ran the model and “dumped” the data from that run and independently verified
that the total number of organisms can change due to growth of new organisms, die-off
from sanitation, or transfer from external sources such as harborage sites. Specifically,
the formulas presented for calculating the level of contamination at the end of a lot (page
18), for calculating the amount transferred to the product (page 19), and for adjusting for
post processing interventions (page 20) and growth inhibition (page 21) appear to be
correctly implemented in the program.
2.3 The distribution of Listeria contamination at retail used in the model is similar to that summarized in FDA’s assessment
As mentioned above, the FSIS model generates a distribution of concentrations of LM in
deli meats at retail. In the calibration of the base model, the updated FDA/FSIS exposure
assessment for deli meats for LM in RTE products are used as calibration values for
Listeria added during contamination event. Thus, it is important to confirm that the
distribution used by the model accurately represents the data that were used in FDA’s risk
assessment.
In the case of deli meats, the FDA risk assessment used data from 61 studies conducted in
the US as well as other countries. Data from the various studies were assigned different
weights depending on when they were conducted and in which geographical region.
Three hundred contamination curves were generated based on these data, each following
a lognormal distribution.
In FSIS’s model, a single set of parameters was estimated by calculating the average of
the means and standard deviations of the 300 sets of parameters generated by FDA.
Thus, a lognormal with mean: -8 and standard deviation of 3.5 was used by FSIS (page
75 of FSIS report).

September 26, 2005
WD00822.000 A0F0 0805 0001 10
Exponent used the data from the 61 studies and the same weighting scheme and
estimation approach as that used by FDA/FSIS assessment to generate 300 contamination
curves, and confirmed that these distributions were similar to those generated by
FDA/FSIS. We then confirmed that the average mean and standard deviation for these
300 distributions were similar to the parameters assumed in FSIS model, and that the
estimated percentiles used in the FSIS model do indeed come from a lognormal
distribution using these parameters.
2.4 Minimum number of runs needed to stabilize estimates
The FSIS model uses Monte Carlo simulation to generate estimated distributions of
listeria concentrations in deli meat products. The report states that results were based on
runs of 1,000,000 lots, although early calibration runs were based on fewer lots.
The “log SSR” statistics, which is defined as:
∑ [Log10FDA(i) - Log10 Generated(i)]2 ,
where (i) indexes 8 upper percentiles (80th, 85th, 90th, 95th, 99th, 99.5th, 99.9th and 99.99th)
is used by the FSIS model to compare the “fit” of FSIS simulated distribution of LM in
deli meat at retail relative to the updated FDA/FSIS distribution of LM in deli meat at
retail. Hence the Log SSR was used to confirm the number of iterations needed for the
model to stabilize.
Exponent ran multiple sets of simulations of sizes 50000, 100000, 500000 and 1000000
iterations to assess the minimum number of runs needed to stabilize estimates and to
confirm that the 1000000 iterations used by FSIS are sufficient. The results of these runs
showed little changes in estimates derived from multiple simulations of size 500,000
each, indicating that the 1,000,000 iterations used by FSIS are indeed sufficient.

September 26, 2005
WD00822.000 A0F0 0805 0001 11
2.5 The distribution of added listeria contamination used by FSIS is not necessarily the “best” distribution
The Log SSR (as described above) was used to describe how well the distribution of LM
concentration on deli meat at retail characterizes that based on the FDA/FSIS revised
exposure assessment as the result of a given combination of mean and standard deviation
for the LM added variable.
The FSIS calibration run resulted in final estimates of the LM species added to FCS with
a mean on log10 scale of –6cfu/cm2 and a standard deviation on the log scale of 3.5
cfu/cm2, as having the best “fit.” We conducted similar calibrations by holding all other
model input variables at their base values and changing the mean and standard deviation
of the added LM variable. We used the Log SSR to assess how well the fitted
distribution of LM concentration compare to that based on the FDA/FSIS revised
exposure assessment. The following log SSR’s were obtained for runs using various
combinations of mean and standard deviation values for the added LM parameter based
on 500,000 iterations runs:
Table 1. Log SSR for various combinations of mean and standard deviation (on log10 scale) for the add LM variable, FSIS Base Values
Log SSR CEAddStdDev CEAddMean 2.5 2.7 2.9 3.1 3.3 3.5 3.7 3.9 4.1
-8 118 93.4 75.4 59.7 41.7 31.4 22.3 15.9 11.8 -7.5 91.1 69.9 53.4 39.9 27 17.9 12.2 8.45 9.15 -7 64.7 47.8 34.6 24.2 16 9.03 4.46 4.48 8.05
-6.5 45.7 29.3 18.4 11.5 5.11 3.13 2.76 5.23 11.4 -6 29.5 17.7 8.81 4.08 1.26 1.16 5.21 11.3 20.3
-5.5 16 9.85 3.65 0.495 0.854 3.29 9.88 20.5 30.3 -5 8.74 3.05 0.621 0.79 4.45 9.02 20.6 27.5 44.3
-4.5 4.27 1.86 1.99 5.83 11.5 21 34.5 42.1 67.6
The FSIS final estimates of the LM species added to FCS is a lognormal distribution with
a mean and standard deviation on log10 scale of –6 and 3.5 cfu/cm2, has a log SSR of 1.16
in our runs (in FSIS’s report, the log SSR value is 1.02). However, other combinations
of mean and standard deviation (e.g., mean = -5.5 and SD = 3.1; mean = -5.5 and SD =

September 26, 2005
WD00822.000 A0F0 0805 0001 12
3.3; mean = -5.0 and SD = 2.9; and mean = -5.0 and SD=3.1) resulted in a smaller log
SSR, and a better fit. As such, the FSIS calibrated values for the LM added to FCS are
not necessarily the best estimates.

September 26, 2005
WD00822.000 A0F0 0805 0001 13
3 Alternative Model Input Assumptions
3.1 Impact on Model Calibration
The values for the mean and standard deviation of the number of LM species added to
food contact surfaces (FCS) at the beginning of lot production are unknown. The FSIS
model assumed that the distribution of this input variable is lognormal. In the calibration
of the model, the mean and standard deviation of this input variable were changed until
the resulting simulated distribution of LM in deli meat at retail were deemed sufficiently
close to the updated FDA/FSIS exposure assessment values for the concentration of LM
in deli meat at retail. All other model input variables were kept at their base values
during the calibration. The FSIS final distribution estimate of the LM species added to
FCS had a mean on log10 scale of –6cfu/cm2 and a standard deviation on the log scale of
3.5 cfu/cm2.
The purpose of this assessment is to determine whether distribution of LM concentration
added to the food contact surface developed based on the FSIS base is the “best”
distribution. Based on limited “what if” assessments by changing the sanitation
effectiveness parameter, and increase/decrease the number of iteration runs, the
distribution of added Listeria contamination based on the FSIS base run does not appear
to be the “best” baseline distribution. Further, in the calibration, no pre- or post-
packaging processing is assumed. Thus, estimates of number of Listeria organisms
added in the calibration model could be underestimated, if some of the plants use these
practices.
To examine the validity of the distribution of added LM in the FSIS model, the
reasonableness of various model input assumptions were evaluated and what- if
assessments were carried out. Specifically, we re-calibrated the base model by replacing
several FSIS model input assumptions with alternative distribution assumptions to
examine the impact on the calibrated distribution of the added LM concentration. The

September 26, 2005
WD00822.000 A0F0 0805 0001 14
following sections describe the variables examined in these analyses and associated
results.
3.1.1 Variables Examined
3.1.1.1 Distribution of Food Contact Surface (FCS) Area
The FSIS in-plant model assumes that 48% of all ready-to-eat deli meats and frankfurters
are produced by “Large” plants, 48% by “Small” plants, and the remaining 4% by “Very
small” plants. These three categories of plants are assumed to have different distributions
of lot sizes (i.e., amounts produced per shift), and food contact surface area sizes. The
food contact surface area is modeled as a uniform distribution ranging from 100,000 to
1,000,000 cm2 (15,500 to 155,000 square inches) for large plants. For the other size
plants, that range was modified proportionately to reflect the lower average amount
produced per lot. Table 2 summarizes the distribution used for FCS area.
Table 2: Food contact surface area distribution (cm2)
Plant size Large plants Small plants
Very small plants
Distribution Uniform Uniform Uniform Minimum 100,000 36,653 14,455 Maximum 1,000,000 366,527 144,546
Percentiles 25 325,000 119,121 46,977 50 550,000 201,590 79,500 75 775,000 284,059 112,023 90 910,000 333,540 131,537 95 955,000 350,034 138,041 99 991,000 363,229 143,245
Discussion with AMI company members indicated that food contact surface areas can be
much larger than the upper limit of the uniform distribution for a large plant that is used
in the FSIS model. Industry information on type of surface and food contact areas for a
typical large plant is summarized in Table 3.

September 26, 2005
WD00822.000 A0F0 0805 0001 15
Table 3. Industry Data on Food Contact Surface Areas for a Large Plant Type of Surface Contact Surface Area Total FCS (cm2)
Line 10 Fully Cooked Belts cm2 3,250,200
1-FUJI COOKER 1,210,836
2-TRANSFER BETWEEN FUJI AND SPIRAL 4,168
3-SPIRAL BELT 1,288,255
4-INCLINE TO URSCHEL 49,548
5-URSCHEL BELT 5,574
6-FLIGHTED INFEED BELT 46,452
7-FLIGHTED FREEZER BELTS 441,289
8-FLIGHTED EXIT BELT 33,445
9-BELT FEEDING BUCKETS 33,445
10-BELT FEEDING TRIANGLE 61,935
11-BELT FEEDING HOPPER 5,574
12-HOPPER BELT 27,871
13-BULK METAL DETECTOR BELT 41,806 Line 20 Fully Cooked Belts 1,383,017
1-JSO EXIT CONVEYOR 29,729
2-PRECHILL FREEZER 147,096
3-URCSHEL INCLINE BELT 23,226
4-URSCHEL BELT 66,890
5-FLIGHTED FREEZER BELTS 441,289
6-FLIGHTED EXIT BELT 16,723
7- BUCKET ELEVATOR 23,226
8-BELT FEEDING # 25 TRIANGLE 46,452
9-BELT FEEDING REV. CONVEYOR 55,742
10-REV. CONVEYOR TO #20 TRIANGLE 501,676
11- HOPPER BELT 30,968 Line 30 Fully Cooked Belts 2,338,679
1- JSO EXIT CONVEYOR 19,819
2- SPIRAL FREEZER BELT 1,189,159
3-SHUTTLE CONVEYOR EXIT OF SPIRAL 16,723
4-BRIDGE CHOPPER BELT 18,581
5-BRIDGE SLICER BELT 37,161
6-BRIDGE SLICER EXIT BELT TO FLIGHTED 29,729
7-URSCHEL INFEED CONVEYOR 5,574
8-URSCHEL BELT 5,574
9-FLIGHTED FREEZER BELTS 441,289
10-FLIGHTED EXIT BELT 16,723
11-LONG WIRE BELT INCLINE 74,322
12-LONG INTRALOX INCLINE BELT 74,322
13-CROSS CONVEYOR TO BULK DECLINE 200,671
14-BULK DECLINE BELT 74,322
15-BULK METAL DETECTOR 11,148
16-REV. CONVEYOR FOR TRIANGLES 33,445
17-INFEED CONVEYOR TO #30 TRIANGLE 33,445
18-INFEED CONVEYOR TO # 35 TRIANGLE 33,445
19- BUCKET ELEVATOR 23,226

September 26, 2005
WD00822.000 A0F0 0805 0001 16
Data provided by industry for the surface contact area in 2 smaller plants ranged from
about 39,000 to 322,500 cm2 per line, and thus are similar to those assumed in the FSIS
model for the smaller plants.
Based on the surface contact area data provided by industry for large plants, a more
reasonable assumption for the food contact surface area than what is currently used in the
FSIS model would be a uniform distribution ranging from 100,000 to 3,500,000 cm2 for
large plants. As described above (section 2), the FSIS model assumes that the parameters
defining the FCS area distribution for small and very small plants, are proportionately
smaller than those used to define the distribution for large plants. Using the modified
food contact surface area for large plants results in a uniform distribution ranging from
36,653 to 1,282,845 cm2 for small plants and 14,455 to 505,911 cm2 for very small plants.
Table 4 compares the FCS area distributions used by FSIS to those derived based on
industry data.
Table 4: FCS area distributions used by FSIS v. derived from industry data Large plants Small plants Very small plants
Plant size FSIS Industry Data FSIS
Industry Data FSIS Industry Data
Distribution Uniform Uniform Uniform Uniform Uniform Uniform Minimum 100,000 100,000 36,653 36,653 14,455 14,455 Maximum 1,000,000 3,500,000 366,527 1,282,845 144,546 505,911
Resulting Distribution Mean 550,000 1,800,000 201,590 659,749 79,500 260,183
25th 325,000 950,000 119,121 348,201 46,977 137,319 50th 550,000 1,800,000 201,590 659,749 79,500 260,183 75th 775,000 2,650,000 284,059 971,297 112,023 383,047 80th 820,000 2,820,000 300,552 1,033,607 118,528 407,620 90th 910,000 3,160,000 333,540 1,158,226 131,537 456,765 95th 955,000 3,330,000 350,034 1,220,536 138,041 481,338 99th 991,000 3,466,000 363,229 1,270,384 143,245 500,996

September 26, 2005
WD00822.000 A0F0 0805 0001 17
3.1.1.2 Distributions of interval between contamination events
Data on the interval between contaminations events used in the FSIS model come from a
plant associated with an outbreak and not representative of other plants (p23-24). Thus,
intervals between events may be underestimated. A potential impact of this bias is that
number of Listeria organisms added during a contamination event may be underestimated
in the calibration model. The current FSIS assumption for this variable is summarized in
Table 5 and Figure 3
Table 5: Time between events (days)
Log10 Normal Distribution Mean 1.08 Standard deviation 0.46
Percentiles days 25 6 50 12 75 24 90 46 95 67 99 138
Figure 3: Time between events (days)
Industry data of surface contamination event reported for the period of 7/7/2004 and
6/3/2005 were made available to Exponent (see Appendix A). In analyzing this dataset,
00.10.20.30.40.50.60.70.80.9
1
0 50 100 150 200 250 300
Time between events (days)
September 26, 2005
WD00822.000 A0F0 0805 0001 18
a plant/line was assumed to be contamination free during the sampling period if it had no
reporting event. Similarly, it is assumed that no contamination occurred the latest
reported event and 6/3/2005. It is also assumed that no contamination occurred between
the beginning of the reporting period (7/7/2004) and the earliest reported date. The
following three options were considered in estimating the distribution of time between
contamination events:
1. Use all intervals that ended up with a contamination (i.e. intervals that
correspond to a failure)
2. Use all the “data” (i.e., assume that the censored intervals were actually not
censored), or
3. Use all non-censored (left or right) data (i.e., do not make any assumptions
about starting and ended dates, and only use the intervals between reported
events).
The FSIS model requires a log10 normal distribution be used for this variable, however,
for all 3 options, the log10 normal distribution did not provide a good fit, and tended to
underestimate the time between events (i.e., the modeled percentiles tended to be lower
than the ones derived from the data). The resulting parameter estimates for all three
options, assuming the log10 normal distribution are summarized below:
v Option 1 -- only intervals ending up with detection: mean = 1.79, sd =
0.54.
v Option 2 -- all intervals, including censored: mean = 2.17, sd = 0.49.
v Option 3 -- only intervals between reported events, so no left or right
censored data: mean = 1.37, sd = 0.47
The percentile estimates of the number of days between contamination events based on
FSIS assumption were consistently below the estimates based on the three distributions
that were derived from industry reported data, with Option 3 distribution being the closest
to FSIS estimates. These comparisons are provided in Table 6 and Figure 4.

September 26, 2005
WD00822.000 A0F0 0805 0001 19
Table 6: Days between contamination events – a comparison of FSIS assumption and industry reported data
Percentile
FSIS mean=1.08,
sd=0.46
Case 1 mean=1.79,
sd=0.54
Case 2 mean=2.17,
sd =0.49
Case 3 mean=1.37,
sd=0.47 0.1 3 13 35 6 0.2 5 22 57 9 0.3 7 32 82 13 0.4 9 45 111 18 0.5 12 62 148 23 0.6 16 84 197 31 0.7 21 118 267 41 0.8 29 176 382 58 0.9 46 303 628 94 0.95 67 477 946 139 0.99 138 1112 2041 291
Figure 4: Days between contamination events – a comparison of FSIS assumption and industry reported data
0
0.1
0.2
0.3
0.4
0.5
0.6
0.7
0.8
0.9
1
0 500 1000 1500 2000 2500 3000 3500 4000 4500 5000
Time between events (days)
FSIS
Case 1:only intervals ending up with detection
Case 2: all intervals, including censored
Case 3: only intervals between reported events, excluding censored data

September 26, 2005
WD00822.000 A0F0 0805 0001 20
3.1.1.3 Distribution of Duration of a Contamination Event
The distribution for the duration of a contamination event variable in the FSIS base
model was based on Tompkin’s 2002 data. The current FSIS assumption for this variable
is summarized in Table 7 and Figure 5.
Table 7: Duration of a contamination event (days)
Figure 5: Duration of a contamination event (days)
According to industry information, data from Tompkin (2002) were based on small plants
and possibly not applicable to conditions at large plants. Also, there have been many
operational changes since the study was conducted such that the duration of a
contamination event would not be allowed to last over 10-15 days (above the 90th
Log10 normal Distribution
Mean 0.60 Standard deviation 0.57
Percentiles days 25 2 50 4 75 10 90 22 95 35 99 86
0
0.1
0.2
0.3
0.4
0.5
0.6
0.7
0.8
0 50 100 150 200 250 300
Contamination Event Duration (days)
September 26, 2005
WD00822.000 A0F0 0805 0001 21
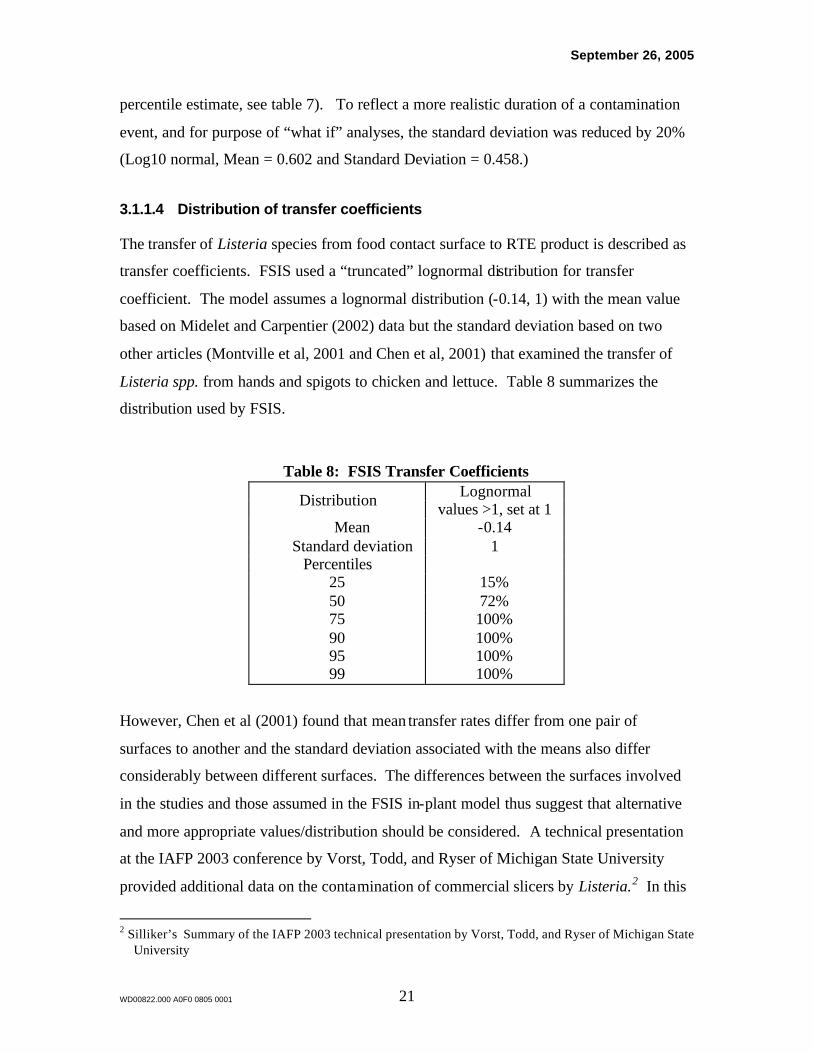
percentile estimate, see table 7). To reflect a more realistic duration of a contamination
event, and for purpose of “what if” analyses, the standard deviation was reduced by 20%
(Log10 normal, Mean = 0.602 and Standard Deviation = 0.458.)
3.1.1.4 Distribution of transfer coefficients
The transfer of Listeria species from food contact surface to RTE product is described as
transfer coefficients. FSIS used a “truncated” lognormal distribution for transfer
coefficient. The model assumes a lognormal distribution (-0.14, 1) with the mean value
based on Midelet and Carpentier (2002) data but the standard deviation based on two
other articles (Montville et al, 2001 and Chen et al, 2001) that examined the transfer of
Listeria spp. from hands and spigots to chicken and lettuce. Table 8 summarizes the
distribution used by FSIS.
Table 8: FSIS Transfer Coefficients Lognormal Distribution values >1, set at 1
Mean -0.14 Standard deviation 1
Percentiles 25 15% 50 72% 75 100% 90 100% 95 100% 99 100%
However, Chen et al (2001) found that mean transfer rates differ from one pair of
surfaces to another and the standard deviation associated with the means also differ
considerably between different surfaces. The differences between the surfaces involved
in the studies and those assumed in the FSIS in-plant model thus suggest that alternative
and more appropriate values/distribution should be considered. A technical presentation
at the IAFP 2003 conference by Vorst, Todd, and Ryser of Michigan State University
provided additional data on the contamination of commercial slicers by Listeria.2 In this
2 Silliker’s Summary of the IAFP 2003 technical presentation by Vorst, Todd, and Ryser of Michigan State
University

September 26, 2005
WD00822.000 A0F0 0805 0001 22
study retail blocks of Cheddar cheese (36.1% moisture, 25.5% fat) and smoked turkey
breast (99% fat free) were inoculated (~10 6 CFU/cm 2) with L. monocytogenes Scott A
and a 6-strain cocktail containing weak, medium, and strong biofilm formers. The
inoculated product (3 replicates) was sliced (5 slices/replicate) at 4-7C on a modified
commercial delicatessen slicer while applying 2 and 10 lbs of force. Five product contact
areas on the slicer were identified based on Glo-Germ ®: the table, back plate, metal
guard, blade, and product collection area. Using an application force of 2 lbs on turkey
breast, greatest transfer was found on the metal guard (~10 3 CFU/cm 2) and blade (~10 2
CFU/cm 2) with Listeria transfer 10-fold higher using an application force of 10 lbs.
Unlike turkey breast, Cheddar cheese transfer levels were highest on the collection area
(10 2 CFU/cm 2 and blade (~10 3 CFU/cm 2) with the table yielding little or no transfer.
A summary of the Transfer Coefficients that can be derived from this study is
summarized in Table 9. Given the type of surfaces tested in this study and the Midlet and
Carpenter (2002) study, pooled TC data from these two studies would be appropriate for
use in characterizing the lognormal distribution of Transfer Coefficient. The parameter
estimates for the log10 normal distribution of TC based on these two studies as compared
with FSIS estimates are provided in Table 10.
Table 9: Transfer Coefficient by types of Food and Surface Areas
Study Food Surface %TC Cheese Table* 0.000001 Smoked Turkey BreastTable* 0.000001 Cheese Blade 0.001 Smoked Turkey BreastMetal guard 0.001 Cheese Collect area 0.0001
Vor
st e
t al (
2005
)
Smoked Turkey BreastBlade 0.0001
Stainless steel 1 PU 0.45
Mid
elet
&
Car
pent
ier
(200
2)
Meat exudates PVC 0.71 * No transfer was observed to table,. We used 0.00001 for modeling purposes.

September 26, 2005
WD00822.000 A0F0 0805 0001 23
Table 10: Comparison of revised distribution of TC and FSIS assumption
Pooled Data From Vorst et al (2003) & Midelet & Carpentier (2002) FSIS Assumption
Log 10 Normal Distribution Mean = -2.94, sd = 2.35 Mean = -0,14, sd = 1 Percentiles
5% 0 0.02 10% 0.000001 0.04 15% 0.000004 0.07 20% 0.000012 0.11 25% 0.000029 0.17 30% 0.000072 0.23 35% 0.000138 0.32 40% 0.000297 0.43 45% 0.000698 0.57 50% 0.001252 0.73 55% 0.002146 0.95 60% 0.004073 1.00 65% 0.009598 1.00 70% 0.019223 1.00 75% 0.051072 1.00 80% 0.124854 1.00 85% 0.303350 1.00 90% 1.00 1.00 95% 1.00 1.00 100% 1.00 1.00
3.1.2 Findings
3.1.2.1 Calibration with Alternative Time Between Contamination Events
The model was run with the three alternative distributions for the interval between events
parameters described above (Section 3.1.1.2) and a series of alternative listeria added
distributions, while keeping all other parameters as in FSIS bases model. However,
irrespective of what listeria added distribution used, distributions derived under Options 1
and 2 did not result in a distribution of listeria levels in retail deli meats that was similar
to that based on the data summarized in FDA/FSIS report. Thus, if the lognormal
distributions that were used for time between contamination events are good

September 26, 2005
WD00822.000 A0F0 0805 0001 24
representations of the distribution of actual time between events, one or more of the other
assumptions and distributions used by the model are not adequate representations of what
really occurs in processing plants.
The distribution derived under Option 3 yielded estimates of days between contamination
events that were the closest to those estimated by FSIS, and thus was used in the re-
calibration. All other model input variables were similar to those used in FSIS base runs.
Table 11 is a summary of the log SSR given a combination of mean and standard
deviation for the LM added variable. When using estimates of time between
contamination events based on industry reported data rather than the FSIS base value for
this variable, the FSIS final estimates of the mean and standard deviation for the LM
added variable (in its calibration run) do not result in simulated distribution of LM in deli
meat at retail that are “close” to those estimated in the revised FDA/FSIS exposure
assessment (the log SSR = 30.9 when mean = -6.0 and SD = 3.5, see Table 11).
Table 11: Log SSR for various combinations of mean and standard deviation (on log10 scale) for the add LM variable, alternative time between contamination events
Standard Deviation Mean
2.5 2.7 2.9 3.1 3.3 3.5 3.7 3.9 4.1 -6 82.6 58.9 50.1 35 38.7 30.9 42.1 35.9 32.9
-5.5 49.7 34.2 26.9 43.1 23.4 22.2 24.5 34.5 45.9 -5 27.4 30.3 15 15.3 16.9 32.6 23.3 38.1 37.1
-4.5 28.2 15.6 6.33 10.4 17 16.3 18.1 44.4 46.9 -4 9.67 6.77 6.98 12 10.6 18.4 27.1 43.4 56.8
-3.5 5.61 4.1 6.22 9.7 16.8 25.7 46.9 51.1 63.3 -3 4.57 4.45 9.23 15.6 24.2 34.9 50.2 74.2 82.8
Note: 300K runs
In fact, with the revised time between contamination events, the combination of the mean
value at -3.5 (on log 10 scale) and standard deviation at 2.7 (on log 10 scale) for the LM
added variable had the lowest log SSR of 4.1 (See Table 11). However, none of the mean
and standard deviation combinations resulted in log SSR < 1, i.e. none would yield
distribution of LM in deli meat at retail that are close to estimates in the FDA/FSIS
revised exposure assessment. As discussed above, if the lognormal distribution that was

September 26, 2005
WD00822.000 A0F0 0805 0001 25
used for time between contamination events is a good representation of the distribution of
actual time between events, one or more of the other assumptions and distributions used
by the model are not adequate representations of what really occurs in processing plants.
3.1.2.2 Calibration with alternative values for food contact surface areas, transfer coefficients, and duration of contamination events
Alternative values for food contact surface areas, transfer coefficients, and duration of
contamination event, as previously described were used to recalibrate the values of mean
and standard deviation for the LM added to FCS variable. The recalibration was done by
changing each variable one at a time and by changing all three variables together. The
re-calibrated values of the mean and standard deviation (on log10 scale) of the LM added
to FCS variable that results in a distribution of LM concentration in deli meat at retail
close to the revised FDA/FSIS LM concentration in deli meat at retail (based on logSSR
< 1, approximately equal to the Goodness of Fit value that was deemed acceptable by
FSIS in baseline calibration runs) are summarized below. None of these “best fit”
combinations are the same as the FSIS final values of mean and SD for LM added
variable (-6, 3.5). When all three variables are modified, a mean of –4.8 and a standard
deviation of 3.2 for the LM added variable appear to provide the best fit. (See Table 12)
Table 12: Recalibrated mean and standard deviation of LM added to FCS variable
LM Added to FCS (on log 10 scale) Revised model input variable Mean Standard Deviation
LogSSR
-5.4 3.5 0.722 Transfer Coefficient Mean = -0.26, SD = -0.64
-5.2 -5.2 -5.2
3.3 3.4 3.5
0.726 0.962 0.868
-5.0 3.1 0.600 Event Duration Mean = 0.601 SD = 0.58
-4.5 2.9 0.600
-6 3.1 0.800 -6 3.3 0.500
FCS area (cm2) Min = 100,000 Max = 3,250,000 -5.5 2.9 1
-5.0 3.3 1.05 -4.8 3.1 1.15
Revised TC, Event Duration and FCS area -4.8 3.2 1.01 Note: 300K iterations run

September 26, 2005
WD00822.000 A0F0 0805 0001 26
3.2 Impact on FSIS Conclusions
The FSIS model assumes that intervention does not affect the duration of a contamination
event, the interval between contamination events, or the number of Listeria organisms
transferred to the FCS. Food contact surface areas can act as long-term harborage sites
over a long period of time (as indicated on page 14 of the FSIS report). According to
industry sources, findings of contamination would typically trigger intense sampling to
find niches and rigorous cleanup conducted to rid of niches. So implementation of
sanitation interventions should affect the duration and interval between contamination
events as well as the amount transferred from these areas. Since the FSIS in-plant model
does not allow for this relationship (correlations) between these model input variables, it
is not surprising that improved sanitation is found to have a limited effect based on
analysis using this FSIS in-plant model (see conclusions on page 66 of the FSIS report).
To appropriately address this fundamental model flaw, the FSIS in-plant model would
need to be revised. This is beyond the scope of Exponent’s review of the FSIS model.
The purpose of this evaluation is thus limited to determining if FSIS conclusions about
the relative effectiveness of various intervention options based on the current model
construct remain valid when different values for several model input variables were used,
including the re-calibrated mean and standard deviation for the LM added variable.
Based on available information and as discussed in previous sections, the following
model inputs were changed in this evaluation:
Variable FSIS Values Revised Values
Transfer Coefficient Mean = -0.14; SD = 1 Mean = -2.94; SD = 2.35 Event Duration Mean = 0.602; SD = 0.573 Mean = 0.602; SD = 0.458
Food Contact Surface Area for large plants3
Min = 100,000 cm2 Max = 1,000,000 cm2
Min = 100,000 cm2 Max = 3,250,000 cm2
LM Added Mean = -6.0; SD = 3.5 Mean = 4.8; SD = 3.2
In the FSIS report, LM concentrations on deli meat at retail were predicted for various
scenarios of FCS and/or product testing using the FSIS Risk Assessment in-plant model.

September 26, 2005
WD00822.000 A0F0 0805 0001 27
The scenarios were given as triplet numbers, e.g. 4-2-1, and represent the number of
monthly FCS samples per line for large, small, and very small plants. FSIS assumed test
and hold for all FCS testing scenarios and if a lot tested positive for LM it was assumed
not to be sold for retail. In addition to FCS testing scenarios, FSIS also provided
scenarios of lot testing rather than FCS testing (i.e. 60-60-60 lot scenario), post-
processing intervention/control (PP), growth inhibiting packaging (GIP), and combined
PP and GIP scenarios. For the PP and GIP scenarios, FSIS assumed that 100% of
industry implements these practices. Outputs of LM concentration at retail at the 80th,
99th and 99.99th percentiles were compared against the FDA estimates and FSIS baseline
estimates in Figure 20 and Table 20 of the FSIS report.
Exponent conducted analyses for several intervention scenarios that are similar to those
described in the FSIS report. However, based on the description in the FSIS report, it is
unclear what intervention was incorporated in the FSIS baseline scenario (i.e. 0-0-0 or 4-
2-1 FCS sampling schemes). We assumed that when the 4-2-1 scenario is implemented
without enhanced cleaning (i.e. when the “enhance cleaning” check box is not checked),
the output would be similar to when the 0-0-0 scenario is implemented. The outputs of
LM concentration on deli meat based on our revised input parameters for various
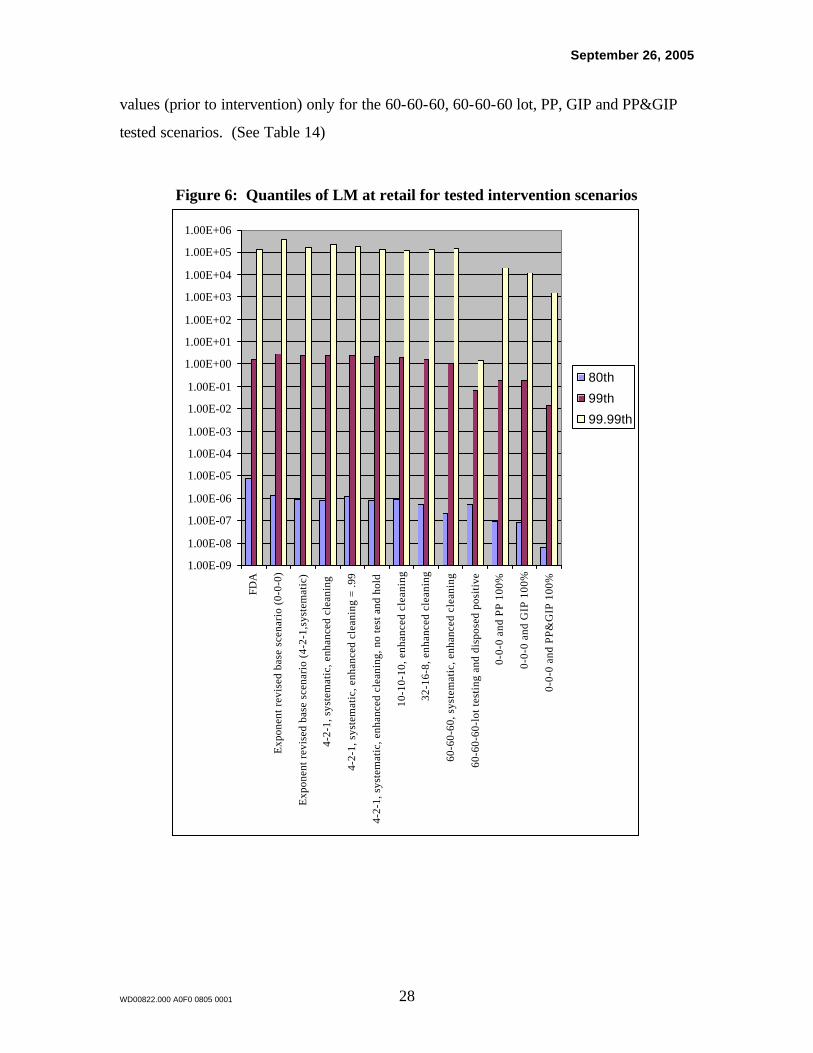
scenarios are summarized below in Table 13. Figure 6 below shows 3 quantiles (80th,
99th, and 99.99th percentiles) concentrations of LM in deli meats at retail for the various
tested scenarios. In general, similar to the FSIS result, the data generally showed modest
decline in the LM concentration at RTE product at retail as the food contact surface
testing and sanitation effort increases. However, this trend is better observed for the 80th
and 99th percentiles and not for the 99.99th percentile. While the FSIS output showed a
decline at the 99.99th percentile for the 60-60-60 FCS testing and enhanced sanitation
scenario, our analysis showed minimal decline from both the base values and Exponent
revised base values. Most noticeable are the drop in LM concentrations at retail that were
observed for both the 60-60-60 lot, PP, GIP and PP&GIP scenarios for all three quantiles
when compared with the base values. Based on the Log SSR (Log SSR > 2), the
predicted LM concentrations at retail are different from the FDA estimates or baseline
3 Distributions for FCS area for small and very small plants are assumed to proportionately smaller
September 26, 2005
WD00822.000 A0F0 0805 0001 28
values (prior to intervention) only for the 60-60-60, 60-60-60 lot, PP, GIP and PP&GIP
tested scenarios. (See Table 14)
Figure 6: Quantiles of LM at retail for tested intervention scenarios
1.00E-09
1.00E-08
1.00E-07
1.00E-06
1.00E-05
1.00E-04
1.00E-03
1.00E-02
1.00E-01
1.00E+00
1.00E+01
1.00E+02
1.00E+03
1.00E+04
1.00E+05
1.00E+06
FDA
Exp
onen
t rev
ised
bas
e sc
enar
io (
0-0-
0)
Exp
onen
t rev
ised
bas
e sc
enar
io (
4-2-
1,sy
stem
atic
)
4-2-
1, s
yste
mat
ic, e
nhan
ced
clea
ning
4-2-
1, s
yste
mat
ic, e
nhan
ced
clea
ning
= .9
9
4-2-
1, s
yste
mat
ic, e
nhan
ced
clea
ning
, no
test
and
hol
d
10-1
0-10
, enh
ance
d cl
eani
ng
32-1
6-8,
enh
ance
d cl
eani
ng
60-6
0-60
, sys
tem
atic
, enh
ance
d cl
eani
ng
60-6
0-60
-lot
test
ing
and
disp
osed
pos
itive
0-0-
0 an
d PP
100
%
0-0-
0 an
d G
IP 1
00%
0-0-
0 an
d PP
&G
IP 1
00%
80th
99th
99.99th

September 26, 2005
WD00822.000 A0F0 0805 0001 29
Table 13: Quantiles of L. monocytogenes concentrations in deli meat at retail for tested intervention scenarios and with revised model input parameters
FDA
Exponent Revised base (0-0-0)
Exponent Revised Base parameters (4-2-1,systematic)
4-2-1 FCS, systematic, enhanced cleaning
4-2-1 FCS, systematic, enhanced cleaning = .99
4-2-1 FCS, systematic, enhanced cleaning, no test and hold
10-10-10, enhanced cleaning
32-16-8, enhanced cleaning
60-60-60 FCS, systematic, enhanced cleaning
60-60-60-lot testing and disposed positive
0-0-0 and PP 100%
0-0-0 and GIP 100%
0-0-0 and PP&GIP 100%
80th 7.40E-06 1.34E-06 8.76E-07 7.71E-07 1.17E-06 8.33E-07 9.02E-07 5.36E-07 2.04E-07 5.21E-07 8.93E-08 8.69E-08 6.57E-0985th 3.70E-05 1.64E-05 1.13E-05 1.05E-05 1.43E-05 1.10E-05 1.10E-05 7.26E-06 3.16E-06 6.04E-06 1.11E-06 1.06E-06 8.37E-0890th 2.70E-04 2.40E-04 1.82E-04 1.74E-04 2.24E-04 1.74E-04 1.69E-04 1.20E-04 5.65E-05 7.81E-05 1.70E-05 1.67E-05 1.27E-0695th 5.50E-03 8.09E-03 6.34E-03 6.48E-03 7.35E-03 6.10E-03 5.72E-03 4.44E-03 2.32E-03 1.65E-03 5.79E-04 5.38E-04 4.24E-0599th 1.50E+00 2.80E+00 2.38E+00 2.40E+00 2.44E+00 2.25E+00 1.84E+00 1.61E+00 1.05E+00 6.75E-02 1.90E-01 1.83E-01 1.45E-0299.5th 1.10E+01 2.35E+01 1.83E+01 1.89E+01 1.90E+01 1.71E+01 1.37E+01 1.27E+01 8.49E+00 1.53E-01 1.54E+00 1.33E+00 1.12E-0199.9th 7.90E+02 1.60E+03 1.31E+03 1.12E+03 1.34E+03 9.70E+02 8.61E+02 7.55E+02 5.58E+02 5.04E-01 1.06E+02 8.16E+01 7.35E+0099.99th 1.40E+05 3.94E+05 1.82E+05 2.49E+05 2.01E+05 1.44E+05 1.26E+05 1.43E+05 1.53E+05 1.35E+00 2.10E+04 1.24E+04 1.61E+03Notes: 500K Iterations

September 26, 2005
WD00822.000 A0F0 0805 0001 30
Table 14: Log SSR
Log SSR
Scenarios vs. FDA vs. Exponent Revised Base
FDA NA NA Exponent revised base scenario (0-0-0) 1.18 NA Exponent revised base scenario (4-2-1,systematic) 1.31 0.22 4-2-1, systematic, enhanced cleaning 1.49 0.20 4-2-1, systematic, enhanced cleaning = .99 1.01 0.11 4-2-1, systematic, enhanced cleaning, no test and hold 1.29 0.37 10-10-10, enhanced cleaning 1.18 0.51 32-16-8, enhanced cleaning 1.94 0.87 60-60-60, systematic, enhanced cleaning 4.24 2.62 60-60-60-lot testing and disposed positive 43.10 50.60 0-0-0 and PP 100% 11.40 11.16 0-0-0 and GIP 100% 12.30 12.44 0-0-0 and PP&GIP 100% 42.10 42.76

September 26, 2005
WD00822.000 A0F0 0805 0001 31
4 Conclusions
v In general, the FSIS model works as described in the FSIS report. The formulas used
to model the mass balance approach are correctly implemented. The distribution used
in the calibration to represent listeria concentrations in deli meats at retail correctly
simulates the data in FDA/FSIS risk assessment. The number of iterations used in the
risk assessment (1,000,000 iterations) is sufficient for the model output to stabilize.
However, the distribution used by FSIS to represent the amount of listeria added
during a contamination event is not necessarily the distribution that resulted in the
best fit when compared to that based on the data in FDA/FSIS risk assessment.
v Estimates of several model input variables, i.e. transfer coefficient, interval between
contamination event, event duration, food contact surface areas can be modified with
industry data. These revised parameters can impact the calibrated values of mean
and standard deviation for the LM added variable. In particular, when industry
reported data are used to parameterize the interval between contamination events, the
model cannot be calibrated to the FDA estimates of LM concentration at retail. This
suggest that alternative parametric distribution for this specific variable may be
needed, or there may be other model construct limitations, i.e. inability to correlate
various input variables (see below)
v Assessment using the FSIS in-plant model with several revised input variables,
generally showed modest decline in the LM concentration for RTE products at retail
as the food contact surface testing and sanitation effort increases. This trend was
observed for the 80th and 99th percentiles and not for the 99.99th percentile. However,
the decreases in LM concentrations at retail when compared with the base values
were only significant for the 60-60-60, 60-60-60 lot, PP, GIP and PP&GIP tested
scenarios.

September 26, 2005
WD00822.000 A0F0 0805 0001 32
v Correlation between the duration of a contamination event, the interval between
contamination events, or the number of Listeria organisms transferred to the FCS is
not allowed in the FSIS in-plant model. If such correlations are allowed, intervention
such as enhanced cleaning once contamination is detected via FCS sampling to get rid
of LM niches would reduce the level of LM added (now held constant in model) and
the duration of a contamination event and would lengthen the duration between
events (as shown with industry reported data). Thus, FSIS’s conclusions about the
relative effectiveness of various intervention scenarios remain questionable.

September 26, 2005
WD00822.000 A0F0 0805 0001 33
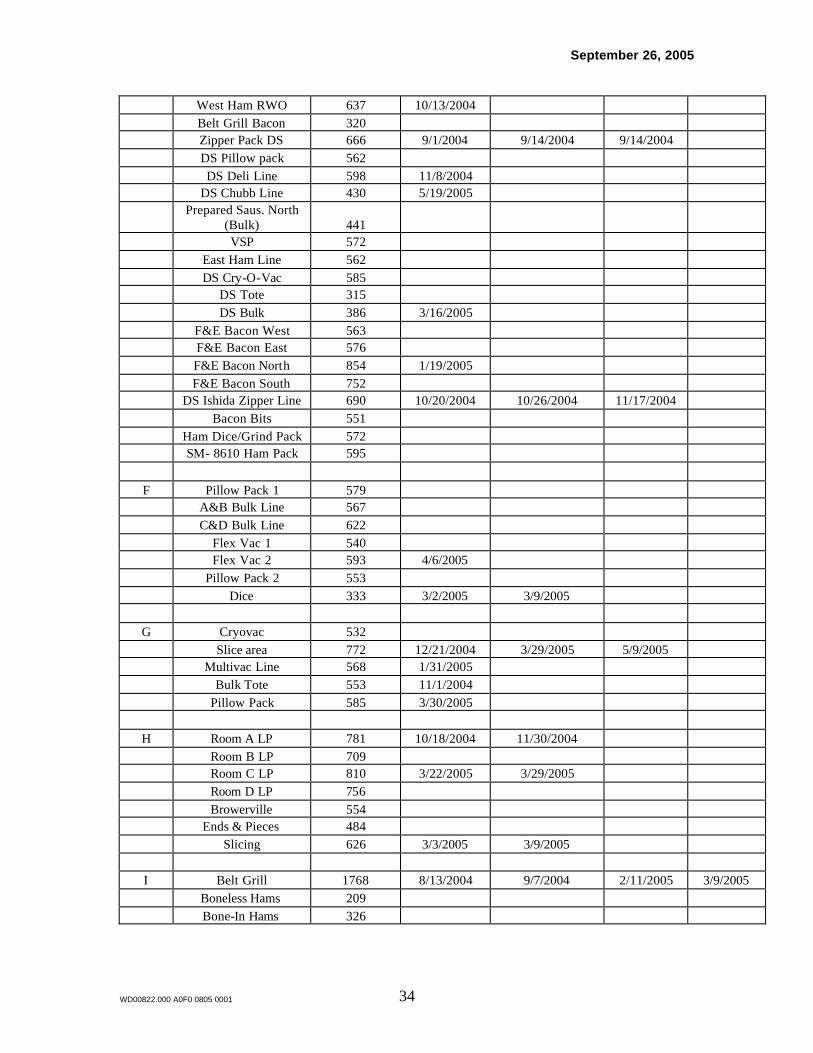
Appendix A: Time between event data Date with Re ported Positive Event
Plant # Line
Number of
samples 1st 2nd 3rd 4th A Precooked line A 727 Precooked line B 765 8/23/2004 Precooked line C 801 2/2/2005 5/26/2005 Precooked line Bits 652 B Prepared Saus. Pack 438 Prepared saus. Bulk 370 RTE Bacon line 1 134 RTE bacon Line 2 272 Bacon Bits 103 C Belt Grill Line 1 609 Belt Grill Line 2 502 CIB Line 1 484 CIB Line 2 501 20-Aug CIB Line 3 537
CIB Line 4 & Dicer
(add-ons) 534 Ham Pack Line 3 233
Ham Pack Line 4 (BNLS
Spiral) 583 7/7/2004 7/27/2004 8/6/2004
Ham Pack Line 5(BI
Spiral) 1736 8/25/2004 9/15/2004 9/23/2004 Ham Pack Line 6 523 Ham Pack Line 7 531 10/7/2004 Ham Pack Line 8 527
Ham Pack Line 9 Grd
Ham 492 D Formax 569 Cocktails/Franks 479 Ham Pack Line 563 Bulk Sausage Pack 544 Slider Zipper Line 393 Toby Line 605 Ross Pack Chop line 570 Dicer 460 1/19/2005 6/3/2005 West Formax 590 Multivac Line 460 Crax Packaging 559
E Prepared Sausage Pack
SLW 551 Canadian Bacon 572
September 26, 2005
WD00822.000 A0F0 0805 0001 34
West Ham RWO 637 10/13/2004 Belt Grill Bacon 320 Zipper Pack DS 666 9/1/2004 9/14/2004 9/14/2004 DS Pillow pack 562 DS Deli Line 598 11/8/2004 DS Chubb Line 430 5/19/2005
Prepared Saus. North
(Bulk) 441 VSP 572 East Ham Line 562 DS Cry-O-Vac 585 DS Tote 315 DS Bulk 386 3/16/2005 F&E Bacon West 563 F&E Bacon East 576 F&E Bacon North 854 1/19/2005 F&E Bacon South 752 DS Ishida Zipper Line 690 10/20/2004 10/26/2004 11/17/2004 Bacon Bits 551 Ham Dice/Grind Pack 572 SM- 8610 Ham Pack 595 F Pillow Pack 1 579 A&B Bulk Line 567 C&D Bulk Line 622 Flex Vac 1 540 Flex Vac 2 593 4/6/2005 Pillow Pack 2 553 Dice 333 3/2/2005 3/9/2005 G Cryovac 532 Slice area 772 12/21/2004 3/29/2005 5/9/2005 Multivac Line 568 1/31/2005 Bulk Tote 553 11/1/2004 Pillow Pack 585 3/30/2005 H Room A LP 781 10/18/2004 11/30/2004 Room B LP 709 Room C LP 810 3/22/2005 3/29/2005 Room D LP 756 Browerville 554 Ends & Pieces 484 Slicing 626 3/3/2005 3/9/2005 I Belt Grill 1768 8/13/2004 9/7/2004 2/11/2005 3/9/2005 Boneless Hams 209 Bone-In Hams 326