review of the annual report of the slovakian arthroplasty ... · review of the annual report of the...
TRANSCRIPT

Oficiální Orgán České spOleČnOsti prO OrtOpedii a traumatOlOgii a slOvenskej OrtOpedickej a traumatOlOgickej spOlOČnOsti
Official jOurnal Of the czech sOciety fOr OrthOpaedics and traumatOlOgyand the slOvak sOciety fOr OrthOpaedics and traumatOlOgy
Indexed inScience Citation Index Expanded (SciSearch®)Journal Citation Reports/Science EditionIndex Medicus and MEdlInEExcerpta MedicaScopus
ISSn 0001-5415www.achot.cz
REvIEw of thE annual REpoRtof thE SlovakIan aRthRoplaSty REgIStER – 2010l. neČas, s. katina, s. křivánek, j. uhlárOvác. l. cOltOnenglish language editor to sar
pRESEntEd at thE 13th EfoRt CongRESS 2012May 23 – 25, 2012, BERlIn, gERMany
published in the cooperation with ear and efOrt

Acta Chir. orthop. Traum. čech., 78, 2011,Suppl. ISSN 0001-5415
Review of the annual report of the Slovakian Arthroplasty Register – 2010
Slovakian Arthroplasty Register Review of the annual report of the Slovakian Arthroplasty Register – 2010
L. NEČAS1, S. KATINA2, S. KŘIVÁNEK1, J. UHLÁROVÁ1
1 Slovakian Arthroplasty Register, University Hospital Martin, Slovakia 2 Institute of Normal and Pathological Physiology, Slovak Academy of Sciences, Bratislava, Slovakia
Department of Applied Mathematics and Statistics, Faculty of Mathematics, Physics and Informatics, Comenius University, Bratislava, Slovakia
C. L. COLTON English language editor to SAR

Copyright © Česká společnost pro ortopedii a traumatologii, 2011 (Czech Society for Orthopaedics and Traumatology)Copyright © Galén, 2011
Určeno odborné veřejnosti. Zaslané příspěvky se nevracejí. Nakladatel získá otištěním příspěvku výlučné nakladatelské právo k jeho užití. Žádná část tohoto časopisu nesmí být kopírována a rozmnožována za účelem dalšího rozšiřování v jakékoliv formě či jakýmkoliv způsobem, aťjiž mechanickým nebo elektronickým včetně pořizování fotokopií, nahrávek, informačních databází na magne tických nosičích, bez písemnéhosouhlasu vlastníka autorských práv a vydavatelského oprávnění.
Redakční rada / Editorial Board:prof. MUDr. Pavel Dungl, DrSc.; doc. MUDr. Jiří Gallo, Ph.D.; prof. MUDr. Pavel Haninec, Ph.D.; prof. MUDr. Petr Havránek, CSc.;doc. MUDr. David Jahoda, Ph.D.; prof. MUDr. Miloš Janeček, CSc.; doc. MUDr. Pavel Janíček, CSc.; doc. MUDr. Karel Karpaš,CSc.; doc. MUDr. Zdeněk Klézl, CSc.; prof. MUDr. Karel Koudela, CSc.; doc. MUDr. Ivan Landor, Ph.D.; prof. MUDr. Jiří Látal,CSc.; prim. MUDr. Peter Maresch, CSc.; doc. MUDr. Jozef Masár, Ph.D.; doc. MUDr. Ivan Müller, CSc.; doc. MUDr. Aleš Podškubka,Ph.D.; doc. MUDr. David Pokorný, Ph.D.; doc. MUDr. Stanislav Popelka,CSc.; prim. MUDr. Juraj Popluhár, Ph.D.; doc. MUDr. JanPoul, CSc.; doc. MUDr. Ľuboš Rehák, CSc.; doc. MUDr. Zbyněk Rozkydal, CSc.; doc. MUDr. Jiří Stehlík, CSc.; prof. MUDr. PeterŠimko, CSc.; prof. MUDr. Jan Štulík, CSc.; doc. MUDr. Tomáš Trč, CSc.; doc. MUDr. Gabriel Vaško, CSc.; doc. MUDr. Pavel Vavřík,CSc.; prof. MUDr. Jozef Vojtaššák, CSc.; prof. MUDr. Peter Wendsche, CSc.
Zahraniční redakční rada / International Advisory Board:Prof. Norbert Haas, M. D., Germany; Prof. Srečko Herman, M. D., Slovenia; Prof. Maurice Hinsenkamp, M. D., Belgium; Prof.Jesse B. Jupiter, M. D., USA; Prof. Ivan Kempf, M. D., France; Prof. Rainer Kotz, M. D., Austria; prof. Christian Krettek, M.D.,Germany; Prof. Lars Lidgren, M. D., Ph.D., Sweden; Prof. René Marti, Ph.D., Netherlands; Prof. José de Palacios y Carvajal, M. D.,Spain; Prof. Marko Pećina, M. D., Ph. D., Croatia; Prof. Carsten Perka, M. D., Ph. D., Germany; Prof. Stephan Perren, M. D.,Switzerland; Prof. Wolfhart Puhl, M. D., Germany; Prof. Augusto Sarmiento, M. D., USA; Prof. Erich Schemitsch, M. D., Canada;Prof. Michael Schütz, M. D., Germany; Prof. Jan Serafin, M. D., Poland; Prof. Knut Stromsoe, M. D., Norway; Prof. Norbert P. Südkamp, M. D., Germany; Prof. Miklós Szendröi, M. D., Ph.D., Hungary; Prof. Vilmos Vécsei, M. D., Austria; Prof. James P. Waddell, M. D., Canada
Příspěvky do časopisu zasílejte na adresu:Manuscript submission and corespondence should be sent to contact adress:Doc. MUDr. Martin Krbec, CSc., e-mail: [email protected] publications: Prof. MUDr. Oldřich Čech, DrSc., e-mail: [email protected]á klinika 3. LF UK a FNKV, Šrobárova 50, 100 34 Praha 10, Česká Republika
ACTA CHIRURGIAE ORTHOPAEDICAE ET TRAUMATOLOGIAE ČECHOSLOVACAVydává Česká společnost pro ortopedii a traumatologii a Slovenská ortopedická a traumatologická spoločnosťPublished by the Czech Society for Orthopaedics and Traumatology and the Slovak Society for Orthopaedics and Traumatology
INDEXED IN:Science Citation Index Expanded (SciSearch®)Journal Citation Reports/Science EditionIndex Medicus and MEDLINEEXCERPTA MEDICAScopus
Každá z prací je recenzována.Each paper is reviewed.
www.achot.cz
Vedoucí redaktor / Editor-in-Chief:doc. MUDr. Martin Krbec, CSc.
Zástupci vedoucího redaktora / Deputy Editors:prof. MUDr. Antonín Sosna, DrSc.doc. MUDr. Milan Kokavec, Ph.D.prof. MUDr. Zdeněk Matějovsky, DrSc.
Vědecký sekretář / Scientific secretary:prof. MUDr. Oldřich Čech, DrSc.
Výkonná redakční rada / Executive Editors:prof. MUDr. Oldřich Čech, DrSc.doc. MUDr. Richard Chaloupka, CSc.doc. MUDr. Valér Džupa, CSc.
Časopis vychází 6krát ročně, reg. č. MK ČR E 344.Předplatné pro jednotlivce za rok 600 Kč nebo 32,50 EUR (pro objednávky ze Slovenska).Sazba SV, spol. s r.o., Na Louži 1/947, 101 00 Praha 10–Vršovice, tisk OMIKRON Praha, Doudova 22, 147 00 Praha 4.
Informace a inzerce: Galén, s. r.o., Na Bělidle 34/256, 150 00 Praha 5, tel.: 257 326 178,fax: 257 326 170, www.galen.cz, [email protected], [email protected] obsah a jazykové zpracování reklamy odpovídá inzerent.
Časopis je možno objednat: Postservis, oddělení předplatného, Poděbradská 39, 190 00 Praha 9,fax: 284 011 847, e-mail: [email protected], www.periodik.cz; objednávky do SR: [email protected]
Six issues per year. Reg. No. MK ČR E 344.Subscription: CZK 600 or 32,50 EUR (for orders from Slovak Republic).DTP: SV, spol. s r.o., Na Louži 1/947, Praha 10, Print: OMIKRON Praha, Doudova 22, 147 00 Praha 4.
Information, advertisement and subscription: Galén, s. r.o., Na Bělidle 34/256, 150 00 Praha 5, tel.: 257 326 178,fax: 257 326 170, www.galen.cz, [email protected] are responsible for the content and language quality of advertisements.

3 / Acta Chir. orthop. Traum. čech., 78, 2011 Supplementum
Review of the annual report of the Slovakian Arthroplasty Register – 2010
Contents Introduction …………………………………………………………………………………………. 4 Summary ……………………………………………………………………………………………. 5
History of SAR ……………………………………………………………………………………. 5 Statistical methods of SAR ………………………………………………………………………. 6
Basic survival characteristics of primary implants and their components in the SAR database …………...……………………………………………………………………………...
6
Testing of hypotheses about differences in mean time of survival between groups of primary implants and their components in SAR database ..……………………………...
7
SAR results in 2010 ………………………………………………………………………………... 8 Demographic evolution in Slovakia ……………………………………………………………. 8 Departments ………………………………………………………………………………….…... 11 Implant brands ……………………………………………………………………………….…... 17 Registry databases ………………………………………………………………………………. 17 Implant Tracking System ………………………………………………………………………... 18
Primary THA ………………………………………………………………………………………… 21 Age groups ……………………………………………………………………………………….. 24 Diagnoses ………………………………………………………………………………………… 24 Operative approaches …………………………………………………………………………… 25 Types of implants used …………………………………………………………………………. 25 Types of the fixation …..…………………………………………………………………………. 25 Brands of bone cement used ………………………..…………………………………………. 31 Cementing techniques …………………………………………………………………………... 32 Components and their combinations ………………………………………………………….. 33 Survival of the primary implants …………………………………………………….………….. 35 Acetabular components …………………………………………………………………………. 35 Femoral components ……………………………………………………………………………. 38 Component combinations ………………………………………………………………………. 41 Combinations of cemented components ……………………………………………………… 42 Combinations of uncemented components …………………………………………………… 43 Combinations of cemented and uncemented components …………………………………. 43
Revision THA ………………………………………………………………………………………. 47 Types of fixation of primary THA …………….………………………………………………… 47 Age groups ……………………………………………………………………………………….. 47 Reasons for the revision ………………………………………………………………………… 48 Revised elements of implants ………………………………………………………………. 49 Antibiotics prophylaxis in primary and revision THA …………………………….…………… 49
Primary TKA ………………………………………………………………………………………... 50 Age groups …………………………………………………………………………………......... 51 Diagnoses ………………………………………………………………………………………… 51 Surgical approaches …………………………………………………………………………….. 52 Types of implants used …………………………………………………………………………. 52 Types of the fixation ……………………………………………………………………………... 52 Brands of implants ………………………………………………………………………………. 53
Revision TKA ………………………………………………………………………………………. 55 Types of fixation of primary TKA …………………………………………………………..…… 55 Age groups ……………………………………………………………………………………….. 55 Reasons for the revision ………………………………………………………………………… 56 Revised elements of implants ………………………………………………………………. 56 Antibiotics prophylaxis in primary and revision TKA …………………………….…………… 57
Glossary …………………………………………………………………………………………….. 58
4 / Acta Chir. orthop. Traum. čech., 78, 2011 Supplementum
Review of the annual report of the Slovakian Arthroplasty Register – 2010
Introduction
The Slovakian Arthroplasty Register sets a fine example of how the devoted work of a small group of dedicated individuals, often battling against a degree of resistance to change, can create and incrementally modernise an extremely valuable resource in a relatively short span of time. From the most humble beginnings in 2003, Dr. Libor Nečas and his team have brought the SAR into the forefront of the brotherhood of inter-national arthroplasty registers. This summary of the SAR’s annual report for 2010 demonstrates unequivocally how, in collaboration with govern-ment agencies, the Slovakian orthopaedic com-munity and interested parties in the surgical in-dustry, a modern resource, harnessing imagina-tive technological innovations has evolved into a valuable statistical tool It is always a challenge to précis a complex statistical exercise, as is em-bodied in the full report in the Slovakian lan-guage, but this summary seeks to present to the
English-speaking world the important elements in a digestible format. The text is clear and the at-tractive graphics make it as pleasurable as is in the full report in the Slovakian language, but this summary seeks to present to the English-speaking world the important elements in a di-gestible format possible to study. That endeavour has undoubtedly succeeded. Important trends, desirable and otherwise can be picked up, there-by navigating and informing the process of change into advantageous directions, constituting evidence-based progress. It is not for this author to comment on the conclusions reached and their relevance to the practice of joint arthroplasty, that is for those active in the specific fields covered by the report, but to congratulate those responsible on their industrious perseverance and utter dedi-cation, which together have created, and con-tinue to improve, this invaluable project.
Professor Christopher L. Colton, English language editor to SAR

5 / Acta Chir. orthop. Traum. čech., 78, 2011 Supplementum
Review of the annual report of the Slovakian Arthroplasty Register – 2010
Summary This annual report of Slovakian Arthroplasty Reg-ister (SAR) is an official document dealing with all arthroplasty procedures performed in Slovakia from January 1st until December 30th, 2010. Dur-ing that period the population of Slovakia reached 5,435,273. During the observed period 4,970 primary arthroplasties and 457 revision arthro-plasties were performed. In general, the number of arthroplasty procedures depends on the de-mographic growth of the population. This annual report is divided into two main parts – arthroplas-ty of the hip joint and the arthroplasty of the knee joint: it contains summary statistics from all surgi-cal departments performing arthroplasty proce-dures. In the hip joint section, it evaluates data from 40 orthopaedic and traumatology depart-ments in 2010, the incidence of primary total hip arthroplasty (THA) was 91.42 per 100,000 inhab-itants. From the year 2003, when the incidence was 39.39 per 100,000 inhabitants, the percent-age growth has been 232%. In 2010, the revision rate reached 9.20%, representing annual in-crease of 1.1%. The revision rate in whole ob-served period 2003–2010 reached 9.15%.The mean age of all patients undergoing primary THA was 64.66 years. Sixty percent were female and 40% male. Primary coxarthrosis was the main indication for the surgery in 57.75%. Compared to 2003, when it was 54.33% the increase was minimal. In 2003, dysplasia was as the main indi-cation in 10.01% and in 2010 this figure reached 11.39%. In 19.68% the indication was femoral neck fracture. Regarding the type of the arthro-plasty, total hip arthroplasty was used in 86.78% of all cases, unipolar hemiarthroplasty was used in 12.45% cases and bipolar hemiarthroplasty accounted for only 0.76% of all cases. Cement was used for all components in 35.45% of all arthoplasties, 53.25% were uncemented and 11.28% were hybrids. We have observed signi-ficat growth in the uncemented type of fixation. In 2003, the uncemented type of fixation was used in only 23.07% of all cases. The SAR started with data collection in total knee arthroplasty (TKA) on January 1st, 2006. In 2010, TKA was practised in 28 surgical departments, in which 2,198 primary and 97 revision arthroplasties were performed. Females comprised 67.38% and males 32.62%.
The incidence of TKA was 40.44 per 100,000 of population. In 2010, the revision rate reached 4.41%, representing an annual growth of 0.04% compared to 2009. During the period 2003–2010, the overall TKA revision rate was 3.62%. In 2010, primary bicondylar arthroplasty was the chosen TKA technique in 85.53% of all cases: 97.04% of all implants were fixed with bone cement, 1.36% were uncemented and 1.59% of all knees were hybrids.
History of SAR The main goals of the SAR are: the demographic evaluation of the patients undergoing arthroplasty procedures, analyses of the risk factors, provid-ing as much information as possible about the implants used in the defined territory, observing the correlation of the survival rate with the differ-ent diagnostic and technical factors, and, finally, identifying those implants associated with inferior outcomes. The Slovakian Orthopedic and Trau-matology Society (SOTS) decided, in 2001, to follow the Scandinavian model and create a na-tional implant registry. In 2002, the project be-came a reality; the SAR was officially launched on January 1st 2003 and became a member of the new European Arthroplasty Register (EAR). The seat of the SAR is University Hospital Martin. From 2010, the SAR has been a full member of the International Society of Arthroplasty Registers (ISAR). The SAR initially covered 26 surgical departments and acquired 2,412 THA protocols. From the beginning, participation was voluntary and by 2004 the number of participating depart-ments reached 36 orthopaedic and traumatology clinics. During 2006, the SAR changed the re-cording of protocols from paper forms to on-line. More than 90% of all orthopaedic departments, but only 50% of traumatology departments were contributing to the registry. Based on these data and on negotiations with the Slovakian Ministry of Health, the new regulation No.20758/2004-OSZS, came into force on October 1st 2004 this regulation requires that each participating unit must report its statistics every two weeks.

6 / Acta Chir. orthop. Traum. čech., 78, 2011 Supplementum
Review of the annual report of the Slovakian Arthroplasty Register – 2010
Statistical methods of SAR Descriptive statistics of SAR data, implants and their components, are built up based on a break-down of the THA and TKA database into the fol-lowing four groups in eight time intervals in total, year-by-year (January 1st, 2003 to December 31st, 2010): 1. alive and not revised, 2. alive and revised, 3. dead and not revised, and 4. dead and revised. Considering the very low numbers of all de-ceased patients, 2.08% only, this part of the da-tabase will not be analysed further. Additionally, based on the SAR analysis 2003–2008 (Chart 17), the survival rates of the whole database (including dead) and of living patients are almost identical. The SAR database consists of the contribution of 40 departments – 12 performing THA and 28 both THA and TKA. The departments are charac-terised basically by the numbers of primary and revision THA and TKA performed. For the particular year (2003–2010), the frequen-cies of THA and TKA are recorded and compared with the databases of Ministry of Health of the Slovak Republic and the databases of compo-nent/implant distributors Since 2009, an Implant Tracking System (ITS), based on Global Trade Item Number (GTIN) bar-codes and the Health Industry Business Commu-nications Council (HIBCC) system, has been used to identify the implants. The database is divided into two sub-databases, THA and TKA, respectively, each of which is further divided into primary and revised sub-groups. Basic characteristics are summarized in frequency tables and bar plots as follows: implantation frequency, gender, age groups at five-year intervals (16 in total), diagnosis as indication for THA/TKA, THA/TKA type, THA/TKA surgical approach, type of fixation, type of bone cement for arthroplasty and technique of cementing.
In addition, for secondary operations: type of fixation of revised implant, reason for revision THA/TKA, revised components, and type of revised component are recorded for revised operations. Basic survival characteristics of primary implants and their components in the SAR database Statistical analyses were performed, using R software, as eight-year follow up (from January 1st, 2003 to December 31st, 2010) with censored date equal to December 31st, 2010. The following basic characteristics: 1. Revision Rate (RR), 2. Survival Rate (SR), 3. Hazard Rate (HR), and 4. Revision Burden (RB) are used to describe the failure and survival of implants/components. Of the above-mentioned four basic characteristics, only the frequencies of failed and survived implants/components were used, but not the time to failure or censorship, which are necessary to describe implant/compo-nent survival completely. Therefore, in addition to (1) to (4), 5. crude (specific) incidence, 6. mean survival time (in years), 7. standard deviation of mean survival time and 8. 95% confidence interval (CI) of mean survival
time characterized by its lower and upper bounds (LB and UB, respectively)
were also used. For the particular implant/component groups and their combinations, Kaplan-Meier survival curves are derived as follows: 1. for five most frequent acetabular components, 2. for five most frequent femoral components, 3. for five most frequent uncemented component
combinations, 4. for five most frequent cemented component
combinations and 5. for five most frequent hybrid component com-
binations.

7 / Acta Chir. orthop. Traum. čech., 78, 2011 Supplementum
Review of the annual report of the Slovakian Arthroplasty Register – 2010
Testing of hypotheses about differences in mean time of survival between groups of primary implants and their components in SAR database Testing of hypotheses about differences in mean time of survival between groups of primary im-plants and their components is done for following groups: 1. component type – acetabular and femoral, 2. interaction of the first order – component type
(acetabular and femoral) vs type of fixation (uncemented and cemented),
3. type of the component fixation (uncemented, cemented, hybrid, reverse hybrid, cemented and uncemented hemiartroplasty),
4. gender – females and males, 5. age groups – less than 55 years [min, 55],
from 55 to 65 years (55,65], from 65 to 75 years (65,75], and more than 75 years (75,max],
6. interaction of the first order – gender vs age groups,
7. interaction of the first order – gender vs type of fixation,
8. interaction of the first order – age groups vs type of fixation,
9. interaction of the second order – age groups vs gender vs type of fixation.
The results are presented as Kaplan-Meier sur-vival curves and p-values (to simplify the outputs, test statistics are omitted), using the following terminology A. significance, if p-value fails to the interval
[0,0.05), B. marginal significance, if p-value fails to the
interval [0.05,0.1). A revision procedure is defined as any operation replacing any component. Therefore, the Kaplan-Meier survival curve is used to calculate the time from primary insertion to the first revision. A sur-vival time is characterized by implementing both failed and censored implants into the calculation. In this paper, we focus mainly on the type of fixa-tion and the cumulative revision rate, i.e., an ad-ditional basic characteristic. Survival analysis is used to describe the time to revision (failure) where the frequency of revisions increases with time. Therefore, the break-down of the database into four subgroups – alive and not revised, alive
and revised, dead and not revised, and dead and revised, is important (Tab. 1 and Chart 1). Tab. 1. THA database break-down
Year Living not revised
Living revised
Dead not revised
Dead revised
2003 1 750 120 247 2
2004 2 536 114 432 4
2005 2 514 92 364 6
2006 3 141 82 369 3
2007 3 914 86 258 2
2008 4 240 79 92 0
2009 4 627 64 76 0
2010 4 893 42 34 1
Chart 1. THA database break-down
The same structure can also be seen for TKA (Tab. 2, Chart 2), where the differences between THA and TKA are due to the shorter TKA follow-up. We presume that both databases will follow the same trend in the next few years. Tab. 2. TKA database break-down
Year Living not revised
Living revised
Dead not revised
Dead revised
2006 827 38 27 0
2007 1 312 34 18 0
2008 1 573 34 4 0
2009 2 000 21 7 0
2010 2 192 4 2 0
Chart 2. TKA database break-down
75%
80%
85%
90%
95%
100%
2003 2004 2005 2006 2007 2008 2009 2010
Living not revisedLiving revisedDead not revisedDead revised
85%
90%
95%
100%
2006 2007 2008 2009 2010
Living not revisedLiving revisedDead not revisedDead revised
© Slovakian Arthroplasty Register 2011
© Slovakian Arthroplasty Register 2011
© Slovakian Arthroplasty Register 2011
© Slovakian Arthroplasty Register 2011

8 / Acta Chir. orthop. Traum. čech., 78, 2011 Supplementum
Review of the annual report of the Slovakian Arthroplasty Register – 2010
SAR results in 2010 By 30th December 2010 we had received 32,942 THA protocols, of which 30,183 were primary and 2,759 were revision procedures. The annual in-crease was 5.30%. In both the following Tab. 3 and Chart 3 the annual increases in primary and revision THA are shown. Tab. 3. Annual growth of THA
Year Primary THA Revision THA %
2003 2 119 293
2004 3 086 333 41,75%
2005 2 976 270 -5,06%
2006 3 595 335 21,07%
2007 4 260 346 17,20%
2008 4 411 339 3,13%
2009 4 767 386 8,48%
2010 4 970 457 5,30%
Chart 3. Annual growth of THA
Chart 3 shows that the increase of primary THA procedures is not linked to revision THA. From both Tab. 4 and Chart 4, it is clear that the annual growth in TKA in 2007 was 54%, compared to 2006. In 2010 there was less growth (8.66%), com-pared to 2009. The number of revision TKAs follows the trend of the primary TKA, as shown in the Chart No. 4 Tab. 4. Annual growth of TKA
Year Primary TKA Revision TKA %
2006 892 20
2007 1 364 41 54,06%
2008 1 611 51 18,29%
2009 2 028 84 27,08%
2010 2 198 97 8,66%
Chart 4. Annual growth of TKA
Demographic evolution in Slovakia In this report, we have used the predictions of Slovakian population 2020–2050 published by the Slovak Statistical Office. Accordingly, the age groups 45–64 and 65+, which are potentially the main constituencies for arthroplasty procedures, will grow over the next 30 years. This is demon-strated in the Tab. 5 and Chart 5. Tab. 5. Prognosis of Slovak population 2020–2050
Year Age groups
0-17 18-44 45-64 65+
2020 944 490 2 048 787 1 488 018 935 593
2030 876 435 1 678 101 1 631 935 1 153 779
2040 787 502 1 456 177 1 609 760 1 285 931
2050 770 490 1 370 926 1 271 850 1 466 923
Chart 5. Prognosis of Slovak population 2020–2050
The most age group increasing most will be the group 65+, this group growing from 17.27% in 2020 to 30.06% in 2050. This growth will drive the demand for arthroplasty in the future. The number of inhabitants in Slovakia by 31st December, 2010 reached 5,435,273.
0
1 000
2 000
3 000
4 000
5 000
6 000
2003 2004 2005 2006 2007 2008 2009 2010
Primary THARevision THA
0
500
1 000
1 500
2 000
2 500
2006 2007 2008 2009 2010
Primary TKARevision TKA
0%10%20%30%40%50%60%70%80%90%
100%
2020 2030 2040 2050
17,43 % 15,79 %
37.82 %
27,47 %
17.27 %
28,09 %
26.06 %
30.06 %
© Slovakian Arthroplasty Register 2011
© Slovakian Arthroplasty Register 2011
© Slovakian Arthroplasty Register 2011
© Slovakian Arthroplasty Register 2011
© Slovakian Arthroplasty Register 2011
© Slovakian Arthroplasty Register 2011

9 / Acta Chir. orthop. Traum. čech., 78, 2011 Supplementum
Review of the annual report of the Slovakian Arthroplasty Register – 2010
Tab. 6. Slovakian population 2003–2010
Year Male Female Total
2003 2 611 124 2 768 929 5 380 053
2004 2 613 490 2 771 332 5 384 822
2005 2 615 872 2 773 308 5 389 180
2006 2 618 284 2 775 353 5 393 637
2007 2 623 127 2 777 871 5 400 998
2008 2 629 804 2 782 450 5 412 254
2009 2 636 938 2 787 987 5 424 925
2010 2 642 240 2 793 033 5 435 273
Chart 6. No. of inhabitants in Slovakia 2003–2010
Tab. 7. Mean age, gender, type of fixation for primary THA
Groups n mean LB UB sd min 25% median 75% max
All 30152 64,66 64,62 64,70 12,37 9 56 66 74 100
F 18449 66,00 65,95 66,05 12,56 9 58 67 75 100
M 11703 62,54 62,48 62,60 11,74 14 55 63 71 99
Uncemented 11520 55,09 55,03 55,15 10,22 9 49 55 61 87
Cemented 9471 69,95 69,90 70,01 7,25 20 66 71 75 98
Hybrids 4339 63,76 63,67 63,84 7,96 20 59 64 69 93
Reverse hybrids 340 58,57 58,20 58,94 12,23 22 50 57 68 87
Hemiarthroplasty uncemented 91 76,27 75,55 77,00 12,53 35 72 80 85 95
Hemiarthroplasty cemented 4391 79,45 79,37 79,54 7,71 14 76 80 84 100
F: uncemented 6154 54,91 54,83 54,99 10,49 9 49 55 61 87
F: cemented 6248 70,42 70,36 70,49 7,08 20 67 71 75 98
F: hybrids 2472 64,19 64,08 64,30 8,00 20 59 65 70 89
F: reverse hybrids 218 59,23 58,76 59,71 12,86 22 51 59 70 87
F: hemiarthroplasty uncemented 60 78,02 77,12 78,92 12,66 35 76 81 85 95
F: hemiarthroplasty cemented 3297 79,91 79,82 80,00 7,27 14 76 80 84 100
M: uncemented 5366 55,30 55,21 55,38 9,89 14 50 56 61 85
M: cemented 3223 69,05 68,95 69,14 7,48 28 65 70 74 97
M: hybrids 1867 63,19 63,06 63,31 7,89 21 58 64 68 93
M: reverse hybrids 122 57,39 56,80 57,97 10,95 30 50 56 65 83
M: hemiarthroplasty uncemented 31 72,90 71,70 74,11 11,73 49 64 75 82 89
M: hemiarthroplasty cemented 1094 78,08 77,90 78,25 8,77 35 73 79 84 99
color mean age gradation CI confidence interval (of the mean age)
about 75-80 LB lower bound of 95% CI
about 70 UB upper bound of 95% CI
about 65 min minimal age about 60 25% first quartile about 55 50% second quartile (median)
n number of components 75% third quartile
mean mean age at the time of primary operation max maximal age
As shown in the Tab. 6 and in the Chart 6, the gender ratio stays virtually unchanged. In 2003, it was 48.53% male to 51.47% female. In 2010, it was 48.61% male to 51.39% female. During the period 2003–2010, the mean age for primary THA was 64.66 (male 62.54 and female 66.00), as in Chart 7. Tab. 7 shows the mean age of
operated patients according to gender and type of fixation. From this table we can conclude that, in all age groups, women have a higher mean age than men. The biggest difference is in uncemented hemiarthroplasty, where the mean age of operated males was in 5.12 years lower than females.
Male
Female
2 500 000
2 550 000
2 600 000
2 650 000
2 700 000
2 750 000
2 800 000
2003 2004 2005 2006 2007 2008 2009 2010
© Slovakian Arthroplasty Register 2011 © Slovakian Arthroplasty Register 2011
© Slovakian Arthroplasty Register 2011
10 / Acta Chir. orthop. Traum. čech., 78, 2011 Supplementum
Review of the annual report of the Slovakian Arthroplasty Register – 2010
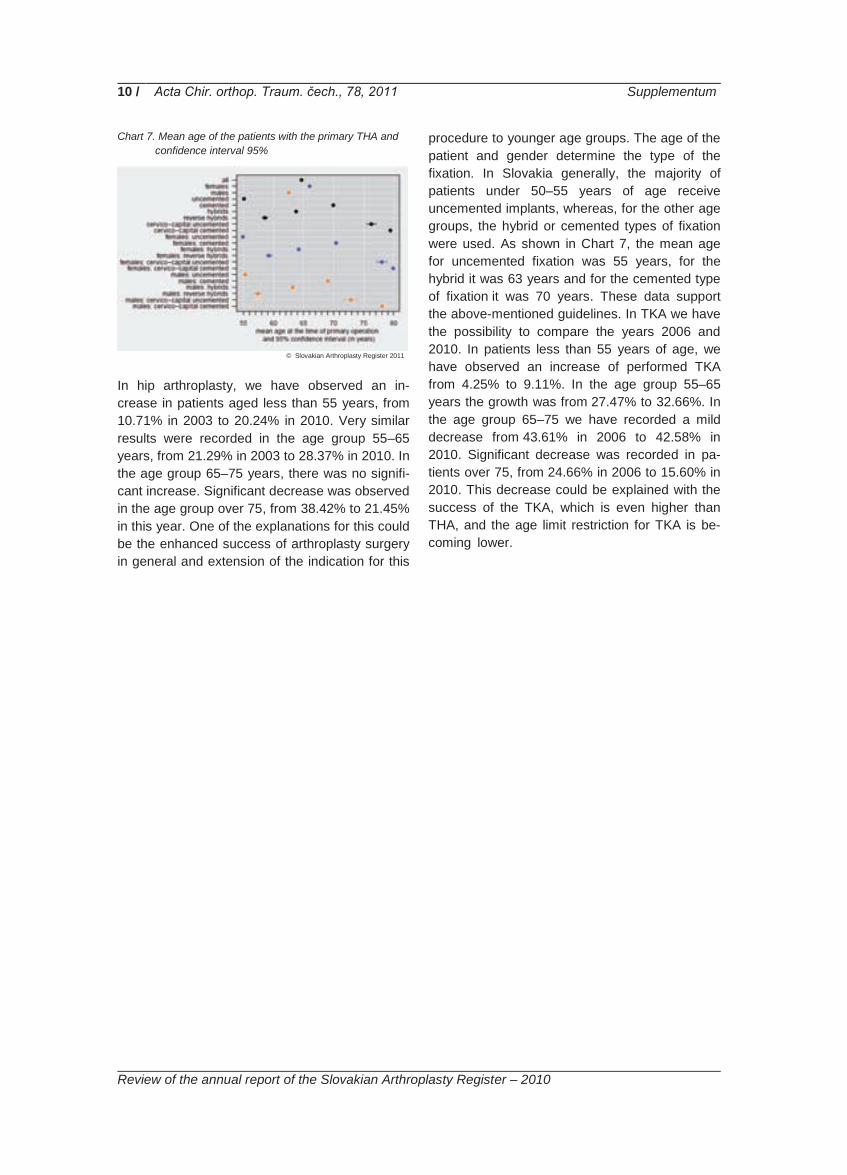
Chart 7. Mean age of the patients with the primary THA and confidence interval 95%
In hip arthroplasty, we have observed an in-crease in patients aged less than 55 years, from 10.71% in 2003 to 20.24% in 2010. Very similar results were recorded in the age group 55–65 years, from 21.29% in 2003 to 28.37% in 2010. In the age group 65–75 years, there was no signifi-cant increase. Significant decrease was observed in the age group over 75, from 38.42% to 21.45% in this year. One of the explanations for this could be the enhanced success of arthroplasty surgery in general and extension of the indication for this
procedure to younger age groups. The age of the patient and gender determine the type of the fixation. In Slovakia generally, the majority of patients under 50–55 years of age receive uncemented implants, whereas, for the other age groups, the hybrid or cemented types of fixation were used. As shown in Chart 7, the mean age for uncemented fixation was 55 years, for the hybrid it was 63 years and for the cemented type of fixation it was 70 years. These data support the above-mentioned guidelines. In TKA we have the possibility to compare the years 2006 and 2010. In patients less than 55 years of age, we have observed an increase of performed TKA from 4.25% to 9.11%. In the age group 55–65 years the growth was from 27.47% to 32.66%. In the age group 65–75 we have recorded a mild decrease from 43.61% in 2006 to 42.58% in 2010. Significant decrease was recorded in pa-tients over 75, from 24.66% in 2006 to 15.60% in 2010. This decrease could be explained with the success of the TKA, which is even higher than THA, and the age limit restriction for TKA is be-coming lower. .
.
© Slovakian Arthroplasty Register 2011

11 / Acta Chir. orthop. Traum. čech., 78, 2011 Supplementum
Review of the annual report of the Slovakian Arthroplasty Register – 2010
Departments The first parameter for department selection is the number of arthroplasties performed per an-num. This parameter does not discriminate be-tween primary and revision arthroplasties. According to the number of surgeries performed, Tab. 8. Departments according to the No. of performed THA
Department Primary THA
Revision THA Total
Bratislava – I.Orth.-traum. 399 106 505
Ružomberok – Traum.-orth. 446 28 474
Bratislava – II.Orth. 326 44 370
Prešov – Orth. 287 40 327
B. Bystrica – Orth. 271 44 315
Martin – Orth.-traum. 267 45 312
Košice – Orth.-traum. 249 10 259
Žilina – Orth. 191 13 204
Nitra – Traum.-orth. 195 6 201
Poprad – Orth. 146 16 162
N. Zámky – Orth. 157 4 161
Trnava – Traum.-orth. 142 3 145
Topoľčany – Orth. 140 3 143
Košice – Šaca - Orth. 114 14 128
Bojnice – Orth. 115 10 125
Košice ŽZ - Orth. 111 11 122
Michalovce – Orth. 111 8 119
Skalica – Orth.-traum. 102 13 115
B. Bystrica – Traum. 109 2 111
Bratislava – Traum. 97 7 104
N. Zámky – Traum. 92 4 96
D. Kubín – Orth.-traum. 92 0 92
Trenčín – Orth. 75 9 84
Bratislava S & E - Orth. 80 0 80
D. Streda – Traum. 76 0 76
Trenčín – Traum. 72 1 73
Piešťany – Orth. 71 0 71
Galanta – Traum.-orth. 68 2 70
Lučenec – Orth.-traum. 58 2 60
Žilina - Traum. 60 0 60
Košice – Traum. 45 8 53
Humenné - Orth. 41 0 41
L. Mikuláš – Traum.-orth. 38 1 39
P. Bystrica – Orth. 39 0 39
Michalovce – Traum. 35 0 35
Topoľčany – Traum. 31 2 33
Vranov n. Topľou - Traum. 11 1 12
Trstená – Traum. 7 0 7
Partizánske – Traum. 3 0 3
Bratislava DFNsP - Orth. 1 0 1
Total 4 970 457 5 427
we divide all departments in four groups: De-partments performing more than 200, between 200 and 100, between 99 and 50, and depart-ments performing less than 50 arthroplasties per annum. Tab. 9. Departments according to the No. of performed TKA
Department Primary TKA
Revision TKA Total
Ružomberok – Traum.-orth. 261 15 276
Prešov – Orth. 202 11 213
Bratislava – I.Orth.-traum. 175 28 203
Martin – Orth.-traum. 178 12 190
Bratislava – II.Orth.-traum. 162 10 172
B. Bystrica – Orth. 161 4 165
Topoľčany – Orth 109 1 110
Nitra – Traum.-orth. 100 2 102
Žilina – Orth. 98 1 99
N. Zámky – Orth. 97 0 97
Poprad – Orth. 92 4 96
Košice – Orth.-traum. 94 1 95
Košice – Šaca - Orth. 87 2 89
Piešťany – Orth. 51 0 51
D. Streda – Traum. 46 0 46
Skalica – Orth.-traum. 41 3 44
Bojnice – Orth. 42 1 43
Trnava – Traum.-orth. 42 0 42
Trenčín – Orth. 39 1 40
Bratislava – Traum. 26 0 26
Košice ŽZ – Orth. 25 1 26
Bratislava S & E - Orth. 24 0 24
D. Kubín – Orth.-traum. 24 0 24
Košice – Traum. 8 0 8
Humenné - Orth. 5 0 5
B. Bystrica – Traum. 3 0 3
Bratislava DFNsP - Orth. 3 0 3
Žilina - Traum. 3 0 3
Total 2 198 97 2 295
The next parameter for sorting the departments is the specialty. In Slovakia, arthroplasty such pro-cedures are performed in orthopaedic, orthopae-dic-traumatology, traumatology and, in some regions, general surgery departments perform hemiarthroplasties. Therefore, the number of departments performing arthroplasty procedures is not stable and depends on the contractual relationships between the hospitals and health insurance organisations. Another selection is according to the health care provider.
© Slovakian Arthroplasty Register 2011
© Slovakian Arthroplasty Register 2011
12 / Acta Chir. orthop. Traum. čech., 78, 2011 Supplementum
Review of the annual report of the Slovakian Arthroplasty Register – 2010
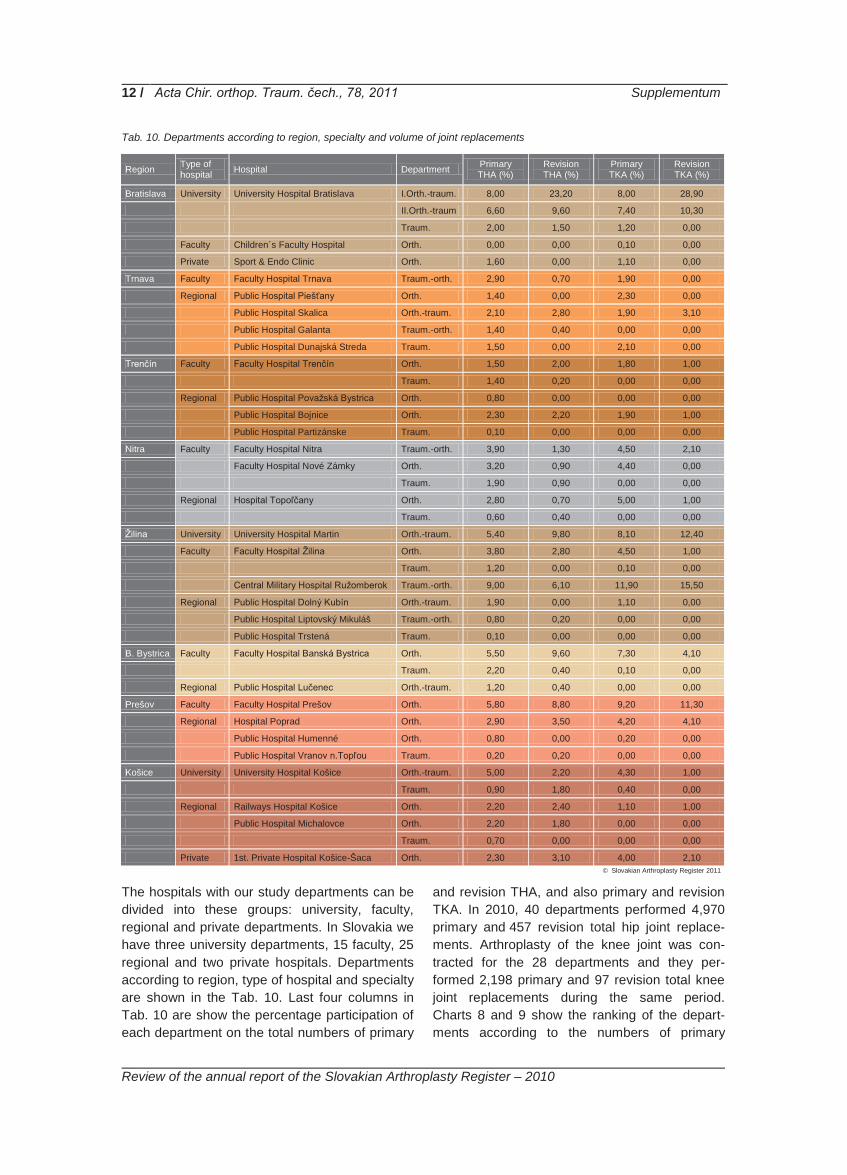
Tab. 10. Departments according to region, specialty and volume of joint replacements
Region Type of hospital Hospital Department Primary
THA (%) Revision THA (%)
Primary TKA (%)
Revision TKA (%)
Bratislava University University Hospital Bratislava I.Orth.-traum. 8,00 23,20 8,00 28,90
II.Orth.-traum 6,60 9,60 7,40 10,30
Traum. 2,00 1,50 1,20 0,00
Faculty Children´s Faculty Hospital Orth. 0,00 0,00 0,10 0,00
Private Sport & Endo Clinic Orth. 1,60 0,00 1,10 0,00
Trnava Faculty Faculty Hospital Trnava Traum.-orth. 2,90 0,70 1,90 0,00
Regional Public Hospital Piešťany Orth. 1,40 0,00 2,30 0,00
Public Hospital Skalica Orth.-traum. 2,10 2,80 1,90 3,10
Public Hospital Galanta Traum.-orth. 1,40 0,40 0,00 0,00
Public Hospital Dunajská Streda Traum. 1,50 0,00 2,10 0,00
Trenčín Faculty Faculty Hospital Trenčín Orth. 1,50 2,00 1,80 1,00
Traum. 1,40 0,20 0,00 0,00
Regional Public Hospital Považská Bystrica Orth. 0,80 0,00 0,00 0,00
Public Hospital Bojnice Orth. 2,30 2,20 1,90 1,00
Public Hospital Partizánske Traum. 0,10 0,00 0,00 0,00
Nitra Faculty Faculty Hospital Nitra Traum.-orth. 3,90 1,30 4,50 2,10
Faculty Hospital Nové Zámky Orth. 3,20 0,90 4,40 0,00
Traum. 1,90 0,90 0,00 0,00
Regional Hospital Topoľčany Orth. 2,80 0,70 5,00 1,00
Traum. 0,60 0,40 0,00 0,00
Žilina University University Hospital Martin Orth.-traum. 5,40 9,80 8,10 12,40
Faculty Faculty Hospital Žilina Orth. 3,80 2,80 4,50 1,00
Traum. 1,20 0,00 0,10 0,00
Central Military Hospital Ružomberok Traum.-orth. 9,00 6,10 11,90 15,50
Regional Public Hospital Dolný Kubín Orth.-traum. 1,90 0,00 1,10 0,00
Public Hospital Liptovský Mikuláš Traum.-orth. 0,80 0,20 0,00 0,00
Public Hospital Trstená Traum. 0,10 0,00 0,00 0,00
B. Bystrica Faculty Faculty Hospital Banská Bystrica Orth. 5,50 9,60 7,30 4,10
Traum. 2,20 0,40 0,10 0,00
Regional Public Hospital Lučenec Orth.-traum. 1,20 0,40 0,00 0,00
Prešov Faculty Faculty Hospital Prešov Orth. 5,80 8,80 9,20 11,30
Regional Hospital Poprad Orth. 2,90 3,50 4,20 4,10
Public Hospital Humenné Orth. 0,80 0,00 0,20 0,00
Public Hospital Vranov n.Topľou Traum. 0,20 0,20 0,00 0,00
Košice University University Hospital Košice Orth.-traum. 5,00 2,20 4,30 1,00
Traum. 0,90 1,80 0,40 0,00
Regional Railways Hospital Košice Orth. 2,20 2,40 1,10 1,00
Public Hospital Michalovce Orth. 2,20 1,80 0,00 0,00
Traum. 0,70 0,00 0,00 0,00
Private 1st. Private Hospital Košice-Šaca Orth. 2,30 3,10 4,00 2,10
The hospitals with our study departments can be divided into these groups: university, faculty, regional and private departments. In Slovakia we have three university departments, 15 faculty, 25 regional and two private hospitals. Departments according to region, type of hospital and specialty are shown in the Tab. 10. Last four columns in Tab. 10 are show the percentage participation of each department on the total numbers of primary
and revision THA, and also primary and revision TKA. In 2010, 40 departments performed 4,970 primary and 457 revision total hip joint replace-ments. Arthroplasty of the knee joint was con-tracted for the 28 departments and they per-formed 2,198 primary and 97 revision total knee joint replacements during the same period. Charts 8 and 9 show the ranking of the depart-ments according to the numbers of primary
© Slovakian Arthroplasty Register 2011

13 / Acta Chir. orthop. Traum. čech., 78, 2011 Supplementum
Review of the annual report of the Slovakian Arthroplasty Registry – 2010
Chart 8. Departments according the volume of primary THA
and revision THA performed. There is no correla-tion between the primary and revision replace-ment, either in volume or by department. The first
five departments have performed 34.90% of all primary and 61.00% of all revision surgeries. .
Chart 9. Departments according the volume of revision THA
Charts 10 and 11 show these figures for TKAs. The first five departments performed 44.60% of all primary and 78.40% of all revision TKAs. In relation to TKA, the first five departments ranked for primary procedures, are not the same five
when departments are ranked for numbers of revision procedures. Only five departments per-formed more than 10 revision knee arthroplasties per annum, but nine departments performed be-tween 1 and 4 revision knee joint arthroplasties.
Chart 10. Departments according the volume of primary TKA
050
100150200250300350400450
0
20
40
60
80
100
0
50
100
150
200
250
© Slovakian Arthroplasty Register 2011
© Slovakian Arthroplasty Register 2011
© Slovakian Arthroplasty Register 2011

14 / Acta Chir. orthop. Traum. čech., 78, 2011 Supplementum
Review of the annual report of the Slovakian Arthroplasty Registry – 2010
Chart 11. Departments according the volume of revision TKA
University and faculty departments have per-formed 70.20% of all primary and 81.80% of all revision total hip arthroplasties, as shown in Tab. 11 and Chart 12. For total knee joints the corre-sponding figures are 75.02% of all primary and 87.60% of all revisions – Tab. 12 and Chart 13. Tab. 11. Volume of primary and revision THA according to
the type of department
Type of hospital Primary THA (%) Revision THA (%)
University 27,90 48,10
Faculty 42,30 33,70
Regional 26,00 15,00
Private 3,90 3,10
Chart 12. Volume of primary and revision THA according to
the type of department
As it is clear from Chart 12, majority of hip revi-sion arthroplasties were performed in university or faculty departments. Fifteen per cent of revi-sions were performed in regional departments, and only 3.10% of all revisions were performed in private departments and primary/revision ratio in these departments was 1.25:1. With regard to knee arthroplasty, regional and private depart-ments performed only 12.30% of all revision pro-
Tab. 12. Volume of primary and revision TKA according to the type of department
Type of hospital Primary TKA (%) Revision TKA (%)
University 29,40 52,60
Faculty 45,80 35,00
Regional 19,80 10,20
Private 5,10 2,10
Chart 13. Volume of performed primary and revision THA
according to the type of department
cedures. A very sensitive parameter for arthro-plasty results is the volume of performed revi-sions in by department. To evaluate this figure precisely we have to consider the provenance of patients requiring revision. According to this, each department has two groups of patients. The first group are the revisions of the primary im-plantation performed in the same department. The second group are those revision patients referred whose primary implantations had been performed in other departments. Tab. 13 pre-sents the departments ordered according to this parameter. Most departments are performing the majority of revisions in cases in which the primary replacement was performed in the same depart-ment.
0
5
10
15
20
25
30
27,90 48,10
42,30
33,70
26,00 15,00
3,90 3,10
0%10%20%30%40%50%60%70%80%90%
100%
Primary THA (%) Revision THA (%)
29,40 52,60
45,80
35,00
19,80 10,20
5,10 2,10
0%10%20%30%40%50%60%70%80%90%
100%
Primary TKA (%) Revision TKA (%)
© Slovakian Arthroplasty Register 2011
© Slovakian Arthroplasty Register 2011
© Slovakian Arthroplasty Register 2011
© Slovakian Arthroplasty Register 2011
© Slovakian Arthroplasty Register 2011
15 / Acta Chir. orthop. Traum. čech., 78, 2011 Supplementum
Review of the annual report of the Slovakian Arthroplasty Registry – 2010
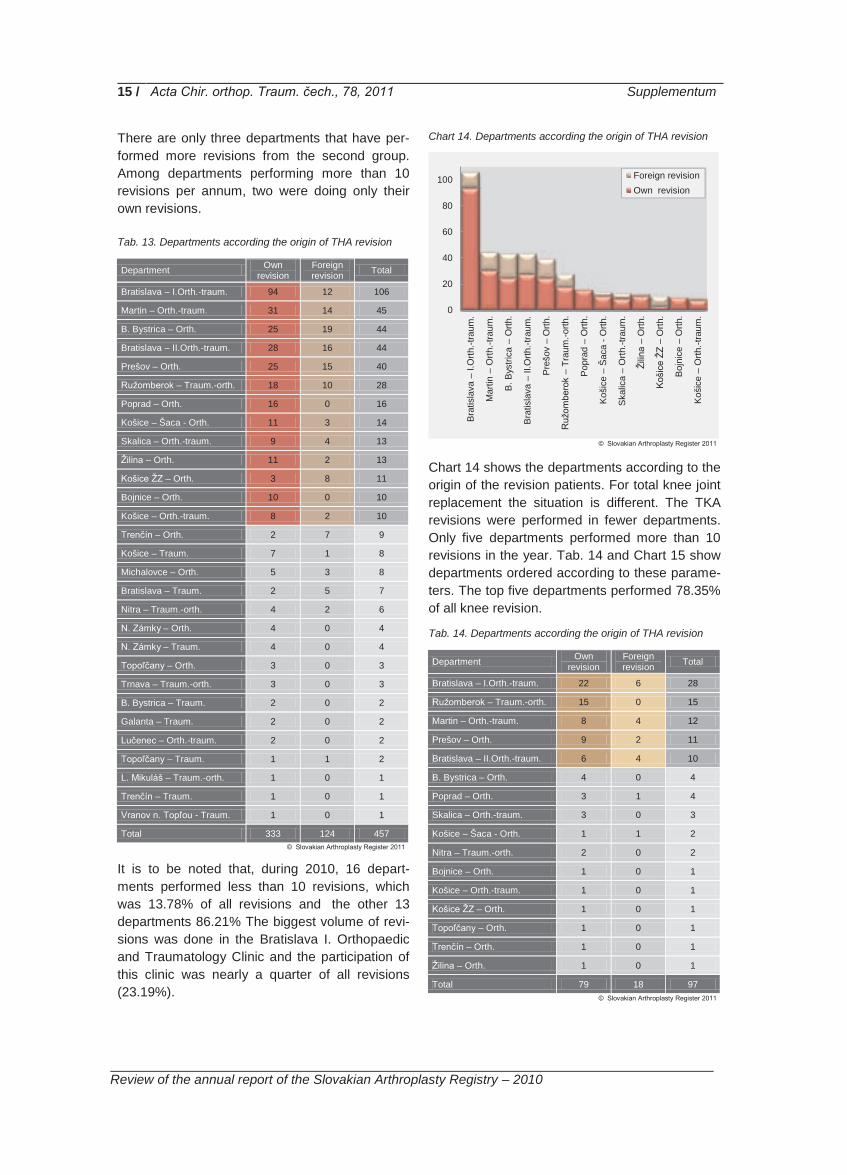
There are only three departments that have per-formed more revisions from the second group. Among departments performing more than 10 revisions per annum, two were doing only their own revisions. Tab. 13. Departments according the origin of THA revision
Department Own revision
Foreign revision Total
Bratislava – I.Orth.-traum. 94 12 106
Martin – Orth.-traum. 31 14 45
B. Bystrica – Orth. 25 19 44
Bratislava – II.Orth.-traum. 28 16 44
Prešov – Orth. 25 15 40
Ružomberok – Traum.-orth. 18 10 28
Poprad – Orth. 16 0 16
Košice – Šaca - Orth. 11 3 14
Skalica – Orth.-traum. 9 4 13
Žilina – Orth. 11 2 13
Košice ŽZ – Orth. 3 8 11
Bojnice – Orth. 10 0 10
Košice – Orth.-traum. 8 2 10
Trenčín – Orth. 2 7 9
Košice – Traum. 7 1 8
Michalovce – Orth. 5 3 8
Bratislava – Traum. 2 5 7
Nitra – Traum.-orth. 4 2 6
N. Zámky – Orth. 4 0 4
N. Zámky – Traum. 4 0 4
Topoľčany – Orth. 3 0 3
Trnava – Traum.-orth. 3 0 3
B. Bystrica – Traum. 2 0 2
Galanta – Traum. 2 0 2
Lučenec – Orth.-traum. 2 0 2
Topoľčany – Traum. 1 1 2
L. Mikuláš – Traum.-orth. 1 0 1
Trenčín – Traum. 1 0 1
Vranov n. Topľou - Traum. 1 0 1
Total 333 124 457
It is to be noted that, during 2010, 16 depart-ments performed less than 10 revisions, which was 13.78% of all revisions and the other 13 departments 86.21% The biggest volume of revi-sions was done in the Bratislava I. Orthopaedic and Traumatology Clinic and the participation of this clinic was nearly a quarter of all revisions (23.19%).
Chart 14. Departments according the origin of THA revision
Chart 14 shows the departments according to the origin of the revision patients. For total knee joint replacement the situation is different. The TKA revisions were performed in fewer departments. Only five departments performed more than 10 revisions in the year. Tab. 14 and Chart 15 show departments ordered according to these parame-ters. The top five departments performed 78.35% of all knee revision.
Tab. 14. Departments according the origin of THA revision
Department Own revision
Foreign revision Total
Bratislava – I.Orth.-traum. 22 6 28
Ružomberok – Traum.-orth. 15 0 15
Martin – Orth.-traum. 8 4 12
Prešov – Orth. 9 2 11
Bratislava – II.Orth.-traum. 6 4 10
B. Bystrica – Orth. 4 0 4
Poprad – Orth. 3 1 4
Skalica – Orth.-traum. 3 0 3
Košice – Šaca - Orth. 1 1 2
Nitra – Traum.-orth. 2 0 2
Bojnice – Orth. 1 0 1
Košice – Orth.-traum. 1 0 1
Košice ŽZ – Orth. 1 0 1
Topoľčany – Orth. 1 0 1
Trenčín – Orth. 1 0 1
Žilina – Orth. 1 0 1
Total 79 18 97
0
20
40
60
80
100
Bra
tisla
va –
I.O
rth.-t
raum
.
Mar
tin –
Orth
.-tra
um.
B. B
ystri
ca –
Orth
.
Bra
tisla
va –
II.O
rth.-t
raum
.
Pre
šov
– O
rth.
Ruž
ombe
rok
– Tr
aum
.-orth
.
Pop
rad
– O
rth.
Koš
ice
– Š
aca
- Orth
.
Ska
lica
– O
rth.-t
raum
.
Žilin
a –
Orth
.
Koš
ice
ŽZ –
Orth
.
Boj
nice
– O
rth.
Koš
ice
– O
rth.-t
raum
.
Foreign revisionOwn revision
© Slovakian Arthroplasty Register 2011
© Slovakian Arthroplasty Register 2011
© Slovakian Arthroplasty Register 2011

16 / Acta Chir. orthop. Traum. čech., 78, 2011 Supplementum
Review of the annual report of the Slovakian Arthroplasty Registry – 2010
Chart 15. Departments according the origin of THA revision
The difference between the first and second de-partments is not as big as in the THA statistics, which could be explained by the shorter exist-ence of the knee register. We have introduced another parameter for the register follow-up, based on the hypothesis, that the period of the year in which the arthroplasty procedure was performed could influence the survival of the implants. In 2010, we started recording primary and revision surgeries according to the month in which the surgery was performed. From this first observation it became clear, that the volume of the operations is not even throughout the year. Chart 16 shows the number of primary and revi-sion THAs in each month during the year.
Chart 16. Volume of the performed THA during the year
On the curve there are two dips in primary THAs, one in December and January and the other one in August. The biggest volume of revisions was performed in May. Chart 17. Volume of the performed TKA during the year
Chart 17 shows the distribution of primary and revision TKAs for each month of the year. The shape of the curve is similar to the THA curve. This parameter will be statistically evaluated in later SAR reports. .
0
5
10
15
20
25
30B
ratis
lava
– I.
Orth
.-tra
um.
Ruž
ombe
rok
– Tr
aum
.-orth
.
Mar
tin –
Orth
.-tra
um.
Pre
šov
– O
rth.
Bra
tisla
va –
II.O
rth.-t
raum
.
B. B
ystri
ca –
Orth
.
Pop
rad
– O
rth.
Ska
lica
– O
rth.-t
raum
.
Koš
ice
– Š
aca
- Orth
.
Nitr
a –
Trau
m.-o
rth.
Boj
nice
– O
rth.
Koš
ice
– O
rth.-t
raum
.
Koš
ice
ŽZ –
Orth
.
Topo
ľčan
y –
Orth
.
Tren
čín
– O
rth.
Žilin
a –
Orth
.
Foreign revisionOwn revision
0
100
200
300
400
500
600
I. II. III. IV. V. VI. VII. VIII. IX. X. XI. XII.
PrimaryRevision
0
50
100
150
200
250
I. II. III. IV. V. VI. VII. VIII. IX. X. XI. XII.
PrimaryRevision
© Slovakian Arthroplasty Register 2011
© Slovakian Arthroplasty Register 2011
© Slovakian Arthroplasty Register 2011

17 / Acta Chir. orthop. Traum. čech., 78, 2011 Supplementum
Review of the annual report of the Slovakian Arthroplasty Register – 2010
Implant brands Chart 18. No. of components on Slovakian market according to manufacturer and year
The evolution of the implant market in Slovakia can be divided into two periods. The first period began in the 1970s, when arthroplasty started at the main departments and ended in the 1990s. From the historical records available, during this period of time, the main suppliers were the Czech companies Poldi and, later, Walter–Motorlet with their own implants. Foreign brands of implants were seen only rarely. The boom of the ortho-paedic companies started in the second period – after the 1990s. In 1993, Johnson & Johnson arrived on the Slovakian market and its DePuy division became one of the main orthopaedic suppliers. From 1996 until 2008, six other main orthopaedic companies were introduced onto the market. The last two were Stryker in 2006 and the Italian company Lima Ltd in 2008. We started with the registry’s implant inventory in 2003. In that year, we recorded 65 different brands of stems and acetabular components. During eight years, the number of different types of stem in-creased from 35 to 79 and number of acetabular components increased from 30 to 47. Tab. 15. No. of components in SAR inventory
Year
Ace
tabu
lar
cem
ente
d
Ace
tabu
lar
unce
men
ted
Fem
oral
ce
men
ted
Fem
oral
un
cem
ente
d
Total
2003 12 18 17 18 65
2010 14 33 33 46 126
The knee implant inventory is more complex. Until now, we have divides implants according to the name of the knee implant system. However, all knee implant systems have CR, PS, CCK and
hinge model options, with the possibility of mobile or fixed tibial components. All such variations are found under the same name of the knee implant system. This problem is partially solved by the implementation of the Implant Tracking System (ITS) and we believe that, by the end of 2011, the structure of the knee inventory will reflect com-pletely manage above complexity. In 2003, there were probably 17 knee systems on the Slovakian market, but the knee inventory started only in 2006. By the end of 2010, we had records of 42 different systems in the SAR knee inventory. Registry databases The main issue for every database is the data quality. Therefore, an important goal for every register is the validation of the databases. In Slo-vakia, we have three implant databases. The first one is the database maintained by the Chief or-thopaedic surgeon to the Ministry of Health. This is a questionnaire-based database. Only ortho-paedic departments reporting their data to the Chief surgeon contribute to this database. The other two databases are implant-based. Compa-nies sales data comprise the second one and reimbursement data from the health’s insurance companies make up the third database. In the SAR report 2003–2008, we published a compari-son of the SAR database with the main health’s insurance companies’ data. The results were that the SAR database had 2.9% more records com-pared with the biggest public health insurance company – VšZP.
Beznoska
WM - Medin DePuy
Link
Aesculap Biomet Zimmer
Serf / C2F implants Endoplant
Lima
Stryker 0
5
10
15
20
25
30
do1992
1993 1994 1995 1996 1997 1998 1999 2000 2001 2002 2003 2004 2005 2006 2007 2008 2009 2010
© Slovakian Arthroplasty Register 2011
© Slovakian Arthroplasty Register 2011

18 / Acta Chir. orthop. Traum. čech., 78, 2011 Supplementum
Review of the annual report of the Slovakian Arthroplasty Register – 2010
Tab. 16. Comparison THA database of Chief surgeon of Min. of Health and SAR
Primary THA Revision THA
Year MH SAR Linkage rate MH SAR Linkage
rate 2003 2 266 2 119 93,51% 392 293 74,74%
2004 2 736 3 086 112,79% 339 333 98,23%
2005 2 868 2 976 103,77% 334 270 80,84%
2006 3 306 3 595 108,74% 325 335 103,08%
2007 3 769 4 260 113,03% 336 346 102,98%
2008 3 855 4 411 114,42% 357 339 94,96%
2009 4 420 4 767 107,85% 322 386 119,88%
2010 4 434 4 970 112,09% 393 457 116,28%
Comparisons of the registry database with those of the Chief orthopaedic surgeon of the Ministry of Health and the databases of suppliers and distributors are in Tab. 16, 17 & 18. In order to validate the SAR database, we have considered these databases to be 100%. The first compari-son was the Chief orthopaedic surgeon’s data and those of the SAR. The linkage rate for the primary THA was higher than 100% in all years, except 2003. In 2009, the SAR database con-tained 7.85% more data and 12.09% more in 2010 for primary THA. The database of revision THA had lower linkage rate in 2003–2005. The reason for this could be the fact that, during the first years, not all departments were allowed to perform the revision procedures and declared them for the reimbursement reasons as the pri-mary arthroplasty. In 2009, the SAR database recorded 64 revisions more, which is plus 19.88% and in 2010 the difference was also 64 revision cases, which is plus 16.28%. Similar validation was performed for the TKA database. We have obtained 3.19% more data for primary TKA and 4.30% more for revision TKA. Tab. 17. Comparison TKA database of chief surgeon of Min.
of Health and SAR
Year Primary TKA Revision TKA
MH SAR Linkage rate MH SAR Linkage
rate 2006 905 892 98,56% 40 20 50,00%
2007 1 358 1 364 100,44% 46 41 89,13%
2008 1 586 1 611 101,58% 60 51 85,00%
2009 1 938 2 028 104,64% 69 84 121,74%
2010 2 130 2 198 103,19% 93 97 104,30%
These results were unexpected and, therefore, we have decided to perform the validation with the companies’ and distributors’ databases.
Eight out of twelve main orthopaedic manufactur-ers and distributors took a part in this project. This databases validation was implant-based. We have compared all implant data registered during 2010. We assume that the sales data from the companies are exact and that this compari-son could give us two types of answers: how is the coverage of SAR in departments and how precise is the information on market share of the implants. The results are in Tab. 18. Tab. 18. Comparison of SAR and distributors’ databases
Implant brands SAR Distributor Linkage rate
Serf 1 225 1 278 95,85%
Beznoska 2 619 3 118 84,00%
DePuy 3 308 3 347 98,83%
Lima 1 276 1 348 94,66%
W-Link 67 79 84,81%
Biomet 479 590 81,19%
Stryker 349 391 89,26%
Zimmer 944 997 94,68%
Total 10 267 11 148 92,10%
The correspondence of individual databases with the SAR database was between 81.19% and 98.83%, although the match was 100% for some departments. These results were encouraging. In general, the correspondence was 92.10% and we have cross-checked 11,000 components. Follow-ing these validations, we conclude that SAR da-tabases are reliable, because the match in all comparisons was higher than the expected 90%.
Implant Tracking System – ITS Until 2009, we collected only a limited amount of information about the implants themselves. The name of the implant alone yields a minimal set of information to identify precisely the implant, and the only possible solution was to introduce a sys-tem for scanning the implant bar codes. We started with a pilot project in August 2009 in two university departments and we fine-tuned this system for five months. During autumn 2009, we distributed bar-code scanners to all contributing departments and from the January 1st 2010 star- ted bar-code scanning of all the implants used. Tab. 19 shows all departments and the percent-age of implants entered to the SAR database with both bar-code scanning and manually.
© Slovakian Arthroplasty Register 2011
© Slovakian Arthroplasty Register 2011
© Slovakian Arthroplasty Register 2011

19 / Acta Chir. orthop. Traum. čech., 78, 2011 Supplementum
Review of the annual report of the Slovakian Arthroplasty Register – 2010
Tab. 19. Bar-code scanning and ITS usage by department
Department No. of surgeries Manually % ITS %
B. Bystrica – Orth. 480 129 26,88% 351 73,13%
B. Bystrica – Traum. 114 114 100,00% 0 0,00%
Bojnice – Orth. 168 3 1,79% 165 98,21%
Bratislava DFNsP - Orth. 4 1 25,00% 3 75,00%
Bratislava S & E - Orth. 104 11 10,58% 93 89,42%
Bratislava – I.Orth.-traum. 708 38 5,37% 670 94,63%
Bratislava – II.Orth.-traum. 542 287 52,95% 255 47,05%
Bratislava – Traum. 130 52 40,00% 78 60,00%
D. Kubín – Orth.-traum. 116 116 100,00% 0 0,00%
D. Streda – Traum. 122 105 86,07% 17 13,93%
Galanta – Traum.-orth. 70 5 7,14% 65 92,86%
Humenné - Orth. 46 33 71,74% 13 28,26%
Košice – Orth.-traum. 354 145 40,96% 209 59,04%
Košice – Traum. 61 9 14,75% 52 85,25%
Košice ŽZ - Orth. 148 7 4,73% 141 95,27%
Košice – Šaca - Orth. 217 81 37,33% 136 62,67%
L. Mikuláš – Traum.-orth. 39 2 5,13% 37 94,87%
Lučenec – Orth.-traum. 60 60 100,00% 0 0,00%
Martin – Orth.-traum. 502 17 3,39% 485 96,61%
Michalovce – Orth. 119 0 0,00% 119 100,00%
Michalovce – Traum. 35 11 31,43% 24 68,57%
N. Zámky – Orth. 258 57 22,09% 201 77,91%
N. Zámky – Traum. 96 26 27,08% 70 72,92%
Nitra – Traum.-orth. 303 303 100,00% 0 0,00%
P. Bystrica – Orth. 39 39 100,00% 0 0,00%
Partizánske – Traum. 3 2 66,67% 1 33,33%
Piešťany – Orth. 122 6 4,92% 116 95,08%
Poprad – Orth. 258 16 6,20% 242 93,80%
Prešov – Orth. 540 13 2,41% 527 97,59%
Ružomberok – Traum.-orth. 750 208 27,73% 542 72,27%
Skalica – Orth.-traum. 159 2 1,26% 157 98,74%
Topoľčany – Orth. 253 0 0,00% 253 100,00%
Topoľčany – Traum. 33 8 24,24% 25 75,76%
Trenčín – Orth 124 21 16,94% 103 83,06%
Trenčín – Traum. 73 13 17,81% 60 82,19%
Trnava – Traum.-orth. 187 5 2,67% 182 97,33%
Trstená – Traum. 7 1 14,29% 6 85,71%
Vranov n. Topľou - Traum. 12 12 100,00% 0 0,00%
Žilina - Traum. 63 34 53,97% 29 46,03%
Žilina – Orth. 303 15 4,95% 288 95,05%
Total 7 722 2 007 25,99% 5 715 74,01%
In 2010, 74.00% of all implants were recorded with this system and 26.00% manually. This manual option is still available on our web site. The usage of ITS is more effective for the knee implants database. This system is able to distin-guish the different models (CR, PS, CCK) of im-
plants with the same name. Our goal is to reach 90% coverage with the ITS as soon as possible, and we expect to have achieved that by the end of the year 2011. The other problem was the variety of the bar-codes and symbology used in medical field.
© Slovakian Arthroplasty Register 2011
20 / Acta Chir. orthop. Traum. čech., 78, 2011 Supplementum
Review of the annual report of the Slovakian Arthroplasty Register – 2010
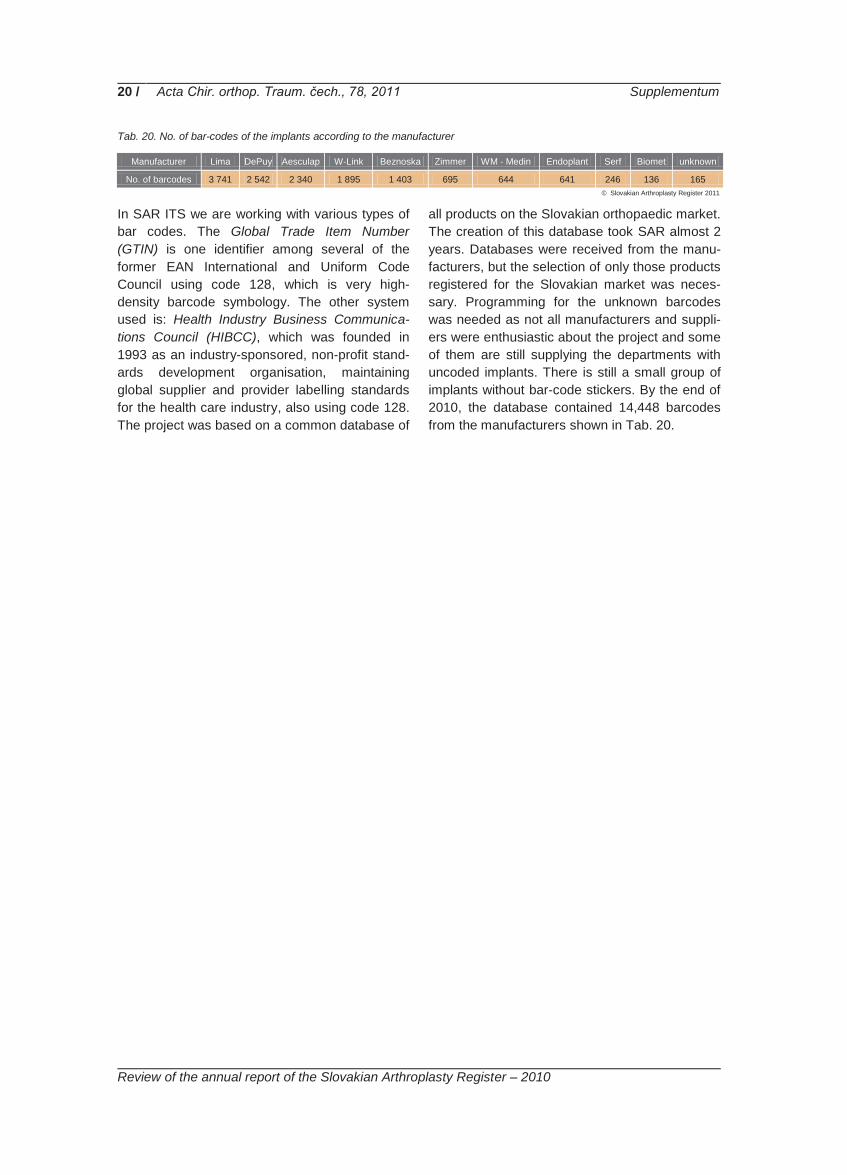
Tab. 20. No. of bar-codes of the implants according to the manufacturer
Manufacturer Lima DePuy Aesculap W-Link Beznoska Zimmer WM - Medin Endoplant Serf Biomet unknown
No. of barcodes 3 741 2 542 2 340 1 895 1 403 695 644 641 246 136 165
In SAR ITS we are working with various types of bar codes. The Global Trade Item Number (GTIN) is one identifier among several of the former EAN International and Uniform Code Council using code 128, which is very high-density barcode symbology. The other system used is: Health Industry Business Communica-tions Council (HIBCC), which was founded in 1993 as an industry-sponsored, non-profit stand-ards development organisation, maintaining global supplier and provider labelling standards for the health care industry, also using code 128. The project was based on a common database of
all products on the Slovakian orthopaedic market. The creation of this database took SAR almost 2 years. Databases were received from the manu-facturers, but the selection of only those products registered for the Slovakian market was neces-sary. Programming for the unknown barcodes was needed as not all manufacturers and suppli-ers were enthusiastic about the project and some of them are still supplying the departments with uncoded implants. There is still a small group of implants without bar-code stickers. By the end of 2010, the database contained 14,448 barcodes from the manufacturers shown in Tab. 20.
© Slovakian Arthroplasty Register 2011

21 / Acta Chir. orthop. Traum. čech., 78, 2011 Supplementum
Review of the annual report of the Slovakian Arthroplasty Register – 2010
Primary THA In 2010, we received THA data from 40 depart-ments. These 40 departments performed 4,970 primary and 457 revision implantations. Tab. 21. No. of primary and revision THAs
Year Primary Revision
2003 2 119 293
2004 3 086 333
2005 2 976 270
2006 3 595 335
2007 4 260 346
2008 4 411 339
2009 4 767 386
2010 4 970 457
In comparison with 2003, there was a 134.45% increase in primary THA. In 2010, primary THA accounted for 87.85% and revision arthroplasty 12.15% of all hip arthroplasties. Tab. 21 and Chart 19 show the year-by-year evolution of these figures. Chart 19. No. of primary and revision THAs
In 2010, the RR reached 9.20%, which repre-sents an increase of 1.10% compared to the pre-vious year. Chart 20 shows the evolution of RR and the relationship of the value of RR to primary THA is clear from the shape of the curve. RR is the only parameter reflecting all revisions. Be-cause these included primary implantations done before the founding the register in 2003, our sta-tistical methodology does not allow the use of incomplete data for survival evaluation. For all other global and demographic parameters these data were used.
Chart 20. Primary THA – revision rate
Chart 21. Primary THA – incidence
By the time of the founding the registry, the inci-dence of primary THA was 39.39 per 100,000 inhabitants. In 2010, that value reached 91.42 per 100 000 inhabitants. The growth in this inci-dence over the period 2003–2010 was 232.00%. The gender distribution in 2010 was 3:2 (60% female to 40% male) as compared to the 2003, when it was 62.48% female to 37.51% male. There has been only a slight movement towards the female gender. Tab. 22. Primary THA – gender distribution
Year Female Male
2003 1 324 795
2004 1 885 1 201
2005 1 808 1 168
2006 2 215 1 380
2007 2 632 1 628
2008 2 730 1 681
2009 2 892 1 875
2010 2 982 1 988
0
1 000
2 000
3 000
4 000
5 000
2003 2004 2005 2006 2007 2008 2009 2010
RevisionPrimary
13,83
10,79 9,07
9,32
8,12
7,69
8,10
9,20
0,00
2,00
4,00
6,00
8,00
10,00
12,00
14,00
16,00
2003 2004 2005 2006 2007 2008 2009 2010
39,39
57,31
55,22
66,65 78,87
81,5
87,87
91,42
0102030405060708090
100
2003 2004 2005 2006 2007 2008 2009 2010
© Slovakian Arthroplasty Register 2011
© Slovakian Arthroplasty Register 2011
© Slovakian Arthroplasty Register 2011
© Slovakian Arthroplasty Register 2011
© Slovakian Arthroplasty Register 2011
22 / Acta Chir. orthop. Traum. čech., 78, 2011 Supplementum
Review of the annual report of the Slovakian Arthroplasty Register – 2010
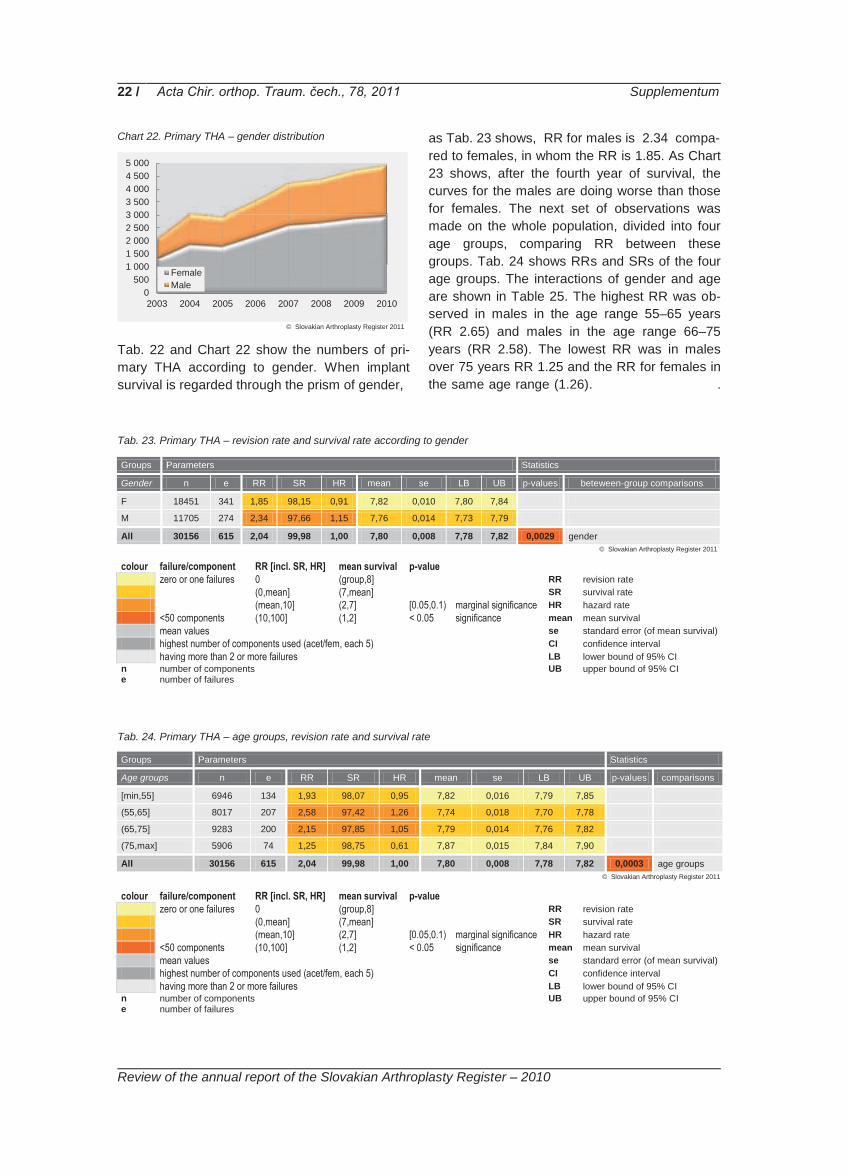
Chart 22. Primary THA – gender distribution
Tab. 22 and Chart 22 show the numbers of pri-mary THA according to gender. When implant survival is regarded through the prism of gender,
as Tab. 23 shows, RR for males is 2.34 compa- red to females, in whom the RR is 1.85. As Chart 23 shows, after the fourth year of survival, the curves for the males are doing worse than those for females. The next set of observations was made on the whole population, divided into four age groups, comparing RR between these groups. Tab. 24 shows RRs and SRs of the four age groups. The interactions of gender and age are shown in Table 25. The highest RR was ob-served in males in the age range 55–65 years (RR 2.65) and males in the age range 66–75 years (RR 2.58). The lowest RR was in males over 75 years RR 1.25 and the RR for females in the same age range (1.26). .
Tab. 23. Primary THA – revision rate and survival rate according to gender
Groups Parameters Statistics
Gender n e RR SR HR mean se LB UB p-values beteween-group comparisons
F 18451 341 1,85 98,15 0,91 7,82 0,010 7,80 7,84
M 11705 274 2,34 97,66 1,15 7,76 0,014 7,73 7,79
All 30156 615 2,04 99,98 1,00 7,80 0,008 7,78 7,82 0,0029 gender
colour failure/component RR [incl. SR, HR] mean survival p-value zero or one failures 0 (group,8] RR revision rate (0,mean] (7,mean] SR survival rate (mean,10] (2,7] [0.05,0.1) marginal significance HR hazard rate <50 components (10,100] (1,2] < 0.05 significance mean mean survival mean values se standard error (of mean survival) highest number of components used (acet/fem, each 5) CI confidence interval having more than 2 or more failures LB lower bound of 95% CI n number of components UB upper bound of 95% CI e number of failures Tab. 24. Primary THA – age groups, revision rate and survival rate
Groups Parameters Statistics
Age groups n e RR SR HR mean se LB UB p-values comparisons
[min,55] 6946 134 1,93 98,07 0,95 7,82 0,016 7,79 7,85
(55,65] 8017 207 2,58 97,42 1,26 7,74 0,018 7,70 7,78
(65,75] 9283 200 2,15 97,85 1,05 7,79 0,014 7,76 7,82
(75,max] 5906 74 1,25 98,75 0,61 7,87 0,015 7,84 7,90
All 30156 615 2,04 99,98 1,00 7,80 0,008 7,78 7,82 0,0003 age groups
colour failure/component RR [incl. SR, HR] mean survival p-value zero or one failures 0 (group,8] RR revision rate (0,mean] (7,mean] SR survival rate (mean,10] (2,7] [0.05,0.1) marginal significance HR hazard rate <50 components (10,100] (1,2] < 0.05 significance mean mean survival mean values se standard error (of mean survival) highest number of components used (acet/fem, each 5) CI confidence interval having more than 2 or more failures LB lower bound of 95% CI n number of components UB upper bound of 95% CI e number of failures
0500
1 0001 5002 0002 5003 0003 5004 0004 5005 000
2003 2004 2005 2006 2007 2008 2009 2010
FemaleMale
© Slovakian Arthroplasty Register 2011
© Slovakian Arthroplasty Register 2011
© Slovakian Arthroplasty Register 2011

23 / Acta Chir. orthop. Traum. čech., 78, 2011 Supplementum
Review of the annual report of the Slovakian Arthroplasty Register – 2010
Chart 23. Primary THA – probability of survival according to gender
Chart 24. Primary THA – probability of survival according to the age groups
Tab. 25. Primary THA – interaction of gender, age groups, revision rates and survival rates
Groups Subgroups Parameters Statistics
Gender Age groups n e RR SR HR mean se LB UB p-values comparisons
F [min,55] 3833 64 1,67 98,33 0,90 7,83 0,019 7,79 7,85
F (55,65] 4323 109 2,52 97,48 1,36 7,75 0,023 7,70 7,78
F (65,75] 5912 113 1,91 98,09 1,03 7,82 0,017 7,76 7,82
F (75,max] 4381 55 1,26 98,74 0,68 7,88 0,016 7,84 7,90
F 18451 341 1,85 98,15 0,91 7,82 0,010 7,80 7,84 0,0035 F: age groups
M [min,55] 3113 70 2,25 97,75 0,96 7,78 0,025 7,73 7,83 0,0560 [min,55]: gender
M (55,65] 3694 98 2,65 97,35 1,13 7,73 0,027 7,68 7,78 0,5540 (55,65]: gender
M (65,75] 3371 87 2,58 97,42 1,10 7,75 0,026 7,70 7,80 0,0232 (65,75]: gender
M (75,max] 1525 19 1,25 98,75 0,53 7,82 0,039 7,74 7,90 0,9170 (75,max]: gender
M 11705 274 2,34 97,66 1,15 7,76 0,014 7,73 7,79 0,1340 M: age groups
All 30156 615 2,04 99,98 1,00 7,80 0,008 7,78 7,82 0,0003 gender and age groups
colour failure/component RR [incl. SR, HR] mean survival p-value zero or one failures 0 (group,8] RR revision rate (0,mean] (7,mean] SR survival rate (mean,10] (2,7] [0.05,0.1) marginal significance HR hazard rate <50 components (10,100] (1,2] < 0.05 significance mean mean survival mean values se standard error (of mean survival) highest number of components used (acet/fem, each 5) CI confidence interval having more than 2 or more failures LB lower bound of 95% CI n number of components UB upper bound of 95% CI e number of failures
Chart 25. Primary THA – probability of survival of females in the various age groups
Chart 26. Primary THA – probability of survival of males in the various age groups
From the interaction of gender and age, it is evi-dent, that the best-surviving implants are in men
over 75. The second best surviving group of im-plants are those in females over 75. The two
© Slovakian Arthroplasty Register 2011 © Slovakian Arthroplasty Register 2011
© Slovakian Arthroplasty Register 2011
© Slovakian Arthroplasty Register 2011 © Slovakian Arthroplasty Register 2011

24 / Acta Chir. orthop. Traum. čech., 78, 2011 Supplementum
Review of the annual report of the Slovakian Arthroplasty Register – 2010
worst-surviving groups of implants are in males in the age group 55–65 and 66–75. These results could be explained by the higher physical activity of these groups of the population. Mean survival time of all implants in female was 7.82 years with
RR 1.85. By the male we have mean survival time of all implants 7.76 years and RR 2.34. By not respecting the gender the mean survival time of all implants was 7.80 years and RR reached value 2.04. .
Age groups Tab. 26. Primary THA – age groups
Year -15 15-19
20-24
25-29
30-34
35-39
40-44
45-49
50-54
55-59
60-64
65-69
70-74
75-79
80-84 85+ Not
Identif.
2003 0 0 0 4 6 13 33 50 121 232 219 278 349 356 239 219 0
2004 0 1 2 6 15 24 56 98 208 364 390 403 468 484 294 273 0
2005 0 2 1 9 18 29 45 95 192 300 353 410 492 451 313 266 0
2006 0 2 3 7 16 50 72 156 271 413 450 553 569 491 303 236 3
2007 0 1 8 11 28 57 113 164 343 508 555 656 645 602 323 246 0
2008 0 7 7 17 30 68 100 222 397 547 620 713 650 547 291 195 0
2009 0 1 8 22 41 59 105 226 475 633 673 746 688 575 317 197 1
2010 1 4 11 19 41 71 146 227 486 706 704 779 708 570 333 163 1
The whole population was divided into five-year age groups, according to the methodology of the Slovakian Statistical Office as in Tab. 26. This analysis demonstrates a trend to THA in younger age groups over recent years. In the age groups less than 25 years, only 6 implantations were recorded during the years 2003–2005. In the years 2006–2008, there were 28 implantations in this young population and in 2009 and 2010 the total was 24. Similar increases were observed in
all age groups younger than the group 75–79. By contrast, in the age group over 85, a decrease was observed. In 2003, 9,219 arthroplasties were performed in this group and in 2010 this fell to 163. One of the explanations could be that, of late, these operations were performed in the younger age groups. This theory is supported by the increase in THA procedures in the lower age groups.
Diagnoses Tab. 27. Primary THA - diagnoses
Year Primary Coxarthrosis
Dysplastic Coxarthrosis
Posttraumatic Coxarthrosis
Avascular Necrosis M.Perthes Rheumatoid
Arthritis Fracture of
Femoral Neck Other Causes
2003 1 134 209 274 134 1 25 0 310
2004 1 600 359 498 201 3 40 1 365
2005 1 487 298 557 207 6 32 36 328
2006 1 968 432 169 241 1 31 680 55
2007 2 396 490 183 221 5 38 872 35
2008 2 360 557 224 259 11 56 879 43
2009 2 734 552 176 223 6 39 969 56
2010 2 870 566 178 241 4 40 978 92
In 2010, primary coxarthrosis was still the main indication for THA. In 2003, 54.33% of all indica-tions for THA were for primary coxarthrosis. Dys-plastic coxarthrosis was the reason in 10.01% and avascular necrosis of femoral head (AVN) in 6.42%. The increase in primary coxarthrosis as the indication, in 2010, was minimal (from 54.33% in 2003 to 57.75%) and dysplastic coxar-throsis increased only from 10.01% to 11.39% of
all cases. For a diagnosis of AVN, there was a decrease of 4.85%. Very interesting is the emer-gence of the diagnoses posttraumatic coxarthro-sis and femoral neck fracture. Femoral neck frac-ture as an optional indication was introduced to the protocol only in 2005, so it is only possible to compare the years 2006 and 2010. During 2005, a decrease of the posttraumatic coxarthrosis and an increase in femoral neck fracture diagnoses
© Slovakian Arthroplasty Register 2011
© Slovakian Arthroplasty Register 2011

25 / Acta Chir. orthop. Traum. čech., 78, 2011 Supplementum
Review of the annual report of the Slovakian Arthroplasty Register – 2010
were observed. In 2006, THAs for femoral neck fracture constituted 19.01% and in 2010 19.66% of all patients. In conclusion, apart from femoral neck fracture, there was only minor movement in the percentage of different indications for primary THA over these years Operative approaches The three most commonly used operative ap-proaches are the anterolateral, lateral and poste-rior approaches. The anterior, minimally-invasive approach (MIS) and osteotomy of the great tro-chanter were used in only 12 cases, as seen in Tab. 28. The anterolateral approach was used in 52.59% of all cases in 2010. Tab. 28. Primary THA – surgical approaches
Year Ante-rior
Antero-lat. Lateral Poster. T-
tomy MIS Not Identif.
2003 2 815 936 334 0 0 32
2004 13 1 297 1 173 579 0 4 20
2005 20 1 380 894 634 0 24 24
2006 8 1 560 1 314 680 4 9 20
2007 10 1 855 1 544 816 4 11 20
2008 5 2 116 1 434 829 3 2 22
2009 6 2 151 1 745 850 2 1 12
2010 5 2 614 1 434 909 5 2 1
Types of implants used In the THA database, data are collected about all types of implants, both total joint replacements and hemiarthroplasties. From Tab. 29, it is clear that the predominant type of implant was total hip arthroplasty, which was, even in 2003, used in 84.23% of all cases. In 2010, total joint replace-ment increased to 86.78%. Bipolar hemiarthro-plasty was used in only 0.76% of all cases. In the whole history of the SAR, the bipolar hemiar-thropasty was used in only 0.46% of all cases. Tab. 29. Primary THA – types of implant
Year THA Bipolar
Hemiarth. Hemiarth.
2003 1 785 4 330
2004 2 580 10 496
2005 2 425 14 537
2006 3 063 13 516
2007 3 644 20 596
2008 3 785 18 608
2009 4 089 22 656
2010 4 313 38 619
Chart 27. Primary THA – types of implant
Types of the fixation Three types of fixation are distinguished: non-cemented, cemented and hybrid fixations. In 2003, the distribution was as follows: 63.99 % cemented, 23.07% non-cemented and 12.93 % hybrid fixation. Tab. 30. Primary THA – types of fixation
Year Cement Non-cement Hybrid
2003 1 356 489 274
2004 1 812 904 369
2005 1 619 826 531
2006 1 837 1 167 589
2007 1 937 1 643 680
2008 1 747 1 997 667
2009 1 862 2 361 544
2010 1 762 2 647 561
During the period of observation, 2003–2010, significant changes occurred in the type of fixa-tion. In 2010, the percentage distribution of the different types of fixation was 35.45% cemented, 53.25% non-cemented and 11.28% hybrid fixa-tions. Chart 28. Primary THA – types of fixation
0500
1 0001 5002 0002 5003 0003 5004 0004 5005 000
2003 2004 2005 2006 2007 2008 2009 2010
THABipolar Hemiarth.Hemiarth.
0500
1 0001 5002 0002 5003 0003 5004 0004 5005 000
2003 2004 2005 2006 2007 2008 2009 2010
HybridNon-cementCement
© Slovakian Arthroplasty Register 2011
© Slovakian Arthroplasty Register 2011
© Slovakian Arthroplasty Register 2011
© Slovakian Arthroplasty Register 2011
© Slovakian Arthroplasty Register 2011

26 / Acta Chir. orthop. Traum. čech., 78, 2011 Supplementum
Review of the annual report of the Slovakian Arthroplasty Register – 2010
Tab. 31. Primary THA – type of fixation, revision rates and survival rates
Groups Parameters Statistics
Fixation n e RR SR HR mean se LB UB p-values beteween-group comparisons
Uncemented 11521 179 1,55 98,45 0,76 7,82 0,013 7,79 7,85
Cemented 9471 226 2,39 97,61 1,17 7,80 0,013 7,77 7,83
Hybrids 4339 134 3,09 96,91 1,51 7,70 0,025 7,65 7,75
Reverse hybrids 340 18 5,29 94,71 2,59 7,53 0,098 7,34 7,72
Hemiarthr. uncemented 91 2 2,20 97,80 1,08 7,06 0,356 6,36 7,76
Hemiarthr. cemented 4394 56 1,27 98,73 0,62 7,85 0,018 7,81 7,89
All 30156 615 2,04 99,98 1,00 7,80 0,008 7,78 7,82 <0.00001 fixation
colour failure/component RR [incl. SR, HR] mean survival p-value zero or one failures 0 (group,8] RR revision rate (0,mean] (7,mean] SR survival rate (mean,10] (2,7] [0.05,0.1) marginal significance HR hazard rate <50 components (10,100] (1,2] < 0.05 significance mean mean survival mean values se standard error (of mean survival) highest number of components used (acet/fem, each 5) CI confidence interval having more than 2 or more failures LB lower bound of 95% CI n number of components UB upper bound of 95% CI e number of failures During the observed period, 2003–2010, the best surviving types of fixation and implants are ce-mented and uncemented hemiarthroplasties. The RR of cemented was 1.27 and RR of uncement-ed hemiarthroplasties was 2.20. The interpreta-tion of uncemented hemiarthroplasty data must consider the low number of observed compo-nents – 91 uncemented against 4,394 cemented hemiarthroplasties. Very good SR results for hemiarthroplasties should be regarded through the prism of the short observation period and low physical activity of the patients in these age groups. The highest RR was observed in the group of reverse hybrids (Tab. 31 and Chart 29).
Chart 29. Primary THA – probability of survival according to the type of fixation
Tab. 32. Primary THA – interaction of gender, type of fixation, revision rate and survival rate
Groups Subgroups Parameters Statistics
Gender Fixation n e RR SR HR mean se LB UB p-values comparisons
F Uncemented 6154 91 1,48 98,52 0,80 7,80 0,018 7,76 7,84
F Cemented 6248 128 2,05 97,95 1,11 7,83 0,015 7,80 7,86
F Hybrids 2472 74 2,99 97,01 1,62 7,71 0,033 7,65 7,77
F Reverse hybrids 218 8 3,67 96,33 1,98 7,61 0,105 7,40 7,82
F Hemiarthr. uncut. 60 0 0,00 100,00 0,00 7,51 NA NA NA
F Hemiarthr. cem. 3299 40 1,21 98,79 0,65 7,87 0,019 7,83 7,91
F 18451 341 1,85 98,15 0,91 7,82 0,010 7,80 7,84 0,0008 F: fixation
M Uncemented 5367 88 1,64 98,36 0,70 7,82 0,020 7,78 7,86 0,4990 uncemented: gender
M Cemented 3223 98 3,04 96,96 1,30 7,74 0,026 7,69 7,79 0,0036 cemented: gender
M Hybrids 1867 60 3,21 96,79 1,37 7,69 0,038 7,62 7,76 0,8240 hybrids: gender
M Reverse hybrids 122 10 8,20 91,80 3,50 7,34 0,186 6,98 7,70 0,1100 reverse hybrids: gender
M Hemiarthr. uncem. 31 2 6,45 93,55 2,76 5,94 0,961 4,06 7,82 0,0428 hemiarthr. uncem: gender
M Hemiarthr. cem. 1095 16 1,46 98,54 0,62 7,80 0,048 7,71 7,89 0,3960 hemiarthr. cem: gender
M 11705 274 2,34 97,66 1,15 7,76 0,014 7,73 7,79 <0.00001 M: fixation: gender
All 30156 615 2,04 99,98 1,00 7,80 0,008 7,78 7,82 <0.00001 gender and fixation
© Slovakian Arthroplasty Register 2011
© Slovakian Arthroplasty Register 2011
© Slovakian Arthroplasty Register 2011

27 / Acta Chir. orthop. Traum. čech., 78, 2011 Supplementum
Review of the annual report of the Slovakian Arthroplasty Register – 2010
colour failure/component RR [incl. SR, HR] mean survival p-value zero or one failures 0 (group,8] RR revision rate (0,mean] (7,mean] SR survival rate (mean,10] (2,7] [0.05,0.1) marginal significance HR hazard rate <50 components (10,100] (1,2] < 0.05 significance mean mean survival mean values se standard error (of mean survival) highest number of components used (acet/fem, each 5) CI confidence interval having more than 2 or more failures LB lower bound of 95% CI n number of components UB upper bound of 95% CI e number of failures In the interaction of the type of fixation and gen-der, the survival of hemiartroplasties is still better. In females uncemented hemiarthroplasty was used in 60 cases and in the observed period no failure was recorded. In males, this type of im-plant and fixation was used in 31 cases with two failures and the RR reached 6.45. Only uncemented fixation had a RR below 2.00. In females, is the corresponding data were 1.48 and, in males, 1.64. Chart 30. Primary THA – probability of survival in females
according to the type of fixation
The worst RR results were in males with reverse hybrids (8.20). The curves of the probability of survival in females are similar for all types of fixation until fourth year from implantation (Chart 30). The mean survival time for all types of fixa-tion in females was 7.82. In contrast to the male group, the curves are more divergent from very beginning of survival and the differences in the mean survival time for different types of fixation are greater (Chart 31). Chart 31. Primary THA – probability of survival in males
according to the type of fixation
Tab. 33. Primary THA – interaction of the age groups, types of fixation, revision rates and survival rates
Groups Subgroups Parameters Statistics
Age groups Fixation n e RR SR HR mean se LB UB p-values comparisons
[min,55] Uncemented 5799 80 1,38 98,62 0,72 7,86 0,015 7,83 7,89
[min,55] Cemented 361 13 3,60 96,40 1,87 7,73 0,064 7,60 7,86
[min,55] Hybrids 585 31 5,30 94,70 2,75 7,58 0,070 7,44 7,72
[min,55] Reverse hybrids 149 8 5,37 94,63 2,78 7,53 0,148 7,24 7,82
[min,55] Hemiarthr. uncem 8 0 0,00 100,00 0,00 5,65 NA NA NA
[min,55] Hemiarthr. cem 44 2 4,55 95,45 2,36 6,97 0,288 6,41 7,53
[min,55] 6946 134 1,93 98,07 0,95 7,82 0,016 7,79 7,85 <0.00001 [min,55]: fixation
(55,65] Uncemented 4057 68 1,68 98,32 0,65 7,70 0,030 7,64 7,76
(55,65] Cemented 1821 71 3,90 96,10 1,51 7,72 0,032 7,66 7,78
(55,65] Hybrids 1897 57 3,00 97,00 1,16 7,73 0,034 7,66 7,80
(55,65] Reverse hybrids 82 6 7,32 92,68 2,84 7,21 0,236 6,75 7,67
(55,65] Hemiarthr. uncem 9 0 0,00 100,00 0,00 7,50 NA NA NA
(55,65] Hemiarthr. cem 151 5 3,31 96,69 1,28 7,44 0,157 7,13 7,75
(55,65] 8017 207 2,58 97,42 1,26 7,74 0,018 7,70 7,78 0,0538 (55,65]: fixation
© Slovakian Arthroplasty Register 2011 © Slovakian Arthroplasty Register 2011
© Slovakian Arthroplasty Register 2011

28 / Acta Chir. orthop. Traum. čech., 78, 2011 Supplementum
Review of the annual report of the Slovakian Arthroplasty Register – 2010
Tab. 33. (cont.)
Groups Subgroups Parameters Statistics
Age groups Fixation n e RR SR HR mean se LB UB p-values comparisons
(65,75] Uncemented 1433 27 1,88 98,12 0,87 7,63 0,085 7,46 7,80
(65,75] Cemented 5261 117 2,22 97,78 1,03 7,81 0,017 7,78 7,84
(65,75] Hybrids 1603 36 2,25 97,75 1,05 7,76 0,040 7,68 7,84
(65,75] Reverse hybrids 80 4 5,00 95,00 2,33 7,27 0,210 6,86 7,68
(65,75] Hemiarthr. uncem 14 0 0,00 100,00 0,00 7,29 NA NA NA
(65,75] Hemiarthr. cem 892 16 1,79 98,21 0,83 7,80 0,046 7,71 7,89
(65,75] 9283 200 2,15 97,85 1,05 7,79 0,014 7,76 7,82 0,2320 (65,75]: fixation
(75,max] Uncemented 231 4 1,73 98,27 1,38 7,74 0,085 7,57 7,91 0,0005 uncemented: age groups
(75,max] Cemented 2028 25 1,23 98,77 0,98 7,87 0,026 7,82 7,92 0,0022 cemented: age groups
(75,max] Hybrids 254 10 3,94 96,06 3,15 7,61 0,106 7,40 7,82 0,0374 hybrids: age groups
(75,max] Reverse hybrids 29 0 0,00 100,00 0,00 7,91 NA NA NA 0,4520 reverse hybrids: age groups
(75,max] Hemiarthr. uncem 60 2 3,33 96,67 2,66 6,61 0,719 5,20 8,02 0,6540 hemiarthr. uncem: age groups
(75,max] Hemiarthr. cem 3304 33 1,00 99,00 0,80 7,89 NA NA NA 0,0130 hemiarthr. cem: age groups
(75,max] 5906 74 1,25 98,75 0,61 7,87 0,015 7,84 7,90 0,0007 (75,max]: fixation
All 30156 615 2,04 99,98 1,00 7,80 0,008 7,78 7,82 <0.00001 age and fixation
colour failure/component RR [incl. SR, HR] mean survival p-value zero or one failures 0 (group,8] RR revision rate (0,mean] (7,mean] SR survival rate (mean,10] (2,7] [0.05,0.1) marginal significance HR hazard rate <50 components (10,100] (1,2] < 0.05 significance mean mean survival mean values se standard error (of mean survival) highest number of components used (acet/fem, each 5) CI confidence interval having more than 2 or more failures LB lower bound of 95% CI n number of components UB upper bound of 95% CI e number of failures
Chart 32. Primary THA – type of fixation and probability of survival in the age group less than 55
Chart 33. Primary THA – type of fixation and probability of survival in the age group 55-65
Chart 34. Primary THA – type of fixation and probability of survival in the age group 66-75
Chart 35. Primary THA – type of fixation and probability of survival in the age group more than 75
© Slovakian Arthroplasty Register 2011
© Slovakian Arthroplasty Register 2011 © Slovakian Arthroplasty Register 2011
© Slovakian Arthroplasty Register 2011 © Slovakian Arthroplasty Register 2011

29 / Acta Chir. orthop. Traum. čech., 78, 2011 Supplementum
Review of the annual report of the Slovakian Arthroplasty Register – 2010
Interaction analyses of age, gender and type of fixation is shown in Tab. 34. In ten groups in this table was no failure, but there were not enough events for statistical observation (n<50). The age group 75 and more has the best survival for all types of fixation, except uncemented hemiarthro-plasty, which is the worst one, but with a very low number of events (n=15). The best-surviving group is cemented hemiarthroplasty over 75 and
the likely explanation is low physical activity in these patients and consequently low demands on the implants. Except for these groups the best results in RR were achieved in females with uncemented type of implants, have achieved an RR of 1.16 with 3,187 implantations. This group is ranked 13th in the table. The same age and fixation group in males is 18th, with an RR of 1.65 for 2,612 implantations.
Tab. 34. Primary THA – interaction of age groups, gender, type of fixation, revision rates and survival rates
Groups Sub-groups Subsubgroups Parameters Statistics
Age Gender Fixation n e RR SR HR mean se LB UB p-values comparisons
[min,55] F Uncemented 3187 37 1,16 98,84 0,69 7,86 0,018 7,82 7,90 [min,55] F Cemented 197 5 2,54 97,46 1,52 7,78 0,070 7,64 7,92 [min,55] F Hybrids 328 17 5,18 94,82 3,10 7,60 0,090 7,42 7,78 [min,55] F Reverse hybrids 92 4 4,35 95,65 2,60 7,20 0,156 6,89 7,51 [min,55] F Hemiarthr. uncem 4 0 0,00 100,00 0,00 5,65 NA NA NA [min,55] F Hemiarthr. cem 25 1 4,00 96,00 2,40 6,56 0,336 5,90 7,22
[min,55] F 3833 64 1,67 98,33 0,87 7,83 0,019 7,79 7,85 0,0003 [min,55], F: type
[min,55] M Uncemented 2612 43 1,65 98,35 0,73 7,83 0,025 7,78 7,88 [min,55] M Cemented 164 8 4,88 95,12 2,17 7,64 0,112 7,42 7,86 [min,55] M Hybrids 257 14 5,45 94,55 2,42 7,52 0,108 7,31 7,73 [min,55] M Reverse hybrids 57 4 7,02 92,98 3,12 7,53 0,203 7,13 7,93 [min,55] M Hemiarthr. uncem 4 0 0,00 100,00 0,00 1,88 NA NA NA [min,55] M Hemiarthr. cem 19 1 5,26 94,74 2,34 6,97 0,405 6,18 7,76
[min,55] M 3113 70 2,25 97,75 1,17 7,78 0,025 7,79 7,85 0,0080 [min,55], M: type
[min,55] 6946 134 1,93 98,07 0,95 7,82 0,016 7,79 7,85 0,0560 [min,55]: gender
(55,65] F Uncemented 2048 31 1,51 98,49 0,60 7,69 0,047 7,60 7,78 (55,65] F Cemented 1117 43 3,85 96,15 1,53 7,72 0,042 7,64 7,80 (55,65] F Hybrids 1030 30 2,91 97,09 1,15 7,73 0,047 7,64 7,82 (55,65] F Reverse hybrids 47 3 6,38 93,62 2,53 7,22 0,280 6,67 7,77 (55,65] F Hemiarthr. uncem 4 0 0,00 100,00 0,00 7,50 NA NA NA (55,65] F Hemiarthr. cem 77 2 2,60 97,40 1,03 7,25 0,163 6,93 7,57
(55,65] F 4323 109 2,52 97,48 0,98 7,75 0,023 7,70 7,78 0,3370 (55,65], F: type
(55,65] M Uncemented 2009 37 1,84 98,16 0,69 7,70 0,034 7,63 7,77 (55,65] M Cemented 704 28 3,98 96,02 1,50 7,71 0,052 7,61 7,81 (55,65] M Hybrids 867 27 3,11 96,89 1,17 7,72 0,050 7,62 7,82 (55,65] M Reverse hybrids 35 3 8,57 91,43 3,23 7,11 0,376 6,37 7,85 (55,65] M Hemiarthr. uncem 5 0 0,00 100,00 0,00 1,49 NA NA NA (55,65] M Hemiarthr. cem 74 3 4,05 95,95 1,53 7,28 0,289 6,71 7,85
(55,65] M 3694 98 2,65 97,35 1,03 7,73 0,027 7,70 7,78 0,3140 (55,65], M: type
(55,65] 8017 207 2,58 97,42 1,26 7,74 0,018 7,70 7,78 0,5540 (55,65]: gender
(65,75] F Uncemented 782 19 2,43 97,57 1,27 7,30 0,155 7,00 7,60 (65,75] F Cemented 3489 63 1,81 98,19 0,95 7,85 0,019 7,81 7,89 (65,75] F Hybrids 952 19 2,00 98,00 1,05 7,76 0,056 7,65 7,87 (65,75] F Reverse hybrids 56 1 1,79 98,21 0,94 7,52 0,174 7,18 7,86 (65,75] F Hemiarthr. uncem 7 0 0,00 100,00 0,00 7,29 NA NA NA (65,75] F Hemiarthr. cem 626 11 1,76 98,24 0,92 7,81 0,053 7,71 7,91
(65,75] F 5912 113 1,91 98,09 0,74 7,82 0,017 7,76 7,82 0,0470 (65,75], F: type
(65,75] M Uncemented 651 8 1,23 98,77 0,48 7,76 0,086 7,59 7,93 (65,75] M Cemented 1772 54 3,05 96,95 1,18 7,74 0,034 7,67 7,81 (65,75] M Hybrids 651 17 2,61 97,39 1,01 7,72 0,060 7,60 7,84 (65,75] M Reverse hybrids 24 3 12,50 87,50 4,84 6,77 0,490 5,81 7,73 (65,75] M Hemiarthr. uncem 7 0 0,00 100,00 0,00 3,82 NA NA NA (65,75] M Hemiarthr. cem 266 5 1,88 98,12 0,73 7,77 0,095 7,58 7,96
(65,75] M 3371 87 2,58 97,42 1,20 7,75 0,026 7,76 7,82 0,0816 (65,75], M: type
(65,75] 9283 200 2,15 97,85 1,05 7,79 0,014 7,76 7,82 0,0232 (65,75]: gender
© Slovakian Arthroplasty Register 2011
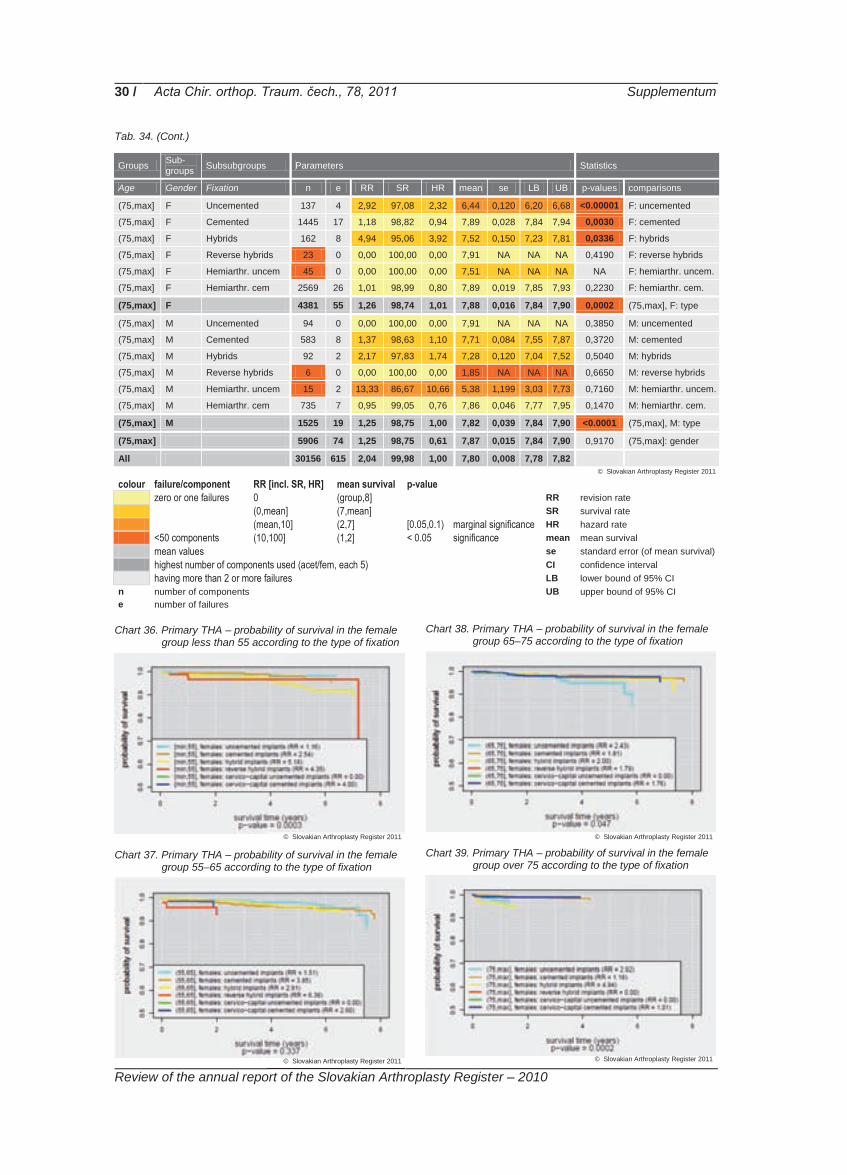
30 / Acta Chir. orthop. Traum. čech., 78, 2011 Supplementum
Review of the annual report of the Slovakian Arthroplasty Register – 2010
Tab. 34. (Cont.)
Groups Sub-groups Subsubgroups Parameters Statistics
Age Gender Fixation n e RR SR HR mean se LB UB p-values comparisons
(75,max] F Uncemented 137 4 2,92 97,08 2,32 6,44 0,120 6,20 6,68 <0.00001 F: uncemented
(75,max] F Cemented 1445 17 1,18 98,82 0,94 7,89 0,028 7,84 7,94 0,0030 F: cemented
(75,max] F Hybrids 162 8 4,94 95,06 3,92 7,52 0,150 7,23 7,81 0,0336 F: hybrids
(75,max] F Reverse hybrids 23 0 0,00 100,00 0,00 7,91 NA NA NA 0,4190 F: reverse hybrids
(75,max] F Hemiarthr. uncem 45 0 0,00 100,00 0,00 7,51 NA NA NA NA F: hemiarthr. uncem.
(75,max] F Hemiarthr. cem 2569 26 1,01 98,99 0,80 7,89 0,019 7,85 7,93 0,2230 F: hemiarthr. cem.
(75,max] F 4381 55 1,26 98,74 1,01 7,88 0,016 7,84 7,90 0,0002 (75,max], F: type
(75,max] M Uncemented 94 0 0,00 100,00 0,00 7,91 NA NA NA 0,3850 M: uncemented
(75,max] M Cemented 583 8 1,37 98,63 1,10 7,71 0,084 7,55 7,87 0,3720 M: cemented
(75,max] M Hybrids 92 2 2,17 97,83 1,74 7,28 0,120 7,04 7,52 0,5040 M: hybrids
(75,max] M Reverse hybrids 6 0 0,00 100,00 0,00 1,85 NA NA NA 0,6650 M: reverse hybrids
(75,max] M Hemiarthr. uncem 15 2 13,33 86,67 10,66 5,38 1,199 3,03 7,73 0,7160 M: hemiarthr. uncem.
(75,max] M Hemiarthr. cem 735 7 0,95 99,05 0,76 7,86 0,046 7,77 7,95 0,1470 M: hemiarthr. cem.
(75,max] M 1525 19 1,25 98,75 1,00 7,82 0,039 7,84 7,90 <0.0001 (75,max], M: type
(75,max] 5906 74 1,25 98,75 0,61 7,87 0,015 7,84 7,90 0,9170 (75,max]: gender
All 30156 615 2,04 99,98 1,00 7,80 0,008 7,78 7,82 colour failure/component RR [incl. SR, HR] mean survival p-value zero or one failures 0 (group,8] RR revision rate (0,mean] (7,mean] SR survival rate (mean,10] (2,7] [0.05,0.1) marginal significance HR hazard rate <50 components (10,100] (1,2] < 0.05 significance mean mean survival mean values se standard error (of mean survival) highest number of components used (acet/fem, each 5) CI confidence interval having more than 2 or more failures LB lower bound of 95% CI n number of components UB upper bound of 95% CI e number of failures
Chart 36. Primary THA – probability of survival in the female group less than 55 according to the type of fixation
Chart 37. Primary THA – probability of survival in the female
group 55–65 according to the type of fixation
Chart 38. Primary THA – probability of survival in the female group 65–75 according to the type of fixation
Chart 39. Primary THA – probability of survival in the female
group over 75 according to the type of fixation
© Slovakian Arthroplasty Register 2011
© Slovakian Arthroplasty Register 2011 © Slovakian Arthroplasty Register 2011
© Slovakian Arthroplasty Register 2011 © Slovakian Arthroplasty Register 2011

31 / Acta Chir. orthop. Traum. čech., 78, 2011 Supplementum
Review of the annual report of the Slovakian Arthroplasty Register – 2010
Chart 40. Primary THA – probability of survival in the male group less than 55 according to the type of fixation
Chart 41. Primary THA – probability of survival in the male
group 55–65 according to the type of fixation
Chart 42. Primary THA – probability of survival in the male group 65–75 according to the type of fixation
Chart 43. Primary THA – probability of survival in the male
group over 75 according to the type of fixation
Brand of bone cement used In the period 2003–2010, only five brands of bone cement reached more than a 5% share on the total. Palacos R reached 32.82%, SmartSet HV 26.94%, CMW 17.65% SmartSet GHV 6.93% and Palacos R Gentamycin 6.79% of all bone cement brands. Tab. 35 shows the numbers of cement packages used after years 2003–2010. In 2010, Palacos R was still the most-used bone
cement at 29.07%, followed by SmartSet HV (27.09%), Palacos R Gentamycin (19.58%), SmartSet GHV (9.20%) and then CMW with 6.23% of all bone cement types. There was in-crease in use of bone cement incorporating gen-tamycin. In the whole period 2003–2010, it ac-counted for 24.58%, but in 2010 the bone ce-ments with gentamycin reached 28.70%.
Tab. 35. Primary THA – brands of bone cement
Year
Bio
met
Plu
s
CM
W
CM
W-G
Cop
al
Ost
eobo
nd
Pal
acos
LV
gen
ta
Pal
acos
R
Pal
acos
R g
enta
Pal
amed
Pal
amed
- G
Ref
obac
in P
lus
Ref
obac
in R
evis
ion
Sim
plex
Sim
plex
AB
C
Sm
artS
et G
HV
Sm
artS
et H
V
Syn
icem
1
Syn
icem
G
2003 0 1 617 162 0 80 0 504 45 214 10 0 0 0 0 0 7 0 0
2004 0 1 552 108 0 35 2 860 79 329 41 0 0 0 0 30 452 0 0
2005 2 337 53 0 19 0 1 105 123 97 145 0 0 0 0 200 1 131 0 0
2006 2 222 2 0 14 2 1 599 91 116 67 0 0 0 0 288 1 303 0 0
2007 0 364 5 0 30 9 1 586 135 146 39 0 0 0 0 238 1 422 0 0
2008 0 272 9 0 19 16 1 310 241 129 13 5 0 0 0 411 1 140 0 0
2009 34 303 18 13 8 11 1 110 485 0 0 111 2 0 30 433 1 062 0 0
2010 73 216 16 17 0 0 1 008 679 0 0 42 1 2 118 319 937 39 1
© Slovakian Arthroplasty Register 2011 © Slovakian Arthroplasty Register 2011
© Slovakian Arthroplasty Register 2011 © Slovakian Arthroplasty Register 2011
© Slovakian Arthroplasty Register 2011
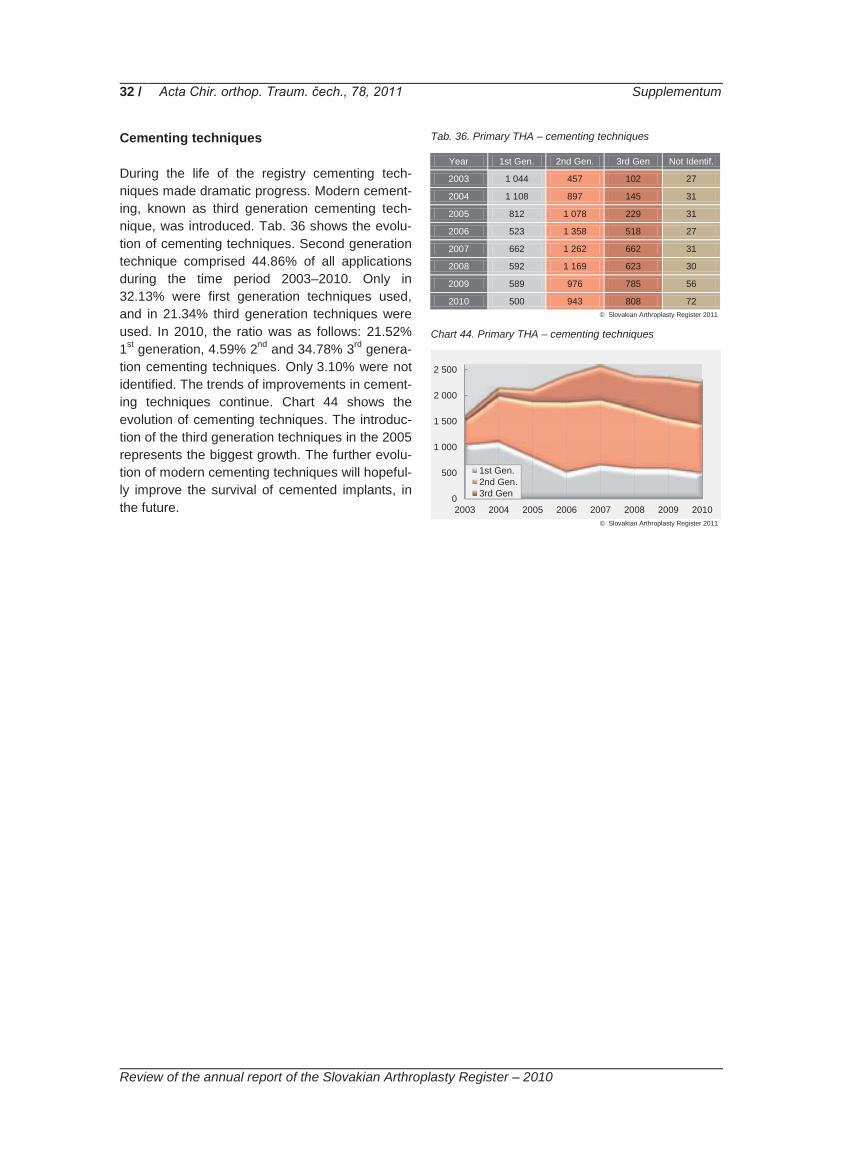
32 / Acta Chir. orthop. Traum. čech., 78, 2011 Supplementum
Review of the annual report of the Slovakian Arthroplasty Register – 2010
Cementing techniques During the life of the registry cementing tech-niques made dramatic progress. Modern cement-ing, known as third generation cementing tech-nique, was introduced. Tab. 36 shows the evolu-tion of cementing techniques. Second generation technique comprised 44.86% of all applications during the time period 2003–2010. Only in 32.13% were first generation techniques used, and in 21.34% third generation techniques were used. In 2010, the ratio was as follows: 21.52% 1st generation, 4.59% 2nd and 34.78% 3rd genera-tion cementing techniques. Only 3.10% were not identified. The trends of improvements in cement-ing techniques continue. Chart 44 shows the evolution of cementing techniques. The introduc-tion of the third generation techniques in the 2005 represents the biggest growth. The further evolu-tion of modern cementing techniques will hopeful-ly improve the survival of cemented implants, in the future.
Tab. 36. Primary THA – cementing techniques
Year 1st Gen. 2nd Gen. 3rd Gen Not Identif.
2003 1 044 457 102 27
2004 1 108 897 145 31
2005 812 1 078 229 31
2006 523 1 358 518 27
2007 662 1 262 662 31
2008 592 1 169 623 30
2009 589 976 785 56
2010 500 943 808 72
Chart 44. Primary THA – cementing techniques
0
500
1 000
1 500
2 000
2 500
2003 2004 2005 2006 2007 2008 2009 2010
1st Gen.2nd Gen.3rd Gen
© Slovakian Arthroplasty Register 2011
© Slovakian Arthroplasty Register 2011

33 / Acta Chir. orthop. Traum. čech., 78, 2011 Supplementum
Review of the annual report of the Slovakian Arthroplasty Register – 2010
Components and their combinations In comparison to 2003, the number of compo-nents implanted in 2010 increased by 94.00%. As expected, the biggest growth was in uncemented femoral stems (UFS) – 156.00%. Cemented fem-oral stems (CFSs) increased, compared to 2003, by 94.00%. Uncemented acetabular cups (UACs) increased by 83%. The main quantitative param-eter for the evaluation of implant components is the number of insertions per annum. The follow-ing tables reflect the situation in 2010. Each component type is divided into four groups. In the first group are those with more implantations than 10.00% of all components implanted. In the se-cond group are components accounting for be-tween 9.99% and 5.00%, then the group between Tab. 37. Uncemented acetabular cups
Name n %
PINNACLE 721 23,51%
NOVAE EVOLUTION 504 16,43%
DELTA - PF 321 10,47%
DURALOC 314 10,24%
PLASMACUP 272 8,87%
SF 259 8,44%
CLS SPOTORNO 158 5,15%
DELTA 78 2,54%
BEZNOSKA (uncem) 61 1,99%
M-H-shell 55 1,79%
TRILOGY 49 1,60%
ZWEYMULLER-ALLOCLASSIC CSF 47 1,53%
ANA.NOVA 44 1,43%
DELTA - FINS 44 1,43%
TRIDENT HEMISPHERICAL SOLID 35 1,14%
TRIDENT HEMISPHERICAL CLUSTER 24 0,78%
T.O.P. 20 0,65%
DELTA - TT 18 0,59%
DELTA - ST - C 10 0,33%
COPTOS 9 0,29%
L-CUP 6 0,20%
WM oval 5 0,16%
RINGLOC - HIGH WALL 3 0,10%
OCTOPUS 3 0,10%
ACETABULAR PLATES 2 0,07%
DURALOC OPTION 1 0,03%
ASR 1 0,03%
NNC - Titan 1 0,03%
RSC - revision 1 0,03%
WM sferical 1 0,03% Uncemented 3 067 100,00%
4.99% and 1.00% and finally those component types accounting for less than 1.00% of all pro-cedures. Tab. 37 shows UACs and their share in 2010. The top four UACs, being group one, re-present 60.65% of all of this type of component. Over the period of observation 2003–2010, the number of UACs fulfilling the criteria for inclusion in group one increased, by 2010, from three to four types, that is growth from 52.96% to 60.65% of all UACs. In group four – components repre-senting less than 1.00% of all implantations of UACs – there were 25 implantations, their share being 4.97%. Types of cemented acetabular cups (CACs) used in more than 10.00% (group one), in 2010, account for 67.9% of all CAC sand the growth compared to the whole period 2003–2010 was only 1.50%. For UFSs there was only one component brand that was implanted in more than 10.00% of cases – Corail – and its use was 25.52% of all UFSs. Throughout the whole ob-served time period, that group one UFS repre-sented 49.59% of all UFSs implanted. The ratio brands of the stems from groups one, two and three to the group four is 17:20. The ratio of the numbers of components in the top three groups, compared with the fourth group is 2,446:152 (94.15% to 5.85%).The group four UFSs were excluded from the long-term follow-up, because, in the whole observed period, these 31 brands represent only 5.85%.
Tab. 38. Cemented acetabular cups
Name n %
O2 359 29,60%
BEZNOSKA (cem) 281 23,17%
PE-CUP 181 14,92%
ELITE PLUS 98 8,08%
MUELLER 78 6,43%
CHARNLEY 73 6,02%
EXETER Contemporary Cup 47 3,87%
ZCA 35 2,89%
MULLER 20 1,65%
EXETER Duration Cup 20 1,65%
ULTIMA MK2 10 0,82%
TRILOC 9 0,74%
BURCH-SCHNEIDER CAGE 1 0,08%
MULLER LOW PROFILE 1 0,08%
Cemented 1 213 100,00%
© Slovakian Arthroplasty Register 2011 © Slovakian Arthroplasty Register 2011

34 / Acta Chir. orthop. Traum. čech., 78, 2011 Supplementum
Review of the annual report of the Slovakian Arthroplasty Register – 2010
Tab. 39. Uncemented femoral stems
Name n %
CORAIL 663 25,52%
SAGITA EVOLUTION HA 254 9,78%
FIT 239 9,20%
BICONTACT 228 8,78%
LIBRA HA 195 7,51%
SF 194 7,47%
CLS SPOTORNO 128 4,93%
LOGICA (uncem) 115 4,43%
PROXIMA 101 3,89%
BIMETRIC (uncem) 87 3,35%
ZWEYMULLER-ALLOCLASICS SL 45 1,73%
ABGII V40 44 1,69%
ANA.NOVA MII 35 1,35%
S-ROM 34 1,31%
AML 31 1,19%
VERSYS FMT 27 1,04%
SL (uncem) 26 1,00%
AUSTIN-MOORE hemiarthropl. (uncem) 21 0,81%
TRI-LOCK BPS 18 0,69%
METHA 17 0,65%
SAM - FIT 15 0,58%
COLLO - MIS 13 0,50%
C.F.P. 12 0,46%
BETA CONE 10 0,38%
ANA.NOVA MII double stem couted 8 0,31%
MODULUS 8 0,31%
TRIO (uncem) 5 0,19%
SOLUTION 4 0,15%
REVISION 4 0,15%
TRIO modular (uncem) 4 0,15%
RMD revision 3 0,12%
H - MAX M 3 0,12%
H - MAX S 3 0,12%
SF - revision 1 0,04%
ZMR 1 0,04%
ANTEGA 1 0,04%
SL-TWIN 1 0,04%
Uncemented 2 598 100,00%
In CFSs, the group one implants represent more than half of all CFSs. In 2010 these components represents 53.99%, which was a decrease from 57.18% over the whole time period. Ten implants from group four, in 2010, representing 3.37%. In the whole period there were only 22 group four implants (4.83%). From the point of view of the long term follow-up, it is important to minimise the share of the group four components.
Tab. 40. Cemented femoral stems
Name n %
BEZNOSKA 563 24,05%
BEZNOSKA hemiarthropl. 465 19,86%
CSC 236 10,08%
CHARNLEY 158 6,75%
C-STEM 154 6,58%
CENTRAMENT 109 4,66%
LOGICA (cem) 90 3,84%
TRILLIANCE 86 3,67%
EXETER V40 80 3,42%
SAGITA EVOLUTION 70 2,99%
CPT 68 2,90%
CSC CCEP 51 2,18%
BIMETRIC (cem) 50 2,14%
SL (cem) 42 1,79%
AUSTIN-MOORE hemiarthropl. (cem) 40 1,71%
FJORD 15 0,64%
AAP 12 0,51%
CHARNLEY MODULAR 11 0,47%
BEZNOSKA - custom-made, tumor. 10 0,43%
CL TRAUMA – hemiarthropl. 9 0,38%
AUTOBLOQAUATE 9 0,38%
LIBRA 6 0,26%
CORAIL (cem) 3 0,13%
ELITE PLUS 2 0,09%
TRIO (cem) 2 0,09%
Cemented 2 341 100,00%
The unique feature of total hip arthroplasty is the possibility of the combination of different compo-nents from different manufacturers. For the eval-uation component group mode is used, also con-sidering the type of fixation. Another possibility would be the evaluation of individual acetabular and femoral components. Because of the combi-nation potential of THA implants, there exists a unique opportunity to compare the probability of survival of one component in combination with a range of other compatible components. The component combinations recommended by the manufacturers predominate. The highest variabil-ity observed is in the hybrid group, but with very few observations. Variability of the component combinations in this group is so high, that even after eight years of the SAR, not all combinations have reached the minimal number of records needed for the statistical methodology (n=50). These combinations are displayed in all the fol-lowing tables.
© Slovakian Arthroplasty Register 2011
© Slovakian Arthroplasty Register 2011

35 / Acta Chir. orthop. Traum. čech., 78, 2011 Supplementum
Review of the annual report of the Slovakian Arthroplasty Register – 2010
Survival of the primary implants During 2010, 14 CACs, 30 UACs and 25 CFSs and 37 UFSs from the register inventory were used, as Tab. 41 shows. Tab. 41. Number of used component types from the SAR
inventory
Year
Ace
t. co
mp.
ce
men
ted
Ace
t. co
mp.
un
cem
ente
d
Fem
. com
p.
cem
ente
d
Fem
. com
p.
unce
men
ted
Total
2003 12 18 17 18 65
2003-2010 14 33 33 46 126
2010 14 30 25 37 106
% 100 90,9 75,75 80,43 84,12
In 2010, 84.12% of all component brands regis-tered in the inventory of SAR were used. There was a decrease in the ranges of brands of all types of components used, except CACs. The biggest decrease was observed in the range of FCSs. In the FCS group, only 25 brands were implanted in 2010, representing 75% of the whole range of brands of FCSs registered in the inven-tory from 2003–2010. In the next part of the re-port, analysis will be undertaken of the probability of survival of all types of components, with re-spect to gender, type of fixation and the age groups. Chart 45. Probability of survival of acetabular and femoral
components
Statistical analyses confirmed significant diffe-rences between the survival of acetabular and femoral components, where p-value=0.0221. Chart 45 shows that the survival after four years of acetabular components is significantly better than the survival of femoral components.
Chart 46. Probability of survival of acetabular and femoral components and the type of fixation
When type of fixation of components is consi-dered, there is also a statistically significant dif-ference between cemented and uncemented acetabular component, where p-value=0.005 and survival of UACs is better, as shown chart 46. Very similar results were noted for the compari-son of cemented and uncemented femoral com-ponents, with a p-value<0.0001 and, again, the uncemented components survive better. The difference between the survival of the types of femoral components is greater than between the survival of the types of acetabular components. Acetabular components CACs are the oldest components used, but only three brands of them reached more than 1,000 applications during the observed period 2003–2010. These three most used brands are: Bez-noska cup, the Charnley from DePuy and the PE-cup from Aesculap. CACs have a mean RR of 1.63%, as Tab. 42 shows. UACs account for twice as many implantations as CACs. The fol-lowing brands of uncemented cup – Duraloc and Pinnacle (DePuy), Novae Evolution (Serf), Trilogy (Zimmer) and the Beznoska cup reached more than a thousand implantations during the 2003–2010 period. The RR of UACs is lower than the cemented cups, with a value of 0.97%. The whole database of acetabular components had an RR of 1.32%.
© Slovakian Arthroplasty Register 2011
© Slovakian Arthroplasty Register 2011
© Slovakian Arthroplasty Register 2011
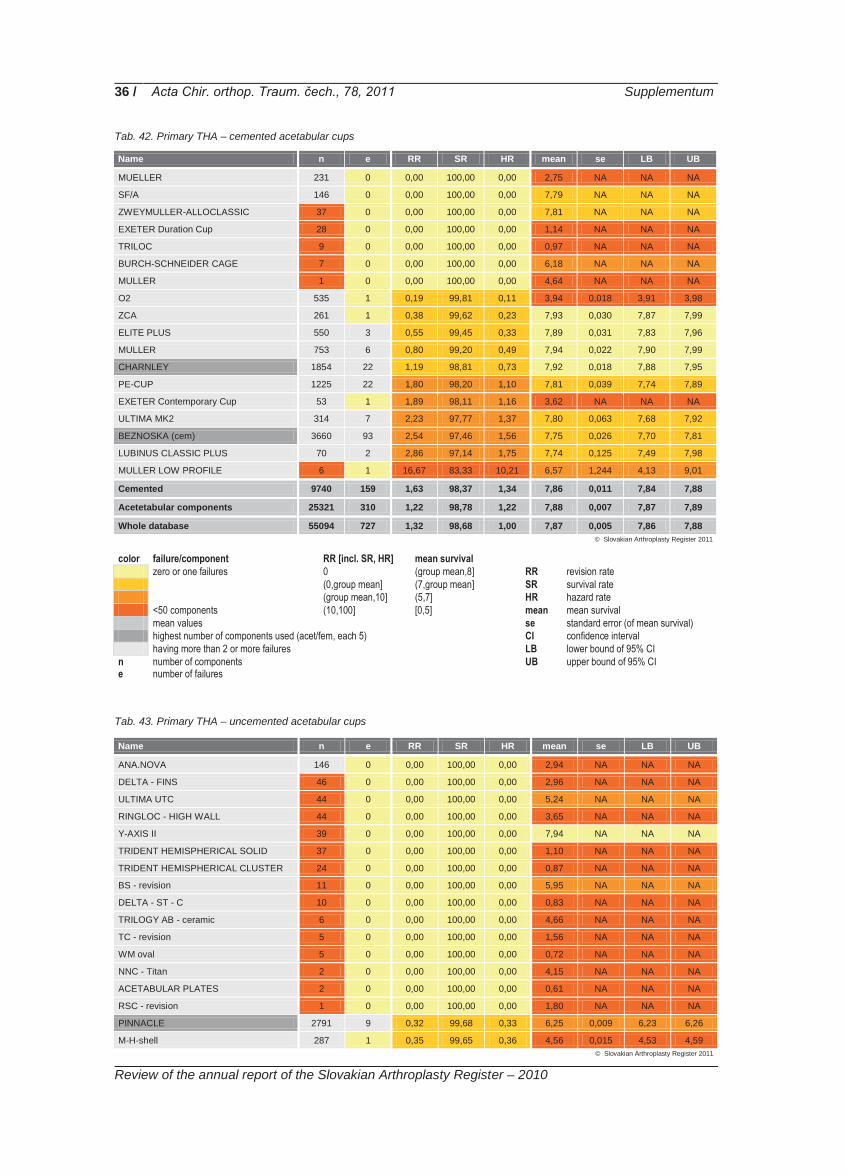
36 / Acta Chir. orthop. Traum. čech., 78, 2011 Supplementum
Review of the annual report of the Slovakian Arthroplasty Register – 2010
Tab. 42. Primary THA – cemented acetabular cups Name n e RR SR HR mean se LB UB
MUELLER 231 0 0,00 100,00 0,00 2,75 NA NA NA
SF/A 146 0 0,00 100,00 0,00 7,79 NA NA NA
ZWEYMULLER-ALLOCLASSIC 37 0 0,00 100,00 0,00 7,81 NA NA NA
EXETER Duration Cup 28 0 0,00 100,00 0,00 1,14 NA NA NA
TRILOC 9 0 0,00 100,00 0,00 0,97 NA NA NA
BURCH-SCHNEIDER CAGE 7 0 0,00 100,00 0,00 6,18 NA NA NA
MULLER 1 0 0,00 100,00 0,00 4,64 NA NA NA
O2 535 1 0,19 99,81 0,11 3,94 0,018 3,91 3,98
ZCA 261 1 0,38 99,62 0,23 7,93 0,030 7,87 7,99
ELITE PLUS 550 3 0,55 99,45 0,33 7,89 0,031 7,83 7,96
MULLER 753 6 0,80 99,20 0,49 7,94 0,022 7,90 7,99
CHARNLEY 1854 22 1,19 98,81 0,73 7,92 0,018 7,88 7,95
PE-CUP 1225 22 1,80 98,20 1,10 7,81 0,039 7,74 7,89
EXETER Contemporary Cup 53 1 1,89 98,11 1,16 3,62 NA NA NA
ULTIMA MK2 314 7 2,23 97,77 1,37 7,80 0,063 7,68 7,92
BEZNOSKA (cem) 3660 93 2,54 97,46 1,56 7,75 0,026 7,70 7,81
LUBINUS CLASSIC PLUS 70 2 2,86 97,14 1,75 7,74 0,125 7,49 7,98
MULLER LOW PROFILE 6 1 16,67 83,33 10,21 6,57 1,244 4,13 9,01
Cemented 9740 159 1,63 98,37 1,34 7,86 0,011 7,84 7,88
Acetetabular components 25321 310 1,22 98,78 1,22 7,88 0,007 7,87 7,89
Whole database 55094 727 1,32 98,68 1,00 7,87 0,005 7,86 7,88
color failure/component RR [incl. SR, HR] mean survival zero or one failures 0 (group mean,8] RR revision rate (0,group mean] (7,group mean] SR survival rate (group mean,10] (5,7] HR hazard rate <50 components (10,100] [0,5] mean mean survival
mean values se standard error (of mean survival) highest number of components used (acet/fem, each 5) CI confidence interval
having more than 2 or more failures LB lower bound of 95% CI n number of components UB upper bound of 95% CI e number of failures
Tab. 43. Primary THA – uncemented acetabular cups
Name n e RR SR HR mean se LB UB
ANA.NOVA 146 0 0,00 100,00 0,00 2,94 NA NA NA
DELTA - FINS 46 0 0,00 100,00 0,00 2,96 NA NA NA
ULTIMA UTC 44 0 0,00 100,00 0,00 5,24 NA NA NA
RINGLOC - HIGH WALL 44 0 0,00 100,00 0,00 3,65 NA NA NA
Y-AXIS II 39 0 0,00 100,00 0,00 7,94 NA NA NA
TRIDENT HEMISPHERICAL SOLID 37 0 0,00 100,00 0,00 1,10 NA NA NA
TRIDENT HEMISPHERICAL CLUSTER 24 0 0,00 100,00 0,00 0,87 NA NA NA
BS - revision 11 0 0,00 100,00 0,00 5,95 NA NA NA
DELTA - ST - C 10 0 0,00 100,00 0,00 0,83 NA NA NA
TRILOGY AB - ceramic 6 0 0,00 100,00 0,00 4,66 NA NA NA
TC - revision 5 0 0,00 100,00 0,00 1,56 NA NA NA
WM oval 5 0 0,00 100,00 0,00 0,72 NA NA NA
NNC - Titan 2 0 0,00 100,00 0,00 4,15 NA NA NA
ACETABULAR PLATES 2 0 0,00 100,00 0,00 0,61 NA NA NA
RSC - revision 1 0 0,00 100,00 0,00 1,80 NA NA NA
PINNACLE 2791 9 0,32 99,68 0,33 6,25 0,009 6,23 6,26
M-H-shell 287 1 0,35 99,65 0,36 4,56 0,015 4,53 4,59
© Slovakian Arthroplasty Register 2011
© Slovakian Arthroplasty Register 2011

37 / Acta Chir. orthop. Traum. čech., 78, 2011 Supplementum
Review of the annual report of the Slovakian Arthroplasty Register – 2010
Tab. 43. (cont.)
Name n e RR SR HR mean se LB UB
SF 800 4 0,50 99,50 0,52 7,77 0,041 7,69 7,85
DELTA - PF 325 2 0,62 99,38 0,63 1,79 0,031 1,73 1,85
DELTA 599 4 0,67 99,33 0,69 2,87 0,012 2,85 2,89
NOVAE EVOLUTION 2533 18 0,71 99,29 0,73 7,92 0,019 7,88 7,96
TRILOGY 1109 8 0,72 99,28 0,74 7,94 0,019 7,90 7,98
CLS SPOTORNO 564 5 0,89 99,11 0,91 5,82 0,049 5,72 5,91
DURALOC 2929 27 0,92 99,08 0,95 7,90 0,014 7,87 7,92
L-CUP 645 6 0,93 99,07 0,96 7,93 0,020 7,89 7,97
CENTRAMENT 87 1 1,15 98,85 1,19 6,40 0,073 6,26 6,54
T.O.P. 84 1 1,19 98,81 1,23 5,09 0,068 4,96 5,23
PLASMACUP 997 16 1,60 98,40 1,66 7,65 0,051 7,55 7,75
COPTOS 47 1 2,13 97,87 2,20 6,39 0,391 5,62 7,16
BICON-PLUS 43 1 2,33 97,67 2,40 7,83 0,101 7,63 8,02
BEZNOSKA (uncement) 1009 25 2,48 97,52 2,56 7,72 0,038 7,64 7,79
DURALOC OPTION 25 1 4,00 96,00 4,13 7,26 0,259 6,75 7,77
ASR 22 1 4,55 95,45 4,69 5,43 0,239 4,97 5,90
ZWEYMULLER-ALLOCLASSIC CSF 219 12 5,48 94,52 5,65 6,54 0,368 5,82 7,26
DELTA - TT 18 1 5,56 94,44 5,73 0,67 0,038 0,59 0,75
OCTOPUS 23 4 17,39 82,61 17,95 6,35 0,615 5,14 7,55
WM conical 2 2 100,00 0,00 103,19 2,58 1,018 0,59 4,58
WM sferical 1 1 100,00 0,00 103,19 0,33 NA NA NA
Uncemented 15581 151 0,97 99,03 0,80 7,90 0,009 7,88 7,92
Acetetabular components 25321 310 1,22 98,78 1,22 7,88 0,007 7,87 7,89
Whole database 55094 727 1,32 98,68 1,00 7,87 0,005 7,86 7,88
color failure/component RR [incl. SR, HR] mean survival zero or one failures 0 (group mean,8] RR revision rate (0,group mean] (7,group mean] SR survival rate (group mean,10] (5,7] HR hazard rate <50 components (10,100] [0,5] mean mean survival
mean values se standard error (of mean survival) highest number of components used (acet/fem, each 5) CI confidence interval
having more than 2 or more failures LB lower bound of 95% CI n number of components UB upper bound of 95% CI e number of failures
Chart 47. Probability of survival of Beznoska cemented ace-tabular cup
Chart 48. Probability of survival of Duraloc uncemented ace-tabular cup
© Slovakian Arthroplasty Register 2011
© Slovakian Arthroplasty Register 2011 © Slovakian Arthroplasty Register 2011

38 / Acta Chir. orthop. Traum. čech., 78, 2011 Supplementum
Review of the annual report of the Slovakian Arthroplasty Register – 2010
Chart 49. Probability of survival of Pinnacle uncemented acetabular cup
Chart 50. Probability of survival of Novae Evolution
uncemented acetabular cup
Chart 51. Probability of survival of Charnley (DePuy) cement-
ed acetabular cup
Charts 47 to 51 show the probabilities of survival of the five most commonly used acetabular com- ponents, regardless of the fixation type. Femoral components During the period 2003–2010, five brands of femoral cemented stems reached more than 1,000 implantations. The most frequently used was the Beznoska CFS with 4,868 implantations, the second most commonly used CFS was the Beznoska hemiarthroplasty with 3,446 records. Fourteen CFCs had less than 50 recordes. The probabilities of survival of the four most used CFSs are shown charts 52–56. In the observed time period 2003–2010, we identify only four CFS brands were identified with more than 50 records 50 without any failure – Logica, Trilliance, Fjord, and CL Trauma hemiarthroplasty. In the group of the UFSs there were 28 brands with less than 50 implantations each. The probability of survival of most used UFS – Corail with 2,746 applications – is shown in chart 54. In the UFS group there are only two implants without any failures – Proxima and Ana.Nova MII.
Chart 52. Probability of survival of Beznoska cemented femo-ral stem
Tab. 44. Primary THA – cemented femoral stems
Name n e RR SR HR mean se LB UB
LOGICA (cem) 256 0 0,00 100,00 0,00 2,75 NA NA NA
TRILLIANCE 87 0 0,00 100,00 0,00 2,27 NA NA NA
FJORD 54 0 0,00 100,00 0,00 3,92 NA NA NA
CL TRAUMA – hemiarthropl. 51 0 0,00 100,00 0,00 2,56 NA NA NA
LIBRA 26 0 0,00 100,00 0,00 2,25 NA NA NA
Z-AXIS 14 0 0,00 100,00 0,00 7,94 NA NA NA
AUTOBLOQAUATE 9 0 0,00 100,00 0,00 0,37 NA NA NA
FRIENDLY 4 0 0,00 100,00 0,00 2,35 NA NA NA
CORAIL (cem) 3 0 0,00 100,00 0,00 0,23 NA NA NA
© Slovakian Arthroplasty Register 2011
© Slovakian Arthroplasty Register 2011
© Slovakian Arthroplasty Register 2011 © Slovakian Arthroplasty Register 2011
© Slovakian Arthroplasty Register 2011

39 / Acta Chir. orthop. Traum. čech., 78, 2011 Supplementum
Review of the annual report of the Slovakian Arthroplasty Register – 2010
Tab. 44. (cont)
Name n e RR SR HR mean se LB UB
MS-30 2 0 0,00 100,00 0,00 3,16 NA NA NA
TRIO (cem) 2 0 0,00 100,00 0,00 0,38 NA NA NA
ENDO-MODELL saddle 1 0 0,00 100,00 0,00 1,20 NA NA NA
C-STEM 957 6 0,63 99,37 0,36 6,79 0,031 6,73 6,85
CPT 711 7 0,98 99,02 0,57 7,90 0,031 7,84 7,96
BEZNOSKA hemiarthropl. 3446 38 1,10 98,90 0,64 7,88 0,019 7,84 7,91
AUSTIN-MOORE hemiarthropl. 501 6 1,20 98,80 0,70 7,86 0,047 7,77 7,95
SAGITA EVOLUTION 244 3 1,23 98,77 0,71 7,83 0,085 7,67 8,00
CENTRAMENT 1559 23 1,48 98,52 0,86 7,74 0,028 7,68 7,79
BIMETRIC (cem) 1102 18 1,63 98,37 0,95 7,88 0,027 7,83 7,93
CSC 977 16 1,64 98,36 0,95 7,68 0,041 7,60 7,77
BEZNOSKA 4868 86 1,77 98,23 1,03 7,83 0,019 7,79 7,86
SL (cem) 108 2 1,85 98,15 1,08 2,70 0,035 2,63 2,77
CHARNLEY 2061 43 2,09 97,91 1,21 7,86 0,021 7,82 7,90
CHARNLEY MODULAR 237 5 2,11 97,89 1,23 4,92 0,402 4,13 5,70
EXETER V40 93 2 2,15 97,85 1,25 3,51 0,115 3,28 3,73
LUBINUS CLASSIC PLUS 79 2 2,53 97,47 1,47 7,79 0,086 7,62 7,96
CSC hemiarthropl. 168 5 2,98 97,02 1,73 6,81 0,095 6,62 7,00
AUSTIN-MOORE hemiarthropl. (cem) 26 1 3,85 96,15 2,24 3,07 NA NA NA
AAP 25 1 4,00 96,00 2,33 3,06 NA NA NA
BEZNOSKA - custom-made, tumor. 30 2 6,67 93,33 3,88 5,86 0,990 3,92 7,80
ELITE PLUS 347 32 9,22 90,78 5,36 7,47 0,087 7,30 7,64
ULTIMA-HOWSE II 69 8 11,59 88,41 6,74 6,28 0,216 5,85 6,70
MULLER GERADSCHAFT 16 3 18,75 81,25 10,90 5,83 0,477 4,89 6,76
ULTIMA-STREIGHT STEM 6 2 33,33 66,67 19,38 5,81 1,138 3,58 8,04
ASR 3 1 33,33 66,67 19,38 2,84 0,538 1,79 3,90
Cemented 18142 312 1,72 98,28 1,23 7,84 0,009 7,82 7,86
Femoral components 29773 417 1,40 98,60 1,40 7,86 0,007 7,85 7,87
Whole database 55094 727 1,32 98,68 1,00 7,87 0,005 7,86 7,88
color failure/component RR [incl. SR, HR] mean survival zero or one failures 0 (group mean,8] RR revision rate (0,group mean] (7,group mean] SR survival rate (group mean,10] (5,7] HR hazard rate <50 components (10,100] [0,5] mean mean survival
mean values se standard error (of mean survival) highest number of components used (acet/fem, each 5) CI confidence interval
having more than 2 or more failures LB lower bound of 95% CI n number of components UB upper bound of 95% CI e number of failures
Tab. 45. Primary THA – uncemented femoral stems
Name n e RR SR HR mean se LB UB
PROXIMA 385 0 0,00 100,00 0,00 4,89 NA NA NA
ANA.NOVA MII 137 0 0,00 100,00 0,00 2,94 NA NA NA
ABGII V40 46 0 0,00 100,00 0,00 1,10 NA NA NA
SL-PLUS 43 0 0,00 100,00 0,00 7,93 NA NA NA
SAM - FIT 34 0 0,00 100,00 0,00 2,52 NA NA NA
X-AXIS 25 0 0,00 100,00 0,00 7,81 NA NA NA
METHA 20 0 0,00 100,00 0,00 3,84 NA NA NA
TRI-LOCK BPS 18 0 0,00 100,00 0,00 0,24 NA NA NA
COLLO - MIS 13 0 0,00 100,00 0,00 0,53 NA NA NA
© Slovakian Arthroplasty Register 2011
© Slovakian Arthroplasty Register 2011

40 / Acta Chir. orthop. Traum. čech., 78, 2011 Supplementum
Review of the annual report of the Slovakian Arthroplasty Register – 2010
Tab. 45. (cont)
Name n e RR SR HR mean se LB UB
SF - revision 10 0 0,00 100,00 0,00 4,81 NA NA NA
ANA.NOVA MII double stem couted 9 0 0,00 100,00 0,00 1,14 NA NA NA
MODULUS 8 0 0,00 100,00 0,00 0,50 NA NA NA
REVISION 6 0 0,00 100,00 0,00 1,94 NA NA NA
TRIO modular (uncem) 4 0 0,00 100,00 0,00 0,11 NA NA NA
H - MAX M 3 0 0,00 100,00 0,00 0,83 NA NA NA
H - MAX S 3 0 0,00 100,00 0,00 0,62 NA NA NA
SL-TWIN 2 0 0,00 100,00 0,00 1,56 NA NA NA
Y-AXIS 1 0 0,00 100,00 0,00 6,61 NA NA NA
ANA.NOVA NANOS 1 0 0,00 100,00 0,00 1,39 NA NA NA
CLS SPOTORNO 441 1 0,23 99,77 0,25 3,60 0,008 3,58 3,62
BICONTACT 610 2 0,33 99,67 0,36 6,66 0,044 6,58 6,75
SAGITA EVOLUTION HA 1918 8 0,42 99,58 0,46 7,96 0,013 7,94 7,99
LIBRA HA 422 3 0,71 99,29 0,79 5,44 0,811 3,85 7,03
LOGICA (uncem) 252 2 0,79 99,21 0,88 4,05 0,029 3,99 4,11
BIMETRIC (uncem) 740 6 0,81 99,19 0,90 7,91 0,026 7,86 7,96
CORAIL 2743 24 0,87 99,13 0,97 7,67 0,041 7,59 7,75
AML 1223 11 0,90 99,10 1,00 7,91 0,017 7,87 7,94
VERSYS 519 5 0,96 99,04 1,07 7,84 0,033 7,77 7,90
SF 694 8 1,15 98,85 1,28 7,76 0,056 7,66 7,87
S-ROM 79 1 1,27 98,73 1,40 7,58 0,243 7,10 8,05
FIT 515 7 1,36 98,64 1,51 2,92 0,015 2,89 2,95
ZWEYMULLER-ALLOCLASICS SL 246 4 1,63 98,37 1,80 7,82 0,068 7,69 7,96
VERSYS FMT 180 4 2,22 97,78 2,46 5,98 0,056 5,87 6,09
BETA CONE 63 2 3,17 96,83 3,52 4,42 0,088 4,25 4,59
VERSYS FMMC 28 1 3,57 96,43 3,96 6,62 0,208 6,21 7,03
SL (uncem) 54 2 3,70 96,30 4,10 2,58 0,077 2,43 2,73
C.F.P. 22 1 4,55 95,45 5,04 4,97 0,179 4,62 5,32
AUSTIN-MOORE hemiarthropl. (uncem) 22 1 4,55 95,45 5,04 2,76 NA NA NA
RMD revision 16 1 6,25 93,75 6,92 4,91 NA NA NA
SOLUTION 25 2 8,00 92,00 8,86 7,25 0,377 6,51 7,98
ASR 23 2 8,70 91,30 9,63 6,84 0,280 6,30 7,39
MP 6 1 16,67 83,33 18,46 6,66 1,193 4,32 8,99
TRIO (uncem) 6 1 16,67 83,33 18,46 3,50 NA NA NA
ZMR 10 3 30,00 70,00 33,23 4,05 0,296 3,47 4,64
WM HA 3 1 33,33 66,67 36,92 4,55 1,722 1,18 7,93
ANTEGA 3 1 33,33 66,67 36,92 1,22 0,481 0,28 2,16
Uncemented 11631 105 0,90 99,10 0,64 7,90 0,010 7,88 7,92
Femoral components 29773 417 1,40 98,60 1,40 7,86 0,007 7,85 7,87
Whole database 55094 727 1,32 98,68 1,00 7,87 0,005 7,86 7,88
color failure/component RR [incl. SR, HR] mean survival zero or one failures 0 (group mean,8] RR revision rate (0,group mean] (7,group mean] SR survival rate (group mean,10] (5,7] HR hazard rate <50 components (10,100] [0,5] mean mean survival mean values se standard error (of mean survival)
highest number of components used (acet/fem, each 5) CI confidence interval having more than 2 or more failures LB lower bound of 95% CI n number of components UB upper bound of 95% CI e number of failures
© Slovakian Arthroplasty Register 2011

41 / Acta Chir. orthop. Traum. čech., 78, 2011 Supplementum
Review of the annual report of the Slovakian Arthroplasty Register – 2010
Chart 53. Probability of survival of Beznoska cemented femo-ral hemiarthroplasty
Chart 54. Probability of survival of Corail uncemented femoral
stem
Chart 55. Probability of survival of Charnley (DePuy) cement-ed femoral stem
Chart 56. Probability of survival of Sagita Evolution HA
uncemented femoral stem
Component combinations As mentioned previously, the THA offers the pos-sibility of combinations, either with recommended components from the same manufacturer, or with components from other manufacturers, even with different types of fixation – hybrid implants. In the
next section, these combinations will be ana-lysed. From the historical point of view, the oldest and most commonly used combinations are those of cemented components.
Tab. 46. Primary THA – combinations of the cemented components
Cemented Implants Acetabular components Femoral components
Acetabular Femoral n e RR SR HR n e RR SR HR n e RR SR HR
Mueller Logica (c) 178 0 0,00 100,00 0,00 178 0 0,00 100,00 0,00 178 0 0,00 100,00 0,00
SF/A Beznoska 83 0 0,00 100,00 0,00 83 0 0,00 100,00 0,00 83 0 0,00 100,00 0,00
PE-Cup Trilliance 75 0 0,00 100,00 0,00 75 0 0,00 100,00 0,00 75 0 0,00 100,00 0,00
Beznoska (c) C-Stem 71 0 0,00 100,00 0,00 71 0 0,00 100,00 0,00 71 0 0,00 100,00 0,00
Lubinus Lubinus 65 0 0,00 100,00 0,00 65 0 0,00 100,00 0,00 65 0 0,00 100,00 0,00
Elite Plus C-Stem 54 0 0,00 100,00 0,00 54 0 0,00 100,00 0,00 54 0 0,00 100,00 0,00
O2 CSC 274 1 0,36 99,64 0,33 274 0 0,00 100,00 0,00 274 1 0,36 99,64 0,50
ZCA CPT 246 1 0,41 99,59 0,36 246 1 0,41 99,59 0,61 246 0 0,00 100,00 0,00
O2 Beznoska 217 1 0,46 99,54 0,41 217 0 0,00 100,00 0,00 217 1 0,46 99,54 0,63
Elite Plus Charnley 186 1 0,54 99,46 0,48 186 0 0,00 100,00 0,00 186 1 0,54 99,46 0,73
Elite Plus Charnley Modul. 182 1 0,55 99,45 0,49 182 1 0,55 99,45 0,83 182 1 0,55 99,45 0,75
Beznoska (c) CSC 402 6 1,49 98,51 1,33 402 2 0,50 99,50 0,75 402 5 1,24 98,76 1,70
Ultima MK2 C-Stem 165 3 1,82 98,18 1,62 165 3 1,82 98,18 2,74 165 1 0,61 99,39 0,83
© Slovakian Arthroplasty Register 2011 © Slovakian Arthroplasty Register 2011
© Slovakian Arthroplasty Register 2011 © Slovakian Arthroplasty Register 2011
© Slovakian Arthroplasty Register 2011

42 / Acta Chir. orthop. Traum. čech., 78, 2011 Supplementum
Review of the annual report of the Slovakian Arthroplasty Register – 2010
Tab. 46. (cont.)
Cemented Implants Acetabular components Femoral components
Acetabular Femoral n e RR SR HR n e RR SR HR n e RR SR HR
Charnley Charnley 1823 39 2,14 97,86 1,91 1823 18 0,99 99,01 1,49 1823 35 1,92 98,08 2,62
PE-Cup Centrament 1080 26 2,41 97,59 2,15 1080 22 2,04 97,96 3,07 1080 16 1,48 98,52 2,02
Beznoska (c) Beznoska 3023 98 3,24 96,76 2,89 3023 81 2,68 97,32 4,04 3023 62 2,05 97,95 2,80
Exeter Exeter V40 53 2 3,77 96,23 3,36 53 1 1,89 98,11 2,84 53 2 3,77 96,23 5,16
Ultima MK2 Elite Plus 51 2 3,92 96,08 3,50 51 2 3,92 96,08 5,91 51 1 1,96 98,04 2,68
Elite Plus Elite Plus 76 4 5,26 94,74 4,69 76 0 0,00 100,00 0,00 76 4 5,26 94,74 7,19
Cemented 8304 185 2,23 97,77 1,24 8304 131 1,58 98,42 1,45 8304 130 1,57 98,43 1,24
Whole database (n> 50) 22157 399 1,80 98,20 1,00 22157 242 1,09 98,91 1,00 22157 281 1,27 98,73 1,00
color failure/component RR [incl. SR, HR] zero or one failures 0 n number of components (0,group mean] e number of failures (group mean,10] RR revision rate <50 components (10,100] SR survival rate group/grand mean values HR hazard rate highest number of components used (acet/fem, each 5) c cemented having more than 2 or more failures uc uncemented
Combinations of cemented components In 2010, the most commonly used combination of cemented components was the Beznoska CFS with the Beznoska CAC. The Beznoska CFS is
found in two more combinations as shown in Tab. 46. The mean RR of all cemented im-plants was 2.23%. Charts 57 to 61 show the probability of survival of commonest CFS/CAC combinations.
Chart 57. Probability of survival of cemented Beznoska CAC/
Beznoska CFS combination
Chart 58. Probability of survival of cemented Charnley CAC/
Charnley CFS combination
Chart 59. Probability of survival of cemented PE-cup/ Cen-
trament combination
Chart 60. Probability of survival of cemented Beznoska CAC/
CSC combination
© Slovakian Arthroplasty Register 2011
© Slovakian Arthroplasty Register 2011 © Slovakian Arthroplasty Register 2011
© Slovakian Arthroplasty Register 2011 © Slovakian Arthroplasty Register 2011

43 / Acta Chir. orthop. Traum. čech., 78, 2011 Supplementum
Review of the annual report of the Slovakian Arthroplasty Register – 2010
Chart 61. Probability of survival of cemented O2/CSC combi-nation
Combinations of uncemented components There are 22 different combinations of unce-mented combinations. The most commonly used combination of UAC and UFS, in 2010, was No-vae Evolution/Sagitta Evolution HA. The most commonly used UAC was the Pinnacle with 2,276 implantations, in combinations with three different UFSs, as seen in Tab. 47. The mean RR of all uncemented implants was 1.2% compared with whole database where it was 1.80%, being the best-surviving group of implants.
Tab. 47. Primary THA – combinations of uncemented components
Uncemented Implants Acetabular components Femoral components
Acetabular Femoral n e RR SR HR n e RR SR HR n e RR SR HR
Ana.Nova Ana.Nova MII 131 0 0,00 100,00 0,00 131 0 0,00 100,00 0,00 131 0 0,00 100,00 0,00
CLS Spotorno CLS Spotorno 415 1 0,24 99,76 0,21 415 0 0,00 100,00 0,00 415 1 0,24 99,76 0,33
Delta Fit 318 1 0,31 99,69 0,28 318 1 0,31 99,69 0,47 318 1 0,31 99,69 0,43
Pinnacle AML 414 2 0,48 99,52 0,43 414 2 0,48 99,52 0,73 414 1 0,24 99,76 0,33
Pinnacle Proxima 379 2 0,53 99,47 0,47 379 2 0,53 99,47 0,80 379 0 0,00 100,00 0,00
Pinnacle Corail 1483 9 0,61 99,39 0,54 1483 4 0,27 99,73 0,41 1483 8 0,54 99,46 0,74
Trilogy Versys 494 3 0,61 99,39 0,54 494 1 0,20 99,80 0,31 494 3 0,61 99,39 0,83
Novae Evol. Libra HA 414 3 0,72 99,28 0,65 414 2 0,48 99,52 0,73 414 2 0,48 99,52 0,66
SF SF 493 4 0,81 99,19 0,72 493 3 0,61 99,39 0,92 493 3 0,61 99,39 0,83
Novae Evol. Sagita Evol.HA 1874 18 0,96 99,04 0,86 1874 15 0,80 99,20 1,21 1874 8 0,43 99,57 0,58
M-H-shell Bimetric (uc) 208 2 0,96 99,04 0,86 208 1 0,48 99,52 0,72 208 1 0,48 99,52 0,66
Delta - PF Logica (uc) 93 1 1,08 98,92 0,96 93 0 0,00 100,00 0,00 93 1 1,08 98,92 1,47
L-Cup Bimetric (uc) 410 6 1,46 98,54 1,30 410 4 0,98 99,02 1,47 410 4 0,98 99,02 1,33
Plasmacup Bicontact 583 9 1,54 98,46 1,38 583 7 1,20 98,80 1,81 583 2 0,34 99,66 0,47
Duraloc Corail 1099 18 1,64 98,36 1,46 1099 9 0,82 99,18 1,23 1099 14 1,27 98,73 1,74
Duraloc AML 756 14 1,85 98,15 1,65 756 9 1,19 98,81 1,79 756 9 1,19 98,81 1,63
Delta Logica (uc) 136 3 2,21 97,79 1,97 136 2 1,47 98,53 2,22 136 1 0,74 99,26 1,00
Trilogy Versys FMT 166 4 2,41 97,59 2,15 166 2 1,20 98,80 1,82 166 4 2,41 97,59 3,29
T.O.P Beta Cone 59 2 3,39 96,61 3,02 59 1 1,69 98,31 2,56 59 2 3,39 96,61 4,63
CLS Spotorno Corail 58 2 3,45 96,55 3,07 58 2 3,45 96,55 5,20 58 0 0,00 100,00 0,00
Delta - PF Fit 156 6 3,85 96,15 3,43 156 0 0,00 100,00 0,00 156 6 3,85 96,15 5,26
Beznoska (uc) SF 112 5 4,46 95,54 3,98 112 1 0,89 99,11 1,35 112 4 3,57 96,43 4,88
Uncemented 10251 115 1,12 98,88 0,62 10251 68 0,66 99,34 0,60 10251 75 0,73 99,27 0,58
Whole database (n> 50) 22157 399 1,80 98,20 1,00 22157 242 1,09 98,91 1,00 22157 281 1,27 98,73 1,00
color failure/component RR [incl. SR, HR] zero or one failures 0 n number of components (0,group mean] e number of failures (group mean,10] RR revision rate <50 components (10,100] SR survival rate group/grand mean values HR hazard rate highest number of components used (acet/fem, each 5) c cemented having more than 2 or more failures uc uncemented
© Slovakian Arthroplasty Register 2011
© Slovakian Arthroplasty Register 2011

44 / Acta Chir. orthop. Traum. čech., 78, 2011 Supplementum
Review of the annual report of the Slovakian Arthroplasty Register – 2010
Chart 62. Probability of survival of uncemented Novae Evolu-tion/Sagita Evolution HA combination
Chart 63. Probability of survival of uncemented Pinnacle/
Corail combination
Chart 64. Probability of survival of uncemented Duraloc/Corail
combination
Chart 65. Probability of survival of uncemented Duraloc/AML
combination
Chart 66. Probability of survival of uncemented Plasmacup/ Bicontact combination
Combinations of cemented and uncemented components The group of hybrid implants, combining cement-ed and uncemented components, is the most problematic one. The definition of standard hybrid implants is a combination of a UAC and a CFS. The reverse hybrid is defined as a combination of s CAC and a UFS. Of the low usage of hybrid implants during the observed period, 2003–2010, only 18 standard hybrid combinations have been identified, as shown in Tab. 48. None of the re-verse hybrids reached 50 implantations and, therefore, they are not included in any table or chart. In the standard combinations there are two stems that were used in three different combina-tions – Bimetric and Beznoska – and three stems used in two different combinations – CPT, C-Stem, and Centrament. With regard to acetabular components, the most commonly used was the Duraloc in five different combinations. The Bez-noska and SF acetabular components were used in two different combinations. The mean RR of the whole group is 2.75% and these comprise the worst results in the whole combination data-base. However, it must be emphasised that, from the whole THA database which totals 22,157 implants, the share of hybrids and reverse hy-brids was 3,062 implants (16.25%). The conclu-sion is reached that hybrid implants, in the SAR database, do not produce the expected perfor-mance in terms of RR and SR. Tab. 48 shows the results of hybrid combinations, and charts 67 to 71 show the probability of survival of five of the most commonly used standard hybrid implants.
© Slovakian Arthroplasty Register 2011
© Slovakian Arthroplasty Register 2011
© Slovakian Arthroplasty Register 2011
© Slovakian Arthroplasty Register 2011 © Slovakian Arthroplasty Register 2011
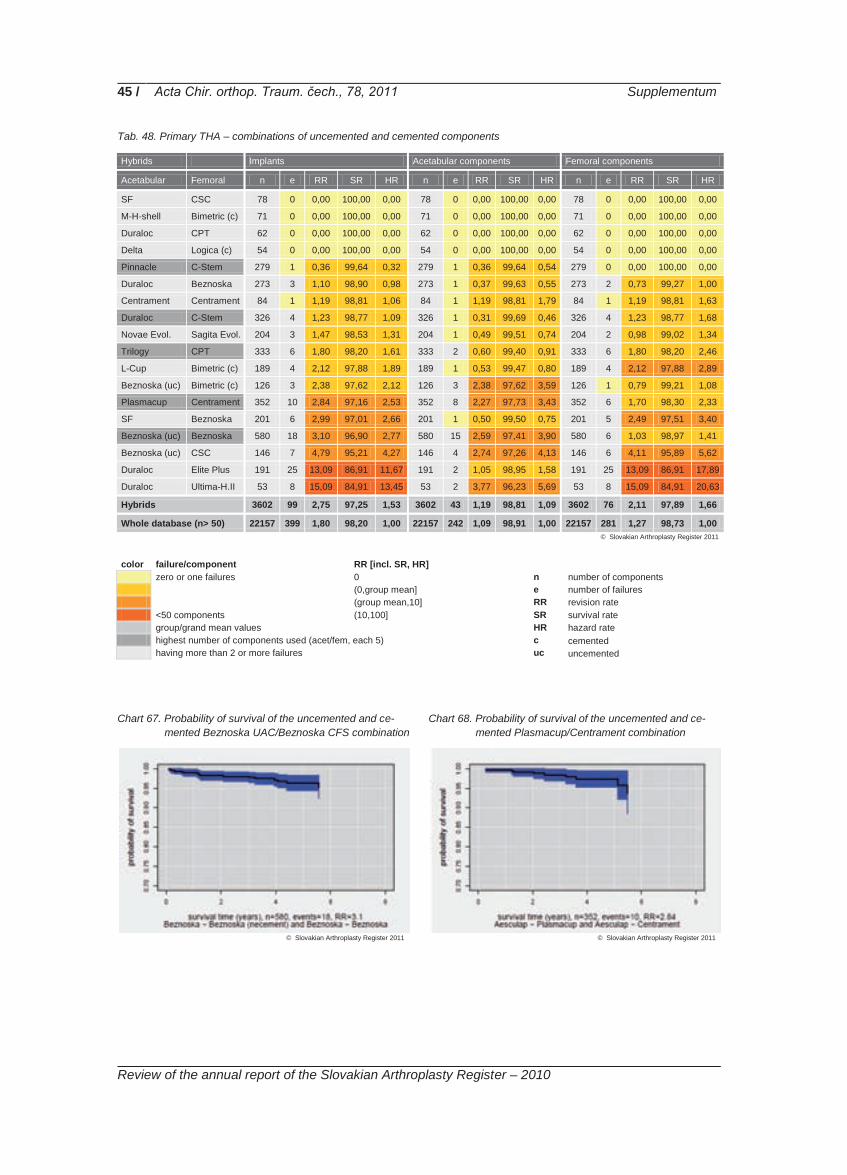
45 / Acta Chir. orthop. Traum. čech., 78, 2011 Supplementum
Review of the annual report of the Slovakian Arthroplasty Register – 2010
Tab. 48. Primary THA – combinations of uncemented and cemented components
Hybrids Implants Acetabular components Femoral components
Acetabular Femoral n e RR SR HR n e RR SR HR n e RR SR HR
SF CSC 78 0 0,00 100,00 0,00 78 0 0,00 100,00 0,00 78 0 0,00 100,00 0,00
M-H-shell Bimetric (c) 71 0 0,00 100,00 0,00 71 0 0,00 100,00 0,00 71 0 0,00 100,00 0,00
Duraloc CPT 62 0 0,00 100,00 0,00 62 0 0,00 100,00 0,00 62 0 0,00 100,00 0,00
Delta Logica (c) 54 0 0,00 100,00 0,00 54 0 0,00 100,00 0,00 54 0 0,00 100,00 0,00
Pinnacle C-Stem 279 1 0,36 99,64 0,32 279 1 0,36 99,64 0,54 279 0 0,00 100,00 0,00
Duraloc Beznoska 273 3 1,10 98,90 0,98 273 1 0,37 99,63 0,55 273 2 0,73 99,27 1,00
Centrament Centrament 84 1 1,19 98,81 1,06 84 1 1,19 98,81 1,79 84 1 1,19 98,81 1,63
Duraloc C-Stem 326 4 1,23 98,77 1,09 326 1 0,31 99,69 0,46 326 4 1,23 98,77 1,68
Novae Evol. Sagita Evol. 204 3 1,47 98,53 1,31 204 1 0,49 99,51 0,74 204 2 0,98 99,02 1,34
Trilogy CPT 333 6 1,80 98,20 1,61 333 2 0,60 99,40 0,91 333 6 1,80 98,20 2,46
L-Cup Bimetric (c) 189 4 2,12 97,88 1,89 189 1 0,53 99,47 0,80 189 4 2,12 97,88 2,89
Beznoska (uc) Bimetric (c) 126 3 2,38 97,62 2,12 126 3 2,38 97,62 3,59 126 1 0,79 99,21 1,08
Plasmacup Centrament 352 10 2,84 97,16 2,53 352 8 2,27 97,73 3,43 352 6 1,70 98,30 2,33
SF Beznoska 201 6 2,99 97,01 2,66 201 1 0,50 99,50 0,75 201 5 2,49 97,51 3,40
Beznoska (uc) Beznoska 580 18 3,10 96,90 2,77 580 15 2,59 97,41 3,90 580 6 1,03 98,97 1,41
Beznoska (uc) CSC 146 7 4,79 95,21 4,27 146 4 2,74 97,26 4,13 146 6 4,11 95,89 5,62
Duraloc Elite Plus 191 25 13,09 86,91 11,67 191 2 1,05 98,95 1,58 191 25 13,09 86,91 17,89
Duraloc Ultima-H.II 53 8 15,09 84,91 13,45 53 2 3,77 96,23 5,69 53 8 15,09 84,91 20,63
Hybrids 3602 99 2,75 97,25 1,53 3602 43 1,19 98,81 1,09 3602 76 2,11 97,89 1,66
Whole database (n> 50) 22157 399 1,80 98,20 1,00 22157 242 1,09 98,91 1,00 22157 281 1,27 98,73 1,00
color failure/component RR [incl. SR, HR] zero or one failures 0 n number of components (0,group mean] e number of failures (group mean,10] RR revision rate <50 components (10,100] SR survival rate group/grand mean values HR hazard rate highest number of components used (acet/fem, each 5) c cemented having more than 2 or more failures uc uncemented Chart 67. Probability of survival of the uncemented and ce-
mented Beznoska UAC/Beznoska CFS combination
Chart 68. Probability of survival of the uncemented and ce-mented Plasmacup/Centrament combination
© Slovakian Arthroplasty Register 2011
© Slovakian Arthroplasty Register 2011 © Slovakian Arthroplasty Register 2011

46 / Acta Chir. orthop. Traum. čech., 78, 2011 Supplementum
Review of the annual report of the Slovakian Arthroplasty Register – 2010
Chart 69. Probability of survival of the uncemented and ce-mented Trilogy/CPT combination
Chart 70. Probability of survival of the uncemented and ce-
mented Duraloc/C-Stem combination
Chart 71. Probability of survival of the uncemented and ce-mented Pinnacle/C-Stem combination
© Slovakian Arthroplasty Register 2011 © Slovakian Arthroplasty Register 2011
© Slovakian Arthroplasty Register 2011
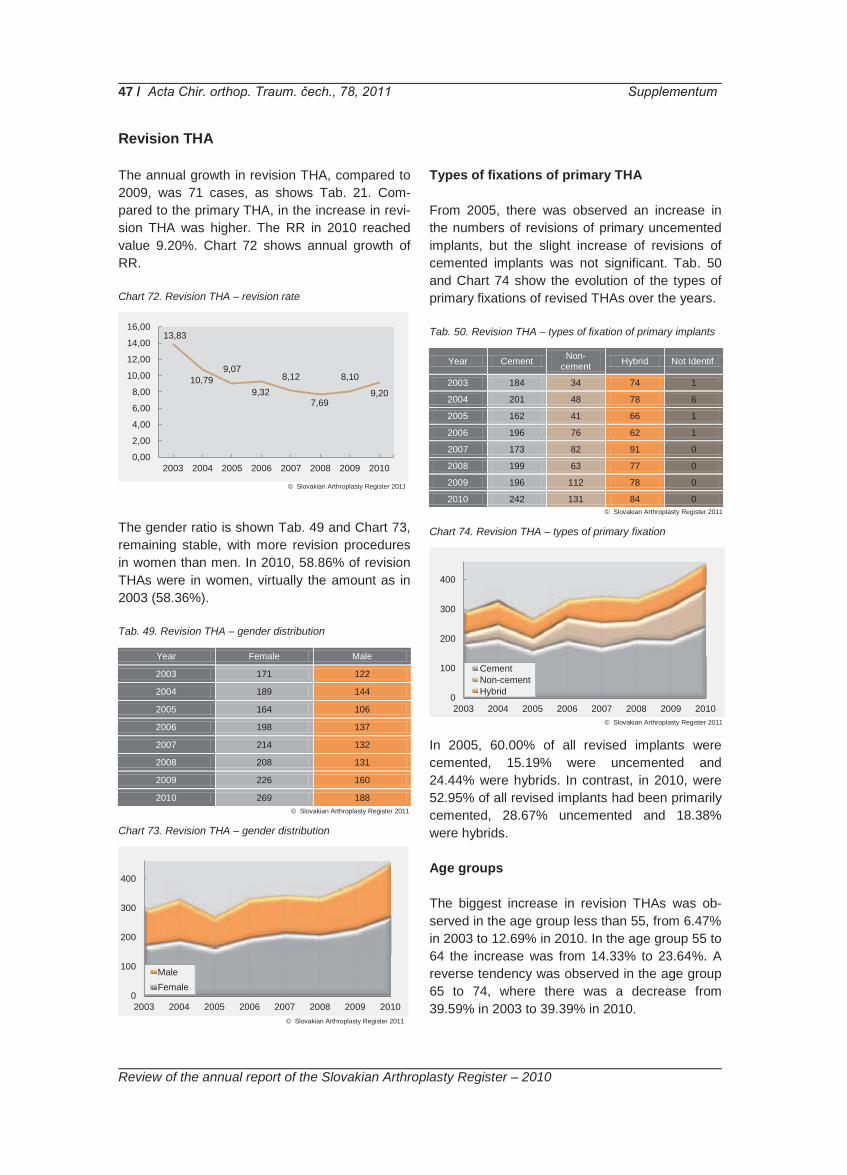
47 / Acta Chir. orthop. Traum. čech., 78, 2011 Supplementum
Review of the annual report of the Slovakian Arthroplasty Register – 2010
Revision THA The annual growth in revision THA, compared to 2009, was 71 cases, as shows Tab. 21. Com-pared to the primary THA, in the increase in revi-sion THA was higher. The RR in 2010 reached value 9.20%. Chart 72 shows annual growth of RR. Chart 72. Revision THA – revision rate
The gender ratio is shown Tab. 49 and Chart 73, remaining stable, with more revision procedures in women than men. In 2010, 58.86% of revision THAs were in women, virtually the amount as in 2003 (58.36%). Tab. 49. Revision THA – gender distribution
Year Female Male
2003 171 122
2004 189 144
2005 164 106
2006 198 137
2007 214 132
2008 208 131
2009 226 160
2010 269 188
Chart 73. Revision THA – gender distribution
Types of fixations of primary THA From 2005, there was observed an increase in the numbers of revisions of primary uncemented implants, but the slight increase of revisions of cemented implants was not significant. Tab. 50 and Chart 74 show the evolution of the types of primary fixations of revised THAs over the years. Tab. 50. Revision THA – types of fixation of primary implants
Year Cement Non-cement Hybrid Not Identif.
2003 184 34 74 1
2004 201 48 78 6
2005 162 41 66 1
2006 196 76 62 1
2007 173 82 91 0
2008 199 63 77 0
2009 196 112 78 0
2010 242 131 84 0
Chart 74. Revision THA – types of primary fixation
In 2005, 60.00% of all revised implants were cemented, 15.19% were uncemented and 24.44% were hybrids. In contrast, in 2010, were 52.95% of all revised implants had been primarily cemented, 28.67% uncemented and 18.38% were hybrids. Age groups The biggest increase in revision THAs was ob-served in the age group less than 55, from 6.47% in 2003 to 12.69% in 2010. In the age group 55 to 64 the increase was from 14.33% to 23.64%. A reverse tendency was observed in the age group 65 to 74, where there was a decrease from 39.59% in 2003 to 39.39% in 2010.
13,83
10,79 9,07
9,32
8,12
7,69
8,10
9,20
0,00
2,00
4,00
6,00
8,00
10,00
12,00
14,00
16,00
2003 2004 2005 2006 2007 2008 2009 2010
0
100
200
300
400
2003 2004 2005 2006 2007 2008 2009 2010
MaleFemale
0
100
200
300
400
2003 2004 2005 2006 2007 2008 2009 2010
CementNon-cementHybrid
© Slovakian Arthroplasty Register 2011
© Slovakian Arthroplasty Register 2011
© Slovakian Arthroplasty Register 2011
© Slovakian Arthroplasty Register 2011
© Slovakian Arthroplasty Register 2011

48 / Acta Chir. orthop. Traum. čech., 78, 2011 Supplementum
Review of the annual report of the Slovakian Arthroplasty Register – 2010
Tab. 51. Revision THA – age groups
Year 15-19 20-24 25-29 30-34 35-39 40-44 45-49 50-54 55-59 60-64 65-69 70-74 75-79 80-84 85+
2003 0 0 0 3 2 0 6 8 17 25 53 63 60 42 14
2004 0 1 0 1 1 2 5 14 36 36 43 55 79 40 20
2005 0 0 1 2 1 1 5 11 20 32 33 50 76 27 11
2006 0 1 0 2 2 1 9 13 33 41 55 67 79 23 9
2007 1 0 0 3 4 5 11 23 33 45 56 69 64 27 5
2008 0 0 0 0 1 4 12 12 41 52 60 83 47 18 9
2009 0 0 0 0 5 6 12 33 58 47 76 58 64 19 8
2010 0 0 2 3 1 5 17 30 46 62 87 93 65 37 9
The biggest decrease was in the age group over 75, from 39.59% in 2003 to 24.29% in 2010. A
detailed break-down of age groups of revision THA after years is shown in Tab. 51.
Reasons for the revision Analyses of the reasons of revisions are compli-cated with the multiple-choice in the revision pro-tocol, which means that each revision THA could potentially have more than one reason for revi-sion. Therefore, the total number of reasons for revision doesn´t respect the total number of per-formed revision THAs. The most frequent reason for revision remains aseptic loosening of the ace-tabular and femoral components, but there is a reduced tendency for aseptic loosening of only the acetabular component from 31.37% in 2003 to 20.36% in 2010, and for aseptic loosening of only the femoral component from 24.61% in 2003 to 19.28% in 2010. The biggest increase – four times – was found in the dislocation of the THA. In 2003 dislocation was the reason for revision in 2.43% of all reasons and, in 2010, it was already 10.09%. A similar trend was observed for chronic infection from 2.27% in 2003 to 6.13% in 2010.
The third most common reason with a significant increase was periprosthetic fracture, rising from from 3.47% in 2003 to 6.31% in 2010. Chart 75. Revision THA – reasons for revision
Chart 75 shows the five most frequent reasons for revision and Tab. 52 shows all reasons for revision year by year.
Tab. 52. Revision THA – reasons for revision
Year
Par
aarti
cula
r Osi
fica-
tions
Luxa
tion
Pol
yeth
ylen
e W
ear
Ear
ly In
fect
ion
Chr
onic
Infe
ctio
n
Ace
tabu
lary
Pro
trusi
s
Ase
ptic
Loo
seni
ng o
f B
oth
Com
pone
nts
Ase
ptic
Loo
seni
ng o
f A
ceta
b. C
ompo
nent
Ase
ptic
Loo
seni
ng o
f Fe
mor
al C
ompo
nent
Ost
eoly
sis
of A
ceta
bu-
lum
Ost
eoly
sis
of F
emur
Big
Bon
e D
efec
t of
Ace
tabu
lum
Big
Bon
e D
efec
t of
Fem
ur
Per
ipro
sthe
sis
Frac
ture
Frac
ture
of
Impl
ant
Spa
cer t
o TH
A
Gird
lest
one
to T
HA
Oth
er
2003 5 14 8 6 16 28 0 181 142 39 45 14 5 20 39 0 0 15
2004 10 20 18 3 20 17 0 196 167 29 28 21 9 11 32 0 1 15
2005 4 19 12 1 12 17 0 130 132 31 28 14 5 13 16 0 0 22
2006 10 25 28 8 26 32 1 134 159 40 30 12 10 16 11 0 1 16
2007 12 28 14 6 34 20 39 113 105 13 22 6 6 24 18 0 1 5
2008 3 38 15 4 32 11 49 97 111 13 23 12 4 13 11 0 1 11
2009 4 38 28 3 30 22 52 108 133 13 14 13 5 12 19 0 1 13
2010 11 56 21 4 34 27 58 113 107 15 12 12 2 35 17 9 3 19
050
100150200250300350400450
2003 2004 2005 2006 2007 2008 2009 2010
LuxationCh.Inf.As.Loos. of Acet. C.As.Loos. of Fem. C.Osteolysis of Fem.
© Slovakian Arthroplasty Register 2011
© Slovakian Arthroplasty Register 2011
© Slovakian Arthroplasty Register 2011

49 / Acta Chir. orthop. Traum. čech., 78, 2011 Supplementum
Review of the annual report of the Slovakian Arthroplasty Register – 2010
Revised elements of implants Tab. 53. Revision THA – revised elements of implants
Yea
r
Who
le S
yste
m
Ace
tabu
lar C
ompo
nent
Fem
oral
Com
pone
nt
Hea
d
Inla
y
Tota
l Rep
lace
men
t of
Bip
olar
Hem
iarth
ropl
.
Ost
eosy
nthe
sis
Gird
lest
one
Spa
cer
Oth
er
2003 130 93 69 3 0 0 1 1 0 0
2004 141 93 77 8 2 1 0 12 0 0
2005 91 76 89 7 1 1 0 10 0 0
2006 136 79 92 14 8 0 0 16 0 0
2007 131 94 95 8 1 1 0 16 0 0
2008 120 86 102 7 0 1 1 21 0 1
2009 149 76 111 17 4 1 1 19 4 4
2010 165 94 123 29 4 1 1 22 17 1
The revision protocol has ten options for revised components. In comparison to 2003, the whole system was revised in 43.77% of all cases, in 2010 replacement of the whole system was un-dertaken in 36.11% of all revisions. A further decrease was observed in the revision of aceta-bular component alone, from 31.31% to 20.57% over the same period. On the other hand, revi-sion of the femoral component was performed more often in 2010, rising from 23.61% of all
cases in 2003 to 26.91% in 2010. Conversions of bipolar hemiarthroplasties and of ostheosynthe-ses were performed only six times during the whole observation period from 2003 to 2010. A small increase of conversion of Girdlestone exci-sion arthroplasties was recorded. This reason for revision was only added to the protocol in 2008, so there are insufficient data for any attempt at interpretation.
Antibiotic prophylaxis in primary and revision THA
ATB
bra
nd
Vul
miz
olin
Axe
tine
Una
syn
Clim
icin
Bita
mon
Am
oksi
klav
Cip
hin
Zina
cef
Cef
alot
in
Xor
im
Kef
zol
Edi
cin
Aug
men
tin
Lend
acín
Aba
ktal
Dal
acin
Primary THA 2 633 829 325 281 143 149 79 64 51 54 68 5 48 52 32 35
Revision THA 268 42 26 28 4 3 13 1 0 2 2 45 0 2 1 5
Tab. 54. Revision THA – antibiotic prophylaxis in primary and revision THAs In 2010, antibiotic prophylaxis was used in 99.82% of all primary THAs and in 98.69% of all revision THAs. Antibiotic prophylaxis is the standard in all units in Slovakia and the most-used types of antibiotics are cephalosporins. Vulmizolin was the most-used brand, adminis-
tered in 53.06% of all primary THAs and in 59.42% of all revision THAs. The second mostly used brand of antibiotic was Axetine, in 16.70% of all primary THAs and in 9.31% of all revision THAs. Tab. 54 shows all those brands of antibiot-ics used in 2010 more than 50 times.
. .
© Slovakian Arthroplasty Register 2011
© Slovakian Arthroplasty Register 2011

50 / Acta Chir. orthop. Traum. čech., 78, 2011 Supplementum
Review of the annual report of the Slovakian Arthroplasty Register – 2010
Primary TKA The history of the TKA in Slovakia is shorter than that of THA. Probably the first clinically success-ful knee implant used was the anatomical knee implant Walter-Motorlet, which was introduced into the Czechoslovakian market in 1984. The first TKAs with this implant were performed in 1986. Only big units, mostly university or faculty departments, were performing this type of sur-gery. Thanks to good results of TKA during the eighties, more foreign knee implants were intro-duced to the Slovakian market. Not all units were contracted with health insurance companies to perform this type of surgery. The TKA register was officially launched on the 1st January 2006. Because of the short period of observation, from 2006 to 2010, the knee register did not reach five years until 1st the January 2011. The statistical method that SAR uses did not permit evaluations, in this report, according to the gender, type of fixation and age groups. These evaluations will be published for the first time in the 2011 report. Tab. 55. No.of primary and revision TKAs
Year Primary Revision
2006 892 20
2007 1 364 41
2008 1 611 51
2009 2 028 84
2010 2 198 97
Chart 76. No. of primary and revision TKAs
The growth of TKAs is shown in Tab. 55 and Chart 76. In 2010, 28 units performed 2,198 pri-mary and 97 revision knee arthroplasties. In 2006, 97.81% were primary and only 2.19% were revision arthroplasties. In 2010 primary TKAs accounted for 95.77% and revision TKA in-creased to 4.23%. The number of primary TKAs
was 2.5 times more than in 2004, but revision TKA was 4.9 times more than in 2006. Chart 77. Primary TKA – revision rate
In 2010, the RR was almost twice as high as in 2006, increasing from 2.21% to 4.41%. Chart 78. Primary TKA – incidence
The incidence of primary TKA grow by 144% and in 2010 reached 40.44 per 100,000 inhabitants, as shown in Chart 78. Tab. 56. Primary TKA – gender distribution
Year Female Male
2006 627 265
2007 921 443
2008 1 107 504
2009 1 393 635
2010 1 481 717
In Tab. 56 and Chart 79, it is possible to observe gender distribution of patients with the TKA. In 2006 it was 70.29% females to 29.71% males, the ratio being 2.3:1. In 2010, the number of male patients increased to 32.62% of all patients and the female/male ratio reached 2.1:1.
0
500
1 000
1 500
2 000
2006 2007 2008 2009 2010
PrimaryRevision
2,24 3,01
3,17 4,14
4,41
0,000,501,001,502,002,503,003,504,004,505,00
2006 2007 2008 2009 2010
16,54
25,25 29,77
37,38 40,44
05
1015202530354045
2006 2007 2008 2009 2010© Slovakian Arthroplasty Register 2011
© Slovakian Arthroplasty Register 2011
© Slovakian Arthroplasty Register 2011
© Slovakian Arthroplasty Register 2011
© Slovakian Arthroplasty Register 2011

51 / Acta Chir. orthop. Traum. čech., 78, 2011 Supplementum
Review of the annual report of the Slovakian Arthroplasty Register – 2010
Chart 79. Primary TKA – gender distribution
The percentage increase in primary TKA was 146.41% compared to the 2006. The increase was much higher for revision TKA reaching 385.00% compared with 2006. Annual growth in revision TKA was 15.47%, very is similar to the annual growth in revision THA, which was 13.86%. The increase in the numbers of revision TKAs has led to an increase of RR, which reached 4.41% in 2010, but still it is half that of the RR of primary THA (9.20).
Age groups Tab. 57. Primary TKA – age groups
Year -15 15-19 20-24 25-29 30-34 35-39 40-44 45-49 50-54 55-59 60-64 65-69 70-74 75-79 80-84 85+
2006 0 0 0 0 0 2 1 11 24 93 152 206 183 167 46 7
2007 0 1 0 0 2 7 10 8 65 128 212 305 333 212 70 11
2008 1 1 1 2 5 5 7 23 74 179 297 391 339 228 52 6
2009 0 0 3 1 2 4 11 29 124 272 357 539 359 273 43 11
2010 1 2 0 5 0 9 7 38 139 281 437 510 426 282 55 6
The situation in the distribution of TKAs among the age groups is different from THAs as in Tab. 57. Apart from the age groups 25–29 and 35–39, in which there were only five (0.23%) and nine (0.41%) respectively, the whole group less than 50 years of age grew from 4.25% of all TKAs in 2006 to 9.11% in 2010. The main growth was observed in the age group 55–64, in which, com-pared to 2006, the share rose from 27.47% to
32.66% in 2010. There was a decrease in the age group 65 to 74 from 43.61% in 2006 to 42.58% in 2010. The most significant decrease was observed in the age group more than 75 years, from 24.66% to 15.60%. The explanation for this decrease could be that TKAs are being performed in younger age groups, similar to the trend in THAs. A similar trend is not expected in 2011.
Diagnoses Tab. 58. Primary TKA – indicative diagnoses
Year Primary Mono-condylar Arthrosis
Primary Bicondy-lar Arthrosis
Posttraumatic Arthrosis Aseptic Necrosis Rheumatoid
Arthritis Other
2006 52 762 29 5 26 3
2007 76 1 152 80 7 30 12
2008 77 1 374 91 8 49 9
2009 116 1 788 71 7 33 8
2010 190 1 879 73 4 31 20
The main diagnosis for primary TKA is still prima-ry bicondylar degenerative joint disease (DJD) of the knee. There are six diagnostic options in the primary TKA protocol and the primary bicondylar DJD accounted for a share of 85.53% in 2010. In comparison to the 2006, there was no significant shift, the share for this diagnosis being 86.89% in 2010. The biggest increase was recorded in pri-mary monocondylar DJD, where the increase was from 5.93% in 2006 to 8.65% in 2010 ob-
served. The second most common diagnosis, posttraumatic DJD reached a share of 3.32%, only 0.01% more than in 2006. Rheumatoid ar-thritis accounted for only 1.41% and unidentified diagnosis was only 0.91% of all recorded TKAs in 2010, as in Tab. 58. Of interest is the increase in the diagnosis monocondylar DJD, despite a very low number of knee hemiartroplasties used gene-rally in Slovakia.
0
500
1 000
1 500
2 000
2006 2007 2008 2009 2010
FemaleMale
© Slovakian Arthroplasty Register 2011
© Slovakian Arthroplasty Register 2011
© Slovakian Arthroplasty Register 2011

52 / Acta Chir. orthop. Traum. čech., 78, 2011 Supplementum
Review of the annual report of the Slovakian Arthroplasty Register – 2010
Surgical approaches Tab. 59. Primary TKA – surgical approaches
Year
Mid
-vas
tus
Med
ial
Par
apat
ella
r
Late
ral
Par
apat
ella
r
Sub
vast
us
Tube
rcle
O
steo
tom
y
Oth
er
Not
. Ide
ntif
2006 195 668 4 9 1 0 15
2007 364 964 18 7 3 1 7
2008 444 1 105 30 25 0 4 3
2009 492 1 489 19 12 0 11 5
2010 521 1 632 28 14 1 1 1
Two of the approaches, medial parapatellar and mid-vastus, were predominant with a combined share of 97.95% of all approaches used for pri-mary TKA. There was a decrease of only 0.64% of medial parapatellar approach compared to 2006. The use of the mid-vastus approach in-creased slightly from 21.86% in 2006 to 23.70% in 2010. The biggest increase was observed in the lateral parapatellar approach, from 0.45% to 1.27%. This increase is demonstrated in Chart 80. Chart 80. Primary TKA – surgical approaches
Types of implants used Tab. 60. Primary TKA – types of implants used
Year Unicondylar Bicondylar
2006 29 863
2007 59 1 305
2008 41 1 570
2009 35 1 993
2010 60 2 138
Tab. 60 and Chart 81 show the types of implants used. The commonest were bicondylar implants, used in 2010 in 97.27% of cases in 2010, com-
pared to 96.75% in 2006. Hemiarthroplasty of the knee was used in 60 cases, only 2.72%. There was a significant decrease, compared to 2006, when the share of hemiarthroplasty was 3.25%. The conclusion is that the decrease in hemiar-throplasty and the increase in the indicative diag-nosis the monocondylar DJD of the knee are connected and the majority of these patients have received bicondylar TKAs. Chart 81. Primary TKA – types of implants used
Types of the fixation Tab. 61. Primary TKA – types of the fixation
Cement Non-cement Hybrid
2006 878 4 10
2007 1 319 10 35
2008 1 565 5 41
2009 1 980 18 30
2010 2 133 30 35
A similar situation exists in the type of fixation. In 97.04% of all TKAs, bone cement was used for fixation of both components. This represents a slight decrease compared with 2006 when ce-ment fixation was used in 98.43%. There has been a small increase in uncemented and hybrid types of fixation. In 2006, uncemented fixation was used in only four patients (0.45%), whereas in 2010 it was used in 30 patients (1.36% of all cases). There was an increase in hybrid fixation from 1.12% in 2006 to 1.59% in 2010. Tab. 61 and Chart 82 show the evolution of the type of fixation over the years. The observed increase in uncemented and hybrid TKAs over the whole period 2006–2010 resulted in a combined share for these two types of fixations of only 2.95% of all TKAs.
0
500
1 000
1 500
2 000
2006 2007 2008 2009 2010
Mid-vastusMedial ParapatellarLateral Parapatellar
0
500
1 000
1 500
2 000
2006 2007 2008 2009 2010
UnicondylarBicondylar
© Slovakian Arthroplasty Register 2011
© Slovakian Arthroplasty Register 2011
© Slovakian Arthroplasty Register 2011
© Slovakian Arthroplasty Register 2011
© Slovakian Arthroplasty Register 2011

53 / Acta Chir. orthop. Traum. čech., 78, 2011 Supplementum
Review of the annual report of the Slovakian Arthroplasty Register – 2010
Chart 82. Primary TKA – types of the fixation
Brands of implants Knee implants can not be combined as can hip joint implants. The problem with knee implants is that under the same implant name can be CR, PS and sometimes CCK variants of the implant. To increase the complexity, the tibial component could be fixed or mobile. The SAR inventory of the knee implants was completed during 2010 and all brands with possible different models and types of tibial components are in Tab. 63. Only an ITS could solve this problem. All implants are ranked according to the numbers of components used in 2010. From 2006, the PFC Sigma (DePuy) dominated the Slovakian market and in 2010 this implant reached 35.21% of all used TKAs. For long term follow-up, there is difficulty distinguishing between the variants of this im-plant, before the introduction of the ITS. Under the brand PFC Sigma, with a share of 32.83%, are probably both CR and PS variants and under the PFC Sigma RP brand, with a 1.85% share are the CR rotating implants PFC Sigma CR-RP and also PS rotating implants PFC Sigma PS-RP. Under the brand name PFC Sigma Revision, with only a 0.45% share of all implants could also be PS and CCK variants. Only the model PFC Sigma ALL POLY a CR model, is clearly, unique-ly distinguishable. The only possible solution is a clear identifier, namely the bar code of the im-plant. For the knee implants, identification using the ITS is essential. In Tab. 62 the brands of implants are divided into four groups according to the percentage share of all implanted TKAs. Two
implants from group one reached 45.36% and of the four implants within the group, two accounted for 72.38%. Nineteen brands from group four – each under 1.00% of all implants – reached a combined share of only 5.51% of all implants in 2010. Tab. 62. Primary TKA – ranking of the implants
Name n %
PFC SIGMA 722 32,85%
COLUMBUS 275 12,51%
NEX-GEN CR 162 7,37%
AGC - universal knee 153 6,96%
NEX-GEN LPS 140 6,37%
MC2 139 6,32%
SVL 108 4,91%
MULTIGEN PLUS - CR - fix. 104 4,73%
SCORPIO NRG 82 3,73%
PFC SIGMA RP 40 1,82%
ROCC 35 1,59%
E-MOTION 33 1,50%
SVL/RP 31 1,41%
LSC 26 1,18%
SOLUTION EPP 22 1,00%
MULTIGEN PLUS - CR 18 0,82%
SLED PROSTHESIS 17 0,77%
MULTIGEN PLUS - PS - fix. 15 0,68%
ENDO-MODELL 10 0,45%
PFC SIGMA REVISION 10 0,45%
MULTIGEN PLUS - CR - rot. 9 0,41%
UNI Oxford-hemiarthroplasty 8 0,36%
EPP PIVOT 6 0,27%
NEX-GEN LCCK 6 0,27%
GEMINI 5 0,23%
ROTASURF 4 0,18%
SVS 4 0,18%
CMS - hinge 2 0,09%
PFC SIGMA ALL POLY 2 0,09%
AMK 1 0,05%
BEZNOSKA - tumor 1 0,05%
MULTIGEN PLUS - PS - rot. 1 0,05%
NEX-GEN RHK 1 0,05%
PRESERVATION UNI 1 0,05%
Total 2 193 99,77%
0
500
1 000
1 500
2 000
2006 2007 2008 2009 2010
CementNon-cementHybrid
© Slovakian Arthroplasty Register 2011
© Slovakian Arthroplasty Register 2011

54 / Acta Chir. orthop. Traum. čech., 78, 2011 Supplementum
Review of the annual report of the Slovakian Arthroplasty Register – 2010
Tab. 63. Primary TKA – implants according to the manufacturers, model and type of fixation
Implantat Cemented Hybrid Uncemented Revision Other
Lima
Multigen Plus Biolox Delta Multigen Plus-CR-Fix Multigen Plus-CR-Rot Multigen Plus-PS-Fix Multigen Plus-PS-Rot Multigen Plus-CCK Multigen Plus-H
CR PS CR-ROT PS-ROT
CR PS CR-ROT PS-ROT
CR PS CR-ROT PS-ROT
CCK Hinged Ceramic-CR,ALL-Poly
Zimmer
Nex-Gen CR Nex-Gen PS Nex-Gen LCCK Nex Gen RHK Nex Gen Segmental
CR PS PS-ROT
CR PS PS-ROT
CCK Hinged Segmental
Gender CR Gender PS High Flex CR High Flex PS
DePuy
AMK PFC Sigma PFC Sigma RP PFC Sigma ALL Poly PFC Sigma Revision MBT/C3 Sigma Revision Stab.Plus Preservation-Uni LCS S-ROM Noil Hinged Knee
CR PS PS-ROT PS-High Flex
CR PS PS-ROT PS-High Flex
CR PS PS-ROT PS-High Flex
CCK Hinged
All-poly tibia High Flex
Biomet
AGC TMK-ROT Uni Oxford ROCC
CR PS ROT
CR
Serf Rotasurf C2F Implants CR-ROT CR-ROT CR-ROT Hinged
Beznoska
SVL SVL/RP SVS SVR-Revizne CMS
CR PS CR-ROT PS-ROT
CCK Hinged Individual-R Individual-Tumor
Aesculap Search Evolution Columbus E-Motion
CR PS CR-ROT PS-ROT
CR PS CR-ROT PS-ROT
CR PS CR-ROT PS-ROT
CCK Hinged
W-Link Endo-Modell Sled Prosthesis Gemini
CR PS CR-ROT
CR PS CR-ROT
CR PS CR-ROT
CCK Hinged Individual-R Individual-Tumor
W-M - Medin
WM Universal WM modular Medin Ortopaedic
CR,PS
Stryker Scorpio NRG Scorpio TS
Endoplant EPP Pivot Solution EPP
CR PS CR-ROT PS-ROT
Ceraver PS PS-ROT
© Slovakian Arthroplasty Register 2011

55 / Acta Chir. orthop. Traum. čech., 78, 2011 Supplementum
Review of the annual report of the Slovakian Arthroplasty Register – 2010
Revision TKA Of the 28 Slovakian units performing primary TKA in 2010, only 16 units performed at least one revision TKA, and only five units performed more than 10 revision TKAs. These five units per-formed 78.35% of all revisions. The RR of prima-ry TKAs reached a 2010 value 4.41%, an in-crease of 96.87% compared to 2006. Chart 26 shows the evolution of the RR. Chart 83. Revision TKA – revision rate
The gender distribution of revised patients is different from that for THA. In 2006 females ac-counted for 70.00% and in 2010 it was 70.10% of all revised patients. Tab. 64. Revision TKA – gender distribution
Year Female Male
2006 14 6
2007 18 23
2008 29 22
2009 51 33
2010 68 29
During the whole period of observation, 2006–2010, the ration of genders was not stable, but two thirds of all revised patients were female.
Chart 84. Revision TKA – gender distribution
Types of fixation of revised TKAs In 2006, all revisions were performed on cement-ed primary TKAs. Due to the increase in uncemented and hybrid types of fixation in 2010, 91.75% of all performed revisions were per-formed on cemented primary TKAs, 6.18% on uncemented and 2.06% on hybrids. Tab. 65 and Chart 69 show the types of fixation of revised TKAs. Tab. 65. Revision TKA – types of fixation of revised TKAs
Year Cement Non-cement Hybrid
2006 20 0 0
2007 38 2 1
2008 49 2 0
2009 82 2 0
2010 89 6 2
Chart 85. Revision TKA – types of fixation of revised TKAs
Age groups In 2006, the age group less than 55 years consti-tuted 10.00% of all revised patients. The age groups 55–64 was 60.00% and the age groups 65–75 and over 75 each accounted for 15.00% of all revised patients. The situation in 2010 was different, insomuch as 6.10% of revision TKAs were under 55 and the age group 55–64 repre-sented 37.11%, the age group 65–74 39.17% and over 75 17.52% of all revised patients. In 2010, the distribution through the age groups was more equal and the middle age groups are more presented. Tab. 66 presents the age group distri-bution. Due to low numbers of cases, any attempt at interpretation would speculative.
2,24 3,01
3,17 4,14
4,41
0,000,501,001,502,002,503,003,504,004,505,00
2006 2007 2008 2009 2010
0
20
40
60
80
100
2006 2007 2008 2009 2010
FemaleMale
0
20
40
60
80
100
2006 2007 2008 2009 2010
CementNon-cementHybrid
© Slovakian Arthroplasty Register 2011
© Slovakian Arthroplasty Register 2011
© Slovakian Arthroplasty Register 2011
© Slovakian Arthroplasty Register 2011
© Slovakian Arthroplasty Register 2011

56 / Acta Chir. orthop. Traum. čech., 78, 2011 Supplementum
Review of the annual report of the Slovakian Arthroplasty Register – 2010
Tab. 66. Revision TKA – age groups Y
ear
45-4
9
50-5
4
55-5
9
60-6
4
65-6
9
70-7
4
75-7
9
80-8
4
2006 0 1 3 9 2 1 3 0
2007 1 1 4 14 10 8 3 0
2008 1 0 9 5 12 12 9 2
2009 3 4 10 20 18 16 11 1
2010 3 2 12 24 27 11 13 4
Reasons for the revision The revision TKA protocol has the same features as the THA protocol. There is a multiple choice option for the diagnoses leading to revision and total number of diagnoses doesn´t correspond to the total number of revisions. The most common reason for the revision in 2010 was chronic infec-
Tab. 67. Revision TKA – reasons for revision
Year
Ear
ly In
fect
ion
Chr
onic
Infe
ctio
n
Ase
ptic
Loo
seni
ng o
f Fe
mor
al C
ompo
nent
Ase
ptic
Loo
seni
ng o
f Ti
bial
Com
pone
nt
Ase
ptic
Loo
seni
ng o
f P
atel
lar C
ompo
nent
Pat
ella
r Pai
n
Per
ipro
sthe
sis
Frac
ture
Col
ater
al L
igam
ents
In
stab
ility
Inst
abili
ty o
f PC
L
Luxa
tion
Pol
yeth
ylen
e W
ear
Frac
ture
of I
mpl
ant
Stif
ness
Mal
posi
tion
Kne
e P
ain
With
out
Loos
enin
g
Spa
cer t
o TK
A
Oth
er
2006 4 3 3 10 1 0 1 2 0 0 1 1 0 1 1 0 0
2007 4 11 10 12 1 2 1 7 1 1 2 0 2 1 3 1 3
2008 6 17 11 19 0 0 1 1 1 1 3 1 3 1 1 0 6
2009 7 28 22 30 1 0 0 3 2 1 3 4 1 1 2 2 4
2010 3 33 20 26 0 4 1 2 1 0 3 5 1 1 3 21 4
Chart 86. Revision TKA – reasons for revision
tion, constituting 25.78% of all diagnoses. By contrast, acute infection was the diagnosis in 2.34%. Aseptic loosening of femoral component was mentioned in 15.62% of all cases and asep-tic loosening of tibial component in 20.31% of all diagnoses. Chart 70 shows four most common reasons for revision TKA. During 2009, a new reason for revision – conversion from spacer to TKA – was introduced. In 2010 this reason achieved 16.40%. Two-step revision is clearly method of choice in a growing number of units.
Revised elements implants Tab. 68. Revision TKA – revised elements of implants
Year Soft Tissue Revision
Whole System
Femoral Component
Tibial Component Patella Inlay Explantation Spacer Other
2006 1 14 0 1 0 1 3 0 0
2007 2 24 1 2 0 5 4 1 2
2008 3 33 0 4 1 1 5 3 0
2009 0 51 1 5 0 4 2 19 0
2010 2 63 2 4 1 6 0 16 1
In revision TKA the implants and their compo-nents are considered – this additionally includes the soft tissues, hence the use of the wider term “elements”. Revision protocol has nine options for the revised elements. In 2010, the whole system was revised in 66.31% of all revisions. Isolated revision of femoral component was undertaken in only two patients (2.06%) and isolated revision of
the tibial component was in only four patients (4.21% of all cases). An insert was exchanged in four patients, also 4.21%. Two-staged revision – conversion from spacer to TKA – was performed in 16.84%.In comparison, whole system revision in 2006 represented two thirds of all revisions (70.00%) and the decrease was minimal.
0
20
40
60
80
100
120
2006 2007 2008 2009 2010
Chronic InfectionAs. Loos. of Fem. C.As. Loos. of Tib. C.Spacer to TKA
© Slovakian Arthroplasty Register 2011
© Slovakian Arthroplasty Register 2011
© Slovakian Arthroplasty Register 2011
© Slovakian Arthroplasty Register 2011

57 / Acta Chir. orthop. Traum. čech., 78, 2011 Supplementum
Review of the annual report of the Slovakian Arthroplasty Register – 2010
Antibiotic prophylaxis in primary and revision TKA Tab. 69. Antibiotic prophylaxis in primary and revision TKAs
ATB
bra
nd
Vul
miz
olin
Axe
tine
Una
syn
Clim
icin
Bita
mon
Am
oksi
-kl
av
Cip
hin
Zina
cef
Cef
alot
in
Xor
im
Kef
zol
Edi
cin
Aug
men
tin
Lend
acín
Aba
ktal
Dal
acin
Primary TKA 1 145 440 167 138 88 26 17 36 37 30 0 2 9 0 17 10
Revision TKA 47 5 6 5 8 0 0 0 0 0 0 11 1 0 1 0
In 2010, antibiotic prophylaxis was used in 99.86% of primary TKAs and paradoxically only in 96.90% of revision TKAs. Vulmizolin was the most-used brand of antibiotic and was adminis-tered in 52.16% of all primary TKAs. The second
commonest was Axetine in 20.04% of all cases. In the revision TKA Vulmizolin was also the most-used brand of antibiotic (50.00% of all cases). The second commonest was Edicin in 11.70% of all cases. .
© Slovakian Arthroplasty Register 2011
58 / Acta Chir. orthop. Traum. čech., 78, 2011 Supplementum
Review of the annual report of the Slovakian Arthroplasty Register – 2010
Glossary Arthroplasty – surgical exchange of all or part of any joint of human body with an artificial joint replacement
Bipolar hemiarthroplasty – partial joint replace-ment with head-neck articulation
CAC – cemented acetabular cup
CCEP – cervicocapital endoprosthesis
CCK (condylar constrained knee) – total knee joint replacement with increased constrain
Censoring time – time point when the follow-up is terminated (here December 31st, 2010); im-plant/component was censored if it did not fail by this time point
CFS – cemented femoral stem
Cohort – group having one or more similar char-acteristics and monitored during the study period
Component – part of the implant
CR implant (cruciate retaining) – total knee joint replacement allowing retention of the poste-rior cruciate ligament
Crude (specific) incidence (implant-time or component-time incidence) – the ratio of the number of new revisions divided by total time-at-risk (sum of all component-years/implant-years) throughout the follow up period
Cumulative revision rate (CRR) – rate of re-vised implants/components divided by total num-ber of implants/components × 100, calculated for following time periods: 2003, 2003–2004, 2003–2010
Demographic analysis – methods for observing and interpreting the state and movement of a population
Demographic characteristics – numerical char-acteristics of the state and movement of a popu-lation
Empirical survival function – rate of surviving implants/components and total number of im-plants/components, where censored observa-tions are calculated as failures
Expected value (mean) – weighted arithmetic average of all possible values of a random varia-ble; its estimate is called arithmetic average and is calculated from a random sample
Hazard Rate (HR) – rate of RR (q.v.) of any component (component combination or group of components) and RR of a reference group, where the reference group is always the group hierarchically superior to it, e.g. for acetabular and femoral components, the whole database
Hemiartroplasty – partial joint replacement
Significance level – the probability, fixed ahead of testing of statistical hypotheses; upper bound-ary of null hypothesis rejection (e.g., equal to 0.05 or 0.1)
Hinge implant – total knee joint replacement with constrained hinge articulation
Implant – any surgically implanted device: here a joint replacement component, or components of the hip, or knee
Implant-year, or component-year – time inter-val when implant/component had been at risk (of revision); it is number of days from primary oper-ation to the first revision, death or termination of the study divided by 365.25
Incidence THA/TKA – the frequency of primary THP/TKA per 100,000 inhabitants with which new revisions appear within a particular time period
Kaplan-Meier survival curve – non-increasing step function of probability of survival, with jumps in observed event times; its length is positively correlated with the length of time-intervals to failure, or censorship
Median survival – the time at which half of the implants/components fail
Mean age – weighted arithmetic average of number of years of a random sample survived up to a time point
Mean survival – generalized mean for censored data; the volume under the K-M survival curve calculated using survived, censored and failed observations

59 / Acta Chir. orthop. Traum. čech., 78, 2011 Supplementum
Review of the annual report of the Slovakian Arthroplasty Register – 2010
Monocondylar knee replacement – hemiarthro-plasty of the knee joint
Null hypothesis – the statement in the form of a hypothesis about the equality of an unknown parameter and some constant, the validity of which is tested by statistical testing; in our case, the parameter is the difference of expected (mean) survival times of two groups and the con-stant is zero; we are testing if the difference of expected survival times is equal to zero
P-value – minimal significance level at which the null hypothesis can be rejected; if p-value is smaller than significance level the null hypothesis is rejected; smaller p-value refers to a greater evidence about null hypothesis rejection
Population – is a set of organisms in which any pair of members can breed together. This implies that all members belong to the same species.
Population prognosis – a scientific calculation of how many people, in which age and gender structure, will be living in a country, or in a town, at some point in the future
Probability of survival – empirical probability of survival at time t adjusted for censoring; ratio of survived implants/components at time t and number of implants/components at risk in an infinitely small time period before time t, where the number of survived implants/components at time t is equal to the difference of number of im-plants/components at risk in an infinitely small time period before time t and the number of failed implants/components in an infinitely small time period before time t
Prevalency – see Revision Rate
Primary implantation – first surgical procedure when total- or hemi-artroplasty was implanted
PS implant (posterior stabilised) – total knee joint replacement with sacrificing the posterior cruciate ligament PCL
Rate – is a ratio that compares two quantities of different units in the time.
Revision Rate (RR) – rate of revision surgery in a defined follow up period – number of revisions
divided by total number of primary arthroplasties included in the evaluation sample × 100
Revision Burden (RB) – ratio between primary and revision surgery – the number of revisions in a time period divided by the number of all arthro-plasties (primary and revision) in the same period
Revision surgery of soft tissue – any surgery after the primary implantation where only soft tissues are revised
Standardisation – technique of adjustment for confounding variables, e.g., age, sex, etc.
Survival Rate (SR) – rate of survived compo-nents at a defined follow up time – the number of survived components divided by the total number of primary arthroplasties included in the sample ×100, SR = 100 – RR
Testing of statistical hypotheses – testing of the validity of a null hypothesis, where this hy-pothesis is rejected, or not; if the null hypothesis is not rejected, there is not enough statistical evidence in the data for rejection
THA – total hip arthroplasty
TKA – total knee arthroplasty
Total implant-time, or component-time – sum of all implant-times, or component-times (implant-years, or component-years) characterising total follow-up time; the number of implants /components with a follow-up time equal to one year (the unit of implant-years, or component-years)
UAC – uncemented acetabular cup
UFS – uncemented femoral stem
95% confidence interval (CI) for mean survival time – expected value of mean survival time of implant/component group fails to this interval with 95% confidence
95% CI for K-M survival curve – expected K-M curve of implant/component group fails to this interval with 95% confidence
