review of the factors affecting the solar energy yield in
TRANSCRIPT
The Egyptian International Journal of Engineering Sciences and Technology
Vol. 29 (2020) 51–60
http://www.eijest.zu.edu.eg
* Corresponding author. Tel.: +2-012-8540-8744 E-mail address: [email protected]
51
Review of the Factors Affecting the Solar Energy Yield in Egypt Hala A. Abdulhadya*, Hamid M. Metwallyb and Tarek A. Abdul fattahc
a, bElect. Power Eng. Dept , Zagazig Univ., Egypt cPhysics& Mathematics Eng. Dept., Zagazig Univ., Egypt
A R T I C L E I N F O A B S T R A C T Article history: Received 06 May 2018 Received in revised form 20 November 2019 Accepted 24 November 2019 Available online 30 November 2019
The output power generated by a PV module and its life span depend on many factors. Some of these factors include: the quality of PV type, solar radiation intensity, ambient temperature, shading effects, dust accumulation, weather conditions, geographical location etc. This paper reviews the major factors that significantly affect the performance of solar PV systems and discussed the distortion of I-V and P-V characteristics due to the effect of partial shading. Calculation of inter-row spacing between PV modules in case of 60 cells and 72 cells for minimizing shading effects by using Matlab program is presented. Dust effect study is performed on the output power of an installed system in Borj-El arab city during January and March and finally presents a comparison study between the same PV system installed in Borj-El arab city and Tiba city to report which is more efficient in energy production.
Keywords: 1st solar energy 2nd partial shading 3rd inter-row shading
1. Introduction
The use and importance of renewable sources of energy are growing rapidly. This trend has been driven by the growth in the price of fossil fuels and its passive effect on the environment and concerns about air quality and human health. Photovoltaic technology could offer a capable and clean alternative to fossil-fuel-based energy generation. Egypt aims to supply 20 % of generated electricity from renewable sources by 2022, with wind providing 12 %, Hydro power 6% and Solar 2 %. The Egyptian government has recently announced their renewable energy plan for 2035 to include an addition of 67 GW that is about 42 % of total generated electricity, of which 31 GW comes from PV, and 20 GW from wind. The solar energy plan aims to install 3.5 GW by 2027 including 2.8 GW of PV and 700 MW of CSP (concentrated solar power) [1]. Advantages of the renewable energy is that it
is eco-friendly which makes it not harmful to our environment. It is plentiful and is a natural form of resource. Regardless of the development of new higher-performance materials, the greatest disadvantage of photovoltaic systems remains their limited efficiency in converting solar to electrical energy, which ranges between 12% and 20% [2]. The degradation of PV system performance is mainly due to several factors such as climate and environmental conditions, the site at which it is installed and the maintenance. Although significant advances have been made in PV systems within the last few decades, designers still face challenges related to the effects of climate conditions on PV system performance. In practice, PV module performance is much lower when operating outdoors than under controlled laboratory conditions [3, 4].
Hala A. Abdulhady, et. al / Review of the Factors Affecting the Solar Energy Yield in Egypt
52
2. Solar Atlas of Egypt
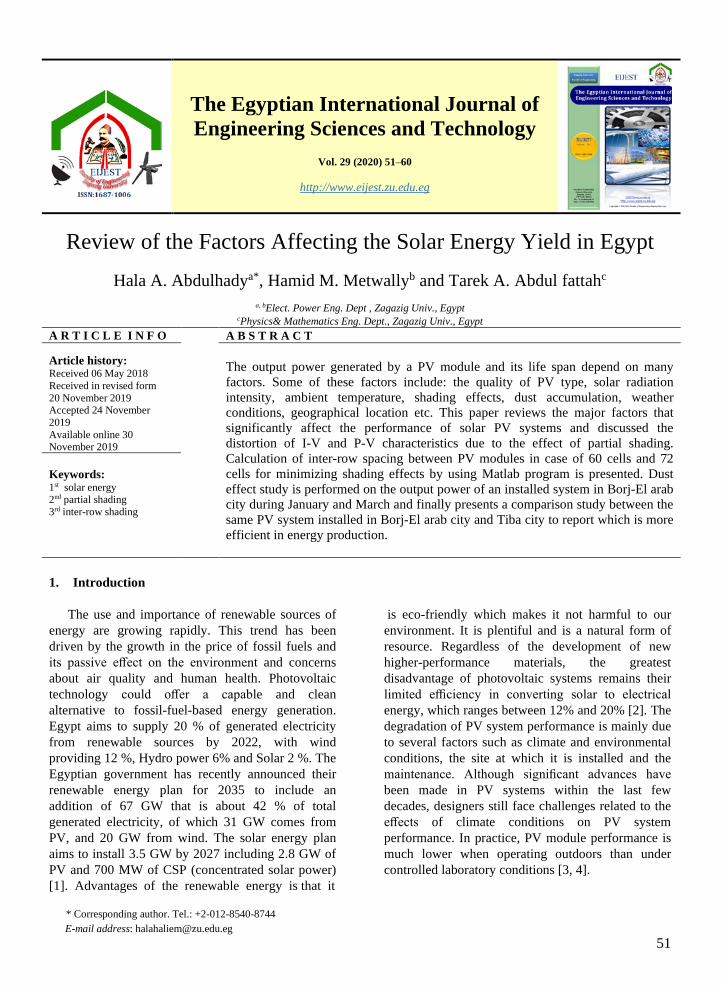
Fig. 1: Classification of solar radiation in Egypt [5].
The solar Atlas presented in Fig. (1), issued in 1996, indicates that Egypt as one of the sun belt countries is endowed with high intensity of direct solar radiation ranging between 2000 – 3200 kWh / m2 / year from North to South. The sun shine duration ranges from 9 – 11 hours with few cloudy days all over the year.
3. Factors affecting performance of PV systems
The performance of PV module is affected by many factors. Some of these factors are related to the module itself and others are related to the location and environment like material degradation, solar irradiance, module temperature, parasitic resistances, fill-factor, shading, soiling, tilt-angle etc. [6].
3.1 Degradation of PV Module
Manufacturers of solar PV systems usually guarantee the performance life of 25 years for the modules to generate at least 90% of rated capacity in the first 10 years and around 80% in the following 10-15 years. Solar PV panels usually degrade at a faster rate in the first few years of their life at about 0.5% per year from their rated output power of solar module. The degradation process that is may be chemical, electrical and thermal or mechanical in nature is faster in thin-film PV modules (a-Si, CdTe and CIGS) than Si crystalline based modules [7]. The average yearly output loss in various PV module technologies, which were manufactured after year 2000 is shown in Table 1. In most cases, module failures and performance losses are due to gradual accumulated harms resulting from long-term outdoor exposure in severe environments. Table 1. An average Output Loss of PV Module per year [7].
3.2 Variation of Solar Radiation
The performance of PV modules under varying radiation intensity falling on a PV module will be affected significantly, which in turn has a severe impact on the production of PV systems it affect many of its parameters, including Isc, Voc, power and efficiency. By using Matlab program, the
PV Module Type Output Loss (%/year)
Monocrystalline Silicon 0.36
Cadmium Telluride (CdTe) 0.4
Polycrystalline Silicon (poly-Si)
Amorphous Silicon (a-Si)
Copper Indium Gallium Selenide (CIGS)
0.64
0.87
0.96
Nomenclature PV photovoltaic CSP concentrated solar power Isc short circuit current Voc open circuit voltage IPH light-generated current IS cell saturation of dark current q electron charge k Boltzmann’s constant TC cell’s working temperature A ideal factor, RSH shunt resistance RS series resistance Ki cell’s short-circuit current temperatur coefficient TRef cell’s reference temperature λ solar insolation in kW/m2. IRS cell’s reverse saturation current Eg bang-gap energy of the semiconductor used in the cell PSSH peak sun shine hours Lpv length of PV array
EIJEST Vol. 29 (2020) 51–60
53
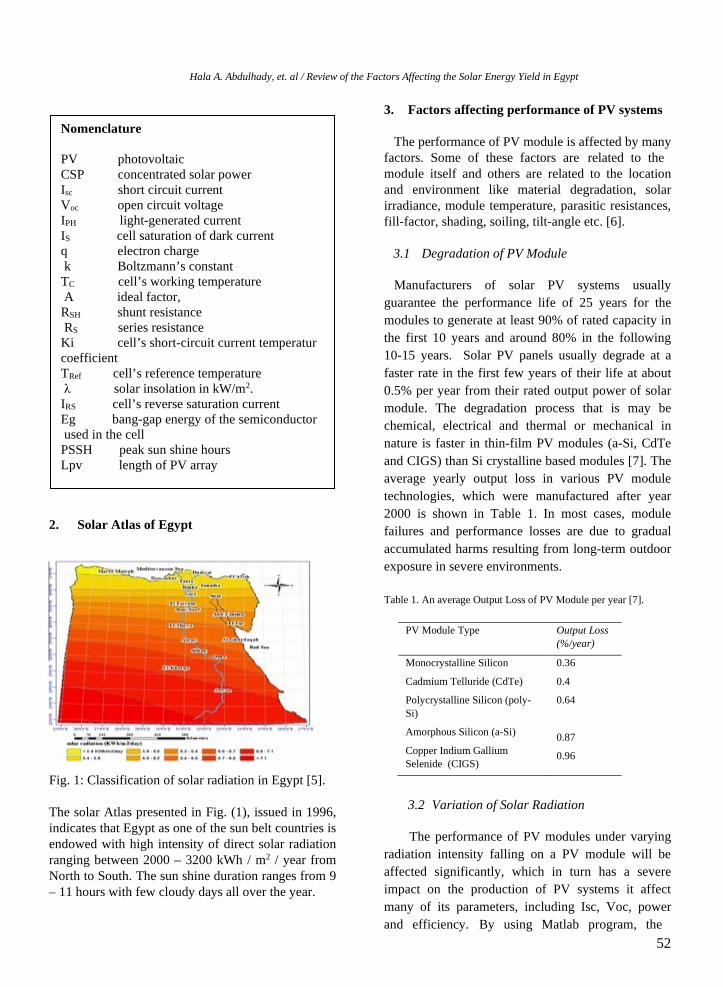
mathematical equations )4-1 ( have been applied in m-file with the values of a 250 wp PV module and constant temperature (25 ◦c) to generate the graphs shown in Figures (2-3)[8].
𝐼𝐼 = 𝐼𝐼𝑃𝑃𝑃𝑃– 𝐼𝐼𝑆𝑆 �𝑒𝑒𝑉𝑉 + 𝐼𝐼𝑅𝑅𝑆𝑆𝐴𝐴𝐴𝐴𝑇𝑇𝐶𝐶/𝑞𝑞 − 1� −
𝑉𝑉 + 𝐼𝐼𝑅𝑅𝑆𝑆𝑅𝑅𝑆𝑆𝑃𝑃
(1)
𝐼𝐼𝑃𝑃𝑃𝑃 = �𝐼𝐼𝑆𝑆𝑆𝑆 + 𝐾𝐾𝑖𝑖 �𝑇𝑇𝑆𝑆 − 𝑇𝑇𝑅𝑅𝑅𝑅𝑅𝑅��λ (2)
𝐼𝐼𝑠𝑠 = 𝐼𝐼𝑅𝑅𝑆𝑆 �𝑇𝑇𝑆𝑆𝑇𝑇𝑅𝑅𝑅𝑅𝑅𝑅
�3
⎣⎢⎢⎡𝑒𝑒𝑞𝑞𝐸𝐸𝑔𝑔�
1𝑇𝑇𝑅𝑅𝑅𝑅𝑅𝑅
− 1𝑇𝑇𝐶𝐶�
𝐾𝐾𝐾𝐾⎦⎥⎥⎤ (3)
𝐼𝐼𝑅𝑅𝑆𝑆 =𝐼𝐼𝑆𝑆𝑆𝑆
[𝑒𝑒𝑞𝑞 𝑉𝑉𝑜𝑜𝑜𝑜
𝑁𝑁𝑆𝑆𝐾𝐾𝐴𝐴𝑇𝑇𝐶𝐶 − 1] (4)
Fig. 2: Effects of irradiance variations on the current
of a 250 W PV module.
Fig. 3: Effects of irradiance variations on the output power of a 250 W PV module.
3.3 Module Temperature
PV module is very sensitive to temperature. The efficiency and power output of a PV module reduces with the increase of its temperature, this is essentially due to the increase in internal carrier recombination
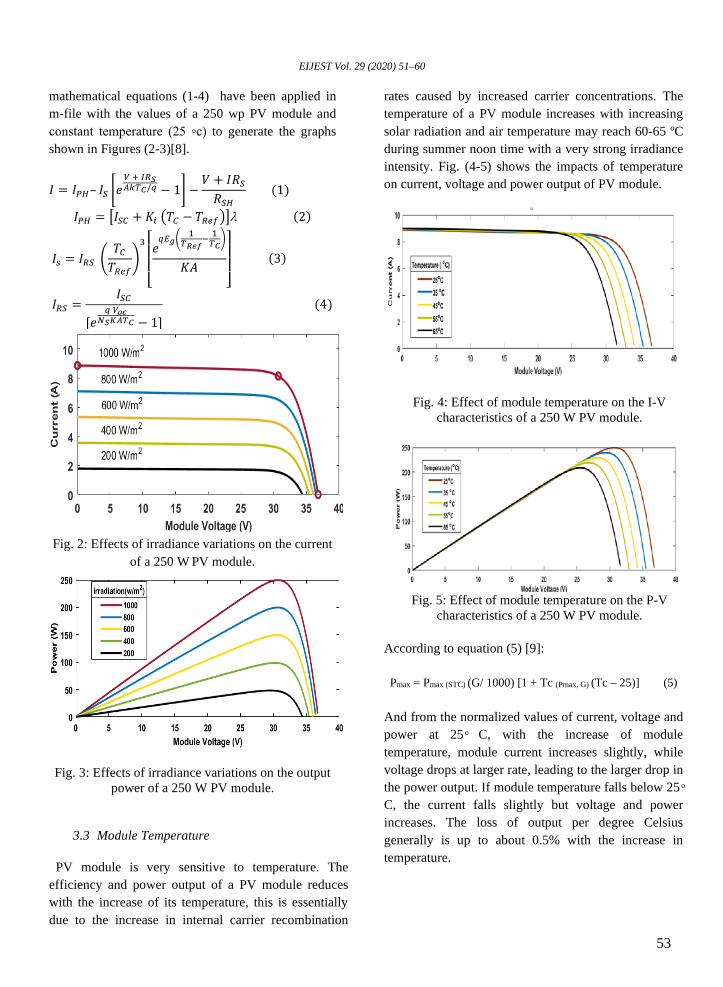
rates caused by increased carrier concentrations. The temperature of a PV module increases with increasing solar radiation and air temperature may reach 60-65 ºC during summer noon time with a very strong irradiance intensity. Fig. (4-5) shows the impacts of temperature on current, voltage and power output of PV module.
Fig. 4: Effect of module temperature on the I-V characteristics of a 250 W PV module.
Fig. 5: Effect of module temperature on the P-V
characteristics of a 250 W PV module. According to equation (5) [9]: Pmax = Pmax (STC) (G/ 1000) [1 + Tc (Pmax, G) (Tc – 25)] (5)
And from the normalized values of current, voltage and power at 25 ͦ C, with the increase of module temperature, module current increases slightly, while voltage drops at larger rate, leading to the larger drop in the power output. If module temperature falls below 25 ͦC, the current falls slightly but voltage and power increases. The loss of output per degree Celsius generally is up to about 0.5% with the increase in temperature.
Hala A. Abdulhady, et. al / Review of the Factors Affecting the Solar Energy Yield in Egypt
54
Fig. 6: Effects of temperature on a PV module performance.
The voltage Voc decreases by about 0.1 to 0.3 V for each degree K rise in temperature and current Isc increases by about 2.3 to 4 mA/K. With increase in module temperature so, the reduction in voltage is more than the similar increase in current. The whole effect is a reduction in the power output at a rate of about 0.4 to 0.5% per degree rise in temperature as shown in Fig. 6.
3.4 Shading Effect
The shading is the most effective parameter on the PV module efficiency. The amount of energy production is reduced by the different solar irradiance levels which are variable all daytime due to partial shading caused by the sun position displacement in the sky, trees or passing clouds [10] or self- shading that is caused by the PV system installation as the inter-row shading between solar arrays [11].
3.4.1. Partial Shading
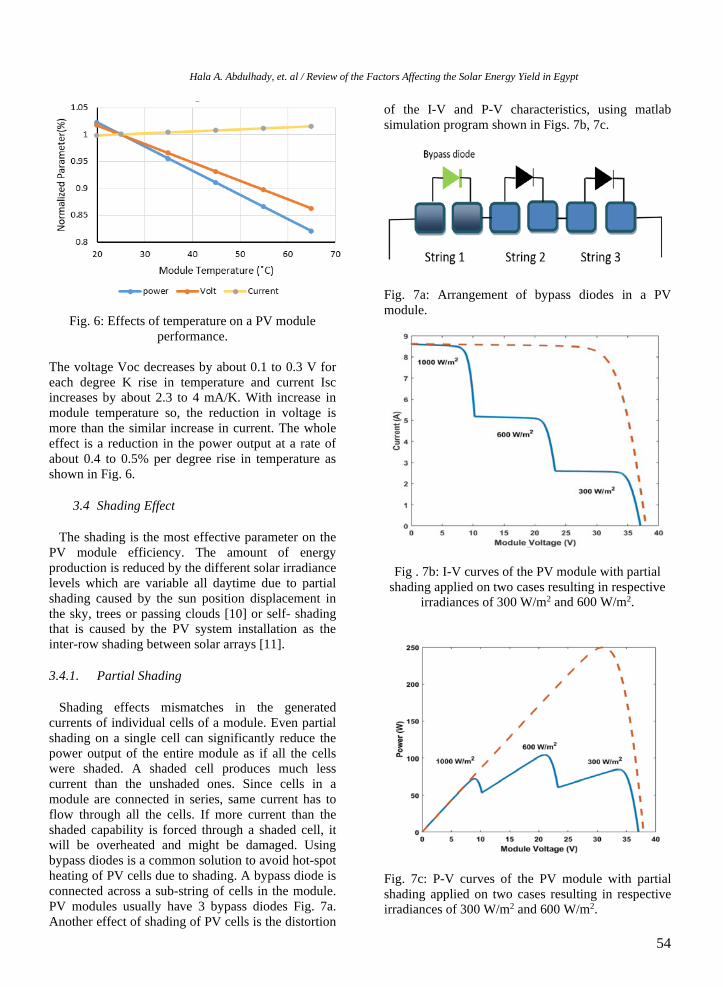
Shading effects mismatches in the generated currents of individual cells of a module. Even partial shading on a single cell can significantly reduce the power output of the entire module as if all the cells were shaded. A shaded cell produces much less current than the unshaded ones. Since cells in a module are connected in series, same current has to flow through all the cells. If more current than the shaded capability is forced through a shaded cell, it will be overheated and might be damaged. Using bypass diodes is a common solution to avoid hot-spot heating of PV cells due to shading. A bypass diode is connected across a sub-string of cells in the module. PV modules usually have 3 bypass diodes Fig. 7a. Another effect of shading of PV cells is the distortion
of the I-V and P-V characteristics, using matlab simulation program shown in Figs. 7b, 7c.
Fig. 7a: Arrangement of bypass diodes in a PV module.
Fig . 7b: I-V curves of the PV module with partial shading applied on two cases resulting in respective
irradiances of 300 W/m2 and 600 W/m2.
Fig. 7c: P-V curves of the PV module with partial shading applied on two cases resulting in respective irradiances of 300 W/m2 and 600 W/m2.
EIJEST Vol. 29 (2020) 51–60
55
There are more studies to analyse the different effects of partial shading on the performance of the PV system and power losses, kawamura et al. [12] performed a simulation on PV power generation system considering the change of I-V characteristics and studied the relation between the output reductions due to shaded PV cells. The results indicated that the change of I-V characteristics is very little. Picault et al. [13] presented a new method to forecast PV array production in different environmental conditions including mismatch losses for reducing PV losses and proposed a new experimental work to modify the module interconnection arrangement for raising the maximum power output by up to 4%. Dolara et al. [14] and Mahamed et al. [15] performed an experimental work on polycrystalline and monocrystalline photovoltaic panels to study the effect of partial shading including measuring the I-V and P-V curves of PV panels. The results proved that I-V and P-V values are decreased by increasing shading ratio on PV panels. Shaiek et al. [16] studied the effect of shading, solar radiation and temperature on the P–V and I–V characteristics of PV systems and presented that the Perturb and Observe (P&O) and Incremental Conductance (IncCond) algorithms are proper to control MPPT of PV systems in the case of PV arrays are totally sunny but under partially shaded, they found that genetic algorithm approach extract the global maximum of a PV. Also Salem [17] performed artificial neural networks (ANN) methodology which proved its efficiency for detection and valuation of partial shading conditions in PV arrays. Rodrigo et al. [18] studied the variation of I-V curve of PV panels according to shading ratio using two high concentrator photovoltaic panels which have been measured under the different shading conditions and the I-V curves obtained have been compared then calculated. The results showed that root men squared errors for the I-V curves is lower than %4.
3.4.2. Inter-row shading
Inter-row shading, well-known as self-shading, occurs on each rearward row and can deeply limit power production. Self-shading is of particular importance because it is taken as design consideration in the layout of arrays. Current techniques to lessen self-shading include increasing the spacing between adjacent rows or lowering the row’s tilt angle (α). Deline [11] presented a novel investigative approximation of the effect of inter-row shading on large photovoltaic
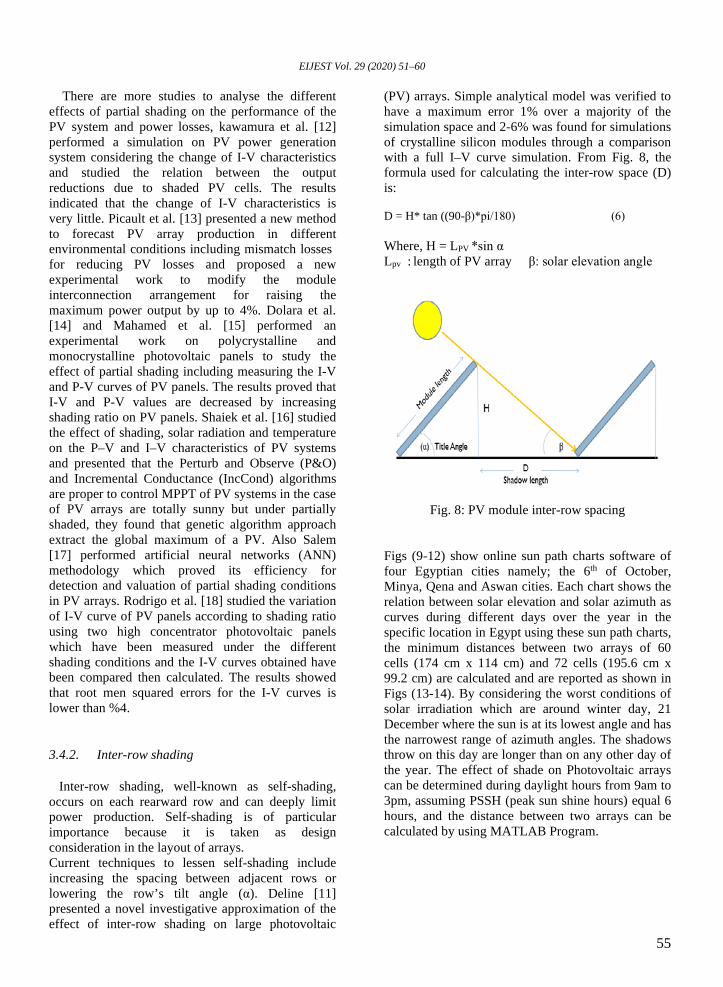
(PV) arrays. Simple analytical model was verified to have a maximum error 1% over a majority of the simulation space and 2-6% was found for simulations of crystalline silicon modules through a comparison with a full I–V curve simulation. From Fig. 8, the formula used for calculating the inter-row space (D) is: D = H* tan ((90-β)*pi/180) (6) Where, H = LPV *sin α Lpv : length of PV array β: solar elevation angle
Fig. 8: PV module inter-row spacing
Figs (9-12) show online sun path charts software of four Egyptian cities namely; the 6th of October, Minya, Qena and Aswan cities. Each chart shows the relation between solar elevation and solar azimuth as curves during different days over the year in the specific location in Egypt using these sun path charts, the minimum distances between two arrays of 60 cells (174 cm x 114 cm) and 72 cells (195.6 cm x 99.2 cm) are calculated and are reported as shown in Figs (13-14). By considering the worst conditions of solar irradiation which are around winter day, 21 December where the sun is at its lowest angle and has the narrowest range of azimuth angles. The shadows throw on this day are longer than on any other day of the year. The effect of shade on Photovoltaic arrays can be determined during daylight hours from 9am to 3pm, assuming PSSH (peak sun shine hours) equal 6 hours, and the distance between two arrays can be calculated by using MATLAB Program.

Hala A. Abdulhady, et. al / Review of the Factors Affecting the Solar Energy Yield in Egypt
56
Fig. 9: Sun path chart of 6th October city.
Fig. 10: Sun path chart of Menia city.
Fig. 11: Sun path chart of Qena city.
Fig. 12: Sun path chart of Aswan city.
Fig. 13: The inter-row distance for different selected locations for photovoltaic module with 60 cells.
Fig. 14: The inter-row distance for different selected locations for photovoltaic module with 72 cells.
Figs (13, 14) show the inter-row distance required at different locations and different times during the day. It is clear that the effect of shading between
EIJEST Vol. 29 (2020) 51–60
57
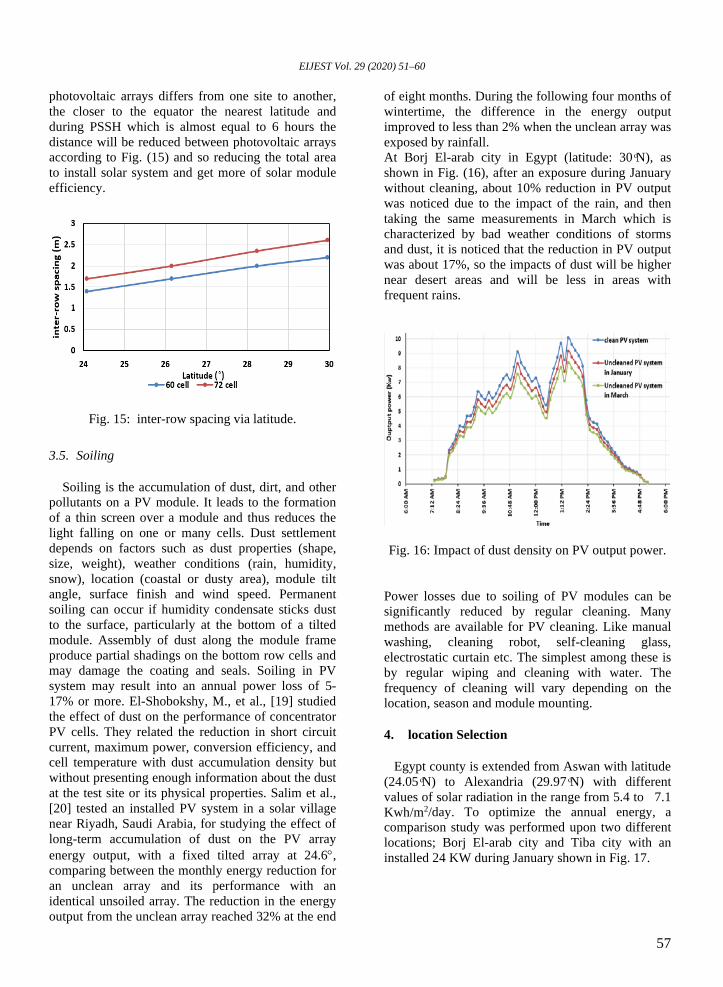
photovoltaic arrays differs from one site to another, the closer to the equator the nearest latitude and during PSSH which is almost equal to 6 hours the distance will be reduced between photovoltaic arrays according to Fig. (15) and so reducing the total area to install solar system and get more of solar module efficiency.
Fig. 15: inter-row spacing via latitude.
3.5. Soiling
Soiling is the accumulation of dust, dirt, and other pollutants on a PV module. It leads to the formation of a thin screen over a module and thus reduces the light falling on one or many cells. Dust settlement depends on factors such as dust properties (shape, size, weight), weather conditions (rain, humidity, snow), location (coastal or dusty area), module tilt angle, surface finish and wind speed. Permanent soiling can occur if humidity condensate sticks dust to the surface, particularly at the bottom of a tilted module. Assembly of dust along the module frame produce partial shadings on the bottom row cells and may damage the coating and seals. Soiling in PV system may result into an annual power loss of 5-17% or more. El-Shobokshy, M., et al., [19] studied the effect of dust on the performance of concentrator PV cells. They related the reduction in short circuit current, maximum power, conversion efficiency, and cell temperature with dust accumulation density but without presenting enough information about the dust at the test site or its physical properties. Salim et al., [20] tested an installed PV system in a solar village near Riyadh, Saudi Arabia, for studying the effect of long-term accumulation of dust on the PV array energy output, with a fixed tilted array at 24.6°, comparing between the monthly energy reduction for an unclean array and its performance with an identical unsoiled array. The reduction in the energy output from the unclean array reached 32% at the end
of eight months. During the following four months of wintertime, the difference in the energy output improved to less than 2% when the unclean array was exposed by rainfall. At Borj El-arab city in Egypt (latitude: 30 ͦN), as shown in Fig. (16), after an exposure during January without cleaning, about 10% reduction in PV output was noticed due to the impact of the rain, and then taking the same measurements in March which is characterized by bad weather conditions of storms and dust, it is noticed that the reduction in PV output was about 17%, so the impacts of dust will be higher near desert areas and will be less in areas with frequent rains.
Fig. 16: Impact of dust density on PV output power.
Power losses due to soiling of PV modules can be significantly reduced by regular cleaning. Many methods are available for PV cleaning. Like manual washing, cleaning robot, self-cleaning glass, electrostatic curtain etc. The simplest among these is by regular wiping and cleaning with water. The frequency of cleaning will vary depending on the location, season and module mounting.
4. location Selection
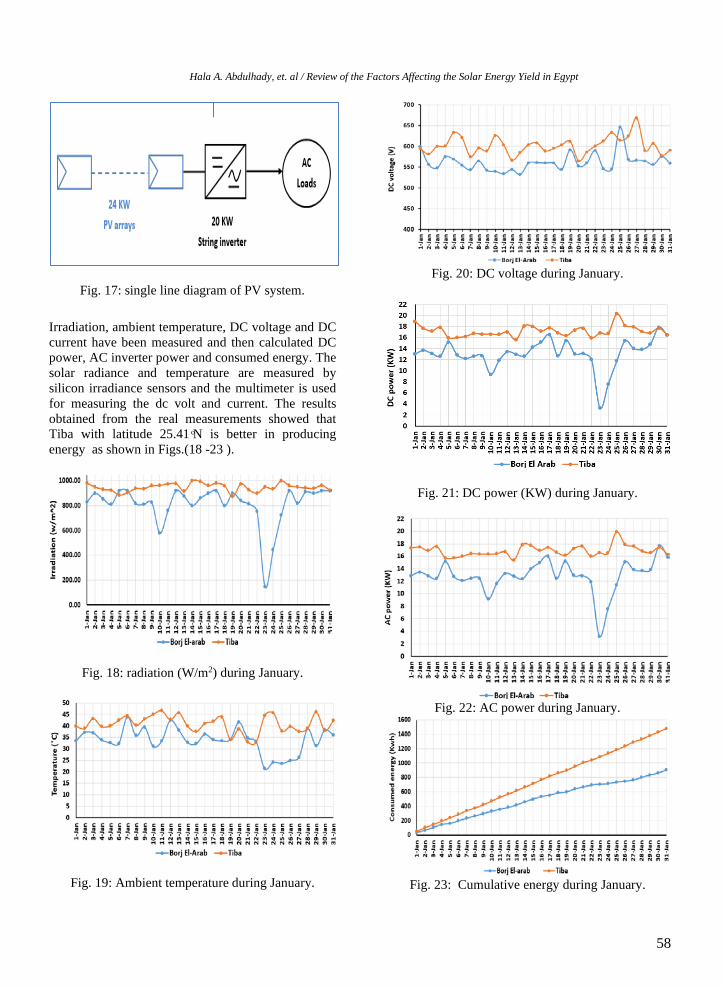
Egypt county is extended from Aswan with latitude (24.05 Nͦ) to Alexandria (29.97 Nͦ) with different values of solar radiation in the range from 5.4 to 7.1 Kwh/m2/day. To optimize the annual energy, a comparison study was performed upon two different locations; Borj El-arab city and Tiba city with an installed 24 KW during January shown in Fig. 17.
Hala A. Abdulhady, et. al / Review of the Factors Affecting the Solar Energy Yield in Egypt
58
Fig. 17: single line diagram of PV system.
Irradiation, ambient temperature, DC voltage and DC current have been measured and then calculated DC power, AC inverter power and consumed energy. The solar radiance and temperature are measured by silicon irradiance sensors and the multimeter is used for measuring the dc volt and current. The results obtained from the real measurements showed that Tiba with latitude 25.41 ͦN is better in producing energy as shown in Figs.(18 -23 ).
Fig. 18: radiation (W/m2) during January.
Fig. 19: Ambient temperature during January.
Fig. 20: DC voltage during January.
Fig. 21: DC power (KW) during January.
Fig. 22: AC power during January.
Fig. 23: Cumulative energy during January.
EIJEST Vol. 29 (2020) 51–60
59
5. Conclusion
Egypt is one of the shiniest countries all over the world. This could be very useful for generating electrical energy from sun. However, there are many factors affecting the performance of solar PV systems in Egypt hence affecting the amount of energy generated. One of the environmental parameters is the accumulation of dust which appear its effect according to real measurements, noticed that about 10% reduction in PV output due to the impact of the rain and about 17% reduction due to bad weather conditions of storms and dust so the impacts of dust will be higher near desert areas but will be less in areas with frequent rains. The paper also introduce model for optimizing solar systems footprint by calculating inter-row spacing between PV modules in case of 60 cells and 72 cells to minimize shading effects using Matlab program, according to this model the saving area is around 15% compared to real similar projects executed without considering model parameters. It is found that the most feasible locations with highest annual yield extends from 25 ͦN up to 28 ͦN. A comparison study was performed between two different locations; Borj El-arab city and Tiba city for optimizing the annual energy that achieved in Tiba city. The generated solar energy in Tiba city during January is more than the same installed system in Borj El-arab city by 60%.
6. Acknowledgements
Thanks to all the faculty members of the Electrical Power Engineering Department at Zagazig University for their help during performing this work.
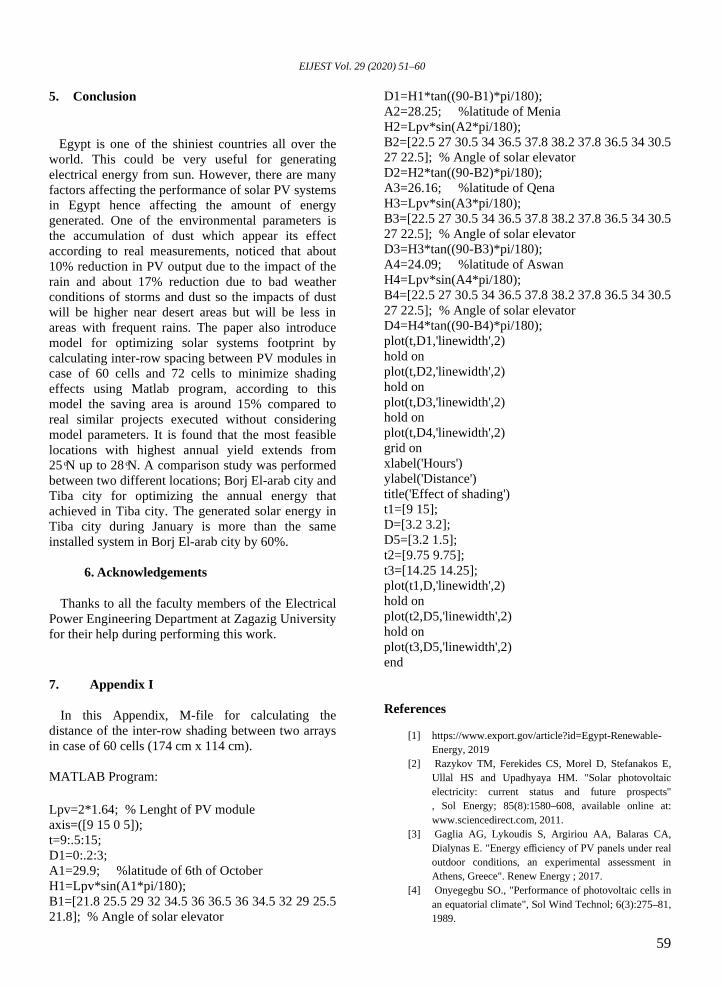
7. Appendix I
In this Appendix, M-file for calculating the distance of the inter-row shading between two arrays in case of 60 cells (174 cm x 114 cm).
MATLAB Program: Lpv=2*1.64; % Lenght of PV module axis=([9 15 0 5]); t=9:.5:15; D1=0:.2:3; A1=29.9; %latitude of 6th of October H1=Lpv*sin(A1*pi/180); B1=[21.8 25.5 29 32 34.5 36 36.5 36 34.5 32 29 25.5 21.8]; % Angle of solar elevator
D1=H1*tan((90-B1)*pi/180); A2=28.25; %latitude of Menia H2=Lpv*sin(A2*pi/180); B2=[22.5 27 30.5 34 36.5 37.8 38.2 37.8 36.5 34 30.5 27 22.5]; % Angle of solar elevator D2=H2*tan((90-B2)*pi/180); A3=26.16; %latitude of Qena H3=Lpv*sin(A3*pi/180); B3=[22.5 27 30.5 34 36.5 37.8 38.2 37.8 36.5 34 30.5 27 22.5]; % Angle of solar elevator D3=H3*tan((90-B3)*pi/180); A4=24.09; %latitude of Aswan H4=Lpv*sin(A4*pi/180); B4=[22.5 27 30.5 34 36.5 37.8 38.2 37.8 36.5 34 30.5 27 22.5]; % Angle of solar elevator D4=H4*tan((90-B4)*pi/180); plot(t,D1,'linewidth',2) hold on plot(t,D2,'linewidth',2) hold on plot(t,D3,'linewidth',2) hold on plot(t,D4,'linewidth',2) grid on xlabel('Hours') ylabel('Distance') title('Effect of shading') t1=[9 15]; D=[3.2 3.2]; D5=[3.2 1.5]; t2=[9.75 9.75]; t3=[14.25 14.25]; plot(t1,D,'linewidth',2) hold on plot(t2,D5,'linewidth',2) hold on plot(t3,D5,'linewidth',2) end
References
[1] https://www.export.gov/article?id=Egypt-Renewable-Energy, 2019
[2] Razykov TM, Ferekides CS, Morel D, Stefanakos E, Ullal HS and Upadhyaya HM. "Solar photovoltaic electricity: current status and future prospects " , Sol Energy; 85(8):1580–608, available online at: www.sciencedirect.com, 2011.
[3] Gaglia AG, Lykoudis S, Argiriou AA, Balaras CA, Dialynas E. "Energy efficiency of PV panels under real outdoor conditions, an experimental assessment in Athens, Greece". Renew Energy ; 2017.
[4] Onyegegbu SO., "Performance of photovoltaic cells in an equatorial climate", Sol Wind Technol; 6(3):275–81, 1989.
Hala A. Abdulhady, et. al / Review of the Factors Affecting the Solar Energy Yield in Egypt
60
[5] Ministry of Transport and communication, "Climatic Atlas of Egypt", Egyptian Meteorological Authority: Ministry of Transport and communication; 1996.
[6] K V Vidyanandan and Senior Member, "An Overview of Factors Affecting the Performance of Solar PV Systems", Available from: https://www.researchgate.net/publication/319165448, 2017.
[7] D.C. Jordan and S.R. Kurtz, “Photovoltaic Degradation Rates - An Analytical Review”, Progress in Photovoltaics: Research and Applications, vol. 21, no. 1, pp. 12-29, 2013.
[8] Huan-Liang Tsai, Ci-Siang Tu, and Yi-Jie Su, “Development of Generalized Photovoltaic Model Using MATLAB/SIMULINK”, ISBN: 978-988-98671-0-2, 2008.
[9] Daniel Tudor Cotfas, Petru Adrian Cotfas, and Octavian Mihai Machidon, "Study of Temperature Coefficients for Parameters of Photovoltaic Cells", International Journal of Photoenergy, Available from: https://doi.org/10.1155/2018/59456022018, 2018
[10] Ha T Nguyen and Joshua M Pearce, "Incorporating Shading Losses in Solar Photovoltaic Potential Assessment at the Municipal Scale", Solar Energy, 86.5, 1245–60, Available from: <https://doi.org/10.1016/j.solener.2012.01.017>, 2012.
[11] Deline, C., Dobos, A., Janzou, S., Meydbray, J., Donovan, M., "A simplified model of uniform shading in large photovoltaic arrays", Sol. Energy 96, 274e282, http://dx.doi.org/10.1016/j.solener.2013.07.008
[12] Kawamura, H., Naka, K., Yonekura, N., Yamanaka, S., Kawamura, H., Ohno, H., Naito, K, "Simulation of IV characteristics of a PV module with shaded PV cells ", Elsevier Science, Sol. Energy Mater. Sol. Cell. 75, 613e621, 2003.
[13] D Picault and others, "Forecasting Photovoltaic Array Power Production Subject to Mismatch Losses", Solar Energy, Available from: <https://doi.org/10.1016/j.solener.2010.04.009>, 2010.
[14] Dolara, A., Lazaroiu, G.C., Leva, S., Manzolini, G., "Experimental investigation of partial shading scenarios on PV (photovoltaic) modules", Energy 55. Available from: http://dx.doi.org/10.1016/j.energy.2013.04.009, 2013
[15] Idriss Hadj and others, "Outdoor Study of Partial Shading Effects on Different PV Modules Technologies", Energy Procedia, 141, 81–85, Available from: <https://doi.org/10.1016/j.egypro.2017.11.016>, 2017
[16] Shaiek, Y., Smida, M.B., Sakly, A., Mimouni, M.F., "Comparison between conventional methods and GA approach for maximum power point tracking of shaded solar PV generators", Sol. Energy 90, Available from: http://dx.doi.org/10.1016/j.solener.2013.01.005, 2013
[17] Fawzan Salem and Mohamed A Awadallah, "Detection and Assessment of Partial Shading in Photovoltaic Arrays", Journal of Electrical Systems and Information
Technology, Available from: <https://doi.org/10.1016/j.jesit.2015.10.003>, 2016
[18] Rodrigo, P., Gutierrez, S., Ve lazquez, R., Fernandez, E.F., Almonacid, F., Perez Higueras, P.J., "A methodology for the electrical characterization of shaded high concentrator photovoltaic modules", Energy 89. Available from: http://dx.doi.org/10.1016/j.energy.2015.05.143, 2015
[19] El-Shobokshy, M., Mujahid, A. and Zakzouk, A., "Effects of dust on the performance of concentrator photovoltaic cells ", IEE Proceeding, Vol. 132, pp.5, 1985.
[20] Salim, A., Huraib, F. and Eugenio, N., "PV power study of system options and optimization ", Proceedings 8th European PV Solar Energy Conference, Italy, 1988.