review of the national ambient air quality standards...
TRANSCRIPT

Review of the National Ambient Air Quality Standards for Lead
Updates for Lead NAAQS Review Panel of the
Clean Air Scientific Advisory Committee
Staff from the Offices of Air and Radiation and Research and Development
U S E i t l P t ti AU.S. Environmental Protection Agency
April 10-11, 2012

Current NAAQS Review Process
Peer-reviewed scientific studies
Integrated Science Assessment: concise evaluation and synthesis of most
policy-relevant studiesP li A t
Workshop on science-
policy
Integrated Review Plan: timeline and key policy-relevant
issues and scientific
CASAC review and public comment
Policy Assessment:staff analysis of
policy options based on integration and interpretation of
i f ti i th ISA policy issues
CASAC consultationd bli t
issues and scientific questions
information in the ISA and REA
Risk/Exposure Assessment:concise quantitative assessment
focused on key results, observations and uncertaintiesand public comment
Agency decision-Interagency
observations, and uncertainties
EPA proposed
EPA final Interagency Agency decision-Public hearings
Agency decisionmaking and draft proposal notice
Interagency review
proposed decision on standards
EPA final decision on standards
Interagency review
Agency decisionmaking and draft
final notice
Public hearings and comments
on proposal
2U.S. Environmental Protection Agency4/5/2012
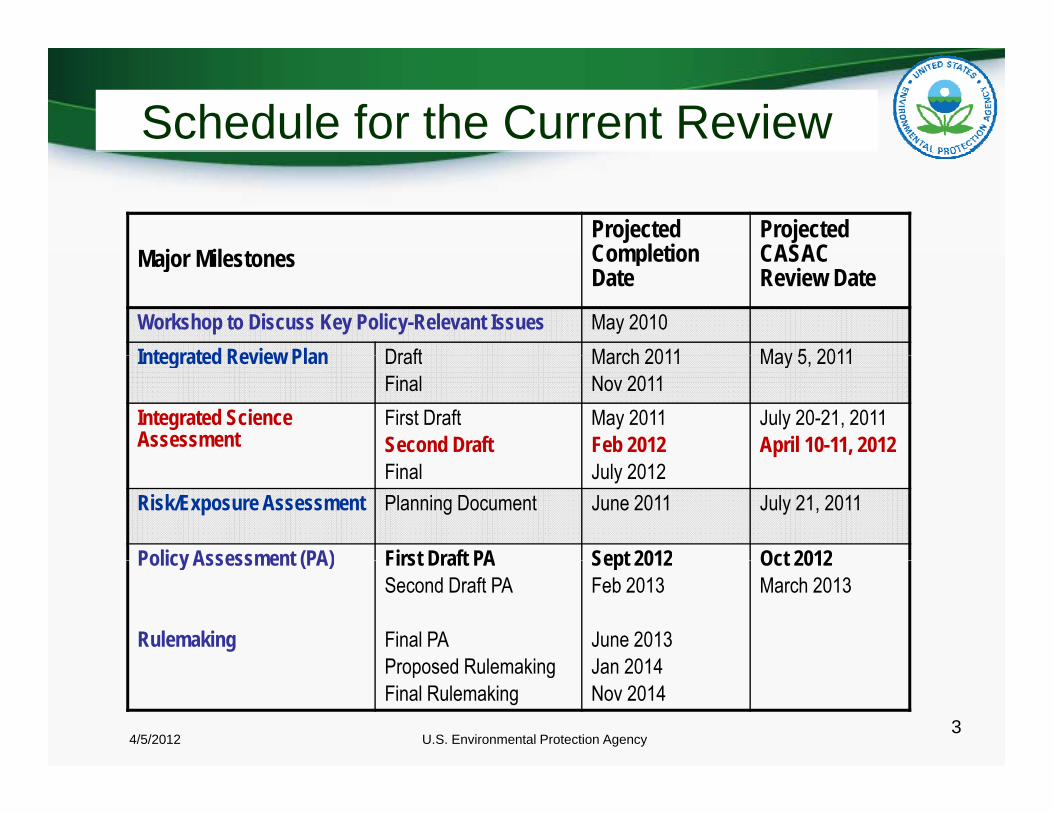
Schedule for the Current Review
M j Mil tProjected Completion
Projected CASAC Major Milestones Completion
DateCASAC Review Date
Workshop to Discuss Key Policy-Relevant Issues May 2010 Integrated Review Plan Draft March 2011 May 5 2011 Integrated Review Plan Draft
FinalMarch 2011Nov 2011
May 5, 2011
Integrated Science Assessment
First DraftSecond Draft
May 2011Feb 2012
July 20-21, 2011April 10-11, 2012
Final July 2012Risk/Exposure Assessment Planning Document June 2011 July 21, 2011
Policy Assessment (PA) First Draft PA Sept 2012 Oct 2012Policy Assessment (PA)
Rulemaking
First Draft PASecond Draft PA
Final PAProposed Rulemaking
Sept 2012Feb 2013
June 2013Jan 2014
Oct 2012March 2013
Proposed RulemakingFinal Rulemaking
Jan 2014Nov 2014
34/5/2012 U.S. Environmental Protection Agency

Objectives for OAR/ORD BriefingsOAR/ORD Briefings
Day 1y• Recap Key Considerations/Conclusions in 2008 Decision• Update CASAC Panel on
Monitoring Net ork and Methods– Monitoring Network and Methods– Piston Aircraft Emissions Information
D 2Day 2• Summarize key aspects of risk/exposure information to be
presented in Policy Assessmentp y
4/5/2012 U.S. Environmental Protection Agency 4

Decisions in the 2008 Review• EPA concluded that 1978 primary standard of 1.5 μg/m3 (calendar quarter) was not requisite
to protect public health with an adequate margin of safety. In revising standard, EPA:– Retained indicator as Pb in total suspended particles
• Reflects evidence that Pb particles of all sizes pose health risks
– Revised averaging time and form to a maximum (not-to-be-exceeded) rolling three-month period, calculated from three consecutive monthly averagescalculated from three consecutive monthly averages
• Gives equal weight to all three-month periods and equal weight to each month within each period• Yields 12 three-month averages per year to compare to NAAQS (versus four averages)
– Revised level to 0.15 μg/m3μg• Decision guided by air-related IQ loss framework that integrates evidence for relationships between: Pb in
air and Pb in children’s blood, and Pb in children’s blood and IQ loss• Quantitative risk assessment results supportive of framework estimates
C bi ti f d i i i di t i ti f d l l id i it bli Combination of decisions on indicator, averaging time, form and level provides requisite public health protection, including health of sensitive groups, with an adequate margin of safety
54/5/2012 U.S. Environmental Protection Agency

2008 NAAQS Review: S f C id i d D i iSummary of Considerations and Decisions
on Indicator
Element Proposed Options Final DecisionI di t R t i Pb TSP b t ll Pb PM R t i Pb TSPIndicator -Retain Pb-TSP, but allow Pb-PM10,
Adopt default scaling factor, from within1.1-2.0 for source sites, and 1.0-1.4-1.9 for nonsource sites
Retain Pb-TSP,Allow Pb-PM10, without adjustment, at nonsourcesites or where ultracourse
Also, allow site-specific scaling factors- Revise to Pb-PM10,with corresponding adjustment to level
particles unlikely
4/5/2012 U.S. Environmental Protection Agency 6
Pb NAAQS Monitoring: Since the Last Review
Mr. Kevin Cavender, Office of Air Quality Planning and Standards, OAR
April 10, 2012 7

Monitoring Conclusions in Last Review• Network and network design requirements
– Potential for exceedances of NAAQS limited to areas near Pb sources (existing or recently closed)
– Revisions to network design requirements needed to:• Capture all sources with potential for NAAQS exceedance• Allow for use of Pb in PM10 in areas where ultracoarse Pb not expected
– Existing IMPROVE speciated PM2 5 monitoring network meets monitoring need and Existing IMPROVE speciated PM2.5 monitoring network meets monitoring need and provides adequate data for tracking trends in rural areas
• Sampling and analysis methods – Existing Federal Reference Method (FRM) and Federal Equivalent Methods (FEM) for – Existing Federal Reference Method (FRM) and Federal Equivalent Methods (FEM) for
Pb in TSP were found to be adequate to determine compliance with the NAAQS– New FRM for Pb in PM10 needed– Methods improvements needed
• Need for an improved sampler for ultra-coarse particles• The FRM and many FEM needed updating
4/5/2012 U.S. Environmental Protection Agency 8

Revisions to Monitoring Requirements• Required source-oriented monitors at locations of estimated maximum
concentration– For sources (other than airports) estimated to emit 0 5 tpy or more– For sources (other than airports) estimated to emit 0.5 tpy or more
• Sites near sources emitting ≥ 1.0 tpy required to be operational by January 1, 2010• Sites near sources emitting ≥ 0.50 tpy but < 1.0 tpy required to be operational by December
27, 2011• Waivers allowed if it could be shown that source did not contribute to a concentration > 50% of Waivers allowed if it could be shown that source did not contribute to a concentration 50% of
the NAAQS• Approximately 230 sources were identified and reviewed in 2005 National Emission Inventory
(NEI) with emissions greater than 0.50 tpy resulting in approximately 130 required source-oriented monitors (after waivers)
For airports estimated to emit 1 0 tp or more– For airports estimated to emit 1.0 tpy or more• Identified 4 sites required to be operational by January 1, 2010
• Required non-source-oriented monitors at NCore sites in Core Based Statistical Areas (CBSA) with a population of 500,000 or more
– Approximately 60 sites required to be operational by December 27, 2011
4/5/2012 U.S. Environmental Protection Agency 9
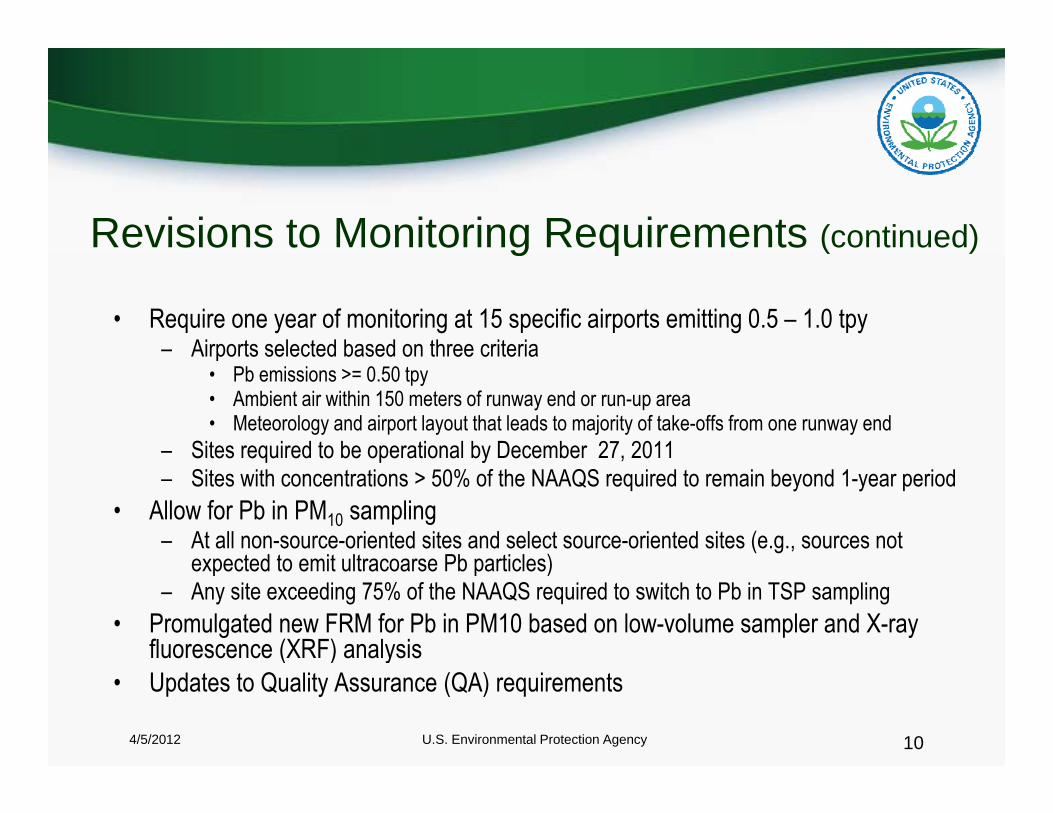
Revisions to Monitoring Requirements (continued)g q ( )
• Require one year of monitoring at 15 specific airports emitting 0.5 – 1.0 tpy– Airports selected based on three criteriaAirports selected based on three criteria
• Pb emissions >= 0.50 tpy• Ambient air within 150 meters of runway end or run-up area• Meteorology and airport layout that leads to majority of take-offs from one runway end
– Sites required to be operational by December 27, 2011S tes equ ed to be ope at o a by ece be , 0– Sites with concentrations > 50% of the NAAQS required to remain beyond 1-year period
• Allow for Pb in PM10 sampling – At all non-source-oriented sites and select source-oriented sites (e.g., sources not
expected to emit ultracoarse Pb particles)expected to emit ultracoarse Pb particles)– Any site exceeding 75% of the NAAQS required to switch to Pb in TSP sampling
• Promulgated new FRM for Pb in PM10 based on low-volume sampler and X-ray fluorescence (XRF) analysis( ) y
• Updates to Quality Assurance (QA) requirements
4/5/2012 U.S. Environmental Protection Agency 10

Lead NAAQS Monitoring Network
U.S. Environmental Protection Agency 11

Counties Containing Nonattainment Areas(2008 standard)( )
U.S. Environmental Protection Agency 12http://www.epa.gov/air/oaqps/greenbk/map/maplead2008.pdf
Nonattainment areas are orange areas within circled counties

Update on Federal Reference MethodResearch Activities
Briefing for L d NAAQS R i P l f thLead NAAQS Review Panel of the
Clean Air Scientific Advisory Committee
Dr. Robert Vanderpool, Office of Research and DevelopmentU.S. Environmental Protection AgencyU.S. Environmental Protection Agency
April 10, 2012

Presentation OutlinePresentation Outline
• Updates on new FEM designations for Pb analysisp g y• Development of a new FRM for TSP filter analysis using
ICP-MS• Summary of 2008 FRM sampling techniques (TSP and • Summary of 2008 FRM sampling techniques (TSP and
PM10)• Specifications and uncertainties associated with current Pb
NAAQS li th dNAAQS sampling methods• Discussion of research initiatives to address limitations of
current Pb sampling methodsp g
14

Summary of Pb NAAQS S li d A l ti l T h iSampling and Analytical Techniques
The two different sampling FRMs (Pb-TSP and Pb-PM10) have correspondingly The two different sampling FRMs (Pb TSP and Pb PM10) have correspondingly different analytical FRMs associated with them
Hi-Vol TSP Sampling (~ 50 cfm)• Sampling at source-oriented sites• Analytical FRM involves extraction of Pb on 8” x 10” glass fiber filters using
acid extraction followed by flame AA analysisy y
PM10 Sampling (16.7 Lpm)• Sampling at non-source-oriented sites and at selected source-oriented sites
where ultra coarse emissions are expected to be minimal
15
where ultra-coarse emissions are expected to be minimal• Analytical FRM involves XRF analysis of Pb on 46.2 mm diameter teflon filters

Recent Method Designations (2010-2012)g ( )
Metric Applicant Designation Extraction Analysis
TSP Inter-MountainLaboratories EQL-0310-189 Hot plate w/ HNO3 ICP-MS
TSP EPA/OAQPS EQL-0510-191 Heated ultrasonic w/ HCL/HNO ICP-MSQ Q HCL/HNO3
TSP EPA/Region 9 EQL-0710-192 Hot block w/ HNO3 ICP-MSTSP EPA/OAQPS EQL-0311-196 Heated w/ HCL/HNO3 ICP-AES
TSP ERG pending Heated w/ HCL/HNO3/H2O2
ICP-MS
PM ERG pending Heated w/ ICP-MSPM10 ERG pending HCL/HNO3/H2O2/HF ICP-MS
16

Proposed New Analytical FRM for Pb in TSPProposed New Analytical FRM for Pb in TSP
• Designed to meet lower detection limit requirements of new Pb NAAQS
• Based on two recently designated FEMs (EQL-0510-191 and EQL 0710 192)EQL-0710-192)
• Extraction options: Heated ultrasonic with HCl/HNO3 or hot block with HNO3
• Applicable to glass fiber quartz and teflon filtersApplicable to glass fiber, quartz, and teflon filters• Interlaboratory results from RTI, ERG, ORIA, and ORD are
favorable for precision and comparability
17

Appendix B to Part 50: Design Specifications of the Hi Vol TSP SamplerDesign Specifications of the Hi-Vol TSP Sampler
• Roof shape: gabled, rectangularS li fl t 39 t 60 f• Sampling flow rate: 39 to 60 cfm
• Inlet velocity (Vi): 20 to 35 cm/sec(25 cm/sec recommended but not required)
• No inlet dimensions specified• No inlet dimensions specified• Filter: glass fiber, 8” x 10”• Timer accuracy: ± 30 min
Vi
Issue: The size selective performance (i.e., aspiration efficiency versus aerodynamic particle size) of ambient samplers is a strong function of sampling
18
ambient samplers is a strong function of sampling flow rate and inlet dimensions

High-Vol TSP Sampling Efficiency vs Wind DirectionSource: Wedding et al. (1977)
90
100
Q = 50 cfm
60
70
80
y (%
)
Q = 50 cfmWind speed = 14 km/hr
45o0o
Dp = 18 um
40
50
60
ng E
ffici
ency
45o
Dp50 = 12 um
Dp50 = 18 um
10
20
30
Sam
plin
0o
00 10 20 30 40 50 60
Aerodynamic Diameter (micrometers)
19
The angle at which airborne particles approach the Hi-Vol TSP sampler strongly affects the efficiency with which they are collected.

High-Vol TSP Sampling Efficiency vs Wind SpeedSource: McFarland, et al. (1979)
90
100
%)
60
70
80
ffici
ency
(%
1.8 km/hr
40
50
Sam
plin
g E
7.2 km/hr
25 km/hr
20
30 Q = 50 cfmSampler rotated at 1 rpm to minimize directional effects
25 km/hr
0
10
0 5 10 15 20 25 30
Aerodynamic Diameter (micrometers)Aerodynamic Diameter (micrometers)
The Hi-Vol TSP sampler displays notable decreases in particle collection efficiency at increasing ambient wind speeds.
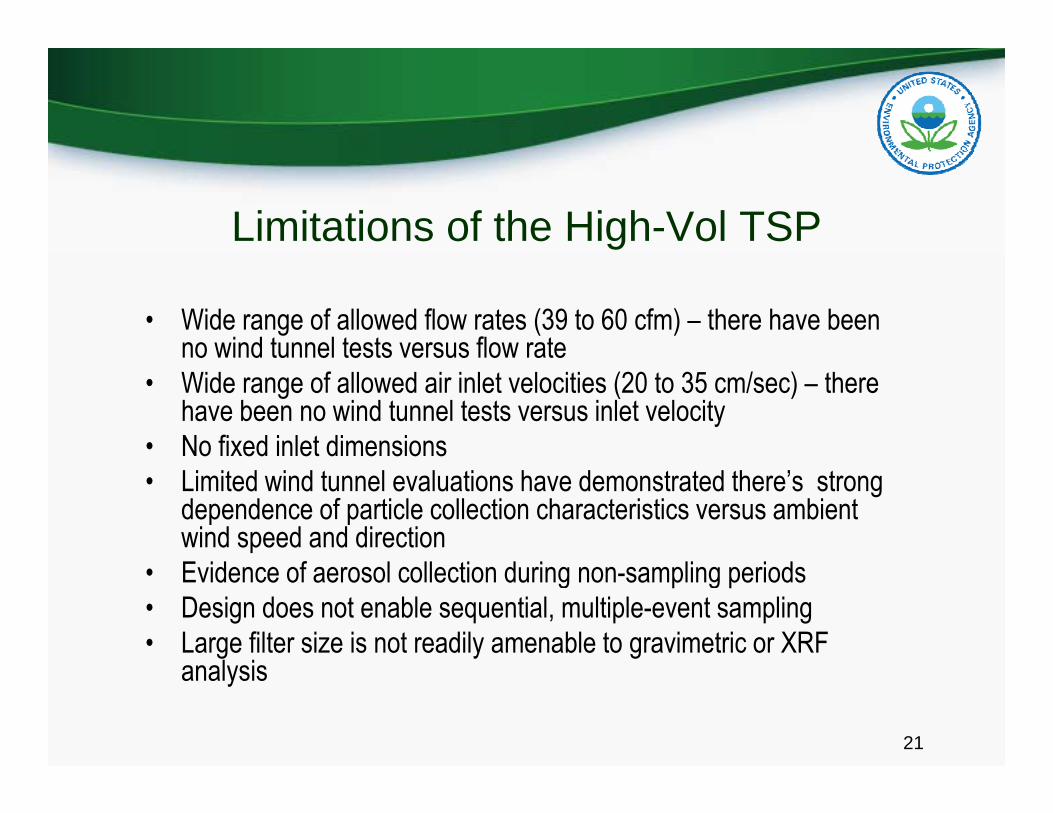
Limitations of the High-Vol TSP
• Wide range of allowed flow rates (39 to 60 cfm) – there have been no wind tunnel tests versus flow rateno wind tunnel tests versus flow rate
• Wide range of allowed air inlet velocities (20 to 35 cm/sec) – there have been no wind tunnel tests versus inlet velocity
• No fixed inlet dimensions• Limited wind tunnel evaluations have demonstrated there’s strong
dependence of particle collection characteristics versus ambient wind speed and direction
• Evidence of aerosol collection during non-sampling periods• Design does not enable sequential, multiple-event sampling• Large filter size is not readily amenable to gravimetric or XRF
l ianalysis
21

Features of the Pb-PM10 SamplerI l t ifi ti (di i t l t i l d fi i h ) f ll ifi d i F d l • Inlet specifications (dimensions, tolerances, materials, and finishes) fully specified in Federal Register using 17 design drawings
• Sampler operates at a fixed 16.7 aLpm flow rate independent of ambient conditions• Inlet’s omnidirectional design avoids measurement bias due to wind directionInlet s omnidirectional design avoids measurement bias due to wind direction• Method’s low flow rate and use of 46.2 mm diameter filters enables adaption to sequential,
multi-event design and multiple analytical techniques• Inlet design minimizes rain and insect intrusion• Strong interlaboratory test results have been obtained during wind tunnel studies of size-
selective performance
Performance of the Low-Vol Pb-PM10 Inlet
Reference Inlet ModelCutpoint (µm)
2 km/hr 8 km/hr 24 km/hrMcFarland and Ortiz (1984) SA 246B 9.9 10.2 10.0
22
VanOsdell and Chen (1989) SA 246B 9.8 10.0 9.9VanOsdell (1991) R&P 10 µm 9.8 - 9.6
Tolocka et al. (2001) Louvered 9.9 10.3 9.7
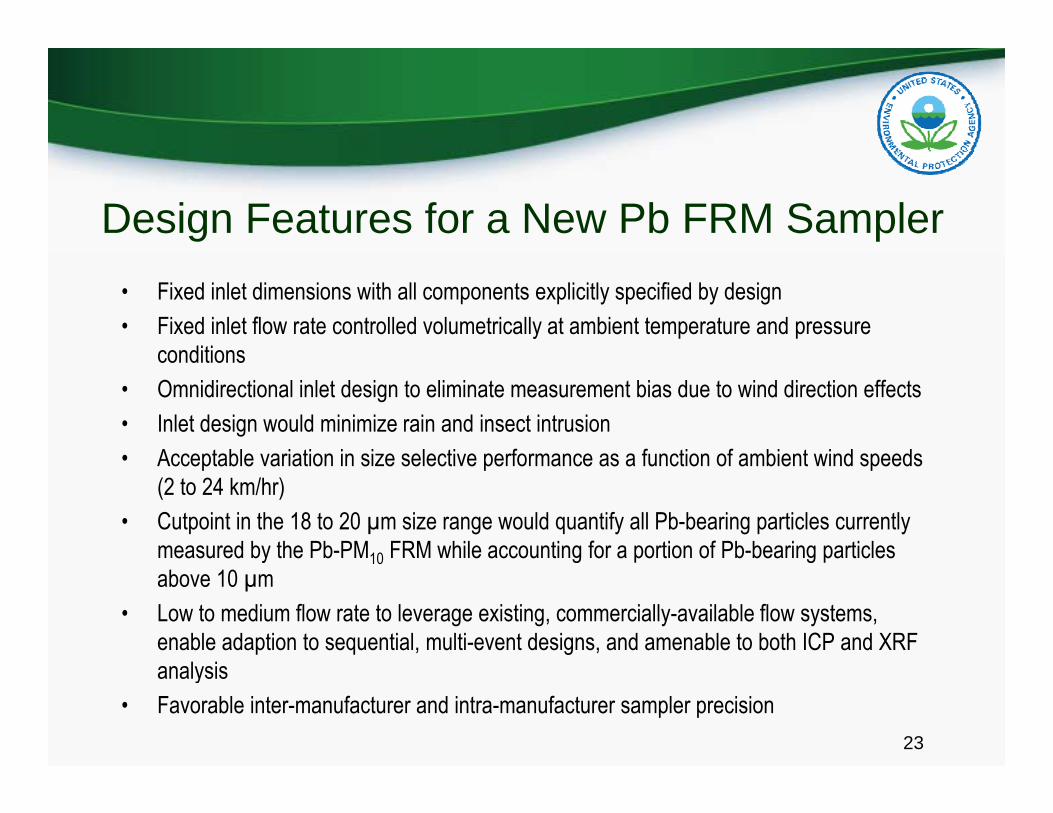
Design Features for a New Pb FRM Sampler• Fixed inlet dimensions with all components explicitly specified by design• Fixed inlet flow rate controlled volumetrically at ambient temperature and pressure
conditionsconditions• Omnidirectional inlet design to eliminate measurement bias due to wind direction effects• Inlet design would minimize rain and insect intrusion• Acceptable variation in size selective performance as a function of ambient wind speeds • Acceptable variation in size selective performance as a function of ambient wind speeds
(2 to 24 km/hr)• Cutpoint in the 18 to 20 µm size range would quantify all Pb-bearing particles currently
measured by the Pb-PM10 FRM while accounting for a portion of Pb-bearing particles y 10 g p g pabove 10 µm
• Low to medium flow rate to leverage existing, commercially-available flow systems, enable adaption to sequential, multi-event designs, and amenable to both ICP and XRF
l ianalysis• Favorable inter-manufacturer and intra-manufacturer sampler precision
23

Developmental Approach
• Develop and validate techniques for generation, transport, and measurement of large aerodynamic particles O ti i EPA’ ATF i d t l f d ti i l ti i t • Optimize EPA’s ATF wind tunnel for conducting size-selective experiments (2, 8, 24 km/hr)
• Conduct size-selective evaluation of EPA’s PM10 inlet to validate generation 10and measurement techniques
• Conduct survey of commercially available low-flow rate inlets and test viable candidatescandidates
• As needed, design and evaluate new prototype inlets• Conduct limited field evaluation of final inlet design to determine inherent
i i d t lt ith ll t d Pb TSP d Pb PMprecision and to compare results with collocated Pb-TSP and Pb-PM10samplers
24
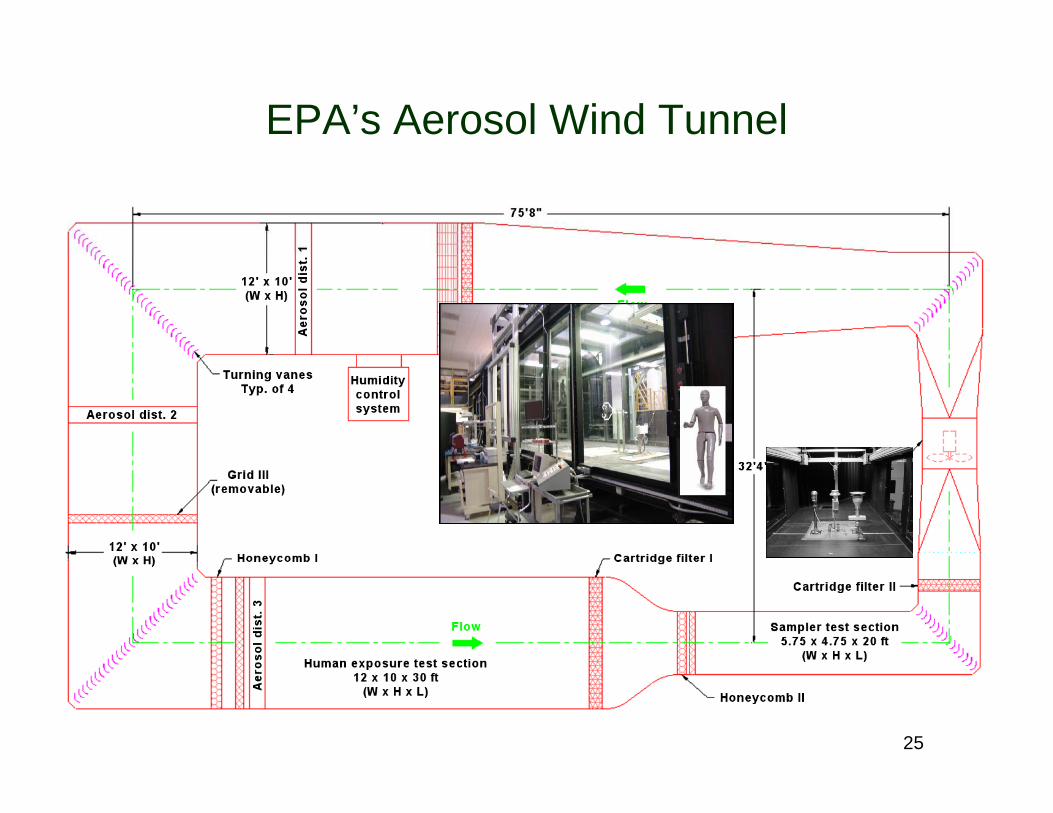
EPA’s Aerosol Wind Tunnel
25
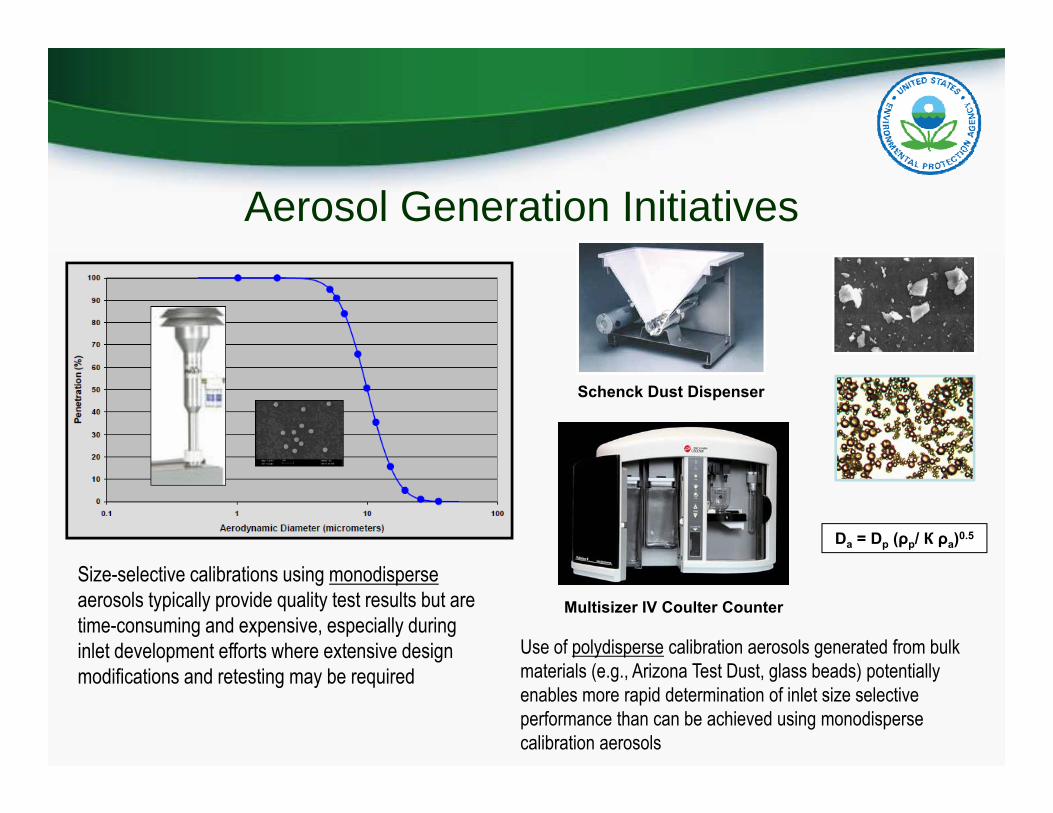
Aerosol Generation Initiatives
Schenck Dust Dispenser
Da = Dp (ρp/ К ρa)0.5
Size-selective calibrations using monodisperseaerosols typically provide quality test results but are time-consuming and expensive, especially during inlet development efforts where extensive design
Multisizer IV Coulter Counter
Use of polydisperse calibration aerosols generated from bulk ( )modifications and retesting may be required materials (e.g., Arizona Test Dust, glass beads) potentially
enables more rapid determination of inlet size selective performance than can be achieved using monodisperse calibration aerosols

Aerosol Generation Initiatives (cont)
Apparatus used for dispensing, aerosolizing, and charge neutralizing
Upstream view of aerosol generation equipment mounted on movable
Isokinetic nozzles (114 Lpm, 90 mm filter) designed for determination of reference
27
and charge neutralizing calibration material into the aerosol wind tunnel
mounted on movable traverse
determination of reference concentrations
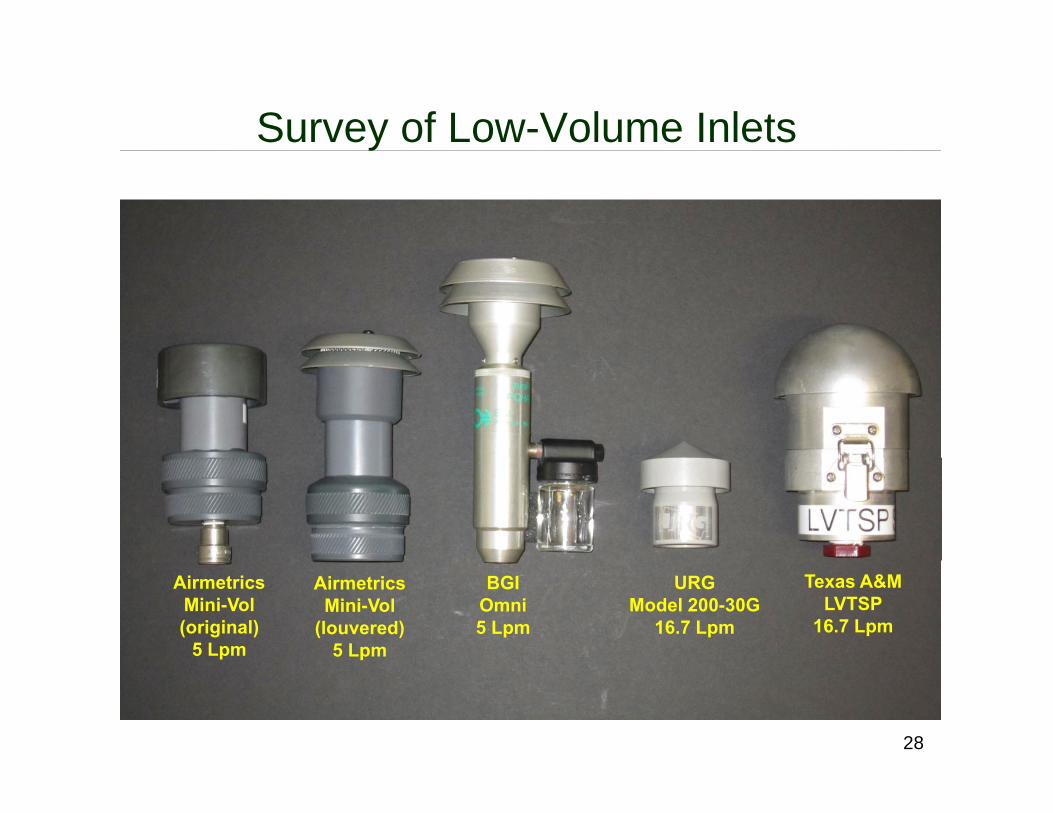
Survey of Low-Volume Inletsy
AirmetricsMini-Vol(original)
5 Lpm
AirmetricsMini-Vol
(louvered)5 Lpm
BGIOmni5 Lpm
URGModel 200-30G
16.7 Lpm
Texas A&MLVTSP
16.7 Lpm
28

Comparative Sizes of 16.7 Lpm Inlets
EPAPM10
16.7 Lpm
EPA“Total”
16.7 Lpm
URGModel 2000-30G
29
Model 2000 30G16.7 Lpm
Efficiency is proportional to Inlet Diameter/(Wind Speed x Dp2)
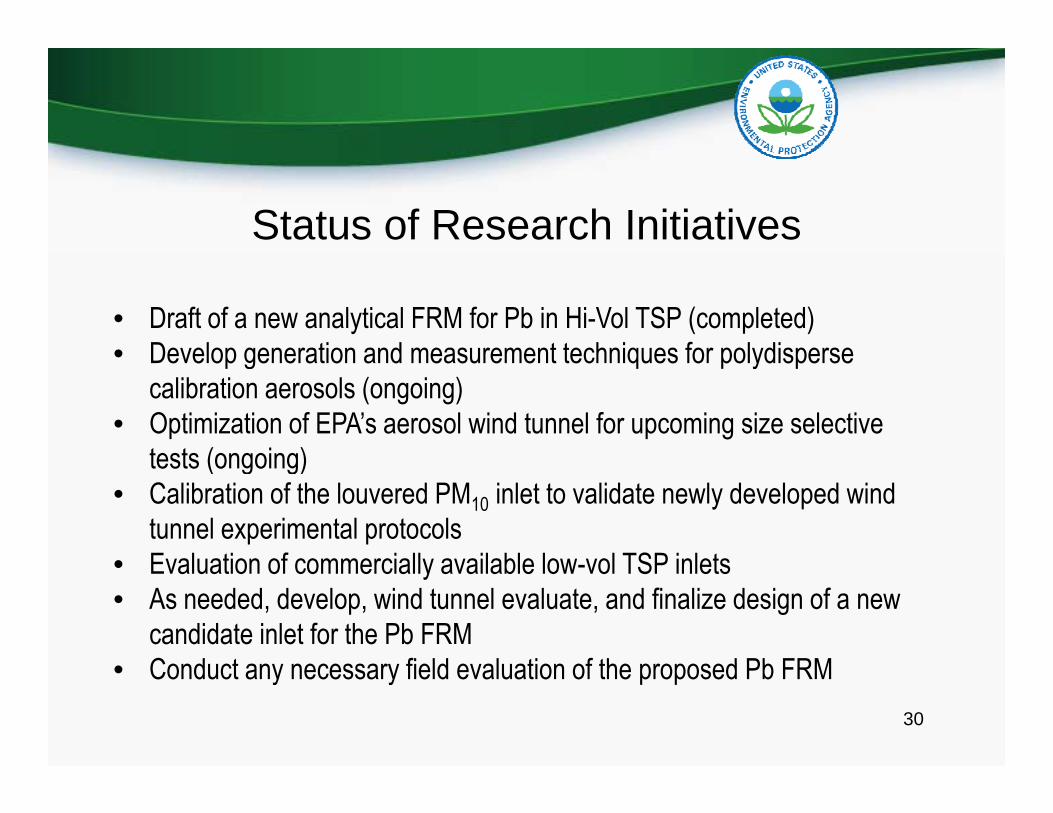
Status of Research Initiatives
• Draft of a new analytical FRM for Pb in Hi-Vol TSP (completed)• Develop generation and measurement techniques for polydisperse • Develop generation and measurement techniques for polydisperse
calibration aerosols (ongoing)• Optimization of EPA’s aerosol wind tunnel for upcoming size selective
tests (ongoing)tests (ongoing)• Calibration of the louvered PM10 inlet to validate newly developed wind
tunnel experimental protocols• Evaluation of commercially available low vol TSP inlets• Evaluation of commercially available low-vol TSP inlets• As needed, develop, wind tunnel evaluate, and finalize design of a new
candidate inlet for the Pb FRMC d t fi ld l ti f th d Pb FRM
30
• Conduct any necessary field evaluation of the proposed Pb FRM

Lead Emissions from Piston-Engine Aircraft
Dr. Marion HoyerOffice of Transportation and Air Quality, OAR
April 10, 2012

EPA is Evaluating Lead Emissionsf Pi t i Ai ftfrom Piston-engine Aircraft
• In April 2010 EPA issued an Advance Notice of Proposed In April 2010, EPA issued an Advance Notice of Proposed Rulemaking (ANPR) on lead emissions from piston-engine aircraft that use leaded aviation gasoline (avgas). W i d th ANPR i t 2006 titi f th • We issued the ANPR in response to a 2006 petition from the environmental group, Friends of the Earth.– This petition asked EPA to either evaluate the potential for adverse effects on p p
public health and the environment from lead emitted by piston aircraft (“endangerment”), and if we find endangerment the petitioners have asked EPA to regulate the emissions, or
– If insufficient information exists to make a finding, to commence a study.
4/5/2012 U.S. Environmental Protection Agency 32
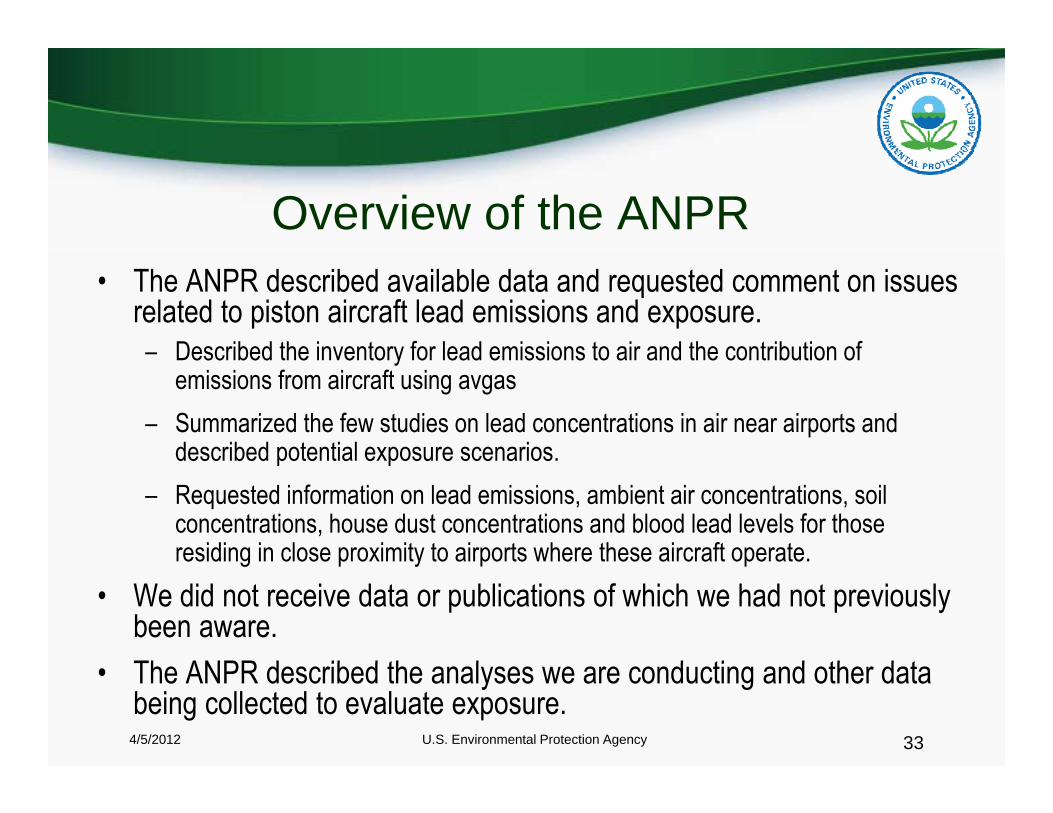
Overview of the ANPR• The ANPR described available data and requested comment on issues
related to piston aircraft lead emissions and exposure. – Described the inventory for lead emissions to air and the contribution of Described the inventory for lead emissions to air and the contribution of
emissions from aircraft using avgas– Summarized the few studies on lead concentrations in air near airports and
described potential exposure scenariosdescribed potential exposure scenarios.– Requested information on lead emissions, ambient air concentrations, soil
concentrations, house dust concentrations and blood lead levels for those residing in close proximity to airports where these aircraft operate.residing in close proximity to airports where these aircraft operate.
• We did not receive data or publications of which we had not previously been aware.Th ANPR d ib d th l d ti d th d t • The ANPR described the analyses we are conducting and other data being collected to evaluate exposure.
334/5/2012 U.S. Environmental Protection Agency

Next StepE l ti th Q ti f E d tEvaluating the Question of Endangerment
• We are performing additional analyses as described in the • We are performing additional analyses as described in the ANPR:o Demographic analysis
o We will have this information in the Policy Assessment o We will have this information in the Policy Assessment
o Model piston-engine emissions of lead at airports to evaluate the impact on local air quality and exposure to lead.
o We expect this work to be completed by the end of 2013 or early 2014
o Evaluate the data from lead monitors at airportso Certified data from the 15 airport study expected by the end of 2013.o Certified data from the 15 airport study expected by the end of 2013.
344/5/2012 U.S. Environmental Protection Agency