review of the road safety remuneration system · 2.2 lead-up to the establishment of the road...
TRANSCRIPT
Review of the Road Safety Remuneration System
Rex Deighton-Smith Jaguar Consulting Pty Ltd
16 April 2014
1
Table of Contents
List of Figures ............................................................................................................................... 6
List of Graphs ............................................................................................................................... 6
List of Tables ................................................................................................................................ 7
List of Abbreviations .................................................................................................................... 8
Executive Summary .................................................................................................................... 10
Summary of Recommendations ........................................................................................................ 17
1 Introduction ....................................................................................................................... 18
2 Background ........................................................................................................................ 19
Key Points .......................................................................................................................................... 19
2.1 Reasons for the Review ......................................................................................................... 19
2.2 Lead-up to the establishment of the Road Safety Remuneration System ............................ 20
2.3 Overview of the Road Safety Remuneration Act 2012 .......................................................... 21
2.4 Overview of the Road Safety Remuneration Tribunal ........................................................... 23
3 Work of the Tribunal to date ............................................................................................... 25
3.1 Road Transport and Distribution and Long Distance Operations Road Safety Remuneration
Order 2014............................................................................................................................. 26
4 Safety performance of the road transport industry .............................................................. 28
4.1 Introduction ........................................................................................................................... 28
4.2 Rationale for intervention ..................................................................................................... 30
4.3 Data summary and analysis: Safety performance of the Australian heavy vehicle sector ... 32
Time-series analysis – Heavy vehicle related fatalities .................................................... 32 4.3.1
Cross-sectional analysis .................................................................................................... 40 4.3.2
Accident causation ........................................................................................................... 49 4.3.3
Data on accident precursors ............................................................................................ 52 4.3.4
4.4 Policy and regulatory approaches to heavy vehicle safety in OECD countries ..................... 54
Safe system approach ...................................................................................................... 54 4.4.1
Safety measures in the trucking industry ......................................................................... 55 4.4.2
4.5 Conclusions on safety performance ...................................................................................... 55
Heavy vehicles as a workplace ......................................................................................... 56 4.5.1
5 Remuneration and safety .................................................................................................... 60
5.1 Review of research literature on remuneration and safety .................................................. 60
Economic deregulation of United States trucking and safety performance .................... 61 5.1.1

2
Regulatory reform in other OECD countries .................................................................... 62 5.1.2
Indirect indicators of safety performance ........................................................................ 63 5.1.3
Remuneration levels and accident history ....................................................................... 67 5.1.4
Relationship between driver employment status and accident history .......................... 74 5.1.5
Remuneration vs other relevant factors affecting safety management .......................... 77 5.1.6
Summary of research findings .......................................................................................... 80 5.1.7
5.2 Remuneration levels in the road transport industry ............................................................. 83
Owner driver remuneration ............................................................................................. 83 5.2.1
Employee drivers .............................................................................................................. 88 5.2.2
Aggregate data ................................................................................................................. 88 5.2.3
6 The policy context – Addressing heavy vehicle safety in Australia ........................................ 91
6.1 Introduction ........................................................................................................................... 92
6.2 Legislation addressing heavy vehicle safety .......................................................................... 93
Road safety regulation ..................................................................................................... 93 6.2.1
Work Health and Safety Legislation ............................................................................... 103 6.2.2
6.3 Legislation specifically addressing driver remuneration & conditions ................................ 107
State-based schemes ...................................................................................................... 107 6.3.1
Fair Work Act 2009 ......................................................................................................... 113 6.3.2
Other legislation ............................................................................................................. 115 6.3.3
6.4 Objectives of the Road Safety Remuneration Act 2012 ...................................................... 115
7 Stakeholder Views ............................................................................................................ 118
7.1 Description of consultation undertaken.............................................................................. 118
7.2 Overview of stakeholder submissions ................................................................................. 119
Submissions in support of the RSRS ............................................................................... 119 7.2.1
Submissions expressing concerns regarding the role or operation of the RSRS ............ 120 7.2.2
Submissions opposed to the RSRS.................................................................................. 121 7.2.3
7.3 Stakeholder views on key issues ......................................................................................... 124
Impact to date of the Tribunal on the industry and its safety performance ................. 124 7.3.1
Potential future impact of the Tribunal on the road transport industry and its safety 7.3.2
performance ................................................................................................................... 127
Regulatory overlap and duplication arising from the operation of the RSRS ................ 129 7.3.3
Appropriateness of the Tribunal model ......................................................................... 134 7.3.4
Prescriptive versus risk management approaches to safety .......................................... 135 7.3.5

3
Preferred approaches to addressing road safety concerns in the road transport industry7.3.6
........................................................................................................................................ 136
7.4 Conclusions .......................................................................................................................... 137
8 Potential impacts of rate setting via RSROs........................................................................ 140
8.1 Financial and economic impacts.......................................................................................... 140
Other estimates .............................................................................................................. 141 8.1.1
Net impact on owner driver incomes ............................................................................. 143 8.1.2
Impact on employee drivers ........................................................................................... 144 8.1.3
8.2 Equity effects ....................................................................................................................... 145
Data issues ...................................................................................................................... 146 8.2.1
8.3 Safety impacts ..................................................................................................................... 146
Benchmarking potential safety gains ............................................................................. 147 8.3.1
Potential benefits due to adoption of the safe rates proposal ...................................... 150 8.3.2
Impact of current legislated initiatives in respect of freight rates ................................. 154 8.3.3
Contributors to improved safety performance .............................................................. 156 8.3.4
Fault in heavy vehicle related accidents ........................................................................ 157 8.3.5
Conceptual discussion .................................................................................................... 158 8.3.6
9 Conclusions ...................................................................................................................... 160
9.1 Regulatory and economic burden ....................................................................................... 160
9.2 Safety performance of the road freight sector ................................................................... 161
9.3 Potential of the RSRS to yield further safety gains .............................................................. 162
9.4 Owner drivers ...................................................................................................................... 164
9.5 Potential costs of the RSRS .................................................................................................. 164
9.6 Alternative approaches ....................................................................................................... 166
10 Recommendations ............................................................................................................ 167
11 Submissions received and consultations undertaken ......................................................... 170
11.1 Submissions received .......................................................................................................... 170
11.2 Consultations undertaken ................................................................................................... 170
Appendix 1: Terms of Reference for a Review of the Road Safety Remuneration System............ 172
The Purpose of the Review ............................................................................................................. 172
The scope of work ........................................................................................................................... 172
Principles ......................................................................................................................................... 172
Consultation .................................................................................................................................... 172
Outputs and reporting requirements ............................................................................................. 172
4
Appendix 2: Estimates of the costs of heavy vehicle related accidents ....................................... 173
Appendix 3: Road safety legislation .......................................................................................... 176
Chain of Responsibility .................................................................................................................... 176
Western Australia ....................................................................................................................... 178
Northern Territory ...................................................................................................................... 179
Fatigue management ...................................................................................................................... 179
Heavy Vehicle National Law ........................................................................................................ 179
Western Australia ....................................................................................................................... 182
Northern Territory ...................................................................................................................... 184
Speeding .......................................................................................................................................... 185
Heavy Vehicle National Law ........................................................................................................ 185
Western Australia ....................................................................................................................... 186
Northern Territory ...................................................................................................................... 186
Heavy vehicle speed limiting ....................................................................................................... 186
Appendix 4: Legislation addressing truck driver remuneration .................................................. 188
New South Wales ............................................................................................................................ 188
Transport Industry - Mutual Responsibility for Road Safety (State) Contract Determination ... 189
Victoria ............................................................................................................................................ 190
Western Australia ........................................................................................................................... 192
Appendix 5: Other legislation ................................................................................................... 196
Fair Work Act 2009 (Cth) ................................................................................................................. 196
Modern awards ........................................................................................................................... 198
Enterprise agreements ................................................................................................................ 198
Independent Contractors Act 2006 (Cth) ........................................................................................ 199
Competition and Consumer Act 2010 (Cth) .................................................................................... 200
Collective bargaining ................................................................................................................... 200
Unconscionable conduct ............................................................................................................. 201
CC Act exemptions under Commonwealth, state or territory legislation .................................. 202
Appendix 6: Additional stakeholder concerns regarding duplication and overlap ....................... 204
Coverage and scope of the Road Safety Remuneration Act 2012 .................................................. 204
Coverage ..................................................................................................................................... 204
Scope 205
Interaction of the RSR Act with other legislation ........................................................................... 206
Sections 10 to 13 of the RSR Act: Prevalence in instances of inconsistency .............................. 206

5
Section 20 of the RSR Act: ‘necessary’ overlap ........................................................................... 210
The role of existing legislation and regulators ................................................................................ 212
Disputes about remuneration and ‘related conditions’ ................................................................. 213
Collective bargaining and protections from ‘unconscionable conduct’ and unfair contracts ........ 215
2014 Order: Overlap with existing regulatory obligations and instruments .................................. 216
Definitions ................................................................................................................................... 216
Dispute resolution ....................................................................................................................... 216
Adverse conduct protection ....................................................................................................... 216
Written contracts ........................................................................................................................ 216
Other contracts ........................................................................................................................... 217
Safe driving plans ........................................................................................................................ 217
WHS training ............................................................................................................................... 218
Drug and alcohol policies ............................................................................................................ 218
Bibliography ............................................................................................................................ 220
6
List of Figures
Figure 4.1: Main causes of accidents involving heavy vehicles ....................................................... 50
Figure 4.2: Incidence of non-compliance with working hours regulation by drivers in 2006 and
2012 ............................................................................................................................... 53
List of Graphs
Graph 4.1: Total road fatalities vs those involving articulated trucks, 1986-2012 .......................... 33
Graph 4.2: Total road fatalities vs those involving articulated trucks, 1990-2012 .......................... 34
Graph 4.3: Articulated truck-related fatalities as a percentage of total fatalities, 1986-2012 ....... 35
Graph 4.4: Trends in fatal accident rates vs trend in total fatal accident numbers involving heavy
vehicles 2002-2007 (as a percentage of 2002) .............................................................. 36
Graph 4.5: Fatalities per 100 million vehicle km 1988-2012 (as a percentage of 1988) ................. 37
Graph 4.6: Heavy rigid truck related fatalities vs total road fatalities as percentage of 2004. ....... 38
Graph 4.7: Fatalities per 100 million kilometres - rigid and articulated trucks, 2004-2012 (missing
2008, 2008 and 2011 data) ............................................................................................ 39
Graph 4.8: Fatalities per 100 million tonne kilometres - rigid and articulated trucks, 2004-2012
(missing 2008, 2008 and 2011 data) .............................................................................. 40
Graph 4.9: International Comparisons of Heavy Vehicle Fatality Rates per 100 million kilometres
travelled ......................................................................................................................... 42
Graph 4.10: Fatal truck crashes per 100 million km travelled - 2001 to 2007 .................................. 43
Graph 4.11: Change in articulated vehicle fatality rate, 2002-2007 .................................................. 45
Graph 4.12: Driver errors in the Large Truck Crash Causation Study (LTCCS) ................................... 51
Graph 5.1: Predicted crash probability and pay rise ....................................................................... 69
Graph 8.1: Pay rates and estimated accident risk (Rodriguez et al, 2006.) ................................... 151
Graph 8.2: Proportion of articulated truck related fatalities occurring in relevant states, 1990-
2012 ............................................................................................................................. 155
Graph 8.3: Comparative fatality rates for accidents involving articulated trucks - NSW vs Aust,
1998-2012 .................................................................................................................... 156
7
List of Tables
Table 4.1: Fatal truck crashes per 100 million km travelled, 2001 - 2007 ........................................ 44
Table 4.2: Ratio of fatality rates: Persons killed in truck crashes per 10,000 vehicles registered vs
persons killed in any accident per 10,000 vehicles registered, 2005 ............................... 46
Table 4.3: Ratio of fatality rates: Persons killed in truck crashes per 100 million vehicles kilometres
vs persons killed in any accident per 100 million vehicle kilometres, 2005 .................... 47
Table 4.4: Comparison of fatality rates and ratios, 2005 vs 1998 ..................................................... 48
Table 4.5: Truck occupant fatalities per 100 million kilometres travelled, 2005 .............................. 57
Table 4.6: Truck occupant seat belt wearing rates in fatal and injury accidents .............................. 58
Table 5.1: experience of dangerous events at least sometimes while driving in the last year for
drivers in each employment category (%) ........................................................................ 65
Table 5.2: Truck crashes experience by 300 interviewed drivers in the immediate past 12 month
period and in previous 5 years ......................................................................................... 66
Table 5.3: Stepwise regression analysis using cost of crash, miles per month, safety bonus, paid
time off, and age to predict the number of crashes ........................................................ 71
Table 5.4: Injury and work-related illness experiences over the past 12 months for the three driver
groups (permanent, casual, owner driver) ....................................................................... 77
Table 5.5: Summary of the number of studies showing significant relationships between the
characteristic and safety outcomes for organisation-level, individual level and
intervention studies. ........................................................................................................ 79
Table 5.6: Number and proportion of drivers below notional award remuneration ....................... 86
Table 5.7: Average earnings for truck drivers and all occupations internationally .......................... 89
Table 5.8: Average earnings for truck drivers and all occupations internationally .......................... 90
Table 6.1: Rates comparisons - rigid trucks..................................................................................... 110
Table 6.2: Rates comparison - articulated vehicles ......................................................................... 111
Table 6.3: Vehicle Rates - NSW General Contract Carriers Determination ..................................... 113
Table 8.1: Comparison of gross income using Victorian and Western Australian Guideline Rates 142
Table 8.2: Potential revenues (annual) and increases over estimated current revenue ................ 142
Table 8.3: Fatal truck crashes per 100 million kilometres travelled, 2001-2007 ............................ 148
Table 8.4: Potential benefits of improved safety performance ...................................................... 149
Table A2.1: Non-human costs of road accidents in Australia, 2006.................................................. 175
Table A2.2: Cost of heavy vehicle-related accidents in Australia (2012) .......................................... 176

8
List of Abbreviations
Acronym Full name
ABS Australian Bureau of Statistics
ACCC Australian Competition and Consumer Commission
ACCI Australian Chamber of Commerce and Industry
ACT Australian Capital Territory
AFEI Australian Federation of Employers and Industries
Ai Group Australian industry Group
ALC Australian Logistics Council
ALRTA Australian Livestock and Rural Transporters Association
ANRA Australian National Retailers Association
ARTIO Australian Road Transport Industrial Organisation
ATSB Australian Transport Safety Bureau
BITRE Bureau of Infrastructure, Transport and Regional Economics
CC Act Competition and Consumer Act 2010 (Cth)
COAG Council of Australian Governments
CoR Chain of Responsibility
CPI Consumer Price Index
Cth Commonwealth
EWD Electronic Work Diary
FMCSA Federal Motor Carrier Safety Administration (US)
FORS Federal Office of Road Safety
FW Act Fair Work Act 2009 (Cth)
FWC Fair Work Commission
FWO Fair Work Ombudsman
GPS Global Positioning System
HVNL Heavy Vehicle National Law
HVSPP Heavy Vehicle Safety and Productivity Programme
IAP Intelligent Access Program
IC Act Independent Contractors Act 2006 (Cth)
IRU International Road Transport Union
LDO Award Road Transport (Long Distance Operations) Award 2010
MBA Master Builders Association
MDL Mass, Dimension and Loading
9
Acronym Full name
NES National Employment Standards
NFF National Farmers Federation
NHVR National Heavy vehicle Regulator
NPV Net Present Value
NT Northern Territory
NTC National Transport Commission
NTI National Transport Insurance
NRSS National Road Safety Strategy 2011-2020
NRTC National Road Transport Commission
NSW New South Wales
NSW Act Industrial Relations Act 1996 (NSW)
NSW IRC NSW Industrial Relations Commission
NTARC National Truck Accident Research Centre
NTI National Transport Insurance
OECD Organisation for Economic Co-operation and Development
Order The Road Transport and Distribution and Long Distance Operations Road Safety Remuneration Order 2014
PCBU Person Conducting a Business or Undertaking
PPI Producer Price Index
RIS Regulation Impact Statement
RMS Roads and Maritime Services NSW
RSR Act Road Safety Remuneration Act 2012 (Cth)
RSRO Road Safety Remuneration Order
RSRS Road Safety Remuneration System (comprising the Road Safety Remuneration Act 2012 and the Road Safety Remuneration Tribunal)
RTD Award Road Transport and Distribution Award 2010
SCOTI Standing Council on Transport and Infrastructure
TIC Transport and Infrastructure Council
Tribunal Road Safety Remuneration Tribunal
TWU Transport Workers’ Union
Victorian Act Owner Drivers and Forestry Contractors Act 2005 (Vic)
VSL Value of a Statistical Life
WA Western Australia
WA Act Owner drivers (Contracts and Disputes) Act 2007 (WA)
WHS Work Health and Safety
10
Executive Summary
The Road Safety Remuneration Tribunal (the Tribunal) is empowered to undertake an unusually
strong form of regulatory intervention - i.e. minimum price regulation. Price regulation necessarily
entails the potential to generate significant economic distortions and is, consequently, rarely used in
modern market economies. Indeed, a significant element of the history of economic reform in
Australia, as in other market economies, has been the removal of price regulation across a range of
industries. This implies that strong evidence is needed to justify the need for this highly
interventionist regulatory approach, including a need to establish that other, less potentially
distorting regulatory approaches, are insufficient to achieve the desired objective.
In order to assess whether the Road Safety Remuneration System (RSRS) constitutes an appropriate
means of improving safety outcomes in the road transport industry, as required by its Terms of
Reference, the Review has investigated three key issues. These are:
the nature and extent of the evidence for a substantial link between driver remuneration
and safety performance;
the available evidence on current remuneration levels in the Australian road freight sector;
and
the potential for a tribunal equipped with powers to make binding remuneration orders to
be effective in improving observed safety performance.
In addition, it has investigated the broader context for the operation of the RSRS by assessing the
safety performance of the heavy vehicle sector over time and via international comparisons, and by
reviewing the recent history of regulatory reform in the field and assessing a range of initiatives
currently in train.
Concerns that low levels of remuneration would compromise safety performance in the road freight
industry were first expressed more than three decades ago. The economic deregulation of the
United States road freight industry, commencing in the early 1980s, gave rise to relatively
widespread concerns that road safety would suffer as a result of increased competition pushing
down freight rates and consequently reducing profit rates and remuneration levels in the industry.
However, subsequent research indicated that industry safety performance had been maintained and
improved, even as real freight prices fell substantially following economic deregulation. Other
Organisation for Economic Cooperation and Development (OECD) countries subsequently followed
the United States lead, removing a range of economic regulation in the road freight industry and
leading to a situation in which, by the late 1990s, price regulation had been eliminated.
Subsequent research on potential links between remuneration and safety has investigated a wide
range of relationships, with variables assessed including firm-level financial performance (including
both revenue and profit) and driver remuneration, firm size and employment basis and both indirect
indicators of safety (e.g. speeding, fatigue, excessive driving hours) and actual accident involvement.
Within this broader literature, a small number of studies have identified statistically significant

11
relationships between driver remuneration and accident involvement. In particular, Belzer et al,1
Rodriguez et al,2 Nafukho et al3 and Monaco and Williams4 have identified such relationships.
While all four of these studies find a statistically significant link between remuneration and safety
performance, the nature and extent of the identified links differ widely, in ways that are highly
significant from a policy perspective. While Belzer et al5 and Rodriguez et al6 both concluded that
remuneration has a strong impact on safety, the latter finds that the direction of the correlation
reverses at higher levels of remuneration, so that remuneration levels that are too high are likely to
be associated with safety performance as poor as those that are too low. This raises the issue of
whether, and how, it would be possible for a regulatory body to identify ‘optimal’ remuneration
levels from a safety perspective. Conversely, Nafukho et al7 found that, while a significant correlation
exists, the size of the impact is small, with 3.2 per cent of the total variance in accident involvement
being explained by a total of six remuneration-related variables. Monaco and Williams8 also found a
small coefficient for the impact of driver remuneration, with firm financial performance being found
to be substantially more important.
Reviews of the literature on this issue have generally assessed the overall quality of the evidence in
favour of a link between pay rates and road safety as being weak. For example, the United States
Federal Motor Carrier Safety Administration (FMCSA) stated in 2007:
"... a number of studies purport to draw a relationship between driver compensation and
safety outcomes, for example, that increased pay is associated with a reduction in crashes.
The reviewers offer a cautionary note to these assertions: generally, it is not possible to
understand the true nature of the relationship between these two factors. Specifically, it may
be unclear whether cash bonuses for safe driving are responsible for higher pay, or that
offering better pay at a company improves its ability to recruit and hire greater numbers of
quality drivers."9
The most recent literature review on safety management for the heavy vehicle industry (Mooren et
al)10 found four studies demonstrating statistically significant relationships between pay systems and
1 Belzer, M.H., Rodruigez, D.A. & Sedo, S.A. (2002), Paying for Safety: An Economic Analysis of the Effect of
Compensation on Truck Driver Safety, Sponsored by Science Applications International Corporation and Federal Highway Transport Safety Administration. 2 Rodriquez D., Targa F., Belzer M. (2006), ‘Pay Incentives and Truck Driver Safety: A Case Study’, Industrial and
Labor Relations Review, 2006, 59(2), pp.205-225. 3 Nafukho, M., Hinton, BE. & Graham, CM (2007), ‘A Study of Truck Drivers and their Job Performance
Regarding Highway Safety’, Performance Improvement Quarterly 20(1), pp 65-78. 4 Monaco, K. & Williams, E. (2000). ‘Assessing the Determinants of Safety in the Trucking Industry’, Journal Of
Transportation And Statistics, April 2000. 5 Belzer et al (2002), op cit
6 Rodriguez et al (2006), op cit
7 Nafukho et al (2007), op cit
8 Monaco and Williams (2000), op cit
9 Federal Motor Carrier Safety Administration (2007), Driver Issues: Commercial Motor Vehicle Safety Literature
Review, U.S. Department of Transportation, Washington, DC. 10
Mooren, L, Grzebieta, R, Williamson, A, Olivier, J and Friswell, R. (2014), ‘Safety management for heavy vehicle transport: A review of the literature’. Safety Science, Vol.62, pp.79-89, February 2014.
12
rates and safety performance and concluded that there was significantly stronger evidence for the
importance of other factors as determinants of safety outcomes, including safety training,
management commitment and work scheduling/journey planning.
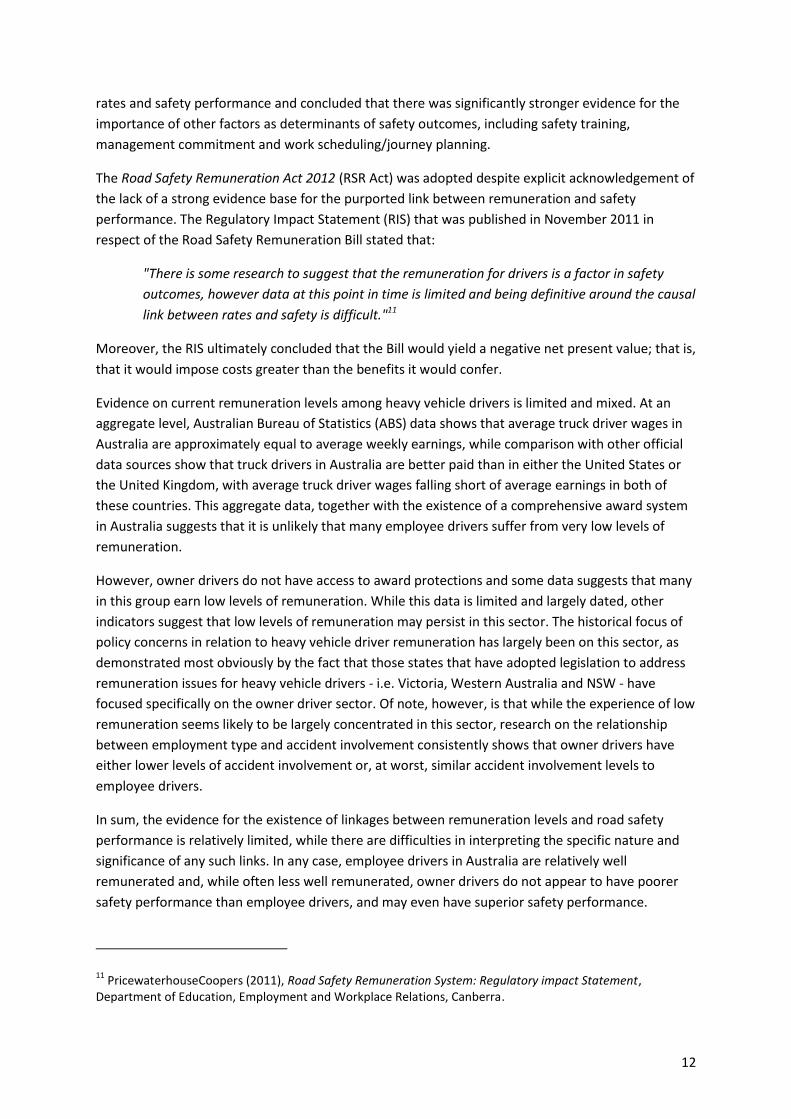
The Road Safety Remuneration Act 2012 (RSR Act) was adopted despite explicit acknowledgement of
the lack of a strong evidence base for the purported link between remuneration and safety
performance. The Regulatory Impact Statement (RIS) that was published in November 2011 in
respect of the Road Safety Remuneration Bill stated that:
"There is some research to suggest that the remuneration for drivers is a factor in safety
outcomes, however data at this point in time is limited and being definitive around the causal
link between rates and safety is difficult."11
Moreover, the RIS ultimately concluded that the Bill would yield a negative net present value; that is,
that it would impose costs greater than the benefits it would confer.
Evidence on current remuneration levels among heavy vehicle drivers is limited and mixed. At an
aggregate level, Australian Bureau of Statistics (ABS) data shows that average truck driver wages in
Australia are approximately equal to average weekly earnings, while comparison with other official
data sources show that truck drivers in Australia are better paid than in either the United States or
the United Kingdom, with average truck driver wages falling short of average earnings in both of
these countries. This aggregate data, together with the existence of a comprehensive award system
in Australia suggests that it is unlikely that many employee drivers suffer from very low levels of
remuneration.
However, owner drivers do not have access to award protections and some data suggests that many
in this group earn low levels of remuneration. While this data is limited and largely dated, other
indicators suggest that low levels of remuneration may persist in this sector. The historical focus of
policy concerns in relation to heavy vehicle driver remuneration has largely been on this sector, as
demonstrated most obviously by the fact that those states that have adopted legislation to address
remuneration issues for heavy vehicle drivers - i.e. Victoria, Western Australia and NSW - have
focused specifically on the owner driver sector. Of note, however, is that while the experience of low
remuneration seems likely to be largely concentrated in this sector, research on the relationship
between employment type and accident involvement consistently shows that owner drivers have
either lower levels of accident involvement or, at worst, similar accident involvement levels to
employee drivers.
In sum, the evidence for the existence of linkages between remuneration levels and road safety
performance is relatively limited, while there are difficulties in interpreting the specific nature and
significance of any such links. In any case, employee drivers in Australia are relatively well
remunerated and, while often less well remunerated, owner drivers do not appear to have poorer
safety performance than employee drivers, and may even have superior safety performance.
11 PricewaterhouseCoopers (2011), Road Safety Remuneration System: Regulatory impact Statement,
Department of Education, Employment and Workplace Relations, Canberra.
13
It is also apparent that the task of setting appropriate minimum rates for the industry is an
extremely challenging one. An indicator of the extent of this difficulty is provided by the fact that the
simple statement contained in the Tribunal's published draft of its first Road Safety Remuneration
Order (RSRO) to the effect that a hirer must pay an owner driver "a reasonable amount for work"
was removed from the final Order due to substantial concerns being raised by a range of
stakeholders. More generally, comparison of a range of rates either proposed or currently in place
shows that experts in the field have reached widely differing conclusions as to appropriate minimum
rates. Significant differences exist between the guideline rates published under the Western
Australian and Victorian legislation, the rates contained in various determinations of the NSW
Industrial Relations Commission and the rates proposed to the Tribunal by parties including the
Transport Workers' Union.
Moreover, several stakeholders highlighted the multi-faceted nature of the industry and the highly
sector-specific nature of both service requirements and remuneration arrangements as factors that
would render decision-making by the Tribunal on remuneration issues exceptionally complex and
challenging. As noted above, there is potential for regulated minimum rates that are set
inappropriately to yield significant economic costs, or even to have negative safety impacts (as
proposed by Rodriguez et al),12 while the widely varying rate scales currently in the public domain
must give rise to considerable concern on this issue.
The current safety performance of the industry and the regulatory and other initiatives that have
contributed to it constitute important elements of context for consideration of the appropriateness
of the RSRS as a regulatory model. In general terms, a highly interventionist regulatory approach is
most likely to be appropriate where less intrusive regulatory and policy initiatives have proven
ineffective and the current performance of the regulated industry is poor. However, while this has
been asserted to be the position in some submissions to the Review, and in some of the material
published in the lead-up to the adoption of the current legislation, the available data do not support
these propositions.
The actual safety performance of the heavy vehicle sector in Australia has been reviewed in detail in
relation to both the safety performance of the road transport sector as a whole and to the safety
performance of the heavy vehicle sector in other, comparable countries. The performance of the
heavy vehicle sector is generally favourable when measured against both of these benchmarks.
Thus, fatality rates (i.e. fatalities in accidents involving heavy vehicles per 100 million vehicle
kilometres) fell by 76 per cent between 1988 and 2012, a reduction that was slightly larger than the
70 per cent reduction achieved across the road transport fleet as a whole over the same period.
While international comparative data are scarce, data published OECD in 2011 (the most recent
available) shows that fatality rates in Australia improved in the period 2001-2007 relative to those of
several other countries with which comparisons were made and that Australia's safety performance
is a relatively strong one, albeit that it is not the best performer in this area.13 Moreover, in
reviewing Australia's relative international performance, the National Transport Commission (NTC)
12 Rodriguez et al (2006), op cit
13 OECD (2011), Moving Freight with Better Trucks: Improving Safety, Productivity and Sustainability, OECD
Publishing, Paris, p.169. http://dx.doi.org/10.1787/9789282102961-en (accessed 7 April 2014).

14
has previously highlighted differences in road infrastructure quality, rather than regulatory issues, as
the key factors explaining the gap between Australia's performance and then-current best practice.
Australia’s strong overall safety performance has occurred in the context of a substantial program of
regulatory reform, as well as other policy initiatives including significant programs of expenditure on
road upgrades. This conjunction invites the conclusion that the regulatory reforms pursued have
been important contributors to the observed major improvements in safety performance.
The foundation of the regulatory reform program pursued is one of inter-governmental co-operation
and consequent regulatory harmonisation. The then National Road Transport Commission (NTRC)
(subsequently NTC) was established in 1991 through agreement between the Commonwealth, state
and territory governments and has pursued both the adoption of regulatory innovation and best
practice and the harmonisation of regulation across jurisdictions. This has included reforms in areas
including mass, dimension and loading limits (MDL), fatigue management and compliance and
enforcement - the latter including changes to sanctions arrangements. Importantly, reform has
included the adoption of the chain of responsibility (CoR) concept, which seeks to ensure that
parties other than drivers are held accountable where their actions encourage the adoption of
unsafe on-road behaviours.
Further reforms are currently in train. Importantly, the Heavy Vehicle National Law (HVNL) is
currently being operationalised, while the National Heavy Vehicle Regulator (NHVR) has only very
recently commenced operations. Further, a review of CoR provisions in the HVNL is currently
underway and is widely expected to lead to further reform in this area, while the road freight
industry has been identified as a major area of focus for the national Work Health and Safety
Strategy 2012-2022. These changes, occurring at both institutional and regulatory levels, can be
expected to drive further improvement in safety performance.
A notable aspect of the international comparisons compiled by the OECD is that there is a high level
of agreement between leading countries on regulatory and other policy directions and priorities in
relation to the heavy vehicle sector, which Australia has generally acted in accordance with. By
contrast, legislation based on the safe rates concept appears to be unique to Australia, with a recent
OECD document noting the establishment of the RSRS but drawing no parallels with any other
current or foreshadowed policy initiatives.
Numerous stakeholders, including both industry groups and state governments, have raised
concerns regarding what is perceived to be a substantial degree of actual and potential overlap
between the RSRS and a range of pre-existing regulatory provisions, while the assessment of
relevant legislation undertaken by the Review highlights a number of areas of apparently substantial
overlap and/or duplication. As noted by several stakeholders, much of the Tribunal's first RSRO
relates to matters that appear, at least arguably, not to be directly remuneration-related: indeed,
the RSRO barely addresses remuneration per se. The broad range of matters that the RSR Act
empowers the Tribunal to regulate and the Tribunal's apparent willingness to exercise these powers
in respect of a wide range of safety-related matters suggests that future orders in respect of
‘remuneration-related’ conditions are likely to expand the extent of overlap between its
determinations and other regulatory provisions over time.
15
This raises the issue of whether the Tribunal will be able to marshal a comparable level of expertise
in safety-related matters. Early indications are that the Tribunal is adopting a different regulatory
approach from that embraced in key heavy vehicle safety legislation. Many stakeholders pointed out
that key elements of the first RSRO, including the Safe Driving Plan requirements, are highly
prescriptive in approach. By contrast, the regulatory reform program pursued by the NTC and its
state and territory equivalents in recent years has led to a substantial move away from detailed,
prescriptive approaches and toward the use of more flexible, performance based and process-
oriented regulation.
The Terms of Reference for this Review require it to examine any available evidence of the impacts
of the RSRS on road safety. Given that the Review is being concluded within two years of the
commencement of the RSR Act and the Tribunal's first RSRO has yet to take effect, it is not possible
to identify any direct impacts of the Tribunal's work to date on road safety. Moreover, since
mandatory minimum remuneration levels are not set in the first RSRO and will, instead, potentially
be the subject of a future order, it is likely that a significant further period will elapse before it would
be possible to observe any safety impacts due to the Tribunal's remuneration-related activities.
As noted above, road safety remuneration legislation appears to be unique to Australia. Thus,
international experience can provide no clear guidance as to the likely impact in practice of the
future specification of mandatory minimum remuneration rates. Within Australia, only NSW
currently has mandatory rate-setting provisions in place. However, this system has now been in
operation for several decades. The Review sought to determine whether there is evidence of a
positive safety impact due to the operation of these arrangements in NSW. The NSW Industrial
Relations Commission (IRC) has not been able to supply any direct evidence of this type. However,
review of comparative data on heavy vehicle-related fatality rates suggests that NSW' rate is above
the national average and that there has been no obvious trend in this regard (i.e. change in the
relative fatality rates) in recent years. Thus, it is not possible to conclude with confidence that the
operation of a mandatory rate-setting system in NSW has achieved substantive safety benefits.
Submissions to the Review indicate that the RSRS currently enjoys limited stakeholder support, with
11 of 26 submissions received calling for its abolition, a further 10 submissions calling for substantial
reform and only 5 submissions being wholly or largely supportive of the current model. Consultation
did suggest the existence of a somewhat higher level of support for the lighter-handed legislative
initiatives adopted in recent years in Victoria and Western Australia. This legislation can be regarded
as more targeted in nature, both in that it:
focuses on owner drivers, the group which is widely considered to be of major concern in
relation to issues of inadequate remuneration; and
adopts a range of provisions that specifically target identified characteristics of this group
and thereby attempts to improve the efficiency of the market for contractor services.
In particular, this includes the specification of disclosure requirements to be met by hirers, the
provision of a range of information to owner drivers, including rate and cost schedules, and the
provision of low-cost dispute resolution mechanisms.
16
As neither of the Victorian or Western Australian legislative interventions have yet been reviewed,14
no firm conclusions can be drawn as to their effectiveness. However, some industry stakeholders
expressed the view that they had the potential to address specific problems without giving rise to
the risk of significant distortions or imposing unduly complex and costly regulatory compliance
burdens.
This gives rise to the possibility of replacing the current RSRS with a lighter-handed and more
targeted system along the lines of those currently in place in Victoria and Western Australia. Should
the Government wish to consider such an approach, assessments of the effectiveness of these
existing legislative arrangements should first be undertaken and further stakeholder consultation on
this issue conducted.
Such an approach can be seen as consistent with the principle of minimum necessary legislation,
while facilitating the collection of appropriate data to inform future decisions as to whether any
more interventionist approach is required and as to the most appropriate approach to adopt in such
circumstances. However, it would be crucial for consultation to be conducted with the relevant state
and territory governments to ensure that a single, national approach could be agreed and the
duplication of existing arrangements avoided.
14 It is noted that a review of the Western Australian legislation has already commenced and will be completed
after this Review.

17
Summary of Recommendations
Recommendation 1. That the Road Safety Remuneration System should not continue in its
current form.
Recommendation 2. That, accordingly, the provisions of the Road Safety Remuneration Act 2012
authorising the Tribunal to set mandatory rates should be repealed.
Recommendation 3. That, should the Government determine that mandatory price setting
powers should be retained, the scope of these powers should be narrowed
to encompass only contractor-drivers.
Recommendation 4. That, should the Road Safety Remuneration Act 2012 be retained, it should
be amended to ensure that the scope of the Tribunal's operations is limited
to remuneration and to matters that are directly remuneration-related.
Recommendation 5. That, should the Road Safety Remuneration Act 2012 be retained, the
Tribunal should enter into a formal memorandum of understanding with the
National Heavy Vehicle Regulator to ensure that a shared understanding of
the respective roles of these bodies is developed, co-operation is
encouraged where relevant and overlap and duplication are minimised.
Recommendation 6. That, should the Government decide to retain legislation addressing heavy
vehicle driver remuneration issues, it should consult with State and Territory
governments with a view to enabling a single, national scheme to operate.
Recommendation 7. That, should a single national system addressing remuneration issues be
agreed, as per Recommendation 6, consideration should be given as to the
most appropriate institutional arrangements to implement the system.
The full text of the recommendations and accompanying reasoning is included in Chapter 10.

18
1 Introduction
This Review commenced on 20 November 2013 and responds to Terms of Reference provided by the
Minister for Employment, Senator the Hon Eric Abetz. The purpose of the Review is to assess the
operation of the Road Safety Remuneration Act 2012 and the Road Safety Remuneration Tribunal
(together the “Road Safety Remuneration System”) and advise Government on whether this system
represents an effective and appropriate means of addressing safety concerns in the road transport
industry.
The Terms of Reference for the Review require it to:
assess the regulatory and economic burden of the Road Safety Remuneration System on
participants in the road transport industry and the Australian economy generally;
examine whether other Commonwealth, state and territory regulations and initiatives
provide a more appropriate means of improving safety outcomes in the road transport
industry;
examine any available evidence about the impacts of the Road Safety Remuneration System
on improving road safety (e.g. accident data);
assess the operation and conduct of the Tribunal and the extent to which it has achieved its
aim and objectives;
consult relevant stakeholders as necessary; and
make recommendations to Government, based on the evidence and assessment above.
The Terms of Reference also require the Review to be guided by the following principles:
Eliminate duplication of regulation.
Ensure that regulations and policies for improving safety performance in the road transport
industry are based on credible evidence.
The complete Terms of Reference for the Review are reproduced as Appendix 1.
The Review was conducted by Mr Rex Deighton-Smith, of Jaguar Consulting. The Review Report was
prepared by Mr Deighton-Smith with assistance from Department of Employment staff, who also
provided secretariat services to the Review.

19
2 Background
Key Points
The issue of whether, and to what extent, remuneration issues affect safety performance in the heavy vehicle industry has been the subject of a number of parliamentary and government reports over the past decade.
Following the NTC Safe Payments report in 2008 and the subsequent release of the Safe Rates, Safe Roads: Directions Paper by the then government in 2010, the then Australian Government determined to adopt legislation enabling minimum rates to be mandated.
The Road Safety Remuneration Act 2012 commenced on 1 July 2012 and established the Road Safety Remuneration Tribunal, which also began operation on that date. The object of the Act is to promote safety and fairness in the road transport industry.
The Tribunal’s work to date has consisted of its first annual work program, publication of the first Road Safety Remuneration Order and adoption of a second annual work program.
The Government’s pre-election Policy to Improve the Fair Work Laws (May 2013) included a commitment to review the operation of the Road Safety Remuneration Tribunal as a matter of urgency.
The Road Safety Remuneration System (RSRS) was established under the Road Safety Remuneration
Act 2012 (Cth) (RSR Act), which commenced on 1 July 2012, and is supported by the Road Safety
Remuneration Regulation 2012 (Cth). It comprises the Road Safety Remuneration Tribunal (the
Tribunal) and a separate education and compliance framework administered by the Fair Work
Ombudsman (FWO).
The legislation was enacted in response to the National Transport Commission’s (NTC) 2008 report
Safe Payments: Addressing the Underlying Causes of Unsafe Practices in the Road Transport
Industry,15 which found that market failures and payment rates and methods in the road transport
industry encourage unsafe driving behaviours that contribute to poor safety outcomes on the
nation’s roads.
The aim of the RSRS is to improve the safety performance of the road transport industry for the
benefit of both road transport drivers and other road users, by removing pay-related incentives and
economic pressures on drivers that encourage unsafe work practices.
2.1 Reasons for the Review
Section 120 of the RSR Act requires that a review of the legislation must be commenced by
1 July 2015 and completed by 31 December 2015. However, the Coalition Government's pre-election
Policy to Improve the Fair Work Laws (May 2013) included a commitment to urgently review the
operation of the RSRS and the need for a further level of regulation.
15 National Transport Commission (2008), Safe Payments: Addressing the Underlying Causes of Unsafe
Practices in the Road Transport Industry, Australian Government, Canberra.
20
As noted above, the Government seeks advice on whether the RSRS represents an effective and
appropriate means of addressing safety concerns in the road transport industry. The Terms of
Reference highlight questions as to the size of the economic and regulatory burden likely to be
imposed by the RSRS and the nature and extent of regulatory duplication that may result from the
operation of the system.
2.2 Lead-up to the establishment of the Road Safety Remuneration System
As noted, the RSRS was established following the publication by the NTC of the 2008 ‘Safe Payments’
report16 and the subsequent publication by the former Department of Education, Employment and
Workplace Relations (DEEWR) (now the Department of Employment) of the Safe Rates, Safe Roads:
Directions Paper17 at the direction of the then government in 2010. More generally, the issue of
whether, and to what extent, remuneration issues affected safety performance in the road transport
industry, particularly in relation to heavy vehicles, had been the subject of a number of
parliamentary and government reports over the previous decade. Of note are the:
report of the House of Representatives Standing Committee on Communication, Transport
and the Arts inquiry (October 2000) - Beyond the Midnight Oil: An inquiry into managing
fatigue in transport;
paper Freight Rates and Safety Performance in the Road Freight Industry prepared by ACIL-
Tasman for a Working Group of the Council of Australian Governments' (COAG) Standing
Council on Transport and Infrastructure (SCOTI) (April 2003); and
subsequent Discussion Paper Heavy Vehicle Safety and Sustainable Rates for Owner-Drivers,
released by the SCOTI Working Group.
While the SCOTI Discussion Paper concluded that "...evidence does not present a compelling road
safety-based case for Governments to consider introducing a minimum rates regime for owner
drivers", the NTC’s Safe Payments report18 reached a different conclusion, finding that there was a
link between driver remuneration and safety outcomes in the road transport industry. It
recommended that the Australian Transport Commission endorse the establishment of a national
scheme for setting minimum safe rates covering both employee and owner drivers in the road
transport industry.
In response to the NTC’s report, in December 2010 the former DEEWR sought to consult with road
transport industry stakeholders to develop possible models for reform through the establishment of
a Safe Rates Advisory Group to provide expert road transport industry advice to DEEWR on policy
options for national reform. This resulted in the Safe Rates, Safe Roads: Directions Paper,19 which
outlined options for national legislation involving the establishment of a national tribunal that would
be empowered to make orders regarding safe rates and related terms in the road transport industry.
16 ibid
17 Department of Education, Employment and Workplace Relations (2010), Safe Rates, Safe Roads: Directions
Paper, Australian Government, Canberra. 18
National Transport Commission, October 2008, op cit. 19
Department of Education, Employment and Workplace Relations (2010), op cit
21
This process also included the engagement of PricewaterhouseCoopers (PwC) to prepare a
Regulatory Impact Statement (RIS) including a cost benefit analysis for establishing a road safety
remuneration tribunal for employee and owner drivers in the road transport industry.20 The RIS was
finalised in November 2011 and found that:
"Based on conventional economic measures and the assumptions used in this RIS, both
options generate a BCR below one and a negative NPV [Net Present Value]. That is, the
additional costs associated with increased remuneration exceed the additional road safety
benefits expected."21
In fact, the RIS found that the expected costs of the system were approximately twice as large as the
benefits under the two ‘base options’ considered.22 The Bill was introduced to Parliament despite
this advice that it would not improve societal welfare.
On 23 November 2011, the former Minister for Infrastructure and Transport, the Honourable
Anthony Albanese, introduced two bills establishing the RSRS:
the Road Safety Remuneration Bill 2011 (the Bill); and
the Road Safety Remuneration (Consequential Amendments and Related Provisions) Bill
2011 (the Consequential Amendments Bill).
On 24 November 2011, the Parliamentary Selection Committee referred the two bills, which would
together establish the RSRS, to the House of Representatives Standing Committee on Infrastructure
and Communications for inquiry and advisory report. The subsequent Advisory Report, handed
down in February 2012, recommended that the House of Representatives should consider and pass
the bills. The Road Safety Remuneration Bill 2012 and the Road Safety Remuneration (Consequential
Amendments and Related Provisions) Bill 2012 were subsequently passed in both Houses on
20 March 2012. The RSR Act commenced on 1 July 2012 and established the Tribunal, which also
began operation on that date.
2.3 Overview of the Road Safety Remuneration Act 2012
Section 3 of the RSR Act sets out its objectives, as follows:
3 Object
The object of this Act is to promote safety and fairness in the road transport industry by
doing the following:
(a) ensuring that road transport drivers do not have remuneration-related incentives to
work in an unsafe manner;
20 PricewaterhouseCoopers (2011), op cit
21 ibid, p.47
22 ibid, p.49. The base options included “maintaining the existing Commonwealth and state-based legislation
for employee drivers and owner drivers (where applicable)” and “introducing a voluntary system of payments for owner drivers and chain of responsibility arrangements.”

22
(b) removing remuneration-related incentives, pressures and practices that contribute to
unsafe work practices;
(c) ensuring that road transport drivers are paid for their work; including loading or
unloading their vehicles or waiting for someone else to load or unload their vehicles;
(d) developing and applying reasonable and enforceable standards throughout the road
transport industry supply chain to ensure the safety of road transport drivers;
(e) ensuring that hirers of road transport drivers and participants in the supply chain
take responsibility for implementing and maintaining those standards;
(f) facilitating access to dispute resolution procedures relating to remuneration and
related conditions for road transport drivers.
The RSR Act establishes the Tribunal to enquire into sectors, issues and practices within the road
transport industry and, where appropriate, determine mandatory minimum rates of pay and related
conditions for employed and self-employed drivers (i.e. independent contractor/owner drivers).
These determinations, to be known as a Road Safety Remuneration Order (RSRO), operate in
addition to any existing rights that employee drivers have under industrial instruments and that
owner drivers have under their contracts for services. That is, Tribunal rulings will supplement
existing entitlements. Thus:
1. In the case of employee drivers, RSRO or other Tribunal rulings will not override modern
awards, enterprise agreements, Fair Work Commission (FWC) orders and transitional
instruments. However, any order made by the Tribunal would override a particular term of
these industrial instruments to the extent that it was more beneficial to the driver. To the
extent that these industrial instruments provide remuneration and related terms that are
less beneficial to drivers, they will be of no effect.
2. In the case of owner drivers, a RSRO will prevail over any inconsistent terms in a road
transport contract only to the extent that they are more beneficial to the driver.
Section 18 of the RSR Act provides that the Tribunal must prepare an annual work program
identifying the matters the Tribunal proposes to inquire into with a view to making a RSRO in
relation to any or all of those matters. The matters identified may be any or all of:
a sector or sectors of the road transport industry;
issues for the road transport industry or a sector of it; and
practices affecting the road transport industry or sector of it.
However, section 19(3) provides that RSROs made on application are not to be restricted in their
content to matters contained within the Tribunal's published work program.
Section 20 of the RSR Act sets out the matters to which the Tribunal is required to have regard in
making an RSRO, as follows:
(a) the need to apply fair, reasonable and enforceable standards in the road transport
industry to ensure the safety and fair treatment of road transport drivers;

23
(b) the likely impact of any order on the viability of businesses in the road transport
industry;
(c) the special circumstances of areas that are particularly reliant on the road transport
industry, such as rural, regional and other isolated areas;
(d) the likely impact of any order on the national economy and on the movement of
freight across the nation;
(e) orders and determinations made by an Expert Panel of the Fair Work Commission in
annual wage reviews and the reasons for those orders and determinations;
(f) any modern awards relevant to the road transport industry (see subsection (2)) and
the reasons for those awards;
(g) the need to avoid unnecessary overlap with the Fair Work Act 2009 and any other
laws prescribed for the purposes of this paragraph;
(h) the need to reduce complexity and for any order to be simple and easy to
understand;
(i) the need to minimise the compliance burden on the road transport industry;
(j) any other matter prescribed by the regulations for the purposes of this paragraph.
Collective bargaining by a hirer and those owner drivers covered by a RSRO is exempt from the
operation of the Competition and Consumer Act 2010 (CC Act) (see Section 6.3.3 of this Report for
further discussion regarding the CC Act). The Tribunal is empowered to grant approvals for ‘Road
Transport Collective Agreements’ that result from such bargaining.
The Tribunal is also empowered to resolve disputes between drivers, their hirers or employers and
participants in the road transport industry supply chain about remuneration and related conditions,
in so far as the remuneration and related conditions in dispute could provide incentives to work in
an unsafe manner. The Tribunal may make recommendations or express opinions, undertake
mediation or conciliation or, with the consent of the parties, undertake arbitration when resolving
such disputes.
The RSR Act also establishes a compliance regime for the enforcement of RSROs made by the
Tribunal, Road Transport Collective Agreements and any arbitration orders arising out of a dispute.
These compliance functions are performed by the FWO. In addition, the FWO provides education,
assistance and advice to owner drivers, employees and the industry.
2.4 Overview of the Road Safety Remuneration Tribunal
The Tribunal is a specialist tribunal, established by the RSR Act. It is an independent body with
functions set out in section 80 of the RSR Act, relating to:
making RSROs;
approving Road Transport Collective Agreements;

24
dealing with certain disputes relating to road transport drivers, their employers or hirers and
participants in the supply chain;
conducting research into remuneration-related matters that may affect safety in the road
transport industry;
any other functions prescribed by the regulations; and
any other functions conferred on the Tribunal by another law of the Commonwealth.
The Tribunal comprises both FWC members (who are dual appointed members of the FWC) and road
transport industry specialists. Members of the Tribunal are appointed by the Governor-General
under section 97 of the RSR Act, and include:
Dual-appointee members, who are members of both the Tribunal and the FWC:
o The Hon Jennifer Acton, President
o Senior Deputy President Lea Drake
o Deputy President Ingrid Asbury
o Commissioner Peter Hampton
Industry members, who hold office on a part-time basis:
o Mr Steve Hutchins
o Mr Paul Ryan
o Mr Tim Squires
o Professor Ann Williamson
The work of the Tribunal is carried out by members, with the support of FWC administrative staff.
25
3 Work of the Tribunal to date
Key points
The Tribunal inquired into the retail, livestock, bulk grain, interstate long distance and intrastate long distance sectors in its first annual work program. It then issued a draft Road Safety Remuneration Order covering road transport drivers operating in those sectors, before publishing its first RSRO on 17 December 2013.
The RSRO is due to take effect from 1 May 2014. It does not set rates of remuneration but does address a number of safety issues which the Tribunal has determined are remuneration-related.
The Tribunal is currently undertaking work pursuant to its second annual work program and has invited stakeholders to submit proposals dealing with payment rates for road transport drivers and associated issues.
Given that the first RSRO is not yet operational, the work of the Tribunal to date has necessarily had little impact on remuneration or safety.
The Tribunal published its first annual work program on 10 December 2012 following two rounds of
consultations, including a hearing, with interested persons on the matters that should be included in
the program. This program identified the retail, livestock, bulk grain, interstate long distance and
intrastate long distance sectors of the road transport industry as sectors the Tribunal proposed to
inquire into with a view to making a RSRO.
On 12 July 2013, the Tribunal published its first draft RSRO. The draft RSRO applied to all sectors of
the road transport industry identified in the Tribunal’s first annual work program (i.e. the retail,
livestock, bulk grain, interstate long distance and intrastate long distance sectors).
The draft RSRO set out minimum entitlements and requirements for the road transport drivers in the
identified sectors, their employers or hirers, and participants in the supply chain in relation to them.
The draft RSRO included clauses regarding:
safe driving plans;
payment time;
contracts;
work payments;
clothing provision or reimbursement;
drug and alcohol policies;
training;
whistle-blower protection; and
dispute resolution.
Following further consultation on the content of the draft RSRO, the Tribunal published its first RSRO
on 17 December 2013, the Road Transport and Distribution and Long Distance Operations Road
Safety Remuneration Order 2014 (the 2014 Order). The 2014 Order will take effect from 1 May 2014
and applies to a road transport driver employed or engaged in:
The road transport and distribution industry within the meaning of the Road Transport and
Distribution Award 2010 as in force on 1 July 2012, in respect of the provision by the road

26
transport driver of a road transport service wholly or substantially in relation to goods,
wares, merchandise, material or anything whatsoever destined for sale or hire by a
supermarket chain; or
Long distance operations in the private transport industry within the meaning of the Road
Transport (Long Distance Operations) Award 2010 as in force on 1 July 2012.
The Tribunal published its second annual work program on 18 December 2013. In its second annual
work program, as well as continuing to consider those sectors identified in the first annual work
program, the Tribunal intends to also inquire into:
the road transport and distribution industry within the meaning of the Road Transport and
Distribution Award 2010 as in force on 1 July 2012, in respect of the provision by a road
transport driver of a road transport service wholly or substantially in relation to goods,
wares, merchandise, material or anything whatsoever destined for sale or hire by a
supermarket chain; and
the sectors in long distance operations in the private transport industry within the meaning
on the Road Transport (Long Distance Operations) Award 2010 as in force on 1 July 2012;
and
the sectors in the cash-in-transit industry within the meaning of the Transport (Cash-in-
Transit) Award 2010 as in force on 1 July 2012.
In addition to publishing two annual work programs and a draft and final RSRO the Tribunal has
collected a range of remuneration related data, which has been published on its website.
As the 2014 Order is yet to take effect, its impact to date is presumably very limited, however, the
following discusses the content of the Order.
3.1 Road Transport and Distribution and Long Distance Operations Road
Safety Remuneration Order 2014
The 2014 Order is due to take effect from 1 May 2014 and to expire on 30 April 2018. A notable
feature of the Order is that it does not set remuneration rates. While the draft RSRO published in
July 2013 proposed the inclusion of a simple provision stating that "A hirer must pay a contractor
driver engaged by them a reasonable amount for work", this provision was removed from the 2014
Order following considerable feedback from stakeholders which indicated that both the terms
‘reasonable’ and ‘work’ were considered controversial. The Tribunal therefore proposed instead to
convene a conference of interested parties on the issue of rates of payment, with a view to
potentially varying the 2014 Order at some future time to deal with payment rates.23 A hearing was
subsequently held on 11 February 2014. The Tribunal also invited proposed RSROs on payments for
road transport drivers and associated issues to be submitted by 20 March 2014. Seven submissions
were received. The Tribunal is yet to make a decision on rates or publish further steps in its
timetable under its second annual work program.
23 See Road Safety Remuneration Tribunal Full Bench Decision, 17 December 2013, Part 9.
27
Thus, the only element of the 2014 Order that deals directly with remuneration is Part 4, which
relates to ‘payment related matters’ and specifies requirements including a 30 day payment term for
invoices issued by owner drivers and limitations on required payments or deductions.
The remainder of the 2014 Order focuses on other safety-related matters. Specifically, it imposes
requirements on employers or hirers of road transport drivers and participants in the supply chain in
relation to those drivers regarding:
Safe driving plans;
Contracts;
Work payments;
Drug and alcohol policies;
Training;
Adverse conduct protections; and
Dispute resolution procedures.

28
4 Safety performance of the road transport industry
Key points
Heavy vehicle safety is a significant policy issue in all developed countries. The Organisation for Economic Cooperation and Development (OECD) notes that the challenge for governments is to ensure that regulatory intervention allows the road transport industry to be efficient and responsive to freight needs, while at the same time improving the health, safety and quality of life outcomes expected by the broader community.
Intrusive forms of regulation such as price regulation, which have the potential to distort market outcomes, are only appropriate where a major policy problem is being addressed and evident that less intrusive forms of regulation are ineffective.
Some major stakeholders have argued that the safety performance of the Australian road transport industry is poor, that regulatory approaches adopted to date have thus failed and that the RSRS is the necessary response.
Given these factors, a clear understanding of the safety performance of the road transport industry is fundamental to considering the merits of the RSRS.
Road safety performance in Australia has improved substantially in recent decades. Available data show that the heavy vehicle sector has enjoyed a similar level of improvement in its safety performance. Indeed, fatality rates per vehicle kilometre have fallen further in the articulated truck sector than in the road fleet as a whole in the period 1988–2012.
While limited, available international comparative data indicates that Australia's performance relative to other comparable countries improved noticeably during the last decade. Australia is shown in a 2011 OECD report to be one of the better-performing countries among those studied in terms of heavy vehicle safety. However the lack of very recent data implies that there is necessarily some uncertainty as to current comparative performance.
Data on heavy vehicle accident precursors suggest that speed and fatigue remain substantial issues for the road transport industry, but that policy actions taken over the past several years have been effective in reducing the extent of both issues.
Heavy vehicles are overrepresented in total road fatalities in Australia as in all countries. However, evidence indicates that factors beyond the control of the industry largely account for the over-representation of heavy vehicles in fatality data. Heavy vehicle accident rates are generally below those of light vehicles, while only a minority of multiple vehicle accidents involving heavy vehicles are due to the fault of the heavy vehicle driver. However, the survivability of accidents involving heavy vehicles is low.
OECD research indicates that a large proportion of the most effective interventions in relation to heavy vehicle safety are those that are generally applicable to all vehicle types. Conversely, the single most effective means of reducing heavy vehicle occupant fatalities is to increase driver seatbelt wearing to the levels found among light vehicle occupants.
4.1 Introduction
A sound understanding of the nature and extent of the policy problem to be addressed is
fundamental to ensuring that any regulatory intervention is soundly based and that the best policy

29
options are chosen. This is a core principle of regulatory policy, as set out by the Organisation for
Economic Cooperation and Development (OECD),24 and is also reflected in the Australian
Government's Regulatory Impact Analysis requirements,25 to which all substantive legislative
instruments are subject.
Heavy vehicle safety is a significant policy issue in all developed countries. A 2011 report prepared
by the OECD International Transport Forum (the OECD Report (2011)) highlights the need for
governments to establish regulatory conditions that improve "road transport efficiency, safety and
sustainability" and explains the rationale for intervention in the following terms:
"The overall aim of government policies towards transport is to maximise socio-economic
welfare. External costs, such as congestion, air pollution, greenhouse gas emissions and
safety, require regulatory or pricing intervention to reduce them to acceptable levels."26
However:
"The challenge for governments is to establish the right framework conditions for minimising
the external impacts of freight transport whilst allowing the trucking industry to provide
efficient transport services... Regulatory solutions must respond to freight needs whilst
meeting community expectations for improved health, safety and quality of life."27
This focus on efficient and effective regulatory interventions is clearly important from the
perspective of regulatory policy generally, but is particularly crucial given the extensive nature of
government regulatory intervention in the road transport industry, particularly regarding heavy
vehicles. Such intervention includes regulation of vehicle mass, dimension and loading (MDL),
technical characteristics and access to the road network, as well as driver licensing and behaviour
and the practices of transport operators.
The RSR Act authorises a particularly intrusive form of regulation that is rarely used in the Australian
economy and almost never in the context of a competitive market (i.e. price regulation - in this case,
regulation of minimum prices). The rarity of this type of intervention reflects the fact that it has
significant potential to distort market outcomes and is contrary to the basic presumptions of a
market economy. Such a form of regulation is therefore only appropriate where a very substantial
policy problem is being addressed and where other, less intrusive forms of regulation are shown to
be unable to address the policy problem effectively.
24 See, for example, OECD (2002), Regulatory Policies in OECD Countries: From Interventionism to Regulatory
Governance, OECD Publishing, Paris; and OECD (2009), Regulatory Impact Analysis: A Tool for Policy Coherence, OECD Publishing, Paris. 25
Department of Prime Minister and Cabinet (2014), The Australian Government Guide to Regulation, Australian Government, Canberra. http://www.cuttingredtape.gov.au/sites/default/files/documents/australian_government_guide_regulation.pdf (accessed 7 April 2014) 26
OECD (2011), Moving Freight with Better Trucks: Improving Safety, Productivity and Sustainability, OECD Publishing, Paris, p.169. http://dx.doi.org/10.1787/9789282102961-en (accessed 7 April 2014) 27
ibid

30
4.2 Rationale for intervention
As noted above, heavy vehicle safety is indeed regarded as a very substantial public policy issue
internationally and in Australia. At a fundamental level, it is a major aspect of the larger issue of road
safety in general. Road trauma is one of the most significant external (i.e. non-disease related)
causes of death in developed countries. According to Australian Bureau of Statistics (ABS) data,
transport accidents accounted for one sixth, or 1,522 of the total of 9,123 deaths due to non-disease
related causes in Australia in 2011.28 Heavy vehicle related fatalities accounted for 18.9 per cent of
the total number of road deaths in Australia in 201229 and averaged 16.8 per cent of all road deaths
in the five years to 2012. Internationally, heavy vehicle related deaths account for approximately 10
per cent to 25 per cent of all road deaths.30
The submissions of the Transport Workers' Union (TWU) to this Review and to previous inquiries
relating to the establishment of the Tribunal also argue that heavy vehicles constitute a workplace
and that, considered in this context, the job of a heavy vehicle driver is one of the most dangerous in
the economy:
“Indeed, Safe Work Australia estimates that road transport workers are 15 times more likely
to be killed while at work, than any other worker.”31
A part of the specific context for the adoption of the RSR Act was the argument of some major
stakeholders that the current safety performance of the Australian road transport industry is poor
and that this demonstrates the failure of the policy approaches adopted to date in pursuit of the
objective of improving safety. This is a key proposition given that, as Chapter 6.2 demonstrates,
there has been ongoing policy and regulatory reform in this area in Australia over the past 15 to 20
years. The need for an intervention as potentially far-reaching as price regulation is therefore
predicated on the purported failure, or at least the limited success, of the reform program
undertaken to date.
A key example of this perspective is provided by the submissions to both the Parliamentary
Committee inquiry into the Road Safety Remuneration Bill and to this Review by the TWU. Both
submissions refer to "the safety crisis in the road transport industry", while the former also refers to
the industry's "appalling safety record" and argues that safety performance in the industry appears
to be declining.32 The TWU submissions also repeatedly cite the Quinlan and Wright Report prepared
28 Australian Bureau of Statistics (2013), Causes of Death, Australia, 2012 (Cat. 3303.0), ABS, Canberra.
29 Final 2013 Fatality data was unavailable from the BITRE Road Deaths Australia Database at the time of
writing. In 2012, there were 246 heavy vehicle fatalities (148 articulated, 98 rigids) of a total 1303 total road deaths. 30
OECD (2011), op cit 31
TWU submission to this Review, p 3. 32
TWU (2011), Make Our Roads Safer for All Australians: Submission to the House Standing Committee on Infrastructure and Communications with Regards to the Road Safety Remuneration Bill 2011, Canberra, p.7.http://www.aph.gov.au/parliamentary_business/committees/house_of_representatives_committees?url=ic/24nov/subs.htm (accessed on 7 April 2014).

31
for the NTC in 2008.33 This report, which appears to have been highly influential in the decision to
establish the Tribunal, also presents a picture of an industry with poor safety performance that has
failed to improve over time. For example, it states:
"In Australia there has been no significant shift in the annual number of fatalities resulting
from crashes involving articulated trucks between the early 1990s and 2007 despite an
overall decline in the annual road toll."34
This assessment clearly indicates a view that the performance of the heavy vehicle sector in recent
years has been poor relative to that of the road transport industry as a whole. Moreover, given
improving road safety performance in all developed countries over the past two decades, it also
suggests a conclusion that the Australian heavy vehicle sector has performed poorly relative to its
counterparts in other countries. Indeed, this latter suggestion is also made explicit in the report:
"While it is difficult to make comparisons across countries available data for the late 1990s
heavy truck crash-related fatalities per 100 million kilometers travelled indicate that
Australia's record was significant [sic] worse than that of both the USA and UK."35
These observations clearly constitute a significant part of the Quinlan and Wright Report's rationale
for recommending that the safe rates proposal be adopted into legislation.
Additionally, some stakeholders have argued that the structure of the road freight industry gives rise
to significant economic distortions and inefficiencies and that regulation of remuneration and
related matters constitutes the only viable response to these underlying industry dynamics.
Specifically, the market for road freight services is said to be characterised by elements of
monopsony power in that a small number of large scale purchasers of services face large numbers of
small sellers. Long contacting chains exist in many cases with those at the lower end of these chains
having little control over their working conditions due to their very limited bargaining power.
For example, the TWU states in their submission to this Review36 that major retailers are extremely
significant players within the road transport industry, as are large, integrated, transport businesses
that exhibit market dominance. They cite the Full Bench of the NSW Industrial Relations Commission
(IRC) in support of this view, quoting in particular the judgement in the Mutual Responsibility for
Road Safety (State) Contract Determination Case as follows:
“(g) Commercial pressures, most notably from major retailers, have intensified, resulting in
the major transport companies tendering for contracts at very low rates and leading to the
result that they subcontract out any work that they cannot perform profitably. Commercial
33 Quinlan, M. & Wright, L. (2008). Remuneration and Safety in the Australian Heavy Vehicle Industry: A Review
Undertaken for the National Transport Commission, National Transport Commission, Canberra. Hereafter ’The Quinlan and Wright Report’. 34
ibid, p.8. 35
ibid 36
TWU submission to this Review, p.5.
32
pressures exercised by major retailers are in the form of directed delivery schedules placing
stress, and at time, unrealistic expectations on the driver actually performing the work.”37
This view has, however, been contested by other stakeholders who highlight the existence of several
large-scale providers of freight services and, conversely, emphasise the range of sectors contributing
the overall demand for freight services. For example, the submission to the Review received from
Coles Supermarkets included a commissioned market analysis completed by Deloitte Access
Economics which emphasises these points, noting that several different industries are large users of
road freight services (with manufacturing accounting for 27 per cent of the total by revenue,
followed by the retail (19 per cent), wholesale (13 per cent) and construction (12 per cent) sectors)
and emphasising the complex structure of the industry, reflecting the widely varying requirements of
businesses and their supply chains.
It is thus important to address the current and historical performance of the Australian road
transport industry carefully in order to determine to what extent the above views of key
stakeholders are supported by available data and, more generally, whether a strongly interventionist
regulatory approach such as minimum price regulation can be seen as potentially merited in the
current context.
4.3 Data summary and analysis: Safety performance of the Australian
heavy vehicle sector
The following presents a detailed overview of the evidence on the safety performance of the
Australian heavy vehicle sector. Safety performance can be assessed via time-series and cross-
sectional analysis - that is, relative to road transport in Australia generally and relative to the heavy
vehicle sector in comparable countries. The following considers each of these forms of analysis in
turn. A large part of the analysis focuses specifically on articulated trucks. This reflects the need to
assess the performance of the industry over the long term, combined with the fact that relevant
data in respect of rigid trucks has been reported only since 2004. The available data on rigid trucks is
discussed subsequently.
Time-series analysis – Heavy vehicle related fatalities 4.3.1
4.3.1.1 Articulated trucks
Graph 4.1 is drawn from Bureau of Industry, Transport and Regional Economics (BITRE) data and
shows changes in the number of road fatalities since 1986, the first year for which fatalities data for
articulated trucks are included in the Australian Transport Safety Bureau (ATSB) statistical summary.
The graph compares changes in the total number of road fatalities with changes in road fatalities
involving articulated trucks.38 In each case, fatalities in a given year are expressed as a percentage of
their 1986 level.
37 Transport Industry – Mutual Reasonability for Road Safety (State) Award and Contract Determination (no.2),
Re [20066] NSW IRC 328. 38
As indicated below, separate data on rigid trucks has not been published until relatively recently. Thus, in order to obtain useable long-term data, it is necessary to focus on articulated trucks. While there appear to be
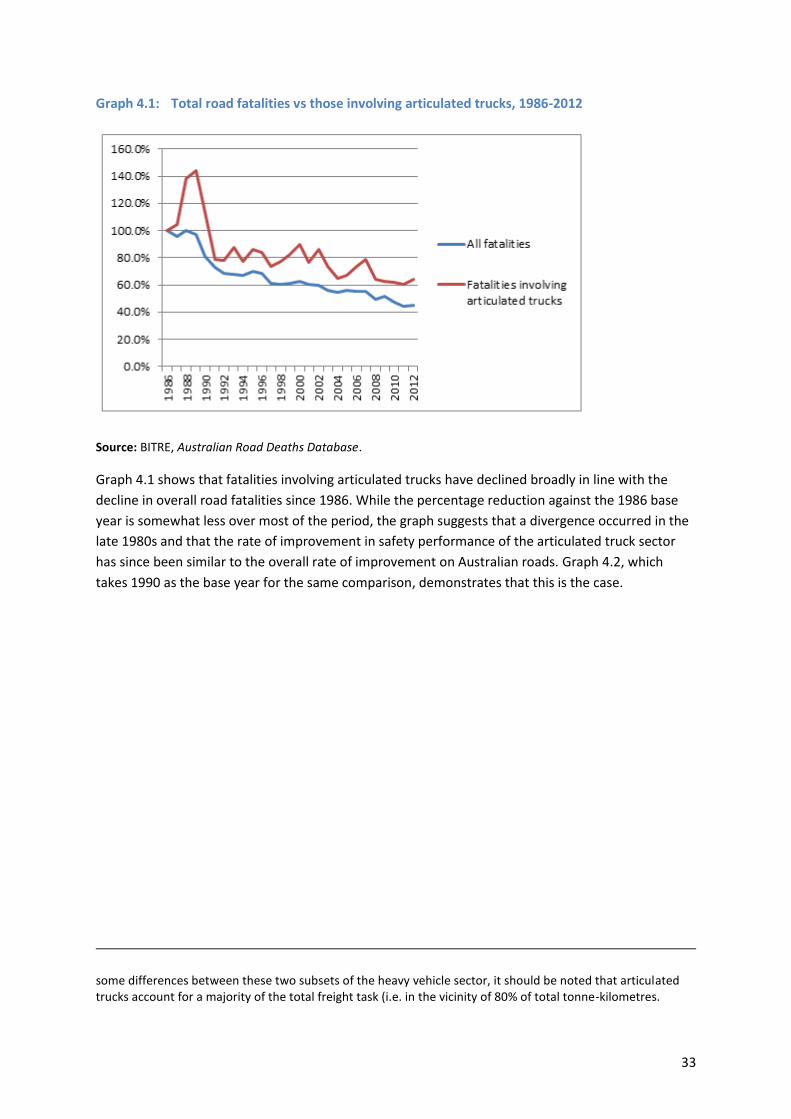
33
Graph 4.1: Total road fatalities vs those involving articulated trucks, 1986-2012
Source: BITRE, Australian Road Deaths Database.
Graph 4.1 shows that fatalities involving articulated trucks have declined broadly in line with the
decline in overall road fatalities since 1986. While the percentage reduction against the 1986 base
year is somewhat less over most of the period, the graph suggests that a divergence occurred in the
late 1980s and that the rate of improvement in safety performance of the articulated truck sector
has since been similar to the overall rate of improvement on Australian roads. Graph 4.2, which
takes 1990 as the base year for the same comparison, demonstrates that this is the case.
some differences between these two subsets of the heavy vehicle sector, it should be noted that articulated trucks account for a majority of the total freight task (i.e. in the vicinity of 80% of total tonne-kilometres.

34
Graph 4.2: Total road fatalities vs those involving articulated trucks, 1990-2012
Source: BITRE, Australian Road Deaths Database.
Graph 4.2 shows that the proportionate decline in fatalities involving articulated trucks has been
essentially identical to the proportionate decline in all road fatalities in the period 1990-2012. Closer
examination indicates that the performance of the articulated truck sector has been relatively better
than that of road transport industry as a whole throughout most of the period, but that a number of
transient ’spikes’ in fatality numbers have seen the two series intersect at several points including
the most recent years (i.e. 2011 and 2012). The smaller absolute number of fatalities involving
articulated trucks39 is, unsurprisingly, associated with a greater degree of year to year volatility in the
data.
Graph 4.3 below plots articulated truck-related fatalities as a percentage of total fatalities since
1986.
39 Vis-a-vis the road transport fleet as a whole.
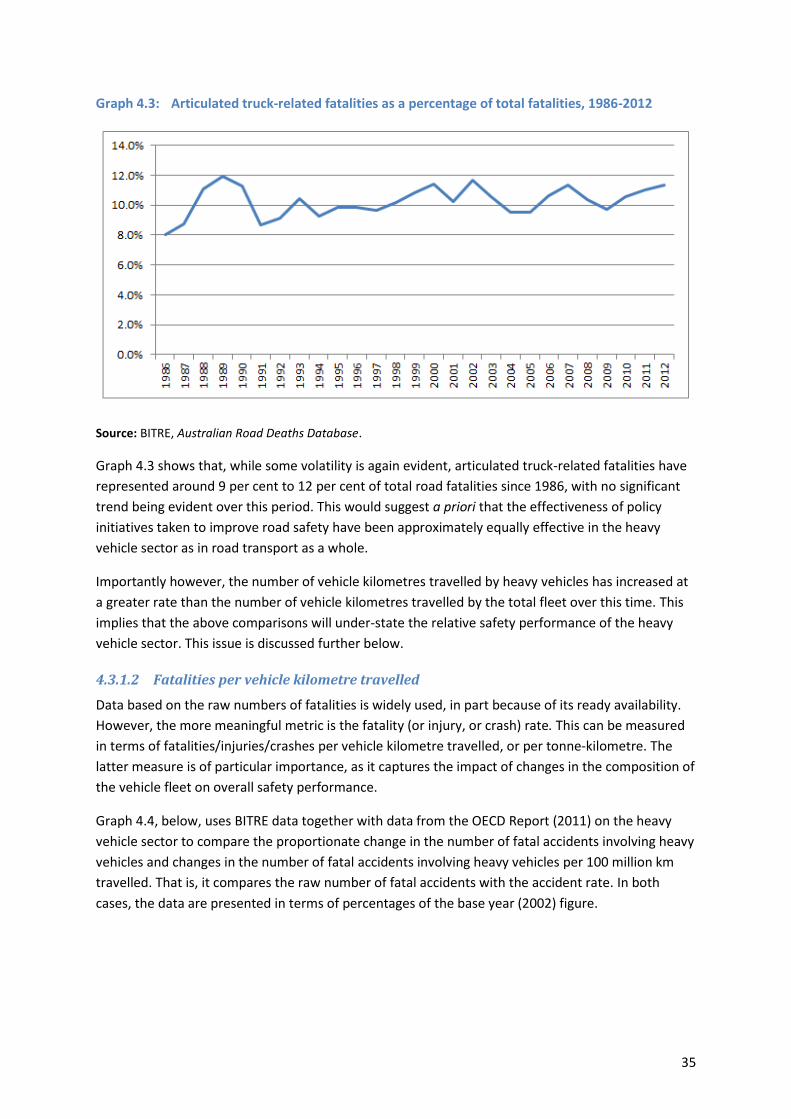
35
Graph 4.3: Articulated truck-related fatalities as a percentage of total fatalities, 1986-2012
Source: BITRE, Australian Road Deaths Database.
Graph 4.3 shows that, while some volatility is again evident, articulated truck-related fatalities have
represented around 9 per cent to 12 per cent of total road fatalities since 1986, with no significant
trend being evident over this period. This would suggest a priori that the effectiveness of policy
initiatives taken to improve road safety have been approximately equally effective in the heavy
vehicle sector as in road transport as a whole.
Importantly however, the number of vehicle kilometres travelled by heavy vehicles has increased at
a greater rate than the number of vehicle kilometres travelled by the total fleet over this time. This
implies that the above comparisons will under-state the relative safety performance of the heavy
vehicle sector. This issue is discussed further below.
4.3.1.2 Fatalities per vehicle kilometre travelled
Data based on the raw numbers of fatalities is widely used, in part because of its ready availability.
However, the more meaningful metric is the fatality (or injury, or crash) rate. This can be measured
in terms of fatalities/injuries/crashes per vehicle kilometre travelled, or per tonne-kilometre. The
latter measure is of particular importance, as it captures the impact of changes in the composition of
the vehicle fleet on overall safety performance.
Graph 4.4, below, uses BITRE data together with data from the OECD Report (2011) on the heavy
vehicle sector to compare the proportionate change in the number of fatal accidents involving heavy
vehicles and changes in the number of fatal accidents involving heavy vehicles per 100 million km
travelled. That is, it compares the raw number of fatal accidents with the accident rate. In both
cases, the data are presented in terms of percentages of the base year (2002) figure.
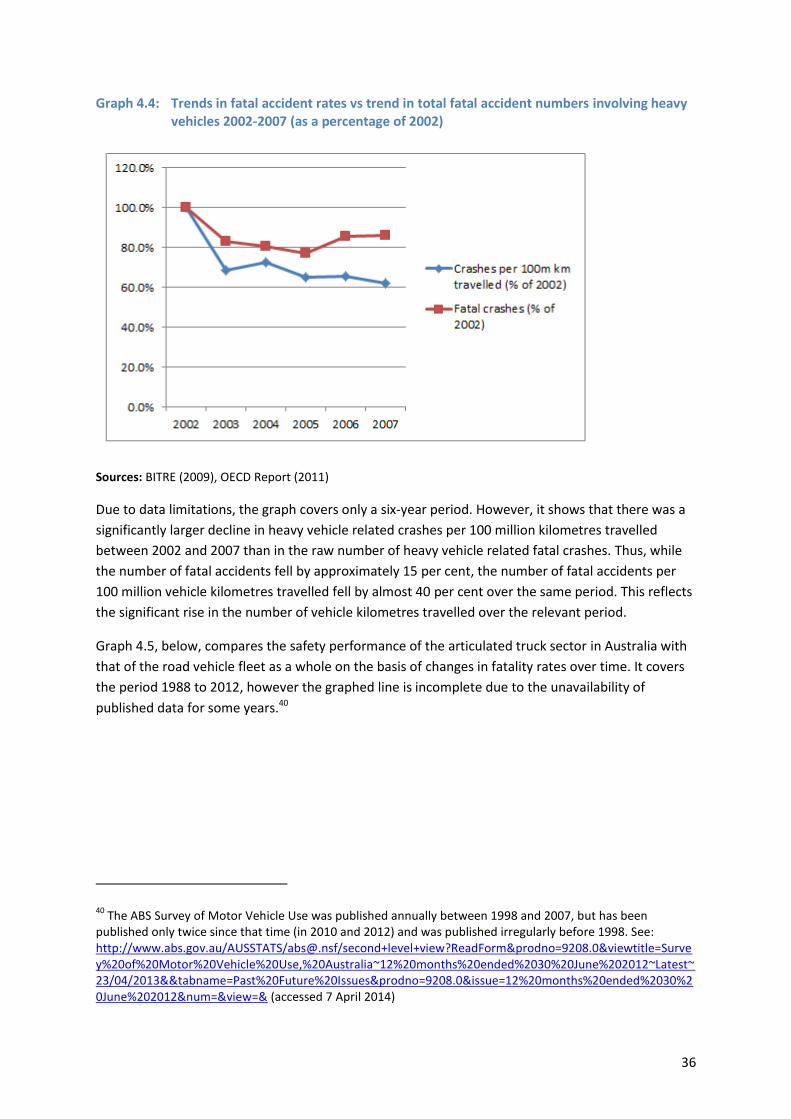
36
Graph 4.4: Trends in fatal accident rates vs trend in total fatal accident numbers involving heavy vehicles 2002-2007 (as a percentage of 2002)
Sources: BITRE (2009), OECD Report (2011)
Due to data limitations, the graph covers only a six-year period. However, it shows that there was a
significantly larger decline in heavy vehicle related crashes per 100 million kilometres travelled
between 2002 and 2007 than in the raw number of heavy vehicle related fatal crashes. Thus, while
the number of fatal accidents fell by approximately 15 per cent, the number of fatal accidents per
100 million vehicle kilometres travelled fell by almost 40 per cent over the same period. This reflects
the significant rise in the number of vehicle kilometres travelled over the relevant period.
Graph 4.5, below, compares the safety performance of the articulated truck sector in Australia with
that of the road vehicle fleet as a whole on the basis of changes in fatality rates over time. It covers
the period 1988 to 2012, however the graphed line is incomplete due to the unavailability of
published data for some years.40
40 The ABS Survey of Motor Vehicle Use was published annually between 1998 and 2007, but has been
published only twice since that time (in 2010 and 2012) and was published irregularly before 1998. See: http://www.abs.gov.au/AUSSTATS/[email protected]/second+level+view?ReadForm&prodno=9208.0&viewtitle=Survey%20of%20Motor%20Vehicle%20Use,%20Australia~12%20months%20ended%2030%20June%202012~Latest~23/04/2013&&tabname=Past%20Future%20Issues&prodno=9208.0&issue=12%20months%20ended%2030%20June%202012&num=&view=& (accessed 7 April 2014)
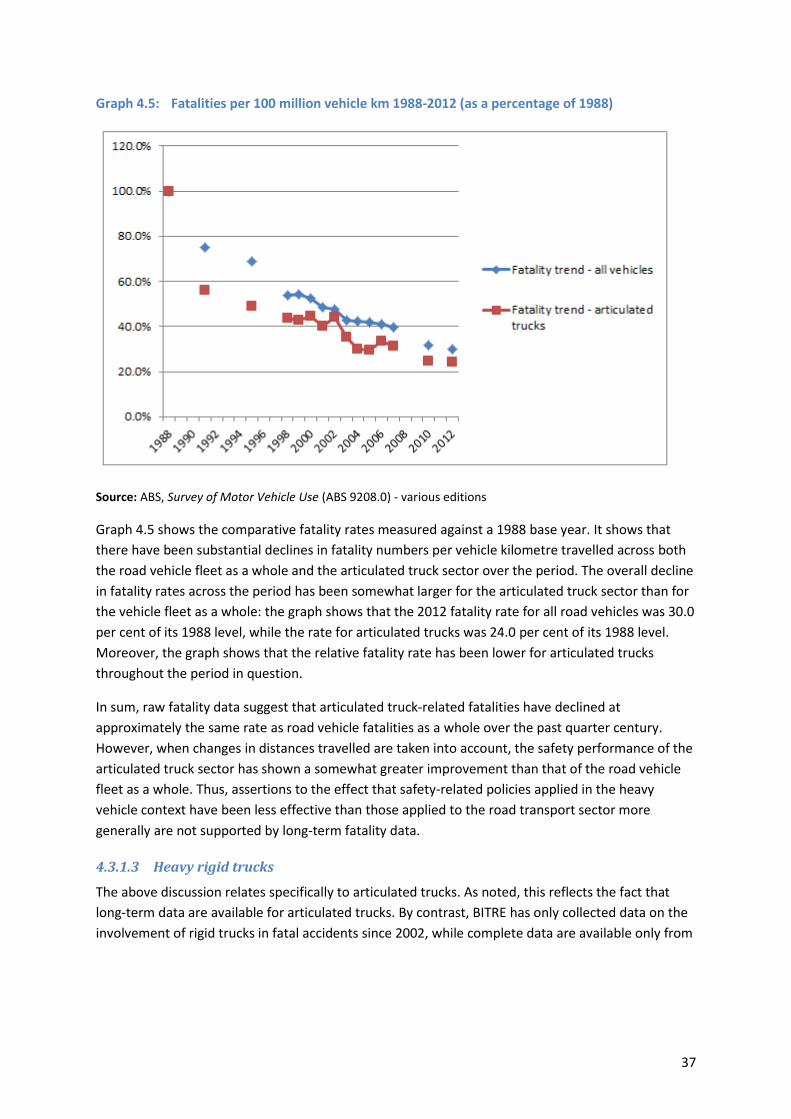
37
Graph 4.5: Fatalities per 100 million vehicle km 1988-2012 (as a percentage of 1988)
Source: ABS, Survey of Motor Vehicle Use (ABS 9208.0) - various editions
Graph 4.5 shows the comparative fatality rates measured against a 1988 base year. It shows that
there have been substantial declines in fatality numbers per vehicle kilometre travelled across both
the road vehicle fleet as a whole and the articulated truck sector over the period. The overall decline
in fatality rates across the period has been somewhat larger for the articulated truck sector than for
the vehicle fleet as a whole: the graph shows that the 2012 fatality rate for all road vehicles was 30.0
per cent of its 1988 level, while the rate for articulated trucks was 24.0 per cent of its 1988 level.
Moreover, the graph shows that the relative fatality rate has been lower for articulated trucks
throughout the period in question.
In sum, raw fatality data suggest that articulated truck-related fatalities have declined at
approximately the same rate as road vehicle fatalities as a whole over the past quarter century.
However, when changes in distances travelled are taken into account, the safety performance of the
articulated truck sector has shown a somewhat greater improvement than that of the road vehicle
fleet as a whole. Thus, assertions to the effect that safety-related policies applied in the heavy
vehicle context have been less effective than those applied to the road transport sector more
generally are not supported by long-term fatality data.
4.3.1.3 Heavy rigid trucks
The above discussion relates specifically to articulated trucks. As noted, this reflects the fact that
long-term data are available for articulated trucks. By contrast, BITRE has only collected data on the
involvement of rigid trucks in fatal accidents since 2002, while complete data are available only from
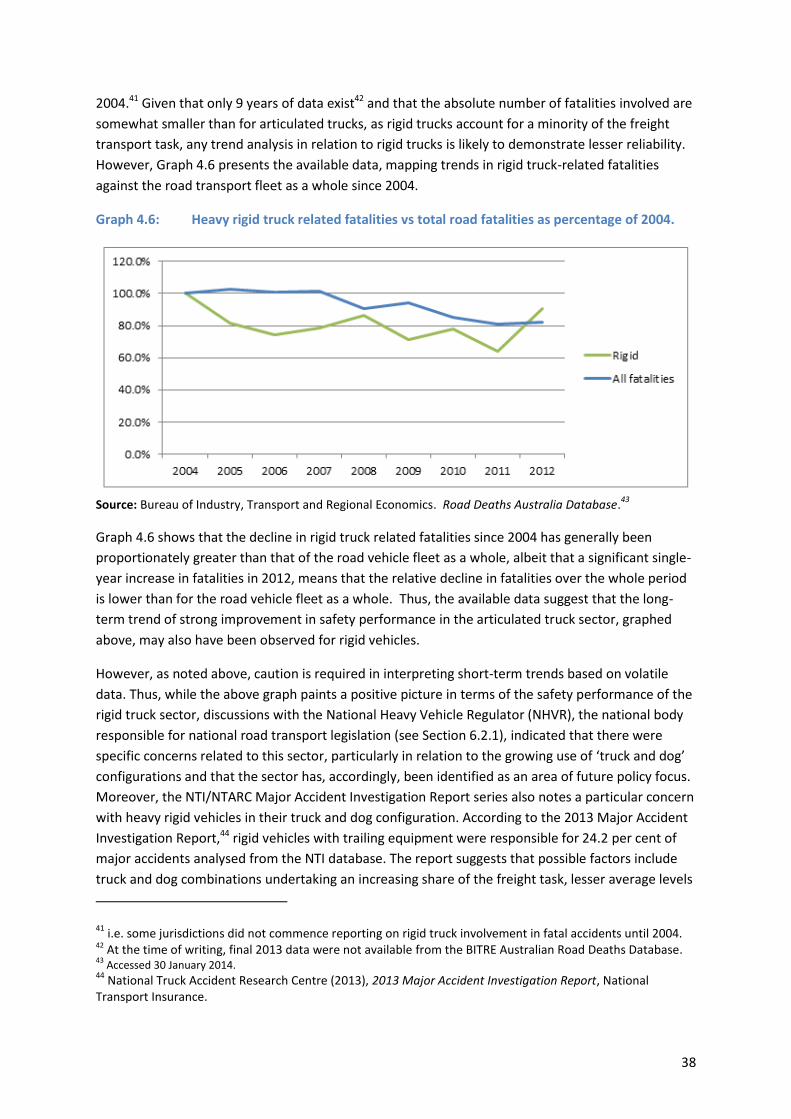
38
2004.41 Given that only 9 years of data exist42 and that the absolute number of fatalities involved are
somewhat smaller than for articulated trucks, as rigid trucks account for a minority of the freight
transport task, any trend analysis in relation to rigid trucks is likely to demonstrate lesser reliability.
However, Graph 4.6 presents the available data, mapping trends in rigid truck-related fatalities
against the road transport fleet as a whole since 2004.
Graph 4.6: Heavy rigid truck related fatalities vs total road fatalities as percentage of 2004.
Source: Bureau of Industry, Transport and Regional Economics. Road Deaths Australia Database.
43
Graph 4.6 shows that the decline in rigid truck related fatalities since 2004 has generally been
proportionately greater than that of the road vehicle fleet as a whole, albeit that a significant single-
year increase in fatalities in 2012, means that the relative decline in fatalities over the whole period
is lower than for the road vehicle fleet as a whole. Thus, the available data suggest that the long-
term trend of strong improvement in safety performance in the articulated truck sector, graphed
above, may also have been observed for rigid vehicles.
However, as noted above, caution is required in interpreting short-term trends based on volatile
data. Thus, while the above graph paints a positive picture in terms of the safety performance of the
rigid truck sector, discussions with the National Heavy Vehicle Regulator (NHVR), the national body
responsible for national road transport legislation (see Section 6.2.1), indicated that there were
specific concerns related to this sector, particularly in relation to the growing use of ‘truck and dog’
configurations and that the sector has, accordingly, been identified as an area of future policy focus.
Moreover, the NTI/NTARC Major Accident Investigation Report series also notes a particular concern
with heavy rigid vehicles in their truck and dog configuration. According to the 2013 Major Accident
Investigation Report,44 rigid vehicles with trailing equipment were responsible for 24.2 per cent of
major accidents analysed from the NTI database. The report suggests that possible factors include
truck and dog combinations undertaking an increasing share of the freight task, lesser average levels
41 i.e. some jurisdictions did not commence reporting on rigid truck involvement in fatal accidents until 2004.
42 At the time of writing, final 2013 data were not available from the BITRE Australian Road Deaths Database. 43
Accessed 30 January 2014. 44
National Truck Accident Research Centre (2013), 2013 Major Accident Investigation Report, National Transport Insurance.

39
of skill and experience among heavy rigid drivers than articulated truck drivers45 and less
enforcement in this sector than in line haul driving.
In sum, while the limited aggregate data available from the BITRE suggests that the rigid truck sector
appears to demonstrate a similar trend of improved safety performance as the articulated truck
sector, some safety concerns that are specific to this sector have been identified by experts in the
field.
4.3.1.4 Safety impact of changes in fleet composition
As discussed in the OECD Report (2011),46 changing the composition of the heavy vehicle fleet can
have a substantial impact on overall safety performance. As a general rule, historical data indicate
that a given freight task is likely to be completed with better safety outcomes if the proportion of
heavier trucks is increased. This reflects the fact that, while the fatality rate associated with heavy
vehicles tends to be higher on a per kilometre travelled basis, the number of vehicle kilometres
travelled is substantially smaller where heavier vehicles are substituted. Graphs 4.7 and 4.8, below,
highlight this point by comparing fatality rates associated with the use of rigid and articulated
vehicles on a per kilometre travelled basis (Graph 4.7) and a per tonne kilometre basis (Graph 4.8).
Graph 4.7: Fatalities per 100 million kilometres - rigid and articulated trucks, 2004-2012 (missing 2008, 2008 and 2011 data)
Source: ABS, Survey of Motor Vehicle Use (ABS 9208.0) - various editions
45 For major loss incidents involving rigid with dog and or trailers analysed by NTI, 31% of drivers had less than
5 years’ experience. 46
OECD (2011), op cit
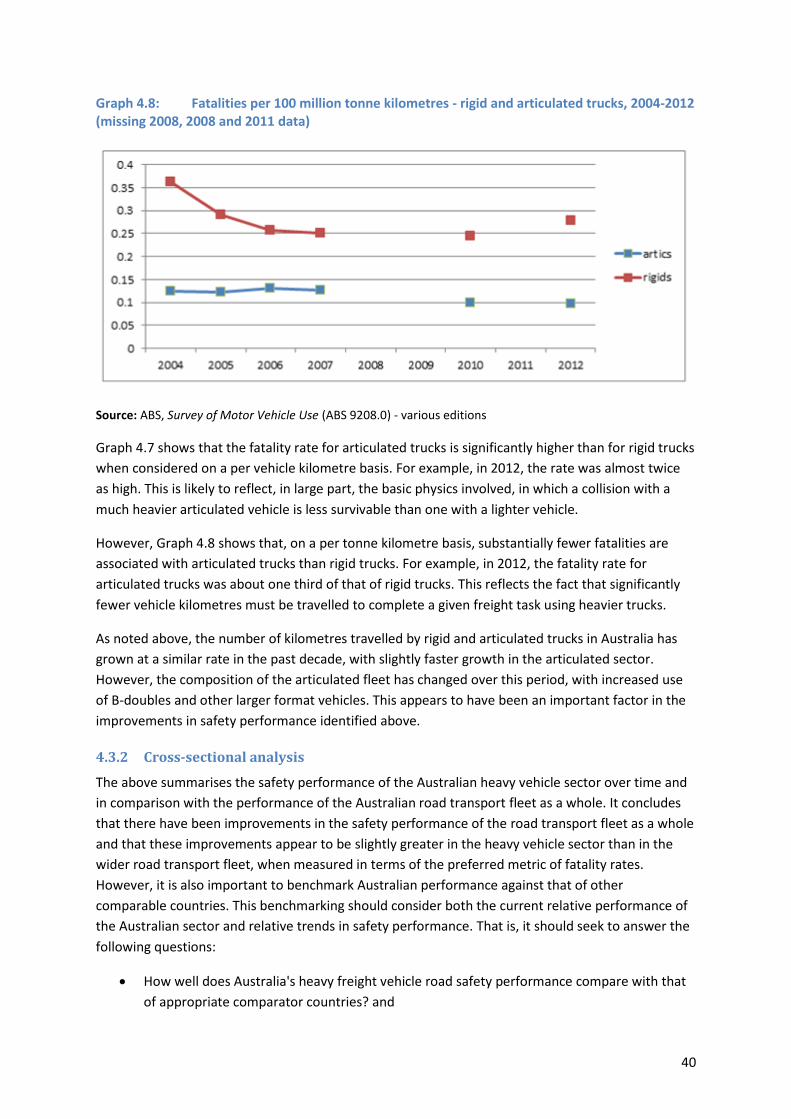
40
Graph 4.8: Fatalities per 100 million tonne kilometres - rigid and articulated trucks, 2004-2012 (missing 2008, 2008 and 2011 data)
Source: ABS, Survey of Motor Vehicle Use (ABS 9208.0) - various editions
Graph 4.7 shows that the fatality rate for articulated trucks is significantly higher than for rigid trucks
when considered on a per vehicle kilometre basis. For example, in 2012, the rate was almost twice
as high. This is likely to reflect, in large part, the basic physics involved, in which a collision with a
much heavier articulated vehicle is less survivable than one with a lighter vehicle.
However, Graph 4.8 shows that, on a per tonne kilometre basis, substantially fewer fatalities are
associated with articulated trucks than rigid trucks. For example, in 2012, the fatality rate for
articulated trucks was about one third of that of rigid trucks. This reflects the fact that significantly
fewer vehicle kilometres must be travelled to complete a given freight task using heavier trucks.
As noted above, the number of kilometres travelled by rigid and articulated trucks in Australia has
grown at a similar rate in the past decade, with slightly faster growth in the articulated sector.
However, the composition of the articulated fleet has changed over this period, with increased use
of B-doubles and other larger format vehicles. This appears to have been an important factor in the
improvements in safety performance identified above.
Cross-sectional analysis 4.3.2
The above summarises the safety performance of the Australian heavy vehicle sector over time and
in comparison with the performance of the Australian road transport fleet as a whole. It concludes
that there have been improvements in the safety performance of the road transport fleet as a whole
and that these improvements appear to be slightly greater in the heavy vehicle sector than in the
wider road transport fleet, when measured in terms of the preferred metric of fatality rates.
However, it is also important to benchmark Australian performance against that of other
comparable countries. This benchmarking should consider both the current relative performance of
the Australian sector and relative trends in safety performance. That is, it should seek to answer the
following questions:
How well does Australia's heavy freight vehicle road safety performance compare with that
of appropriate comparator countries? and

41
How has the rate of improvement of Australia's performance compared with that of other
countries?
4.3.2.1 The Truck Safety Benchmarking Study (2002)
The then National Road Transport Commission (NRTC) received a commissioned report in 2002
which examined Australia's heavy vehicle safety record in an international context, using data from
the 1990s. The report47 compared Australia's performance with that of seven broadly comparable
countries - New Zealand, Great Britain, France, Germany, Sweden, Canada and the United States. It
found that Australia’s heavy vehicle fatality rate, in fatalities per vehicle kilometres travelled, was
approximately in the middle of the range of the countries chosen for comparison. Fatality rates were
found to be:
47 per cent higher than those of the United States and 39 per cent higher than those of
Great Britain;
comparable with Canada and Germany; and
45 per cent below France and 55 per cent below New Zealand.
The study considered the reasons for Australia's apparently poor performance relative to the United
States and Great Britain. It concluded that the higher truck fatality rates on Australian roads could
largely be explained by the lower proportion of truck travel on divided and limited access roads, with
truck speed limits possibly also being a factor. Problems of low freight rates having an adverse
impact on safety were not mentioned in this paper.
4.3.2.2 Potter (2008)
Dr Jeff Potter of the NTC presented a comparison of Australia's heavy vehicle fatality rate with that
of four other countries at a 2008 International Symposium on Heavy Vehicle Transport Technology.
This comparison used data from 2001 to 2005. Graph 4.9, below, is reproduced from this
presentation. It shows that Australia's fatality rate was below that of Denmark but above that of the
other three countries compared (Belgium, France and the United States).
47 Haworth, N., Vulcan, P. & Sweatman, P. (2002), Truck Safety Benchmarking Study, Paper prepared for the
National Road Transport Commission, Canberra.

42
Graph 4.9: International Comparisons of Heavy Vehicle Fatality Rates per 100 million kilometres travelled
Source: Analysis of International Heavy Vehicle Safety Data. Paper presented by Jeff Potter, National Transport
Commission, to the 10th International Symposium on Heavy Vehicle Transport Technology. Paris, May 19-22,
2008.
4.3.2.3 OECD Report (2011)
The most recent international comparative data is found in the OECD Report (2011).48 This report
includes data from 2001 to 2007 and shows that truck fatality rates declined in most, but not all,
countries over this period. Graph 4.10 and Table 4.1 below are reproduced from this report. They
provide data for nine countries, including Australia. The data shows that Switzerland has a
substantially lower fatality rate than any of the other countries included, while South Africa49 and, to
a much lesser extent, Denmark have substantially higher rates. The majority of the remaining
countries appear to have broadly similar fatality rates.
48 OECD (2011), op cit
49 Note that the data for South Africa are divided by 10 for plotting on the graph.
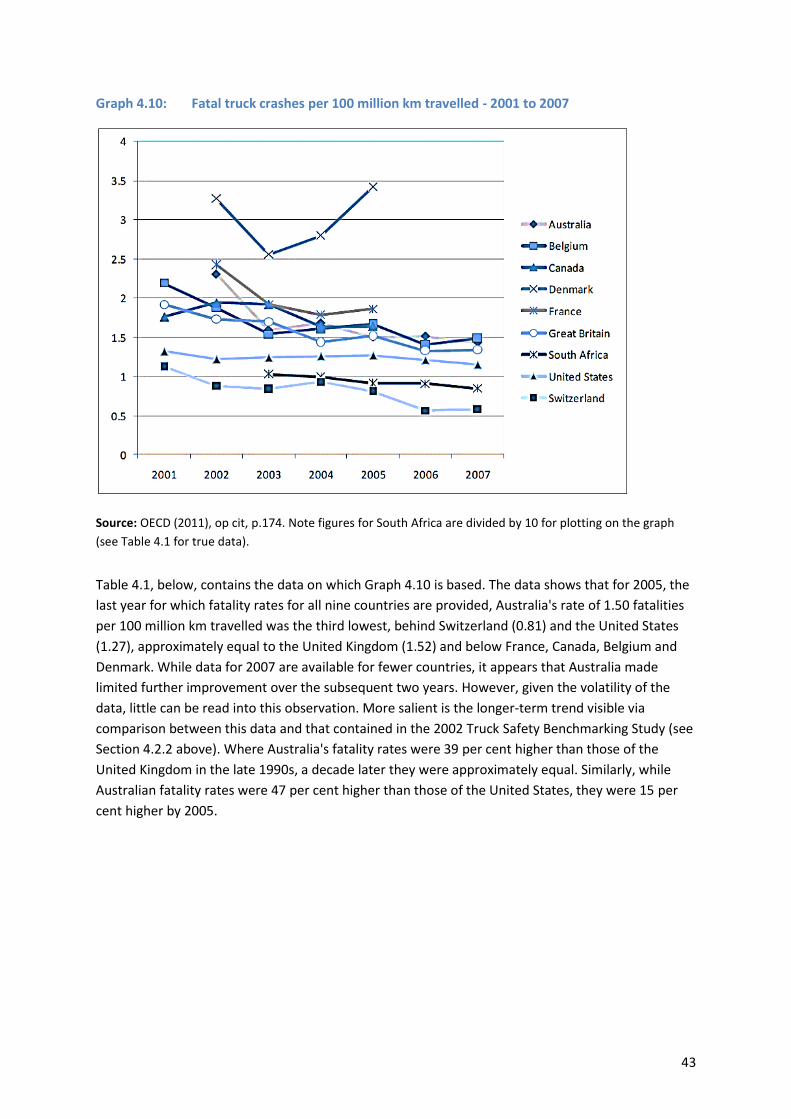
43
Graph 4.10: Fatal truck crashes per 100 million km travelled - 2001 to 2007
Source: OECD (2011), op cit, p.174. Note figures for South Africa are divided by 10 for plotting on the graph
(see Table 4.1 for true data).
Table 4.1, below, contains the data on which Graph 4.10 is based. The data shows that for 2005, the
last year for which fatality rates for all nine countries are provided, Australia's rate of 1.50 fatalities
per 100 million km travelled was the third lowest, behind Switzerland (0.81) and the United States
(1.27), approximately equal to the United Kingdom (1.52) and below France, Canada, Belgium and
Denmark. While data for 2007 are available for fewer countries, it appears that Australia made
limited further improvement over the subsequent two years. However, given the volatility of the
data, little can be read into this observation. More salient is the longer-term trend visible via
comparison between this data and that contained in the 2002 Truck Safety Benchmarking Study (see
Section 4.2.2 above). Where Australia's fatality rates were 39 per cent higher than those of the
United Kingdom in the late 1990s, a decade later they were approximately equal. Similarly, while
Australian fatality rates were 47 per cent higher than those of the United States, they were 15 per
cent higher by 2005.
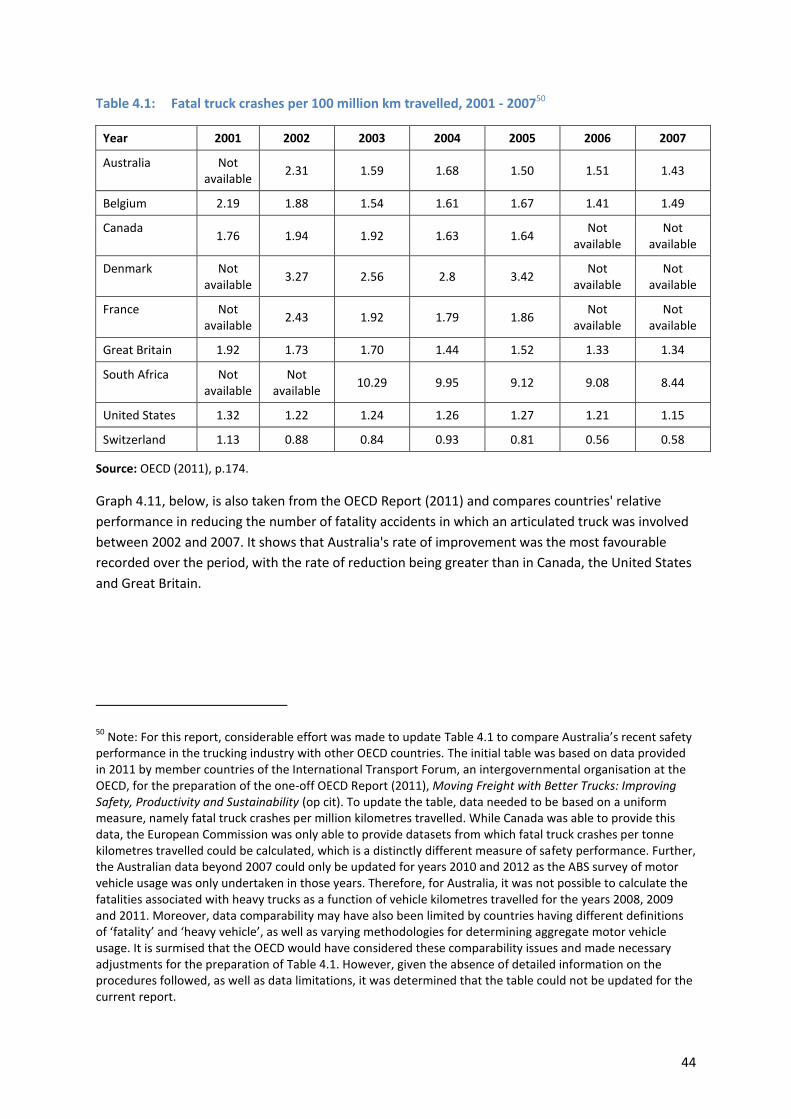
44
Table 4.1: Fatal truck crashes per 100 million km travelled, 2001 - 200750
Year 2001 2002 2003 2004 2005 2006 2007
Australia Not available
2.31 1.59 1.68 1.50 1.51 1.43
Belgium 2.19 1.88 1.54 1.61 1.67 1.41 1.49
Canada 1.76 1.94 1.92 1.63 1.64
Not available
Not available
Denmark Not available
3.27 2.56 2.8 3.42 Not
available Not
available
France Not available
2.43 1.92 1.79 1.86 Not
available Not
available
Great Britain 1.92 1.73 1.70 1.44 1.52 1.33 1.34
South Africa Not available
Not available
10.29 9.95 9.12 9.08 8.44
United States 1.32 1.22 1.24 1.26 1.27 1.21 1.15
Switzerland 1.13 0.88 0.84 0.93 0.81 0.56 0.58
Source: OECD (2011), p.174.
Graph 4.11, below, is also taken from the OECD Report (2011) and compares countries' relative
performance in reducing the number of fatality accidents in which an articulated truck was involved
between 2002 and 2007. It shows that Australia's rate of improvement was the most favourable
recorded over the period, with the rate of reduction being greater than in Canada, the United States
and Great Britain.
50 Note: For this report, considerable effort was made to update Table 4.1 to compare Australia’s recent safety
performance in the trucking industry with other OECD countries. The initial table was based on data provided in 2011 by member countries of the International Transport Forum, an intergovernmental organisation at the OECD, for the preparation of the one-off OECD Report (2011), Moving Freight with Better Trucks: Improving Safety, Productivity and Sustainability (op cit). To update the table, data needed to be based on a uniform measure, namely fatal truck crashes per million kilometres travelled. While Canada was able to provide this data, the European Commission was only able to provide datasets from which fatal truck crashes per tonne kilometres travelled could be calculated, which is a distinctly different measure of safety performance. Further, the Australian data beyond 2007 could only be updated for years 2010 and 2012 as the ABS survey of motor vehicle usage was only undertaken in those years. Therefore, for Australia, it was not possible to calculate the fatalities associated with heavy trucks as a function of vehicle kilometres travelled for the years 2008, 2009 and 2011. Moreover, data comparability may have also been limited by countries having different definitions of ‘fatality’ and ‘heavy vehicle’, as well as varying methodologies for determining aggregate motor vehicle usage. It is surmised that the OECD would have considered these comparability issues and made necessary adjustments for the preparation of Table 4.1. However, given the absence of detailed information on the procedures followed, as well as data limitations, it was determined that the table could not be updated for the current report.

45
Graph 4.11: Change in articulated vehicle fatality rate, 2002-2007
Source: OECD (2011), p.173.
A further comparison provided by the OECD Report (2011)51 is the contribution of heavy vehicle
related fatalities to overall road fatality numbers. The report states that the impact of truck crashes
on the overall toll of road fatalities varies substantially between countries, from a low 9.1 per cent in
Poland to 24.9 per cent in New Zealand.52 As noted above, Australia's rate averaged 16.8 in the five
years to 2012,53 suggesting that the relative contribution of heavy vehicles to overall road fatalities is
about in the middle of the range of other countries studied.54
4.3.2.3.1 Relative fatality rates
Much of the discussion surrounding the safe rates issue has focused on the fact that the fatality rate
for the heavy vehicle sector is substantially higher than that for the road vehicle fleet as a whole.
Hence, it is important to also assess this aspect of the safety performance of the industry in
international terms, benchmarking the Australian industry against that of other, relevant countries.
The OECD Report (2011)55 points out that the fatality rate in the heavy vehicle sector is higher than
that of the road transport fleet as a whole in all of the countries included in its analysis. However,
the extent of this difference varies widely. Table 4.2 below is reproduced from the OECD Report
51 OECD (2011), op cit
52 ibid, p.172
53 Includes fatalities involving both articulated and rigid trucks - a total of 173 fatalities involving heavy
vehicles, compared with 1,193 total road fatalities. 54
Neither specific country by country data nor average rates are provided in the report. Hence, this conclusion is somewhat speculative. 55
OECD (2011), op cit

46
(2011) and compares twelve countries in terms of the ratio between the heavy vehicle fatality rate
(per 10,000 vehicles registered) and that for the all vehicles, using 2005 data.
Table 4.2: Ratio of fatality rates: Persons killed in truck crashes per 10,000 vehicles registered vs persons killed in any accident per 10,000 vehicles registered, 2005
Country Trucks - Fatalities per
10,000 registered vehicles All Vehicles - Fatalities per 10,000 registered vehicles
Ratio of fatality rates for fatal crashes involving trucks: All fatal crashes
Switzerland 1.5 0.8 1.9
South Africa 52.4 21.0 2.5
Germany 3.1 1.0 3.1
United States 6.2 1.8 3.4
Australia 5.6 1.2 4.6
Canada 8.8 1.5 5.9
Netherlands 7.1 0.9 7.9
France 12.1 1.4 8.7
Sweden 8.1 0.9 9.0
Great Britain 11.2 1.0 11.5
Denmark 18.1 1.3 13.9
Belgium 34.0 1.8 18.9
Source: OECD (2011), p.176.
Table 4.2 above shows that the ratios reported for the 12 countries vary by an order of magnitude,
from a low of 1.9:1 to a high of 18.9:1. Australia ranks fifth lowest of the 12 countries included in the
table, with a ratio of 4.6:1. This implies that the relative safety performance of Australia's heavy
vehicle industry is poorer than that of the United States (3.4:1), better than that of Canada (5.9:1)
and clearly superior to that of Great Britain (11.5:1).
The OECD Report (2011)56 highlights the fact that the differences in truck fatality rates are
substantially larger than those for all vehicles. For example, while Australia and Denmark have
similar overall fatality rates, Denmark has a much higher truck fatality rate. The OECD suggests that
differences in the number of vehicle kilometres travelled are likely to constitute a significant part of
the explanation for these differences and presents an additional table, in which the fatality rates are
calculated on a per 100 million vehicle kilometre travelled basis. This is reproduced below as
Table 4.3.
56 ibid

47
Table 4.3: Ratio of fatality rates: Persons killed in truck crashes per 100 million vehicles kilometres vs persons killed in any accident per 100 million vehicle kilometres, 2005
Country Trucks - Fatalities per 100
million vehicle kilometres travelled
All Vehcles - Fatalities per 100 million vehicle
kilometres travelled
Ratio of fatality rates for fatal crashes involving trucks: All fatal crashes
South Africa 12.5 11.3 1.1
Switzerland 0.8 0.7 1.2
Belgium 1.9 1.2 1.5
United States 1.5 0.9 1.6
France 2.0 1.0 2.0
Germany 1.5 0.7 2.1
Australia 1.7 0.8 2.2
Canada 2.0 0.9 2.2
Sweden 1.6 0.6 2.7
Great Britain 1.7 0.6 2.8
Denmark 3.0 0.8 3.8
Source: OECD (2011), op cit, p.176.
Table 4.3 above shows a significantly smaller variation in the fatality ratios than Table 4.2,
confirming the hypothesis that differences in exposure (i.e. in distances travelled by the truck fleet)
account for a significant proportion of the variation seen in Table 4.2.
Table 4.3 also shows that Australia's fatality ratio is the fifth highest, when considered on this metric,
being slightly above France and Germany and equal to Canada, but remaining below that of
Denmark, Great Britain and Sweden. Conversely, Australia's ratio of 2.2 is in the lower half of the
observed range of 1.1 - 3.8.
Table 4.4 below compares these results with those of a similar analysis published in 2011, using
earlier data, in order to assess changes in the fatality ratio over time. Equivalent data are available
for only seven of the 11 countries included in the above tables.
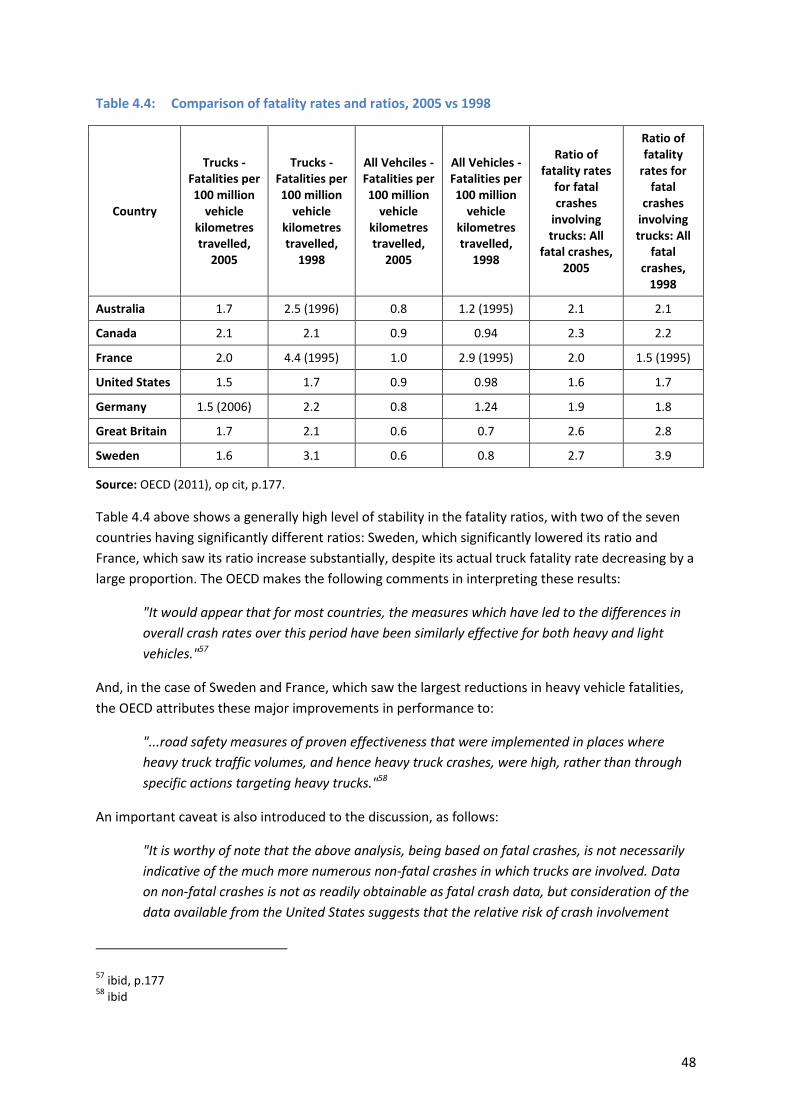
48
Table 4.4: Comparison of fatality rates and ratios, 2005 vs 1998
Country
Trucks - Fatalities per 100 million
vehicle kilometres travelled,
2005
Trucks - Fatalities per 100 million
vehicle kilometres travelled,
1998
All Vehciles - Fatalities per 100 million
vehicle kilometres travelled,
2005
All Vehicles - Fatalities per 100 million
vehicle kilometres travelled,
1998
Ratio of fatality rates
for fatal crashes
involving trucks: All
fatal crashes, 2005
Ratio of fatality
rates for fatal
crashes involving trucks: All
fatal crashes,
1998
Australia 1.7 2.5 (1996) 0.8 1.2 (1995) 2.1 2.1
Canada 2.1 2.1 0.9 0.94 2.3 2.2
France 2.0 4.4 (1995) 1.0 2.9 (1995) 2.0 1.5 (1995)
United States 1.5 1.7 0.9 0.98 1.6 1.7
Germany 1.5 (2006) 2.2 0.8 1.24 1.9 1.8
Great Britain 1.7 2.1 0.6 0.7 2.6 2.8
Sweden 1.6 3.1 0.6 0.8 2.7 3.9
Source: OECD (2011), op cit, p.177.
Table 4.4 above shows a generally high level of stability in the fatality ratios, with two of the seven
countries having significantly different ratios: Sweden, which significantly lowered its ratio and
France, which saw its ratio increase substantially, despite its actual truck fatality rate decreasing by a
large proportion. The OECD makes the following comments in interpreting these results:
"It would appear that for most countries, the measures which have led to the differences in
overall crash rates over this period have been similarly effective for both heavy and light
vehicles."57
And, in the case of Sweden and France, which saw the largest reductions in heavy vehicle fatalities,
the OECD attributes these major improvements in performance to:
"...road safety measures of proven effectiveness that were implemented in places where
heavy truck traffic volumes, and hence heavy truck crashes, were high, rather than through
specific actions targeting heavy trucks."58
An important caveat is also introduced to the discussion, as follows:
"It is worthy of note that the above analysis, being based on fatal crashes, is not necessarily
indicative of the much more numerous non-fatal crashes in which trucks are involved. Data
on non-fatal crashes is not as readily obtainable as fatal crash data, but consideration of the
data available from the United States suggests that the relative risk of crash involvement
57 ibid, p.177
58 ibid

49
may be significantly different for nonfatal crashes, with trucks showing a lower relative crash
risk in these less-severe crashes (Figure 6.5a and 6.5b). This suggests that trucks are less
likely to become involved in a crash compared with other vehicle types but, once involved
in a crash, it is more likely to be fatal."59 (emphasis added)
The United States data referred to in the OECD Report (2011) show that, while heavy trucks had a
fatal accident rate about 1.6 times that of all vehicles in the relevant period (2001-2007), they had
an injury accident rate of around 0.6 times that of all vehicles over the same period. That is, trucks
were 40 per cent less likely than the road fleet average to be involved in an injury accident.
Australian data clearly suggest the same pattern. Injury data published by the Australian Institute of
Health and Welfare in 2012 show that, in 2008-09, around 4.0 per cent of serious traffic injuries
result from accidents in which heavy vehicles are involved,60 whereas heavy vehicles accounted for
8.4 per cent of total vehicle kilometres driven.61
The distinction drawn is important because it suggests that the apparently poorer safety record of
the heavy vehicle industry is a product of the fact that safety performance is, unsurprisingly, largely
measured in terms of fatalities. However, the accident rate of heavy vehicles appears to be
significantly below that of the road transport fleet as a whole. This implies that the higher fatality
rate observed in relation to heavy vehicles, which exists in all countries as shown above, is not a
product of less safe driving practices leading to higher accident involvement, since overall accident
involvement rates for heavy vehicles appear to be lower than those of light vehicles. Rather, the
explanation for overall higher fatality rates appears to lie with the physics of large vehicles and the
much greater inertia they bring to an accident, which leads to lesser survivability.
Accident causation 4.3.3
Figure 4.1, below, is reproduced from the OECD Report (2011) and provides a breakdown of the
cause of heavy vehicle collisions. It reports the results of the International Road Transport Union
(IRU) European Truck Accident Causation Study, published in 2007.
59 ibid
60 Australian Institute of Health and Welfare (2012), Serious Injury Due to Land Transport Accidents Australia
2008-09, p 15, (1,438 injuries were recorded, including 863 in cases where the other vehicle was a heavy vehicle and 517 for heavy vehicle occupants. Total serious injuries for the year were 34,116. 61
See ABS 9208.0 Survey of Motor Vehicle Use, ABS, Canberra, p.13. Data for 2011-12 used, as no edition of this document was published containing 2008-09 data. Data for 2012 compiled by the Review show a similar picture, with Victorian data showing 6.3 serious injuries per 100m vehicle km in the heavy vehicle sector compared with 8.5 serious injuries per 100m vehicle km for the road fleet as a whole and New South Wales data showing total injury rates of 29 per 100 million vehicle kilometres for heavy vehicles vs 34 per 100 million vehicle kilometres for the road transport fleet as a whole. Note that states’ crash and injury data are not comparable.
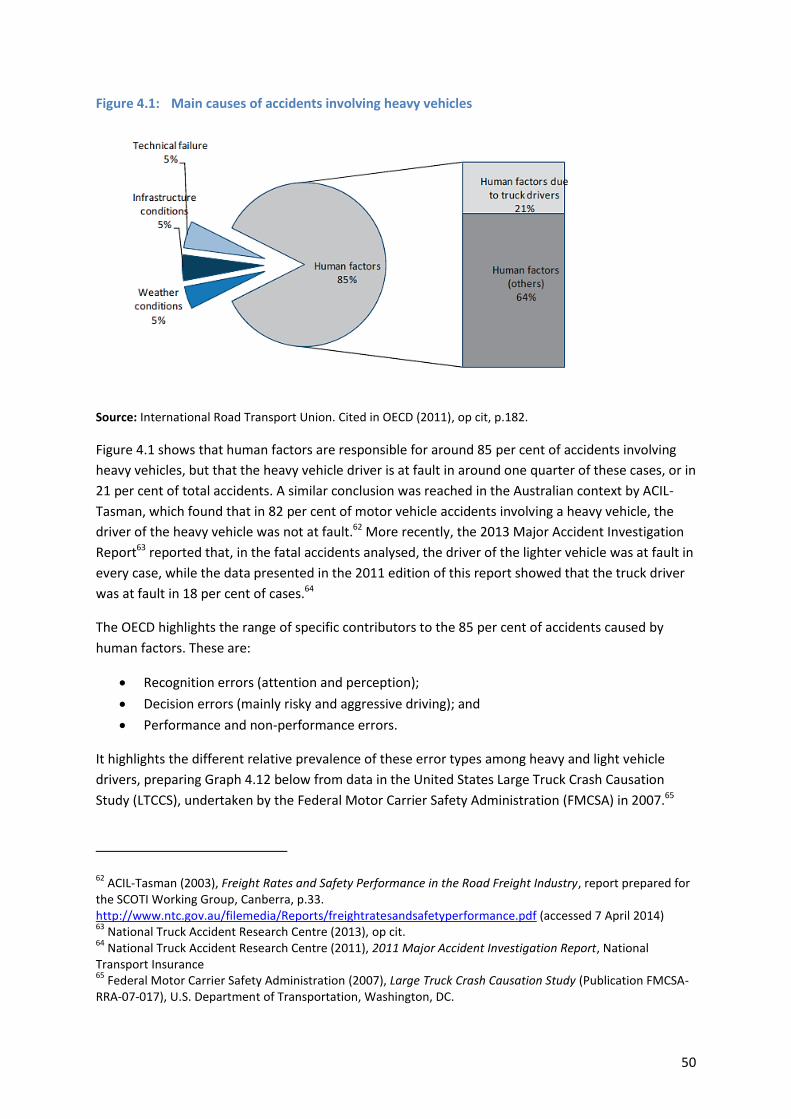
50
Figure 4.1: Main causes of accidents involving heavy vehicles
Source: International Road Transport Union. Cited in OECD (2011), op cit, p.182.
Figure 4.1 shows that human factors are responsible for around 85 per cent of accidents involving
heavy vehicles, but that the heavy vehicle driver is at fault in around one quarter of these cases, or in
21 per cent of total accidents. A similar conclusion was reached in the Australian context by ACIL-
Tasman, which found that in 82 per cent of motor vehicle accidents involving a heavy vehicle, the
driver of the heavy vehicle was not at fault.62 More recently, the 2013 Major Accident Investigation
Report63 reported that, in the fatal accidents analysed, the driver of the lighter vehicle was at fault in
every case, while the data presented in the 2011 edition of this report showed that the truck driver
was at fault in 18 per cent of cases.64
The OECD highlights the range of specific contributors to the 85 per cent of accidents caused by
human factors. These are:
Recognition errors (attention and perception);
Decision errors (mainly risky and aggressive driving); and
Performance and non-performance errors.
It highlights the different relative prevalence of these error types among heavy and light vehicle
drivers, preparing Graph 4.12 below from data in the United States Large Truck Crash Causation
Study (LTCCS), undertaken by the Federal Motor Carrier Safety Administration (FMCSA) in 2007.65
62 ACIL-Tasman (2003), Freight Rates and Safety Performance in the Road Freight Industry, report prepared for
the SCOTI Working Group, Canberra, p.33. http://www.ntc.gov.au/filemedia/Reports/freightratesandsafetyperformance.pdf (accessed 7 April 2014) 63
National Truck Accident Research Centre (2013), op cit. 64
National Truck Accident Research Centre (2011), 2011 Major Accident Investigation Report, National Transport Insurance 65
Federal Motor Carrier Safety Administration (2007), Large Truck Crash Causation Study (Publication FMCSA-RRA-07-017), U.S. Department of Transportation, Washington, DC.

51
Graph 4.12: Driver errors in the Large Truck Crash Causation Study (LTCCS)
Source: OECD (2011), op cit, p.183.
Graph 4.12 shows that recognition and decision errors are of primary significance for heavy vehicle
drivers, while light vehicle drivers are much more prone to performance and non-performance
errors. Within the categories of recognition and decision errors, fatigue is likely to be a contributor
to both error types, but predominantly affects recognition errors, while inappropriate speed is the
key element of decision errors.
In relation to fatigue, the LTCCS reported that:
“In crashes between trucks and passenger vehicles, driving too fast for conditions and fatigue
were important factors cited for both drivers. However, fatigue was coded twice as often for
passenger vehicle drivers, and speeding more often for truck drivers”. 66
That is, while fatigue was found to be one of several important contributors to accident causation,
the fatigue issue was identified as being significantly more likely to be the cause of an error made by
a passenger vehicle driver, leading to an accident involving a heavy vehicle, with fatigue on the part
of the heavy vehicle driver being less likely to be a causative factor. No equivalent Australian data
have been identified, however this United States data provides an important point of context to the
discussion of the impact of fatigue as a factor in heavy vehicle accidents.
In the Australian context, the dataset used to produce the NTI/NTARC Major Accident Investigation
Report67 shows that the proportion of accidents found to have been primarily caused by fatigue has
66 ibid
67 The National Truck Accident Research Centre, established by Australia's major heavy vehicle insurer,
National Transport Insurance, has published a bi-ennial since 2003. The Major Accident Investigation Report investigates the major causative factors in heavy vehicle accidents, using a structured sample of major

52
more than halved, from 26 per cent in 2003 to 11.9 per cent in 2011.68 Consistent with this, the
majority of accidents were found to occur on the outbound leg of a journey, despite the fact that
"...logic would suggest that the driver should be commencing the shift, well rested and fit for duty". 69
In 2011, 70.5 per cent of accidents occurred on the outbound leg. Moreover, by far the majority of
accidents occurred within the first four to five hours of the journey, with 68 per cent reported to
have occurred within 250 kilometres from departure, 85 per cent within 500 kilometres from
departure, and 90.1 per cent of accidents on outbound journeys occur within 250 kilometres of the
point of origin.
These observations suggest that the regulatory reforms in relation to fatigue management adopted
over the past decade have had significant benefits in practice, notwithstanding that fatigue
continues to be an important contributor to accident causation. Conversely, the Major Accident
Investigation Report indicates that there has been little change in the role of speed as a causal
factor, with speed being the major factor in 25.4 per cent of accidents analysed in 2011, compared
with 27.4 per cent in 2007.
Data on accident precursors 4.3.4
The previous sections have focused on fatalities associated with heavy vehicles, both because data is
the most readily available and comparable safety-related data, and because it constitutes a direct
measure of the most important negative outcome of poor safety practices. However, other
indicators can also be used to provide a broader picture of the safety performance of the heavy
vehicle sector.
The rationale for the establishment of the Tribunal is that by ensuring that ‘safe rates’ are paid
consistently in the industry, incentives for drivers to adopt unsafe behaviours which are likely to be
associated with increased accident risk will be diminished. In particular, it has been argued that
drivers will not face the same degree of economic pressure to drive at illegal and/or dangerous
speeds, and will also have lesser incentives to drive for excessive hours, and hence while fatigued, if
safe rates are paid.70
In this context, review of recent data on levels of compliance with speed and driving hours
regulation is of significant relevance. In general, these reports show that there remains a significant
incidence of non-compliance with these regulations, but that there have been substantial reductions
in the incidence of non-compliance in recent years.
The NTC's Reform Evaluation in the Road Transport Industry reports, published in September 2013
provide some comparative data on the incidence of infringements for speed and fatigue offences.
accidents - defined as those giving rise to an insurance claim for over $50,000. A total of 461 accidents were analysed for the most recent (2013) report. The 2013 report is based on data from 2011. 68
National Truck Accident Research Centre (2013), op cit, p 25. 69
ibid, p 21. 70
Other unsafe behaviours said to be associated with low rates include reduced maintenance and vehicle overloading. However, the key focus appears to be on speed, working hours and fatigue.
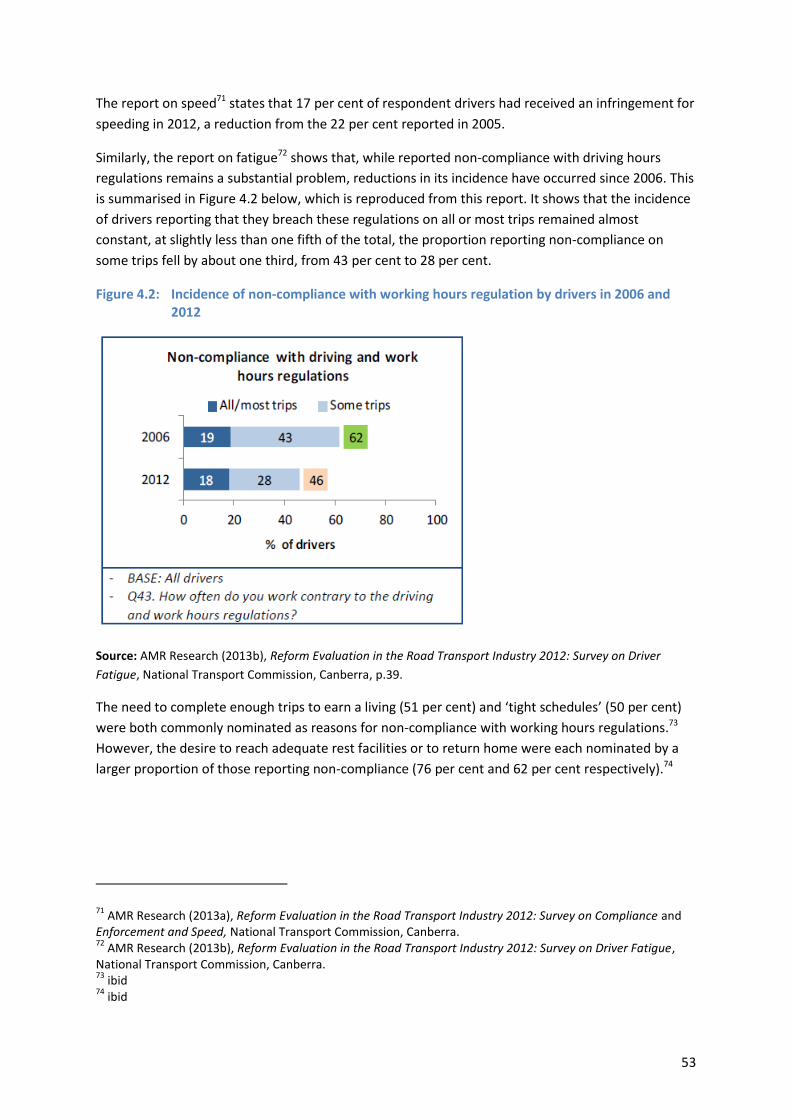
53
The report on speed71 states that 17 per cent of respondent drivers had received an infringement for
speeding in 2012, a reduction from the 22 per cent reported in 2005.
Similarly, the report on fatigue72 shows that, while reported non-compliance with driving hours
regulations remains a substantial problem, reductions in its incidence have occurred since 2006. This
is summarised in Figure 4.2 below, which is reproduced from this report. It shows that the incidence
of drivers reporting that they breach these regulations on all or most trips remained almost
constant, at slightly less than one fifth of the total, the proportion reporting non-compliance on
some trips fell by about one third, from 43 per cent to 28 per cent.
Figure 4.2: Incidence of non-compliance with working hours regulation by drivers in 2006 and 2012
Source: AMR Research (2013b), Reform Evaluation in the Road Transport Industry 2012: Survey on Driver
Fatigue, National Transport Commission, Canberra, p.39.
The need to complete enough trips to earn a living (51 per cent) and ‘tight schedules’ (50 per cent)
were both commonly nominated as reasons for non-compliance with working hours regulations.73
However, the desire to reach adequate rest facilities or to return home were each nominated by a
larger proportion of those reporting non-compliance (76 per cent and 62 per cent respectively).74
71 AMR Research (2013a), Reform Evaluation in the Road Transport Industry 2012: Survey on Compliance and
Enforcement and Speed, National Transport Commission, Canberra. 72
AMR Research (2013b), Reform Evaluation in the Road Transport Industry 2012: Survey on Driver Fatigue, National Transport Commission, Canberra. 73
ibid 74
ibid
54
Consistent with the reduction in non-compliance reported, the proportion of drivers stating that
they experienced fatigue on at least some journeys was reported to have fallen significantly, albeit
from a very high 86 per cent to a still high 72 per cent.75
In summary, the NTC reports suggest that speed and fatigue remain substantial issues for the heavy
vehicle sector, but that policy actions taken over the past several years have been somewhat
effective in reducing the extent of both issues.
4.4 Policy and regulatory approaches to heavy vehicle safety in OECD
countries
The OECD Report (2011)76 discusses the regulation of heavy vehicle road safety in terms of measures
aimed at managing the kinetic energy of vehicles and human factors. The main factors that
contribute to road fatalities in truck crashes are broadly categorised as involving human factors,
road factors, truck configuration, speed, and failure to wear seatbelts. Pay level and methods of
payments are not considered as potential causation factors.
Safe system approach 4.4.1
In its discussion of measures to improve the safety of trucks, the OECD77 refers to the ‘Safe System’
approach, a road safety model which has been adopted by Sweden (Vision Zero), the Netherlands
(Sustainable Safety) and Australia (Safe System). In summary, the Safe System approach views the
road transport system holistically and considers the interactions between the various parts. The
philosophy underpinning the approach is to create a road transport system in which human mistakes
do not result in death or serious injury. In a 2008 comprehensive report78 on the ‘Safe System’
approach, the OECD International Transport Forum (ITF) recommended that all countries move to
‘Safe Systems’ approach. The OECD/ITF report outlines the following characteristics of a ‘Safe
System’ approach:
It recognises that despite prevention efforts, road users will continue to make errors and
crashes will occur.
It stresses that those involved in the design of the road transport system need to accept and
share responsibility for the safety of the system, and those that use the system need to
accept responsibility for complying with the rules and constraints of the system.
It aligns safety management decisions with broader transport and planning decisions that
meet wider economic, human and environmental goals.
It shapes interventions to meet the long-term goal, rather than relying on ‘traditional’
interventions to set the limits of any long term targets.
75 ibid
76 OECD (2011), op cit.
77 ibid
78 OECD (2008), Towards Zero: Ambitious Road Safety Targets and the Safe System Approach, OECD Publishing,
Paris.

55
Safety measures in the trucking industry 4.4.2
Based on contributions by OECD member countries, the measures identified in the OECD Report
(2011) to improve the safety of trucks broadly included:79
Truck design such as the use of rigid front under-run protection systems which absorb the
energy of a crash by deformation of the vehicle, rather than the occupants.
Infrastructure and traffic management such as separating road freight from other road users
by operating late at night or early morning or restricting heavy vehicles to certain freight
logistic routes. Physical segregation can also be achieved through shoulder sealing, barriers
to reduce the risk posed by roadside hazards and audible edge lining. Long term measures
include skid resistance treatment, junction layout, and lane widths. The Australian
Performance Based Standards Scheme is exemplified as allowing for heavy vehicles to be
tested against safety standards and infrastructure standards to ensure compatibility
between the performance of the vehicle and the physical constraints of the road network
Driver training and licensing such as a graduated licence system involving general truck
training followed by gaining experience either with an articulated heavy goods vehicle or a
non-articulated truck.
Vehicle technology involves driver support and communications systems that can improve
safety and/or the efficiency of a vehicle through imminent risk detection, alert and
avoidance systems and vehicle tracking and communications systems.
There is no mention of a ‘Safe Rates’ like scheme being a measure adopted by an OECD member
country to improve safety in the road transport industry.
4.5 Conclusions on safety performance
The preceding sections have established that the rate of improvement in heavy vehicle safety
performance in recent decades has been at least as great as that of the road transport sector as a
whole. When considered in terms of the proportionate decline in total fatality numbers, the rate of
improvement for articulated trucks has been approximately equal to that of the road fleet as a
whole.80 However, when considered in terms of the preferred metric of fatalities per kilometre
travelled, which accounts for the larger increase in freight movements relative to total road use, it is
clear that the heavy vehicle sector has outperformed the total road vehicle fleet in safety
improvement terms.
Moreover, the contribution of the sector to the overall road toll appears to be relatively low by
international standards. The Australian heavy vehicle-related fatality rate was previously relatively
high by international standards, but appears now to be broadly similar to those of most better-
performing countries for which data is available as a result of a strong relative performance in safety
improvement in recent years. That said, the paucity of more recent data necessarily implies that
some uncertainty exists as to Australia's current position.
79 OECD (2011), op cit
80 While the data for rigid trucks suggests that performance in this area may be less positive, the limited time
series available yields significant uncertainty on this point, as discussed above.

56
A small number of countries—notably the United States and Switzerland—can be seen to have
clearly superior performance. Previous work for the NTC suggests that the major factors accounting
for Australia having higher fatality rates than these countries are road-related - i.e. the lower
proportion of truck travel on divided and limited access roads. These factors are likely to remain
significant.
As the National Road Safety Strategy 2011-202081 points out, heavy vehicles remain
disproportionately involved in road fatalities, with heavy vehicles being involved in 18 per cent of
fatality accidents, while accounting for only 8 per cent of vehicle kilometres travelled. However, the
above data indicates that both the overall accident rate of heavy vehicles and the proportion of
multi-vehicle accidents in which the heavy vehicle is at fault are below that of light vehicles, as is the
representation of heavy vehicles in injury accidents. These facts indicate that the key reason for the
over-representation of heavy vehicles in fatality accidents is the lower survivability of accidents
involving heavy vehicles. As noted by the NSW Auditor-General, the likelihood of a fatality is around
three times as high in accidents in which a heavy vehicle is involved.82
Taken together, these data suggest that the over-representation of heavy vehicles in fatality
accidents is, to a substantial extent, the result of factors beyond the control of the industry. That is,
a high proportion of accidents involving heavy vehicles are the fault of the other party, while the size
and weight of the heavy vehicle makes fatalities a much more likely consequence of any given
collision. This is clearly an important observation in the context of assessment of the extent to which
industry practices contribute to observed road safety performance.
That said, the high consequences of an accident involving a heavy vehicle underline the importance
of ensuring a high standard of safety performance in the industry. This is recognised in the National
Road Safety Strategy 2011 – 2020, however, the strategy also recognises the need to assess the
impact of recently introduced reforms. It also highlights, in common with the OECD/ITF, the fact that
many of the actions that will be most effective in reducing heavy vehicle accidents are of general
application, addressing road safety globally, rather than being heavy vehicle specific.
"The strategy recognises that heavy vehicles are over-represented in crash statistics. A
number of national reforms have been introduced over recent years and the impact of these
will take some time to assess. There are some initiatives in the strategy that are specific to
heavy vehicles, but many of the other actions will also address heavy vehicle safety."83
Heavy vehicles as a workplace 4.5.1
As noted above, a key perspective offered by the TWU is that heavy vehicles can be considered as a
workplace and that, from this perspective, the number of heavy vehicle occupant fatalities makes
them one of the most dangerous workplaces in the Australian economy. This perspective is
underlined by OECD data showing that, while fatality rates in accidents involving heavy vehicles in
81 Australian Transport Council (2011), National Road Safety Strategy 2011 – 2020, p.24.
82 The Strategy cites the New South Wales Auditor General, Improving road safety—heavy vehicles, May 2009, p. 14. 83
Australian Transport Council (2011), National Road Safety Strategy 2011 – 2020, p 37
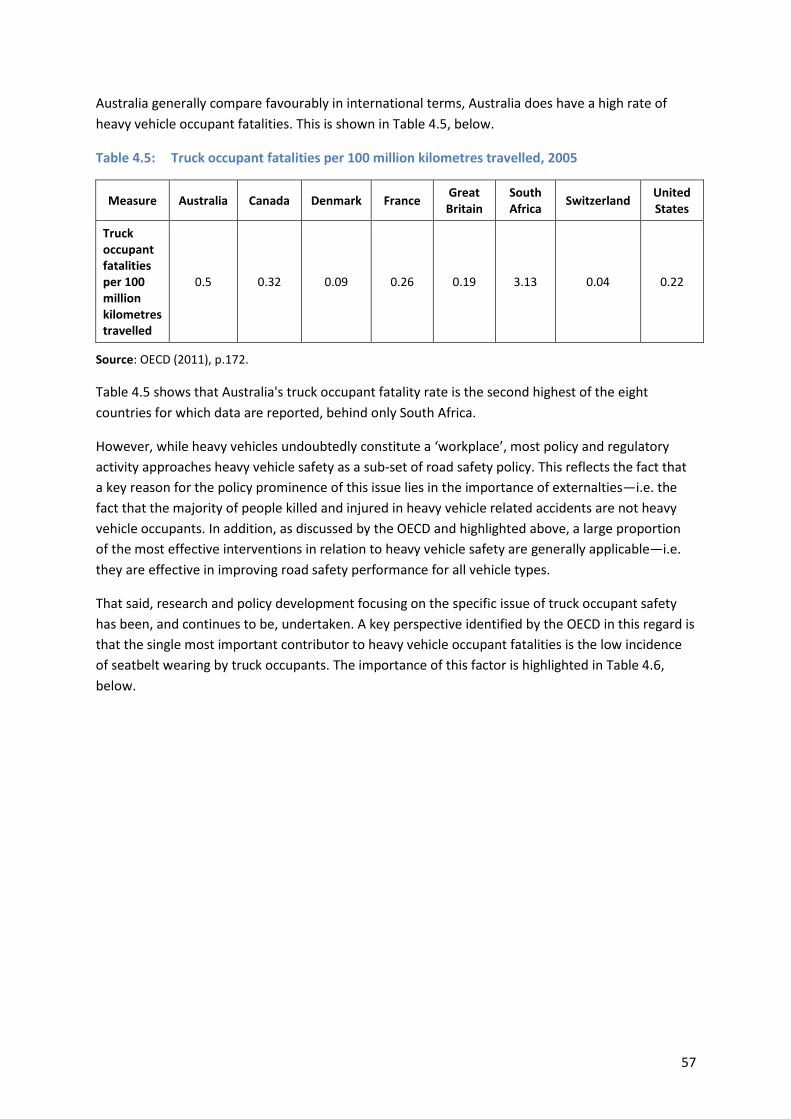
57
Australia generally compare favourably in international terms, Australia does have a high rate of
heavy vehicle occupant fatalities. This is shown in Table 4.5, below.
Table 4.5: Truck occupant fatalities per 100 million kilometres travelled, 2005
Measure Australia Canada Denmark France Great Britain
South Africa
Switzerland United States
Truck occupant fatalities per 100 million kilometres travelled
0.5 0.32 0.09 0.26 0.19 3.13 0.04 0.22
Source: OECD (2011), p.172.
Table 4.5 shows that Australia's truck occupant fatality rate is the second highest of the eight
countries for which data are reported, behind only South Africa.
However, while heavy vehicles undoubtedly constitute a ‘workplace’, most policy and regulatory
activity approaches heavy vehicle safety as a sub-set of road safety policy. This reflects the fact that
a key reason for the policy prominence of this issue lies in the importance of externalties—i.e. the
fact that the majority of people killed and injured in heavy vehicle related accidents are not heavy
vehicle occupants. In addition, as discussed by the OECD and highlighted above, a large proportion
of the most effective interventions in relation to heavy vehicle safety are generally applicable—i.e.
they are effective in improving road safety performance for all vehicle types.
That said, research and policy development focusing on the specific issue of truck occupant safety
has been, and continues to be, undertaken. A key perspective identified by the OECD in this regard is
that the single most important contributor to heavy vehicle occupant fatalities is the low incidence
of seatbelt wearing by truck occupants. The importance of this factor is highlighted in Table 4.6,
below.

58
Table 4.6: Truck occupant seat belt wearing rates in fatal and injury accidents
Years Country
Number of Truck
Occupants Killed,
wearing seat belt
Number of Truck
Occupants Killed, not wearing seat belt
Number of Truck
Occupants Killed, belt
use unknown
Number of truck
Occupants Injured, wearing seat belt
Number of truck
Occupants Injured,
not wearing seat belt
Number of truck
Occupants Injured, belt use
unknown
2002 and 2004
Australia 11 per cent 47 per cent 43 per cent 43 per cent 11 per cent 46 per cent
2002-2006 Austria 29 per cent 71 per cent 0 per cent 28 per cent 72 per cent 0 per cent
2003-mid 2007
Israel 51 per cent 39 per cent 10 per cent 61 per cent 24 per cent 15 per cent
2002-2005 Japan 44 per cent 49 per cent 7 per cent 88 per cent 15 per cent 2 per cent
2003-2007 South Africa
2 per cent 49 per cent 50 per cent Not
available Not
available Not
available
2002-2006 Great Britain
4 per cent 51 per cent 45 per cent Not
available Not
available Not
available
Source: OECD (2011), p.190.
Table 4.6 shows that, of cases where seatbelt wearing status was known (accounting for 58 per cent
of the total), around 80 per cent of truck occupants killed in Australia were not wearing seatbelts.
Conversely, among truck occupants injured, around 80 per cent were wearing seatbelts (of the 54
per cent of cases where seatbelt wearing status is known). These observations are strongly
suggestive of the impact of seatbelt wearing in averting fatalities - an observation that is generally
accepted in the road safety literature. The OECD cites Australian research supporting this
proposition, as follows:
"A number of field studies have quantified the safety value of seat belts for truck drivers.
Campbell and Sullivan (1991) estimated that between 27% and 77% of truck driver fatalities
could be prevented by seat belt use. A review of a range of studies by Gibson et al. (2001),
together with information from the Crashed Vehicles Study, produced an estimate that 40%
to 50% of Australian truck driver fatalities could be prevented by seatbelt use at similar levels
to that observed in light vehicles. Knight (2000) predicted that not only would up to 36% of
truck occupant fatalities be prevented by use of 3-point seatbelts, but also that this could be
increased to a 50% reduction if combined with improved cab crashworthiness."84
While this research may be considered slightly dated, Raftery et al85 also cites two more recent
Australian studies which reach substantially similar conclusions. Lyndall and Elias86, reviewing 61
84 OECD (2011), op cit, pp 189-90
85 Raftery, S.J., Grigo, J., and Woolley, J. (2011), ‘Heavy Vehicle Road Safety: Research Scan’, Centre for Automotive Safety
Research (CASR) Report Series CASR100, July 2011, CASR, University of Adelaide. 86
Brodie, L., Lyndal, B., & Elias, I. J. (2009). ‘Heavy vehicle driver fatalities: Learning's from fatal road crash investigations in Victoria’. Accident Analysis & Prevention, 41(3), 557-564. doi: 10.1016/j.aap.2009.02.005

59
crashes involving heavy vehicle occupant fatalities in Victoria found that in 17 of 25 cases in which
seat belt use status was known, the heavy vehicle occupant killed had not been wearing a seatbelt.
Similarly, Imberger et al87 found, also using Victorian data, that 60 per cent of drivers killed were not
wearing a seat belt.
The above indicates that, despite the general conclusion of the OECD and others that generally
applicable road safety initiatives also largely constitute the most effective interventions in the heavy
vehicle context, there are potentially very effective interventions available that are specific to the
heavy vehicle sector and focus on truck occupant safety. Two of the most important of these are
addressing the much lower average use of seatbelts in heavy vehicles, compared with private cars
and addressing cab crashworthiness. The seatbelt issue has already been recognised in the National
Road Safety Strategy 2011 – 2020, which lists under ‘future steps’:
"Examining the use of seatbelt interlocks and other regulatory means to increase seatbelt
wearing by heavy vehicle drivers."88
87 Imberger, K., Styles, T., & Walsh, K. (2009). Victorian truck rollover crashes 2003-2007. Paper presented at
the Australasian road safety research policing education conference, Sydney, NSW. 88
Road Safety Strategy 2011 – 2020, op cit, p.93.

60
5 Remuneration and safety
Key Points
The establishment of the RSRS largely reflects a view that there is an established link between driver remuneration and safety performance. However, the research literature on this issue is relatively limited in extent, addresses a range of specific relationships and reaches mixed conclusions.
Some studies consider firm level financial performance, while others focus on driver remuneration. Similarly, some studies assess safety performance directly, by measuring accident involvement rates, while others use indirect measures, notably the incidence of risky behaviours such as speeding and driving while fatigued.
This means that there are few studies that have found clear links between driver remuneration and the likelihood of accident involvement. Moreover these studies differ widely as to the nature of this link. Of four studies finding a statistically significant link, two find the size of the impact to be very small. Two others find large relationships, but one of these finds a "U shaped" function linking the variables and concludes that remuneration levels above an "optimum" level are associated with poorer safety outcomes.
These studies also suffer from the limitation of focusing on employee drivers, whereas a large part of the concerns raised in Australia in relation to low driver remuneration relate to owner drivers.
Studies that have assessed owner driver safety performance specifically have found either that it similar to that of employee drivers or that it is significantly better than that of employee drivers, despite the generally lower levels of remuneration of employee drivers.
While the overall weight of the evidence examined in the literature suggests the likely existence of some link between remuneration and safety, the nature and extent of any impact on safety performance of a change in driver remuneration is highly uncertain.
Mandatory minimum rate setting can only be shown to constitute a potentially effective means of
promoting heavy vehicle safety, if it is demonstrated that:
there is clear evidence of a substantial relationship between driver remuneration and
accident involvement;
remuneration levels in at least parts of the Australian road transport industry are sufficiently
low as to give rise to incentives to adopt unsafe driving behaviours; and
other regulatory interventions are not able to effectively prevent the adoption of such
behaviours.
Section 5.1, below, discusses the available research literature on the link between remuneration and
safety, while Section 5.2 sets out available data on remuneration rates in Australia and provides
international comparisons where feasible. Section 6, below, discusses heavy vehicle safety
regulation currently in place, as well as current initiatives in this area, highlighting regulation that
deals with key issues arising in the "safe rates" context, including speed, driving hours and fatigue.
5.1 Review of research literature on remuneration and safety
The RSR Act is predicated on the view that there is an established relationship between
remuneration levels in the road transport industry and safety performance. Specifically, it is argued

61
that when remuneration levels remain very low over a significant period, economic pressures will
cause drivers to behave in ways that compromise safety, including driving excessive hours, driving at
excessive speed and/or reducing vehicle maintenance expenditures. Given the substantial human
and economic cost of road accidents, this represents a potentially major problem. Thus, this section
reviews the research literature on this issue in order to weigh the evidence on the general question
of the existence, nature and extent of linkages between remuneration and safety.
Economic deregulation of United States trucking and safety performance 5.1.1
Much of the early research on the link between freight rates and safety performance was conducted
during the 1980s and early 1990s and focused on the impact on safety of the removal of economic
regulation in the United States trucking industry and the subsequent significant decline in freight
rates during the 1980s89. Research in this field appears to have been prompted by concerns that the
removal of entry restrictions and other economic regulation, and the decline in freight rates
expected to occur as a consequence, would lead to significant declines in safety performance. These
declines did not occur: as reported by Hunter & Mangum90, for example, overall accident rates in the
heavy vehicle sector declined between 1976 and 1986 - i.e. in the period following the removal of
economic regulation of the United States trucking industry. Moreover, some research suggests a
degree of positive impact of deregulation on safety performance91.
While aware at the outset of their research that overall safety performance had continued to
improve post-deregulation, Hunter & Mangum92 sought to test specific hypotheses linking
remuneration levels and safety performance within this broad context of economic deregulation.
Thus, it was expected that non-union firms with lower remuneration rates would demonstrate
higher rates of accident involvement than unionized firms, as would owner-operators. It was also
anticipated that firms with lower revenue per mile would have higher accident rates, as firms under
financial stress were hypothesised to be more likely to take short cuts on safety-related matters.
The results of the study failed to show these expected relationships. Instead, a number of apparently
perverse statistical relationships were observed: it was found that non-unionised firms had lower
accident involvement rates than unionised firms and that there was an unexpected and significant
positive correlation between revenues per mile and accident rates among non-union firms.
Conversely, however, the authors did find that owner-operators, who suffered significant declines in
pre-deregulation incomes, experienced higher accident rates. They state that:
"Owner-operators leased to these firms were required to intensify their work efforts simply to
maintain pre-deregulation incomes. These intensified work efforts translated into increased
89 For a history of US trucking regulation and deregulation, see:
http://www.ftc.gov/sites/default/files/attachments/us-submissions-oecd-and-other-international-competition-fora/ibero-trucking.pdf (accessed 7 April 2014) 90
Hunter, Natalie, and Stephen Mangum. (1995.), ‘Economic Regulation, Employment Relations, and Accident Rates in the U.S. Motor Carrier Industry’, Labor Studies Journal, Vol. 20, No. 1 (Spring), pp. 48– 63. 91
See, for example, Traynor, TL & McCarthy, PS (1993), ‘Economic Regulation And Highway Safety In The Trucking Industry: A Limited Dependent Variable Analysis’, The Quarterly Review of Economics and Finance, Vol. 33, Issue 2, Summer 1993, Pages 141-153 92
Hunter & Mangum (1995), op cit

62
hours on the road, increased fatigue, and ultimately an increase in preventable accident
rates."93
However, the extent of the relationship identified - i.e. the size of the relationship between reduced
freight rates and increased accident rates - is not made clear in the paper.
In sum, the experience of economic deregulation in the United States trucking industry was that a
highly regulated industry with high and regulated freight rates was not associated with better safety
performance than an industry characterised by open entry and lower average rates. However, some
evidence of reduced safety performance was found in specific areas, relating to certain kinds of
poorly remunerated owner driver firms.
Regulatory reform in other OECD countries 5.1.2
OECD research indicates that the majority of its member countries followed a similar regulatory
reform path to the United States in relation to the trucking industry in the 1980s and 1990s. The
broader context of the history of economy-wide regulatory reform since the late 1970s is one in
which price and entry controls have been removed from most of the industries in which it was
previously applied and substantial improvements in productivity, together with real price reductions
and improvements in customer services have, in most cases resulted. The direction of regulatory
change in the road freight industry in OECD countries is consistent with this broad trend. In a 2001
study, the OECD noted that:
“Deregulation has also been extensive in the road freight industry. Even though regulatory
barriers were initially less extensive than in other industries, by 1998 barriers to entry and
service constraints had been virtually eliminated in all countries for which data are available,
while some price controls and state controlled trucking companies still remained in a few.”94
The proportion of OECD Member countries applying price control regulations of any form in the road
freight industry was reported by the OECD as having fallen from almost 70 per cent in 1975 to
around 13 per cent in 1998, while the proportion of OECD Member countries applying a "high level"
of price regulation fell from 25 per cent to zero over the same period.95 The only four countries
identified by the OECD as retaining price regulation by 1998 were Spain, Greece, Italy and Japan.
Even in Japan, a traditionally highly regulated country,96 a 1996 study97 found that while the
government wielded far-reaching powers to set prices in the road freight industry, these had not
been used to do anything other than set guideline rates:
“Since 1951 the ministry of transport has been vested with sweeping authority to restrict
entry and set prices in commercial trucking. Perhaps it could have used this authority to
93 Hunter, Natalie, and Stephen Mangum. (1995), op cit, p.63
94 OECD (2001), OECD Economic Studies No. 32: Special Issue - Regulatory Reform, OECD, Paris, 1 June 2001.
See pp 7-8. 95
ibid 96
See, for example, OECD (1999), Regulatory Reform in Japan. 97
Flath, D. (1996), Japanese Regulation of Truck Transport, Working Paper No. 119, Center on Japanese Economy and Business, Columbia Business School, New York, June 2006.
63
cartelize the industry. The weight of evidence holds that it did not do so. There is little to
suggest that the standard price schedules which the MOT continues to publicize and
periodically revise are anything more than suggestions, widely disregarded by commercial
trucking firms.”98
As this summary indicates, the direction of regulatory change in relation to the road freight industry
in OECD countries has been toward the removal of price regulation, where it has previously existed.
The OECD Report (2011)99 on the industry makes no mention of any reversal of this trend in any of
the countries discussed, despite discussing heavy vehicle safety issues at considerable length. The
most recent Annual Report of the OECD International Transport Forum,100 notes the establishment
of the Tribunal in Australia, but includes no discussion of any similar initiatives in other Member
countries. Given this, and the fact that the Review has not been able to identify any equivalent
initiatives internationally,101 it appears that the adoption of legislation authorising the re-regulation
of minimum prices, as reflected in the RSR Act, is currently unique to Australia.
Indirect indicators of safety performance 5.1.3
A number of relationships have been investigated in the literature on links between remuneration
and safety. One strand of the literature focuses on a range of indirect indicators of both
remuneration levels and safety performance, rather than seeking to measure these directly. As the
Quinlan and Wright Report notes:
“This included detailed research by Hensher and colleagues during the 1990s (Hensher and
Battellino, 1990; and Golob, T. and Hensher, 1994) that found a clear and significant link
between scheduling pressures, unpaid waiting time, insecure rewards and access to work,
and hazardous practices such as speeding, excessive hours and drug use by drivers.”102
Research on links between remuneration and unsafe practices differs as to whether it also addresses
the question of actual safety performance- i.e. accident involvement. This distinction is significant, in
that some research has found links between remuneration and unsafe practices, but has not found
poorer resulting safety performance.
For example, ACIL-Tasman103 reports that Hensher et al104 found strong evidence of a correlation
between owner driver remuneration/freight rates and propensity to speed, with the relationship
being statistically significant at the 95 per cent confidence level. However, the link between payment
rates and accident involvement was not assessed directly. Rather, the authors measured the
98 ibid
99 OECD (2011), op cit
100 OECD (2013), Secretary-General’s Report to Ministers 2013, OECD Publishing,
http://www.oecd.org/about/secretary-general/secretary-general-report-to-ministers-2013.pdf (accessed 7 April 2014). 101
This has included a search of the OECD Joint Transport Research Centre website, which yielded no recent documentation referring to price regulation within the road freight industry. 102
Quinlan & Wright (2008), op cit, p 11 103
ACIL-Tasman (2003), op cit 104
Henscher, D., Battelino, H., Gee, J. & Daniels, R. (1991), Long Distance Truck Drivers' On Road Performance and Economic Reward, Federal Office of Road Safety, Report No. CR 99.
64
accident involvement of different types of drivers, distinguishing owner drivers and employee
drivers employed by small, medium and large companies. Average payment rates for these groups
were not calculated. However, the differences between driver types in terms of crash involvement
were found to be very small: small company drivers were found to have the highest rate of crash
involvement in the previous two years (18 per cent), while medium company drivers had the lowest
(16 per cent). These differences were found not to be statistically significant. The authors concluded
that "The anecdotal evidence which tends to lay the blame for bad on-road behaviour on owner
drivers is fallacious".
Other research has measured links between safety performance per se and indirect indicators
apparently chosen for expected correlations with remuneration levels and structures. Two
Australian studies of note are those of Williamson et al105 and Quinlan.106
5.1.3.1 Employment type and accident history
Williamson et al107 conducted a large-scale survey of long-distance drivers in Australia on behalf of
the then NRTC. Williamson et al found significant correlations between payment methods, total
hours worked and the reported incidence of fatigue. Thus, drivers who were paid on a per
kilometre/trip or per tonne basis were found to have a higher incidence of reported fatigue, while
owner drivers were found to do much longer trips than employee drivers as well as more non-
driving work. Williamson et al's sample was stratified in terms of the size of the fleet in the case of
employee drivers and also distinguished employee drivers from owner drivers. Owner drivers (both
independent and contracted) and drivers employed by companies with smaller fleets were found to
have higher rates of payment on a flat rate per load basis, while owner drivers were more likely to
have to negotiate a rate for each load.108
The observed links would suggest that owner drivers would demonstrate a higher accident rate,
since they were more likely to be paid on a fixed rate basis (a factor found to be correlated with
higher reported fatigue levels). They were also found to complete longer trips and more non-driving
work, factors also suggesting higher fatigue exposures.
Despite this, no significant differences in accident involvement rates were observed. The survey
included questions on accident involvement in the previous twelve months and found little or no
linkage between driver employment types and accident history. Table 5.1 below is reproduced from
this report.
105 Williamson, A., Sadural, S., Feyer, A. & Friswell, R. (2001), Driver Fatigue: A Survey Of Long Distance Heavy
Vehicle Drivers In Australia, Information Paper CR 198, National Road Transport Commission. 106
Quinlan, M. (2001), Report of Inquiry into Safety in the Long Haul Trucking Industry, Report commissioned by the Motor Accidents Association of New South Wales. 107
Williamson et al (2001), op cit 108
ibid, pp 40-41
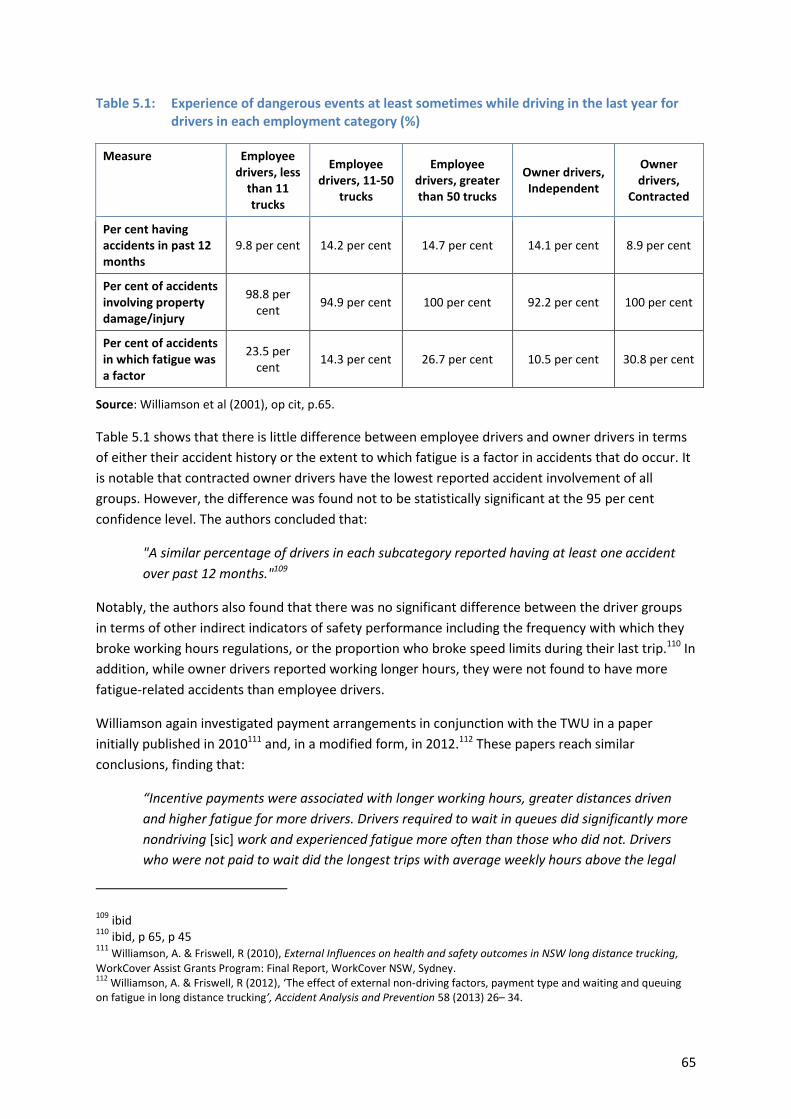
65
Table 5.1: Experience of dangerous events at least sometimes while driving in the last year for drivers in each employment category (%)
Measure Employee drivers, less
than 11 trucks
Employee drivers, 11-50
trucks
Employee drivers, greater than 50 trucks
Owner drivers, Independent
Owner drivers,
Contracted
Per cent having accidents in past 12 months
9.8 per cent 14.2 per cent 14.7 per cent 14.1 per cent 8.9 per cent
Per cent of accidents involving property damage/injury
98.8 per cent
94.9 per cent 100 per cent 92.2 per cent 100 per cent
Per cent of accidents in which fatigue was a factor
23.5 per cent
14.3 per cent 26.7 per cent 10.5 per cent 30.8 per cent
Source: Williamson et al (2001), op cit, p.65.
Table 5.1 shows that there is little difference between employee drivers and owner drivers in terms
of either their accident history or the extent to which fatigue is a factor in accidents that do occur. It
is notable that contracted owner drivers have the lowest reported accident involvement of all
groups. However, the difference was found not to be statistically significant at the 95 per cent
confidence level. The authors concluded that:
"A similar percentage of drivers in each subcategory reported having at least one accident
over past 12 months."109
Notably, the authors also found that there was no significant difference between the driver groups
in terms of other indirect indicators of safety performance including the frequency with which they
broke working hours regulations, or the proportion who broke speed limits during their last trip.110 In
addition, while owner drivers reported working longer hours, they were not found to have more
fatigue-related accidents than employee drivers.
Williamson again investigated payment arrangements in conjunction with the TWU in a paper
initially published in 2010111 and, in a modified form, in 2012.112 These papers reach similar
conclusions, finding that:
“Incentive payments were associated with longer working hours, greater distances driven
and higher fatigue for more drivers. Drivers required to wait in queues did significantly more
nondriving [sic] work and experienced fatigue more often than those who did not. Drivers
who were not paid to wait did the longest trips with average weekly hours above the legal
109 ibid
110 ibid, p 65, p 45
111 Williamson, A. & Friswell, R (2010), External Influences on health and safety outcomes in NSW long distance trucking,
WorkCover Assist Grants Program: Final Report, WorkCover NSW, Sydney. 112
Williamson, A. & Friswell, R (2012), ‘The effect of external non-driving factors, payment type and waiting and queuing on fatigue in long distance trucking’, Accident Analysis and Prevention 58 (2013) 26– 34.

66
working hours limits, had the highest levels of fatigue and the highest levels of interference
by work with family life. In contrast, drivers who were paid to wait did significantly less work
with shorter usual hours and shorter last trips”113
However, in contrast to the previous research, this study did not address the issue of the accident
involvement rates of different cohorts within the survey respondent group. Hence, it does not
provide more recent data to verify the earlier conclusion that failed to show a link between indirect
safety indicators and actual accident involvement.
Quinlan114 reported similar results to Williamson et al115 in relation to the issue of accident
involvement rates for the different driver groups. Quinlan reported the proportion of owner drivers
and small and large fleet drivers stating that they had had an accident during the past year and the
past five years. Table 5.2, below, reproduces his results.
Table 5.2: Truck crashes experience by 300 interviewed drivers in the immediate past 12 month period and in previous 5 years116
Measure Owner drivers (n-99)
Small fleet drivers (n=104)
Large fleet drivers (n=85)
Accident past 12 month period 10.1 per cent 12.5 per cent 5.9 per cent
Accident previous 5 years 20.2 per cent 18.3 per cent 15.3 per cent
Source: Quinlan (2001), op cit, pp.54-55.
Table 5.2 shows that the proportions of drivers reporting accident involvement varied relatively little
between the three groups. A higher proportion of small fleet drivers than owner drivers were
involved in accidents in the previous 12 months, although the position was reversed when the
previous five years are considered. Large fleet drivers have the lowest accident involvement over
both 1 and 5 year time horizons. The difference is substantial over the one-year period, but is
proportionately much smaller considered over five years. ACIL-Tasman, in commenting on the study,
reports that the differences between these accident involvement statistics were not found to be
statistically significant:
"Professor Quinlan's 2001 survey of drivers in NSW found very little difference in the
proportion of owner-drivers, small fleet drivers and large fleet drivers involved in a crash in
the past five years.... Significance testing indicates that we cannot be confident that the
proportion of owner drivers reporting at least one crash in the last five years is significantly
different to the proportion of drivers in large fleets."117
113 ibid
114 Quinlan (2001), op cit
115 Williamson et al (2001), op cit
116 Note: This table excludes drivers who did not identify with any of the three groups of owner drivers, small
fleet drivers or large fleet drivers. These drivers were identified as ‘Other’ in the study and numbered 12 in total. 117
ACIL-Tasman (2003), op cit, p.53
67
Remuneration levels and accident history 5.1.4
A small number of studies have identified direct links between remuneration levels and safety
performance and are discussed in this section. Three of these studies, by Belzer et al (2002),118
Rodriguez et al (2006)119 and Nafukho et al (2007),120 directly measure links between driver
remuneration rates and accident involvement risk. A fourth (by Elkington and Stevenson (2013))121
tests for correlation between payment method, as well as a number of other payment-related
variables and accident involvement. The fifth (by Britto et al (2010))122 measures the relationship
between firms' financial performance and their safety records, rather than the link between driver
remuneration and safety per se.
5.1.4.1 Correlation between pay rates and accident involvement
5.1.4.1.1 Belzer et al (2002)123
The 2002 study by Belzer et al analyses three different data sets and finds strong, statistically
significant links between driver remuneration levels and safety outcomes in each case. In relation to
one set of driver survey data, the authors find that a 10 per cent increase in remuneration rates is
associated with a 9.2 per cent reduction in crash numbers. In a second, survey-based dataset, a 10
per cent higher wage rate was associated with a 34 per cent reduction in accident incidence.124 For
the third dataset, a 10 per cent higher mileage rate reduced crash probability by 21 per cent.
The authors conclude that:
"It is difficult to come up with a single summary estimate of the effect of driver pay, as
elasticities vary across datasets and model specifications, but conservatively we can say that
the relationship between safety and pay probably is better than 2:1."
"...driver pay has a strong effect on safety outcomes. These results are consistent with
economic theory because we expect that carriers pay drivers according to their market value,
and that value is determined by their personal employment history, driving record, training
and education experience, driving skills, temperament, and other unmeasured factors. Since
very few of the drivers studied in our datasets are union members, we expect that the
118 Belzer, MH., Rodruigez, DA. & Sedo, SA. (2002), Paying for Safety: An Economic Analysis of the Effect of
Compensation on Truck Driver Safety, Sponsored by Science Applications International Corporation and Federal Highway Transport Safety Administration. 119
Rodriquez D., Targa F., Belzer M. (2006), ‘Pay Incentives and Truck Driver Safety: A Case Study’, Industrial and Labor Relations Review, 2006, 59(2), pp.205-225. 120
Nafukho, M., Hinton, BE. & Graham, CM (2007), ‘A Study of Truck Drivers and their Job Performance Regarding Highway Safety’, Performance Improvement Quarterly 20(1), pp 65-78. 121
Elkington, J. & Stevenson, M. (2013). The Heavy Vehicle Study: Final Report. http://c-marc.curtin.edu.au/local/docs/CMARC_HeavyVehicleStudy.pdf (accessed 7 April 2014) 122
Britto, Rodrigo A.; Corsi, Thomas M.; Grimm, Curtis M. (2010), ‘The Relationship between Motor Carrier Financial Performance and Safety Performance’, Transportation Journal (American Society of Transportation and Logistics);Fall 2010, Vol. 49 Issue 4, p.42. 123
Belzer et al (2002), op cit 124
This refers to the difference between the mean wage rate and a rate 10% higher than mean. The authors point out that the elasticities involved change at different remuneration levels.
68
differences in safety outcomes are likely due to different individual characteristics for which
they are paid differentially."125
That is, firms that pay higher wages are able to recruit higher quality drivers, with safety
performance representing an important aspect of driver quality. Importantly, this proposition differs
from that underlying the safe rates concept - i.e. that a given cohort of drivers will drive in a less safe
manner as a result of financial pressures arising from low remuneration levels. That said, Rodriguez
et al,126 who undertook further analysis of one of the datasets used by Belzer et al,127 did find that a
cohort of existing drivers demonstrated improved safety performance following a pay increase.
5.1.4.1.2 Rodriguez et al (2006)128
As noted, this paper is not independent of Belzer et al,129 in that it further analyses one of the data
sets used in the earlier study. This data relates specifically to employee drivers within a single firm
which moved to substantially increase its pay rates at a particular point in time.
As would be expected, given the use of a common data set, this study also finds a strong correlation
between driver pay rates and accident involvement. Rodriguez et al130 find that a 1 per cent increase
in pay rates from median levels leads to a 1.33 per cent decrease in crash risk. However,
importantly, the authors find a non-linear relationship between these two variables. More notably,
having mapped the relationship between remuneration rates and crash involvement for a wide
range of remuneration rates, they note that the size of the effect of increased remuneration on
crash risk not only declines with further pay rises, but ultimately turns negative. Graph 5.1,
reproduced from Rodriguez et al, demonstrates the estimated relationship.
125 ibid
126 Rodriguez et al (2006), op cit
127 Belzer et al (2002), op cit
128 Rodriguez et al (2006), op cit. Note: Rodriquez and Belzer are 2 of 3 co-authors in both of the studies cited.
129 Belzer et al (2002), op cit
130 Rodriguez et al (2006), op cit

69
Graph 5.1: Predicted crash probability and pay rise
Source: Rodriguez et al (2006), op cit, p.219.
The authors note that increases in remuneration initially reduce crash incidence, but at a declining
rate. Describing the above function as a whole, they state:
"[The graph] shows the change in crash probability as NEWPAY varies from 17 cents per mile
to 47 cents per mile, with BASEPAY held at 17 cents per mile and all variables held at their
median. At low pay levels, the net effect of a higher pay rate is lower crash risk, though the
effect reduces incrementally and eventually reverses, controlling for other factors."131
Speculating on the reasons for this apparently counter-intuitive outcome, the authors state:
“It is possible that the motivational effect of higher pay decreases over time, or that drivers
adjust their recurrent financial commitments upward in the relatively short run after a pay
increase.”132
Beyond this brief speculation, the authors offer no further analysis of the U-shaped nature of the
function or comment on its implications for policy.133 This is particularly surprising given that the
function estimated suggests a high degree of sensitivity of crash probability to remuneration levels,
even around the ’optimal’ level. For example, Graph 5.1 shows that a change of 9 cents in either
131 ibid
132 ibid
133 The author of the current paper previously contacted Rodriguez to seek more detail on his views on this
issue. However, while a substantive response was promised, none was ultimately forthcoming.

70
direction from the optimum level of 31 cents/mile will increase crash probability by about 100 per
cent. A 9 cent increase in remuneration is equal to about a 29 per cent increase from a 31 cent base.
Of note, the Rodriguez et al study also finds that the relationship between remuneration and safety
does not solely depend on the ability of firms paying higher wages to recruit higher quality drivers
who have better safety performance. Rather, they note that "for drivers employed during the lower
pay regime and retained in the higher pay regime, crash incidence fell." Again, while the authors
briefly speculate on the reasons for this, they offer no further analysis.
In sum, while the Rodriguez et al study uses one of the same data sets employed by Belzer et al, the
implications for policy of its conclusions are, arguably quite different. The U-shaped relationship
found to exist between remuneration and safety suggests practical difficulties in determining
optimum remuneration levels from a safety perspective and the potential for significant safety costs
to result if regulated remuneration levels fail to identify this optimum level accurately. Moreover,
the authors' suggestion that drivers may "...adjust their recurrent financial commitments upward in
the relatively short run after a pay increase" indicates a view that any observed improvement in
safety performance due to increased remuneration may prove to be transient in nature.
5.1.4.1.3 Nafukho et al (2007)134
Another more recent study of this issue is that by Nafukho et al.135 This study consists of a regression
analysis conducted in respect of six variables considered to be related to accident risk. Two of these
variables - salary and paid time off - are remuneration related. The authors found that the six
variables all have statistically significant impacts on accident risk. However, the extent of the
relationship between the remuneration variables and accident risk was found to be substantially
smaller than the relationships estimated in the Belzer et al136 and Rodriguez et al137 studies.
Specifically, the six variables were found in total to explain only 3.2 per cent of the variation in
accident rates, while paid time off and salary were among the least significant variables, as
demonstrated in Table 5.3 below, reproduced from Nafukho et al.138
134 Nafukho et al (2007), op cit
135 ibid
136 Belzer et al (2002), op cit
137 Rodriguez et al (2006), op cit
138 Nafukho et al (2007), op cit
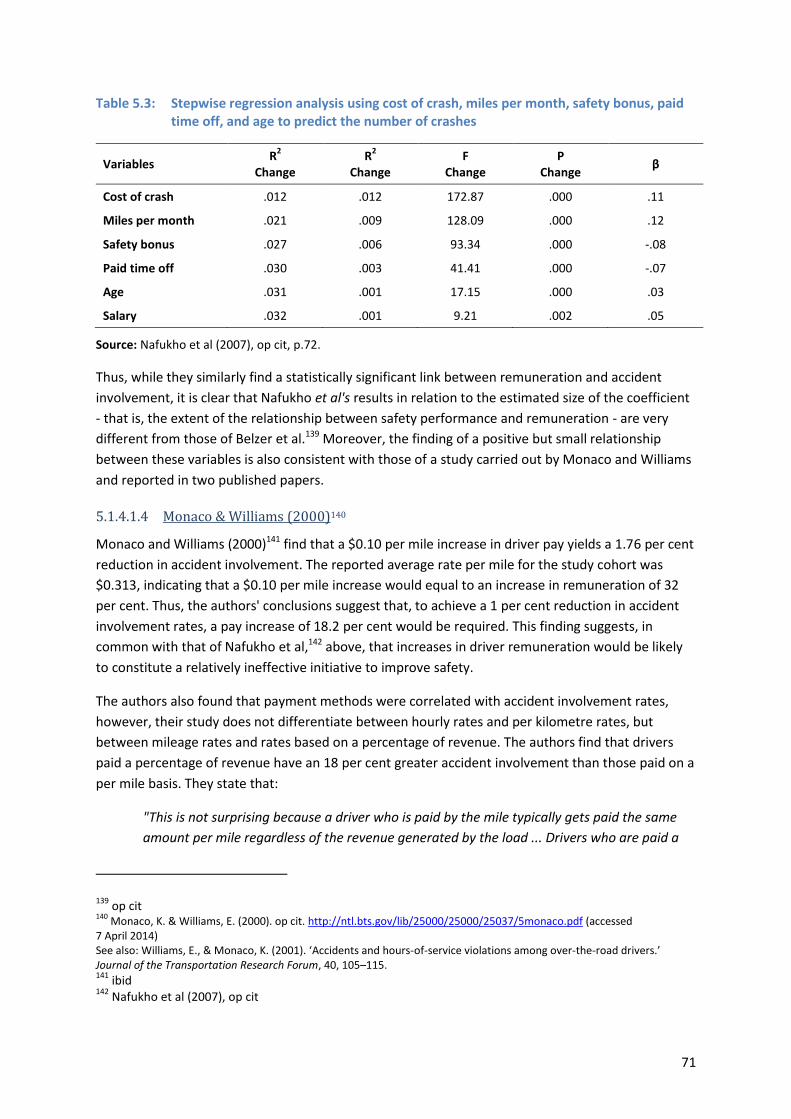
71
Table 5.3: Stepwise regression analysis using cost of crash, miles per month, safety bonus, paid time off, and age to predict the number of crashes
Variables R
2
Change R
2
Change F
Change P
Change β
Cost of crash .012 .012 172.87 .000 .11
Miles per month .021 .009 128.09 .000 .12
Safety bonus .027 .006 93.34 .000 -.08
Paid time off .030 .003 41.41 .000 -.07
Age .031 .001 17.15 .000 .03
Salary .032 .001 9.21 .002 .05
Source: Nafukho et al (2007), op cit, p.72.
Thus, while they similarly find a statistically significant link between remuneration and accident
involvement, it is clear that Nafukho et al's results in relation to the estimated size of the coefficient
- that is, the extent of the relationship between safety performance and remuneration - are very
different from those of Belzer et al.139 Moreover, the finding of a positive but small relationship
between these variables is also consistent with those of a study carried out by Monaco and Williams
and reported in two published papers.
5.1.4.1.4 Monaco & Williams (2000)140
Monaco and Williams (2000)141 find that a $0.10 per mile increase in driver pay yields a 1.76 per cent
reduction in accident involvement. The reported average rate per mile for the study cohort was
$0.313, indicating that a $0.10 per mile increase would equal to an increase in remuneration of 32
per cent. Thus, the authors' conclusions suggest that, to achieve a 1 per cent reduction in accident
involvement rates, a pay increase of 18.2 per cent would be required. This finding suggests, in
common with that of Nafukho et al,142 above, that increases in driver remuneration would be likely
to constitute a relatively ineffective initiative to improve safety.
The authors also found that payment methods were correlated with accident involvement rates,
however, their study does not differentiate between hourly rates and per kilometre rates, but
between mileage rates and rates based on a percentage of revenue. The authors find that drivers
paid a percentage of revenue have an 18 per cent greater accident involvement than those paid on a
per mile basis. They state that:
"This is not surprising because a driver who is paid by the mile typically gets paid the same
amount per mile regardless of the revenue generated by the load ... Drivers who are paid a
139 op cit
140 Monaco, K. & Williams, E. (2000). op cit. http://ntl.bts.gov/lib/25000/25000/25037/5monaco.pdf (accessed
7 April 2014) See also: Williams, E., & Monaco, K. (2001). ‘Accidents and hours-of-service violations among over-the-road drivers.’ Journal of the Transportation Research Forum, 40, 105–115. 141
ibid 142
Nafukho et al (2007), op cit
72
percentage of revenue, primarily owner-operators, tend to drive more miles and run more
loads in order to compensate for any empty or low-revenue loads."143
However, despite the finding that owner-operators predominate among those paid a percentage of
revenue, the authors find that:
"The rates of accidents and logbook violations are remarkably similar across employment
status, with roughly 15% of those in each group reporting an accident in the 12 months prior
to the interview".144
This is consistent with other findings, discussed below, which indicate that owner drivers have safety
performance that is as good or better than that of employee drivers, despite in some cases being
found to exhibit a higher level of unsafe behaviours.
Also of note are the authors' findings that, while accident involvement rates unsurprisingly tend to
increase with annual mileage driven, they do so at a less than proportionate rate, so that accident
involvement per mile driven was lower for drivers completing the highest average mileage: while 10
per cent of drivers covering 50,000 miles or less in the previous year had been involved in an
accident, this rose to 20 per cent among the cohort driving more than 160,000 miles.
5.1.4.1.5 Elkington & Stevenson (2013)145
Elkington and Stevenson note, in respect of the literature linking driver remuneration and safety,
that:
"While the role of compensation and driver economic rewards on commercial vehicle driver
behaviour and safety outcomes was the focus of some research in the 1990s and early 2000s,
there has been little research on this in recent years."146
The Heavy Vehicle Study was a case control study conducted in NSW and Western Australia from
2008 to 2011 to explore the size, direction and interaction of the risk factors for long distance heavy
vehicle crashes (across both the owner driver and employee driver sectors). Cases were drivers of
heavy vehicles with a gross vehicle mass of 12 tonnes or more on a long distance trip who had a
police attended crash in these two states during the study period.
The authors considered, inter alia, the impact of the incentive effects of different payment systems
on safety performance, as distinct from the actual level of remuneration paid. Summarising this
research, they cite Mayhew and Quinlan (2006)147 as finding that pay levels and systems together
with work/scheduling pressures are associated with dangerous work practices (speeding, excessive
hours and drug use) and work-related injuries but note that there was little research which could
143 Monaco and Williams (2000), op cit
144 ibid
145 Elkington, J. & Stevenson, M. (2013), op cit
146 ibid
147 Mayhew, C. and Quinlan, M. (2006), ‘Economic pressure, multi-tiered subcontracting and occupational
health and safety in the Australian long-haul trucking industry’, Employee Relations 28(3), pp.212-229.
73
enable quantification of the "... size and nature of the relationship between payment approaches and
the risk of crashing among long distance heavy vehicle drivers." Moreover:
"While Williamson et al (2001) reported a clear link between trip-based pay structures, drug
use and experiences of fatigue breaches of driving hours regulations, there is little evidence
on the relationship between crash risk and performance-based pay structures, including
incentive payment for early delivery or penalties for late delivery, piece rate payments (trip
rate, per kilometre or measures of load, or some combination of these approaches) versus
set salaries."148
Payment schedules were among the factors assessed for potential correlation with accident
involvement, with the major payment types identified being payment schedules based on a
kilometre rate, trip rate or flat hourly rate. The authors found:
"...no significant differences between cases and controls on the types of payment schedules
they were being paid under for the week prior to the crash (for cases) or the week prior to the
interview (for controls) except for the category “other” which comprised things such as
payment by the palette, tonnage, or a mix of different payment types packaged together."149
That is, the authors found no greater accident involvement probability for drivers paid on a per trip
or per kilometre basis, compared with those paid on an hourly basis.
The authors also compared the experience of cases and controls (i.e. those who had and had not had
an accident during the study period) in relation to a range of the payment-related factors that have
been highlighted within the context of the policy discussion of the safe rates issue. The authors
found no significant links between likelihood of crash involvement and payment for loading or
unloading time, hours of paid work or hours of unpaid work. These conclusions are notable in that
these factors are frequently cited as being significant contributors to drivers receiving low total
remuneration levels and, therefore, as contributing to increased accident risk.
The authors did, however, find that a significantly smaller number of the drivers receiving incentive
payments had been involved in an accident (0.6% vs 2.9% of the controls).150 However, the nature
and extent of these incentive payments were not discussed.
5.1.4.1.6 Britto et al (2010)151
Britto et al differs from the above studies in that, rather than focussing solely on driver
remuneration, the authors examined both the relationship between carriers' financial performance
(estimated as net profit, in contrast to some earlier studies which used cash flow measures) and
driver remuneration on three measures of safety performance: crash involvement, plus two
measures of safety risk: the driver safety evaluation area (DRSEA) score and the vehicle safety
148 Elkington, J. & Stevenson, M. (2013), op cit
149 ibid. Those receiving payment on a basis included in this "other" category were found to be significantly less
likely to have been involved in an accident during the study period. 150
ibid, p 24 151
Britto et al (2010), op cit

74
evaluation area (VHSEA) score. A one year lag was used, so that safety performance was measured
for the year following the financial performance data adopted.
The study found statistically significant correlations between net profit and all three measures of
safety performance. Higher driver wages were also found to be significantly associated with lower
accident rates, however, the size of this effect was found to be almost an order of magnitude smaller
than that of net profit (co-efficient - 0.15 vs - 1.32). Hence, Britto et al's findings in relation to the
impact of driver wages can be seen as broadly consistent with those of Nafukho et al152 in that the
observed relationship between driver remuneration and accident involvement was statistically
significant but small in size. Consistent with these findings, the policy discussion contained in the
article focuses entirely on the issue of firms financial performance.
Relationship between driver employment status and accident history 5.1.5
A further strand of research considers the question of the potential relationship between driver
status and accident involvement. Some studies have focused specifically on the owner driver sector,
while others have also sought to identify any differences in accident involvement between employee
drivers working in small, medium and large fleets and others have focused on whether drivers in
particular fleets are unionized or not.
Indirect indicators of safety performance by employment type have been reported by Hensher et al
(1991)153 and Williamson et al (2009).154 Hensher et al155 found that, while stimulants were widely
used in the industry, owner drivers were the least likely group to use them. Williamson et al reports
similar findings, stating that "drivers employed by small or medium size companies were also at least
twice as likely as owner drivers to report using drugs."156
Similarly, studies that have considered accident involvement by employment type generally found
owner drivers to have similar or better safety performance than employee drivers. Cantor et al157
analyses the owner driver sector specifically while Williamson et al158 includes both employee and
owner drivers in the analysis, focussing specifically on the short-haul sector. Cantor et al159 identified
characteristics and incentives that were unique to the owner driver sector and likely to affect driver
behaviours in relation to safety and tested them in comparison to rates of crash involvement.
Williamson et al adopted a similar research model to study a range of occupational health and safety
related criteria across the different types of drivers (permanent employees, owner drivers and
casuals) to determine whether there were differences between employee and owner drivers in
terms of incidence of work-related illness or injury.
152 Nafukho et al (2007), op cit
153 Hensher et al (1991), op cit
154 Williamson, A., Bohle, P., Quinlan, M. & Kennedy, D. (2009). ‘Short Trips And Long Days: Safety And Health
In Short-Haul Trucking’. Industrial and Labor Relations Review, Vol. 62, No. 3 (April 2009). 155
Hensher et al (1991), op cit 156
Williamson et al (2009), op cit 157
Cantor, DE., Celebi, H., Corsi, TM. and Grimm, CM. (2013). Do Owner–Operators Pose A Safety Risk On The Nation’s Highways? Transportation Research Part E 59 (2013), pp. 34–47 158
Williamson et al (2009), op cit 159
Cantor et al (2013), op cit

75
5.1.5.1 Cantor et al (2013)160
The authors of this study note the paucity of research on this specific issue, stating that "...there is
little empirical work directly comparing owner–operator safety performance to that of employee
drivers." They sought to test hypotheses that are very closely related to those that underlie the safe
rates model. Specifically, the authors tested the following hypotheses:
Owner–operators need to exceed the mandated hours-of-service in order to meet
equipment payments and operating/maintenance expenses and earn a ’living wage’.
In a tight financial position, owner–operators could potentially delay needed maintenance or
short-circuit the required repairs.
Owner–operators may be difficult to manage and less likely to accept the rigor and structure
required by carriers. Lack of control over the owner–operators may put carriers in a position
of having to expedite shipments and to require drivers to exceed safe operating hours in
order to meet tight delivery schedules.
Cantor et al hypothesised that these dynamics would result in a greater likelihood of driver and
equipment violations and increased crash likelihood among owner–operators as compared to
employee drivers. These hypotheses were then tested using major United States databases.
The results reported by the authors are all statistically significant at the 99 per cent probability level.
They confirm the first two hypotheses tested, showing that owner drivers have higher levels of:
driver ‘out of service’ violations; and
vehicle ’out of service’ violations;
than do employee drivers. That is, owner drivers were found to have incurred a higher rate of
infringements that led to the driver or the vehicle being suspended from operation.
However, while owner drivers were found to perform more poorly on these two indirect indicators
of poor safety-related behaviours, the authors did not find that they also exhibited higher accident
rates than employee drivers. Instead, they found that owner drivers were on average 22 per cent
less likely to be involved in an accident than employee drivers. This result was statistically significant
at the 99 per cent probability level.
The fact that the crash-involvement correlation has the opposite sign from that predicted strongly
suggests that other factors are in play that have a stronger influence on crash involvement than do
vehicle or driver violations. The authors propose one possible factor to explain this result:
"One possible explanation for this result is that owner–operators, as business entrepreneurs,
recognize that a crash would seriously endanger their ability to continue in business.
Accidents frequently involve significant vehicle repair with major cost implications and time
160 ibid
76
delays. Furthermore, while the vehicle is being repaired, it is not available to use in
generating revenue." 161
They also note that their result in relation to accident involvement is consistent with results from
other studies, citing the following:
"In a comparison of fatalities of employee versus self-employed truck drivers, there is no
statistically noticeable difference in frequency of occurrence (Monaco and Williams, 2000).
Firm-level analysis of US motor carriers noted ‘‘significantly lower’’ accident rates with motor
carriers using owner–operators and unionized employees (Dammen, 2005), while a direct
comparison of different driver types in Australia showed owner–operators driving more miles
on average, with one-sixth the level of accidents as company drivers (Williamson et al.,
2009). The result is also consistent with documented evidence of strategies pursued by
owner–operators to find ways to extend the life of their existing equipment such as driving at
reduced speeds, avoiding mountainous roads, and taking lighter loads (Kvidera, 2009).
Finally, if owner–operators are so independent, they would not respond to pressure from
management to exceed safe operating hours."162
5.1.5.1.1 Williamson et al (2009)163
This Australian study focuses on the short-haul sector, another relatively less studied area, and
compares health and safety outcomes for permanent employees, casual employees and owner
drivers across a range of occupational health and safety-related criteria. Table 5.4 is reproduced
from this study.
161 ibid
162 ibid
163 Williamson et al (2009), op cit

77
Table 5.4: Injury and work-related illness experiences over the past 12 months for the three driver groups (permanent, casual, owner driver)
Vehicles
Employees, Permanent (N = 144) (per cent)
Employees, Casual
(N = 30) (per cent)
Owner Drivers (N = 35)
(per cent)
Equation
Work-related Accident(s) in last 12 months
18.3 20 2.9 x2
(2) = 5.44 p < 0.07
Work-related illnesses in last 12 months 13.6 3.3 8.6 x2
(2) = 2.9, p = 0.24.
Chronic work-related injury 36.6 6.7 22.9 x2
(2) = 10.7, p < 0.005
Workers’ compensation claim in past 5 years
39 24.1 5.7 x2
(2) = 15.3, p < 0.001
Violence related to truck driving 35.2 36.7 31.4 x2
(2) = 0.23, p = 0.89.
General health questionnaire (mean, s.d.) 2.69 (3.9) 2.13 (2.6) 2.81 (3.3) F(2,204) = 0.9, p = 0.4.
Frequency of experience of fatigue (0 = rarely to 100 = always (mean, s.d.)
2.85 (2.33) 2.23 (1.63) 2.13 (1.96) F(2,196) = 2.1, p = 0.13
Source: Williamson et al (2009), op cit, p.425.
As highlighted by Cantor et al,164 the percentage of owner drivers that had experienced a work-
related accident in the previous year, at 2.9 per cent, was found to be less than one sixth of that for
either permanent employees (18.3 per cent) or casual employees (20.0 per cent). Also notable is the
fact that the score for frequency of experience of fatigue was lowest for owner drivers (2.13 vs 2.23
and 2.85 for casual and permanent employees respectively). Finally, the owner drivers rated most
highly on the general health questionnaire.
The context for these results indicating superior safety performance among owner drivers is one of
lower average incomes among this group than employee drivers. While the income difference cited
by the authors is relatively small, at 6 per cent, this result appears to be relevant to the Australian
context in which it is widely believed that owner drivers have lower income levels on average than
employees, as discussed below.
Remuneration vs other relevant factors affecting safety management 5.1.6
5.1.6.1 Mooren et al (2014)165
This, the most recent study identified, "reviews the literature concerning safety management
interventions, that have been effective in reducing injury outcomes in occupational health and safety
(OHS) and road safety, and assesses their applicability to reducing crash and injury outcomes in
heavy vehicle transport."166
164 Cantor et al (2013), op cit
165 Mooren, Lori, Grzebieta, Raphael, Williamson, Ann, Olivier, Jake and Friswell, Rena. (2014), Safety
management for heavy vehicle transport: A review of the literature. Safety Science, Vol.: 62, pp: 79-89, February 2014. 166
ibid
78
The authors highlight the fact that they had found "...little robust empirical research in the heavy
vehicle transport sector providing evidence of effective safety management characteristics that
reduced crashes and injuries"167 and that, as a result, they had also reviewed research on safety
management practices, safety culture and injury risk assessment in other areas of transport and
work health and safety (WHS) that purported to directly influence crash and/or injury outcomes.
The authors found the strongest evidence for the impact on safety outcomes of management
commitment, safety training and scheduling and journey planning, each of which were confirmed as
statistically significant predictors of safety outcomes in 10 or more organisation and individual level
studies, including both those focused on heavy trucking as well as those that studied other
occupational sectors. Less strong evidence (stated to be support for links with safety outcomes in at
least four studies) was found for the role of worker participation in WHS, vehicle conditions or
physical work environment, the size of the organisation and type of freight and incentives.
Table 5.5 below is reproduced from Mooren et al168 and summarises the results of their literature
review in terms of the number of studies of different types that have found associations between
particular variables and safety performance.
167 The authors noted that: "In fact, despite finding 124 potentially relevant studies, only 42 provided evidence
of statistically significant links between occupational characteristics and safety outcomes. Of these, only 17 studies (40%) focussed on comparing differences at an organisation or company level. The majority of studies into the characteristics that predict improved safety outcomes used the individual person, group or vehicle as the unit of study. While this latter evidence is useful, it may not be possible to understand whether the relationship between characteristics and safety outcomes operate at the organisation or system level or whether they are simply due to individual differences." 168
Mooren et al (2014), op cit
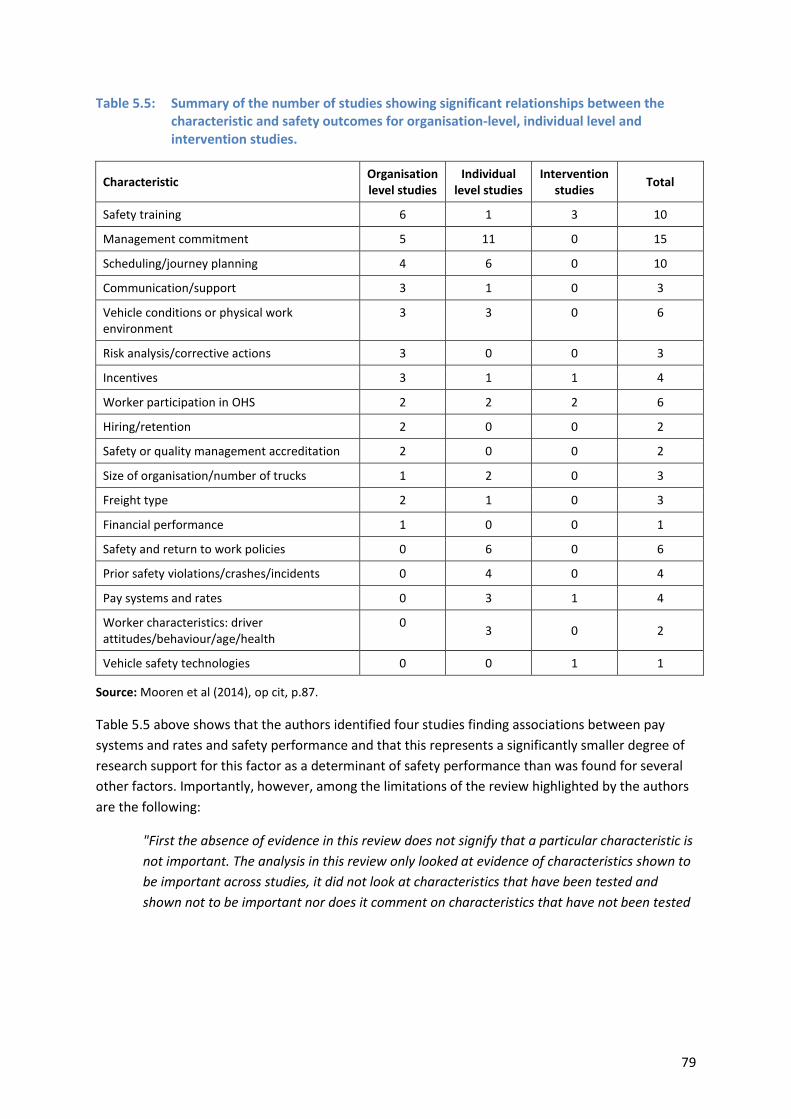
79
Table 5.5: Summary of the number of studies showing significant relationships between the characteristic and safety outcomes for organisation-level, individual level and intervention studies.
Characteristic Organisation level studies
Individual level studies
Intervention studies
Total
Safety training 6 1 3 10
Management commitment 5 11 0 15
Scheduling/journey planning 4 6 0 10
Communication/support 3 1 0 3
Vehicle conditions or physical work environment
3 3 0 6
Risk analysis/corrective actions 3 0 0 3
Incentives 3 1 1 4
Worker participation in OHS 2 2 2 6
Hiring/retention 2 0 0 2
Safety or quality management accreditation 2 0 0 2
Size of organisation/number of trucks 1 2 0 3
Freight type 2 1 0 3
Financial performance 1 0 0 1
Safety and return to work policies 0 6 0 6
Prior safety violations/crashes/incidents 0 4 0 4
Pay systems and rates 0 3 1 4
Worker characteristics: driver attitudes/behaviour/age/health
0 3 0 2
Vehicle safety technologies 0 0 1 1
Source: Mooren et al (2014), op cit, p.87.
Table 5.5 above shows that the authors identified four studies finding associations between pay
systems and rates and safety performance and that this represents a significantly smaller degree of
research support for this factor as a determinant of safety performance than was found for several
other factors. Importantly, however, among the limitations of the review highlighted by the authors
are the following:
"First the absence of evidence in this review does not signify that a particular characteristic is
not important. The analysis in this review only looked at evidence of characteristics shown to
be important across studies, it did not look at characteristics that have been tested and
shown not to be important nor does it comment on characteristics that have not been tested

80
at all. The value of this review is that it distils those characteristics that have been tested and
demonstrated to be related to safety outcomes to date."169
Summary of research findings 5.1.7
Concerns regarding a possible link between remuneration and safety began to be highlighted at the
time of the economic deregulation of the trucking industry in the United States, over 30 years ago.
These concerns meant that the relationship has been studied over an extended period, albeit that a
range of different relationships have been measured and there are in many cases few studies
addressing particular, fundamental relationships.
Early research on the United States experience, where the economic deregulation of the industry
had substantial impacts in lowering average freight rates, generally concluded that no negative
effect on safety had resulted. Subsequently, most or all other OECD countries followed suit with
economic deregulation. Despite the issue of remuneration and safety remaining under review
throughout the post-deregulation period, no country is known to have moved to reintroduce price
or other economic regulation.
In more recent times, ACIL-Tasman170 reviewed the literature on the issue of remuneration and
safety performance on behalf of the Australian Transport Council.171 ACIL-Tasman noted that this
literature was limited in extent and of variable methodological quality, while the conclusions
reached also differed widely. They concluded that:
"…examination of recent Australian literature reveals that there is little, if any, difference
between the safety performance of owner operators, small operators and employee drivers".
Conversely, "there are a number of international studies that identify a much stronger link
between size of firm, freight rates and safety performance".172
ACIL-Tasman cited Belzer et al173 and two other references (Corsi et al (2002)174 and Moses and
Savage (1994))175 in support of this latter conclusion. However, of these three studies, only Belzer et
al176 reviewed the link between driver pay and accident involvement. The other two studies instead
focus on links between firm characteristics and safety performance, with Corsi et al177 finding that
"…firms that exhibit characteristics that imply better driver safety performance tend to have higher
169 Mooren et al (2014), op cit
170 ACIL-Tasman (2003), op cit
171 The Australian Transport Commission (the CoAG Ministerial Council comprising all transport ministers)
appointed the Standing Committee on Transport (SCOT) Working Group. This group commissioned the 2003 ACIL-Tasman report. 172
ACIL-Tasman (2003), op cit 173
Belzer et al (2002), op cit 174
Corsi, T., Barnard, R., & Gibney, J. (2002), Motor Carrier Industry Profile: Linkages Between Financial and Safety Performance Among Carriers in Major Industry Segments, Paper prepared for the Federal Motor Carrier Safety Administration, Analysis Division, U.S Department of Transportation. 175
Moses, L. N., & Savage, I. (1994). ‘The effect of firm characteristics on truck accidents.’ Accident Analysis and Prevention Vol.26(2), pp.173-79. 176
Belzer et al (2002), op cit 177
Corsi et al (2002), op cit
81
gross revenues"178 and Moses and Savage179 finding that accident rates tend to decline with
increasing firm size. Neither of these relationships is directly related to the underlying policy
rationale for the RSR Act.
A discussion paper released by the Standing Committee on Transport Working Group following their
review of the ACIL-Tasman report180 concluded, as one of its major findings, that "Evidence relating
financial pressures to road safety is mixed and inconclusive."181 It states that Australian and overseas
research does not present a persuasive road safety-based case for Governments. This reflects the
fact that, while the research shows a link between low remuneration and unsafe on-road practices
such as speeding and driving excessive hours, it does not appear that the detrimental effects noted
in the research are being translated into poor road safety outcomes as there is no significant
difference between the safety performance of owner drivers, small operators and employee drivers.
The report noted that “...a road safety case for addressing owner-driver financial returns cannot be
made at this time.”182
Quinlan183 challenged this conclusion, first arguing that none of the research reaches the contrary
conclusion - i.e. that financial pressure is positively associated with road safety - and that such
conclusions are required if the results are reasonably to be described as ‘mixed’. This contention,
while arguable, is not an accurate summary of the literature. As noted above, at least one study, that
of Hunter and Mangum,184 did find statistically significant relationships with the opposite sign to that
hypothesised, while Rodriguez et al185 also demonstrated a negative link between remuneration and
safety within a certain range. Moreover, Cantor et al (2013)186 found both lower remuneration and
lower accident involvement for owner drivers compared with employees, while Williamson et al
(2009)187 also found substantially lower accident rates among owner drivers, albeit that their data do
not directly confirm the lower average remuneration of this group.
Quinlan and Wright188 also argue that research evidence is commonly mixed (in the sense that not all
research supports the hypothesis being tested) and that "The real question is whether there is a
weight of evidence favouring one interpretation over another." Quinlan and Wright argue that this
‘weight of evidence’ does, indeed, exist.
However, as discussed above, only a small number of studies have found strong links between driver
remuneration and accident involvement - i.e. the issue at the heart of the RSRS model - as distinct
178 ACIL-Tasman also cited research by the US General Accounting Office which found links between firm
profitability and safety indicators. See: General Accounting Office (1991), Freight Trucking: A Promising Approach for Predicting Carriers' Safety Risks, General Accounting Office, Washington, DC. 179
Moses & Savage (1994), op cit 180
ACIL-Tasman (2003), op cit 181
Standing Committee on Transport Working Group (2003). Heavy Vehicle Safety and Safe Sustainable Rates for Owner Drivers, Department for Planning and Infrastructure, Perth, p.6. 182
Ibid, p.9 183
Quinlan (2001), op cit 184
Hunter and Mangum (1995), op cit 185
Rodriguez et al (2006), op cit 186
Cantor et al(2013), op cit 187
Willaimson et al (2009), op cit 188
Quinlan and Wright (2008), op cit

82
from linkages between various safety indicators, both direct and indirect, and other financial
variables, many relating to firm performance. Moreover, the studies in this group draw quite
different conclusions regarding the specific nature and extent of the links between safety and driver
remuneration, in ways that are highly significant from a policy perspective. While Belzer et al189 and
Rodriguez et al190 both conclude that remuneration has a strong impact on safety, the latter finds
that the direction of the correlation reverses at higher levels of remuneration, indicating that
remuneration levels that are too high are likely to be associated with safety performance as poor as
those that are too low. This raises the issue of whether and how it would be possible to identify
’optimal’ remuneration levels from a safety perspective. Conversely, Nafukho et al191 finds that,
while a significant correlation exists, the size of the impact is very small. Monaco and Williams192 find
similarly small coefficients and highlight firm-level financial performance as the major factor in links
between financial variables and safety performance.
The United States FMCSA in summarising the literature on remuneration and safety in the 2007
LTCCS stated that:
"... a number of studies purport to draw a relationship between driver compensation and
safety outcomes, for example, that increased pay is associated with a reduction in crashes.
The reviewers offer a cautionary note to these assertions: generally, it is not possible to
understand the true nature of the relationship between these two factors. Specifically, it may
be unclear whether cash bonuses for safe driving are responsible for higher pay, or that
offering better pay at a company improves its ability to recruit and hire greater numbers of
quality drivers."193
A further strand of the literature is arguably particularly relevant in the Australian context, in which
concerns regarding low remuneration levels have historically been focused largely on the owner
driver sector, as reflected inter alia in the fact that all three sets of state government legislation
addressing driver remuneration focus on this area. As noted above, Cantor et al,194 whose own study
found significantly lower accident involvement rates among owner drivers than employee drivers,
also summarised previous literature on this subject as generally demonstrating similar results. Such
results suggest, at the least, that any negative impact on safety due to low remuneration is being
more than offset by other factors bearing on the owner driver sector.
In sum, review of the literature suggests likelihood that some correlation between various financial
measures (including firm financial performance and driver remuneration) and safety performance
exists, at least where very low levels of remuneration are concerned. However, both the nature and
extent of the impact on safety performance of a change in driver remuneration is highly uncertain.
189 Belzer et al (2002), op cit
190 Rodriguez et al (2006), op cit
191 Nafukho et al (2007), op cit
192 Monaco & Williams (2000), op cit, and Williams and Monaco (2001), op cit
193 FMCSA (2007), op cit
194 Cantor et al (2013), op cit
83
As noted above, the recently published literature review by Mooren et al195 suggests that this
conclusion remains current, with only four studies showing significant links between pay systems
and financial performance being identified and, by contrast, much more extensive evidence being
identified addressing the links between safety performance and a range of other variables.
Given these conclusions on the state of the research literature, the fact that numbers of
stakeholders have lobbied the Tribunal to conduct further research into this issue is unsurprising.
The Tribunal is understood not to have taken up this suggestion to date, with no reference to such
research being included in its current annual work program. It may be speculated that the Tribunal
has taken the view that its establishment by the previous government indicates that government has
taken a firm view on the issue of the remuneration and safety link and that it this should be
regarded as settled. However, while institutionally understandable, such a view could have a
negative impact on the Tribunal's effectiveness by limiting its ability to understand the precise
nature and extent of any links and, consequently, key factors affecting the potential effectiveness of
its work.
5.2 Remuneration levels in the road transport industry
As noted above, even if it is accepted that there is a significant linkage between driver remuneration
and safety performance, increases in remuneration are only likely to have a discernible positive
impact on safety if ex ante remuneration levels are low. That is, the safe rates hypothesis is that
unsafe driving is a response to severe economic pressure brought about by very low pay rates. An
understanding of the current remuneration levels in the Australian road transport sector is therefore
fundamental to reaching a view on whether remuneration is likely to be an important factor
influencing road safety performance in practice in the current context. Remuneration arrangements
differ between owner drivers and employees. Hence, this issue is addressed separately for the two
sectors.
Owner driver remuneration 5.2.1
It is widely believed that owner drivers have experienced low net income levels over a long period.
This is reflected in the fact that the legislative initiatives taken in Victoria, NSW and Western
Australia to support heavy vehicle driver remuneration levels have all focused on this sector of the
industry. However, despite widespread acceptance of this view, data on this issue are extremely
limited.
A widely cited figure was calculated by ACIL-Tasman and included in its report to the Standing
Council of Transport Ministers.196 ACIL-Tasman found that the average pre-tax profit of non-
employing road transport businesses was $20,637. This figure was calculated using unpublished ABS
data for 1999-2000.197 This notional profit figure effectively includes the return to both the labour
supplied by the owner driver and the capital employed (i.e. the owner driver's equity in the value of
195 Mooren et al (2014), op cit
196 ACIL-Tasman (2003), op cit
197 ACIL-Tasman states that this unpublished ABS data is "experimental taxation data using taxation data and
data from the ABS economic activity survey" (p 13).

84
his truck). Thus, to derive an effective ‘wage equivalent’ a normal rate of return on the capital
employed would need to be deducted from this figure.
The Victorian Government's guideline rates cite average truck values of between $80,441 (12 tonne
rigid truck) and $112,117 (6 axle semi-trailer). An average of these figures is around $96,279.
Applying the average 10 year government bond rate of around 5.2 per cent198 as a conservative
proxy for a normal rate of return on capital, this suggests that return on capital should be around
$5,007. However, it is likely that most owner drivers either lease their truck or have substantial
borrowings against the value of their truck. In either case, the owner driver's equity in the truck will
be very much smaller than its value. For this reason, a simplifying assumption can be made that the
above figure of $20,637 constitutes a pure return on labour inputs—that is, it is effectively assumed
that equity is zero.
The above average income figure relates to 1999-2000 and, as noted, was calculated based on an
analysis of unpublished data. The Review contacted the ABS to determine whether similar data were
available for more recent periods, to enable an updating of this calculation. However, it was
informed that the relevant data analysis has not subsequently been replicated by ABS, so that it is
not possible to develop equivalent average profit estimates using current (or more recent) data.
The Review also attempted to identify other, more recent, estimates of owner driver incomes. These
efforts included asking a range of stakeholders to identify any relevant data. However, no high
quality data were identified. In this context, it is noted that the RIS prepared in respect of the Road
Safety Remuneration Bill in 2011 also indicated that the ACIL-Tasman estimate remained the "most
recent data on owner-driver remuneration". Given this, attempts have been made to update the
ACIL-Tasman estimates.
The BITRE publication Freight Rates in Australia 1964-65 to 2007-08199 shows that real road freight
rates in 2007-2008 were little different from those paid in 1999-2000: rates increased by only 4.5 per
cent over the eight-year period, while substantial real increases in fuel costs are likely to have more
than offset the impact of this marginal increase on owner driver incomes.200 The ABS Producer Price
Index (ABS Cat. 6427.0)201 provides estimates of changes in road freight prices on a quarterly basis,
which can be expected to be closely correlated with owner driver incomes. The Producer Price Index
(PPI) increased by 59.8 per cent between December 1999 and December 2013. This compares with a
51.7 per cent increase in the all groups Consumer Price Index (CPI) over the same period,202
indicating that there has been very little change in real road freight rates over the past 13 years
while real fuel costs have risen over the period. Given this, real driver incomes are unlikely to have
increased.
198 Based on taking the average of the 10 year Treasury bond annual rates as published on the ATO website
from 2003-04 – 2012/13: http://www.ato.gov.au/Rates/Key-superannuation-rates-and-thresholds/?page=34 (accessed 7 April 2014). 199
BITRE (2008), Freight Rates in Australia 1964-65 to 2007-08, Department of Infratructure, Trasport and Regional Development, Canberra 2008. http://www.bitre.gov.au/publications/2008/is_028.aspx (accessed 7 April 2014) 200
See BITRE Information Sheet No. 28, Figure 1 and Table 1. 201
Australian Bureau of Statistics (Dec 2013), Producer Price Index (cat. 6427.0) 202
CPI all groups Australia Dec 2013 = 104.8, Dec 1999 = 69.1. 104.8/69.1 = 1.517
85
If it is assumed that owner driver wages have remained approximately constant in real terms, as the
above suggests, the PPI can be applied to the 1999-2000 average income figure cited above to
obtain an estimate of current average owner driver incomes. The average income figure of $20,634
is multiplied by 1.598203 to obtain an equivalent 2013 average income of $32,973. This figure can be
compared with the notional award wage that would be payable to obtain an estimate of the
difference between average owner driver incomes and minimum employee driver incomes and, by
implication, the increase in driver payments that would occur were the Tribunal to seek to equalise
the two rates via future RSRO.
Two awards currently cover the majority of the road transport industry, the Road Transport and
Distribution Award 2010 (RTD Award) and the Road Transport (Long Distance Operations) Award
2010 (LDO Award). As the name suggests, the LDO Award applies to long distance operations, while
the RTD Award applies in other cases. The current award rate for an articulated vehicle driver is
$18.78 per hour under the RTD Award and $19.60 per hour under the LDO Award.204 ACIL-Tasman205
estimated that the average number of hours worked by full time owner drivers was 51 per week,
using ABS data for 2002.206 No more recent published estimate of the hours worked by this group
has been found. However, ABS data for 2012 show that the average number of hours worked by
employee drivers was 46.6.207 Given the likelihood that owner drivers would work longer hours than
employee drivers on average, particularly in the context of the income pressures identified, it
appears that the 2002 estimate of 51 hours is likely to remain broadly reflective of the current
number of hours worked on average by owner drivers. Hence, this estimate is used in the following
calculation.
Using the RTD Award as a base, wherein a standard working week is 38 hours, this suggests that 13
hours per week would be payable at overtime rates. It is assumed conservatively that these hours
would all be paid at time and a half, rather than double time.208 An award wage for a 51 hour week,
using these assumptions, under the RTD Award would be:
($18.78 x 38) + ($18.78 x 1.5 x 13) = $1,079.85.
This is equivalent to $56,306 per annum. This suggests that employee drivers working under the RTD
Award and receiving only the award wage receive an average of $23,330, or 70.8 per cent, more
than the estimated current average income for owner drivers, while employee drivers working under
the LDO Award would receive slightly more again.
203 i.e. the PPI is used, as per the above discussion.
204 Grade 6 driver rate. See:
http://www.commerce.wa.gov.au/LabourRelations/PDF/Awards/T/Transport_Workers_General_Award.pdf (accessed 7 April 2014) 205
ACIL-Tasman (2003), op cit 206
Williamson et al (2001) similarly calculated an average work week of 55 among a sample of 1007 truck drivers interviewed at truck stops. The ABS data is obviously preferred due to its standing and the probability of a higher quality and more randomly selected sample being used. 207
ABS, Employee Earnings and Hours, ABS Cat. 6306.0. May 2012. Data for "truck drivers". 208
The RTD Award provides for the first two hours of overtime daily to be paid at 150%, with subsequent hours paid at 200%.
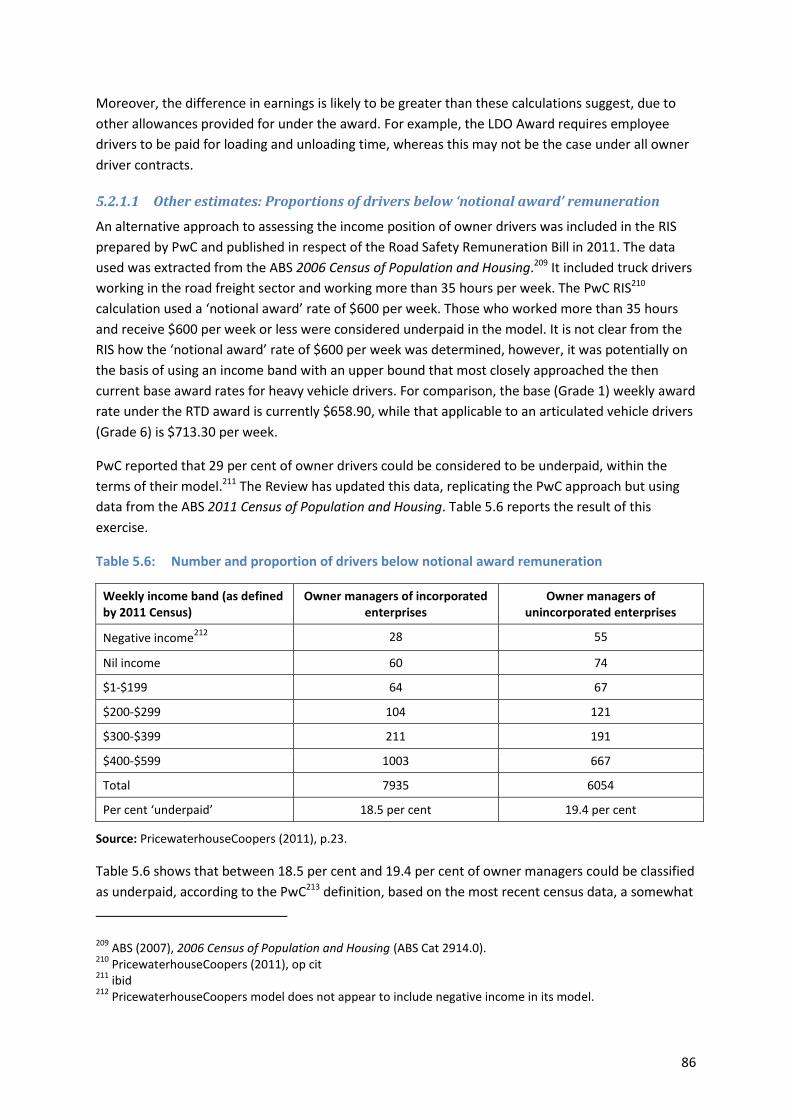
86
Moreover, the difference in earnings is likely to be greater than these calculations suggest, due to
other allowances provided for under the award. For example, the LDO Award requires employee
drivers to be paid for loading and unloading time, whereas this may not be the case under all owner
driver contracts.
5.2.1.1 Other estimates: Proportions of drivers below ‘notional award’ remuneration
An alternative approach to assessing the income position of owner drivers was included in the RIS
prepared by PwC and published in respect of the Road Safety Remuneration Bill in 2011. The data
used was extracted from the ABS 2006 Census of Population and Housing.209 It included truck drivers
working in the road freight sector and working more than 35 hours per week. The PwC RIS210
calculation used a ‘notional award’ rate of $600 per week. Those who worked more than 35 hours
and receive $600 per week or less were considered underpaid in the model. It is not clear from the
RIS how the ‘notional award’ rate of $600 per week was determined, however, it was potentially on
the basis of using an income band with an upper bound that most closely approached the then
current base award rates for heavy vehicle drivers. For comparison, the base (Grade 1) weekly award
rate under the RTD award is currently $658.90, while that applicable to an articulated vehicle drivers
(Grade 6) is $713.30 per week.
PwC reported that 29 per cent of owner drivers could be considered to be underpaid, within the
terms of their model.211 The Review has updated this data, replicating the PwC approach but using
data from the ABS 2011 Census of Population and Housing. Table 5.6 reports the result of this
exercise.
Table 5.6: Number and proportion of drivers below notional award remuneration
Weekly income band (as defined by 2011 Census)
Owner managers of incorporated enterprises
Owner managers of unincorporated enterprises
Negative income212
28 55
Nil income 60 74
$1-$199 64 67
$200-$299 104 121
$300-$399 211 191
$400-$599 1003 667
Total 7935 6054
Per cent ‘underpaid’ 18.5 per cent 19.4 per cent
Source: PricewaterhouseCoopers (2011), p.23.
Table 5.6 shows that between 18.5 per cent and 19.4 per cent of owner managers could be classified
as underpaid, according to the PwC213 definition, based on the most recent census data, a somewhat
209 ABS (2007), 2006 Census of Population and Housing (ABS Cat 2914.0).
210 PricewaterhouseCoopers (2011), op cit
211 ibid
212 PricewaterhouseCoopers model does not appear to include negative income in its model.

87
lower figure than that derived on the basis of the 2006 data. However, as suggested above, these
results would in both cases somewhat under-estimate the proportion of owner-managers who were
receiving incomes below the award rate to which they would be entitled as employee drivers.
Additionally, the weekly income earned from operating as an owner-manager also includes income
from other sources such as interest, dividends or rents, further underestimating the proportion of
owner-managers below the comparable award rate. If the proportion of owner-managers earning
incomes in the next income band ($600 - $799 per week) is added to the ‘underpaid’ group, in
recognition of these factors, the total proportion of underpaid owner-managers becomes 37.4 per
cent in the case of incorporated enterprises and 35.3 per cent in the case of unincorporated
enterprises.
Explaining the incidence of underpayment, PwC argued that lack of information on cost structures
was likely to be a major factor initially while, in the medium term, the fact that owner drivers may be
locked into truck leases, contracts and other commitments may account for their continuing to earn
low incomes.214 This explanation is consistent with the views put by many stakeholders during the
consultation process, which suggested that many owner drivers experienced good economic returns
and that the lack of the business acumen required to run independent businesses would, in many
cases, account for observations of low income levels among a minority of this group. The legislative
approaches adopted in Victoria, NSW and Western Australia are predicated on the same approach,
in that they focus on providing information and related tools to enable owner drivers to better
manage their own interests.
The most recent modelling, using the approach adopted in the RIS in respect of the Road Safety
Remuneration Bill, effectively concludes that over 80 per cent of owner drivers are not ‘underpaid’,
at least in terms of the metric used in the RIS. While the data from the two sources are not directly
comparable, this most recent data does appear to suggest a smaller gap between owner driver
incomes and employee driver incomes than do the ACIL-Tasman estimates discussed above.
Finally, while the above analysis suggests that average owner driver remuneration is low, and has
remained low over an extended period, some evidence suggests that there may be relatively wide
variability in the financial performance of this group, with large numbers potentially being much
better off than the average data would imply. ABS data from 2011 Census of Population and Housing
indicates that 4007 owner drivers, representing close to a third of those surveyed, earned annual
incomes over $65,000, and 1231 owner drivers (8.5 per cent) reported earnings over $104,000.215
This suggests that a proportion of owner drivers are able to command a premium price for provision
of a higher quality service and potentially provides support to the views of some stakeholders that
poor financial performance in this sector is often in large part a product of a lack of business skills.
213 ibid
214 ibid, p.24
215 ABS (2011), 2011 Census of Population and Housing, (ABS Cat. 2911.0 February 2011).

88
Employee drivers 5.2.2
Most employee drivers in the road transport industry are covered by either the RTD Award or the
LDO Award, although the Transport Industry (Cash in Transit) Award 2010 and the Waste
Management Award 2010 would also cover some drivers.
The RTD award provides for hourly and weekly wage rates for a range of classifications and does not
differentiate driving and non-driving time. By contrast, the LDO Award allows for drivers to be paid
on either an hourly rate or a cents per kilometre basis, with the latter method being the default
method where none has been nominated by the employer. In addition, the LDO Award differentiates
between driving and non-driving hours, with the hourly rate (if used) being higher for the former.216
The LDO Award also explicitly provides for payment for loading and unloading, with these duties
being paid at the same rate as the hourly driving rate. It requires that a minimum payment of one
hour loading and one hour unloading per trip must be made where loading or unloading duties are
required.
While awards provide a base level of remuneration, a large proportion of drivers appear to receive
significantly over-award wages under the terms of various enterprise agreements. For example,
according to comparative schedules of enterprise agreements published on the Tribunal's website, a
Grade 6 driver, whose award wage under the RTD Award is $713.30, is paid $1,029.02 under the
Startrack Express agreement,217 while a Grade 7 driver is paid $953.42 under the Visy (Vic & SA)
agreement.218
Aggregate data 5.2.3
The incidence of over-award payments clearly adds complexity to the issue of determining the actual
remuneration levels paid. However, a market analysis prepared by Deloitte Access Economics for
Coles Pty Ltd and included in the latter's submission to the Review incorporated an international
comparison of average truck driver wages, which compares Australian wages with those of the
United States and the United Kingdom. Table 5.7, below, is reproduced from this report.219
216 The driving rate is calculated by dividing the minimum weekly rate by 40, and multiplying by 1.3 (industry
disability allowance) and 1.2 (overtime allowance). 217
See: http://www.rsrt.gov.au/index.cfm/research/research-1/#22Mar2013 (accessed 7 April 2014). 218
See: http://www.rsrt.gov.au/index.cfm/research/research-1/#22Mar2013 (accessed 7 April 2014). 219
Deloitte Access Economics (2013), Market Analysis of the Australian Road Freight Transport Sector, Prepared for Coles Supermarkets Australia, 22 April 2013, p 36.

89
Table 5.7: Average earnings for truck drivers and all occupations internationally
Country Average wage for all
occupations Truck driver wage
Percentage Difference
Australia (weekly wages AUD$2012)
$1,123 $1,305 + 16.3 per cent
United States (annual wages USD$2011)
$45,230 $41,250 - 8.8 per cent
United Kingdom (weekly wages GBP£2012)
£490.3 £493.3 + 0.6 per cent
Sources: ABS (2012), Employee Earnings and Hours (Cat. 6306.0), Australia, May 2012; Bureau of Labour
Statistics (2011), Occupational Employment and Wages, May 2011, 53-3032, Heavy Tractor Trailer Truck
Drivers; Office of National Statistics (2012), ‘Annual Survey of Hours and Earnings, 2012 Provisional Results,
Table 14.1a Weekly gross (£) - for all employee jobs, United Kingdom, 2012.
Table 5.7 shows that, overall, truck driver earnings in Australia exceed average weekly earnings by
16.3 per cent. In contrast, truck driver earnings in the United Kingdom are approximately equal to
average weekly earnings, while in the United States they fall 8.8 per cent below average weekly
earnings. While this data compares wages in only a small number of countries, it is both recent and
comprehensive, as well as being based on official data collections in each case.
Review of the source data for Australia indicates that the figures cited are those for average weekly
cash earnings for all employees and all truck drivers respectively. However, this comparison is
arguably not the most appropriate for use in comparing truck driver wages with the economy-wide
average, as it does not account for two significant differences between the occupational profile of
truck-drivers as a group and the economy-wide average. These are that:
a higher proportion of truck drivers work full-time than is the case in the economy as a
whole; and
a higher proportion of truck drivers (indeed, presumably the total, given licensing
requirements) are adults.
These differences can be corrected by comparing average truck driver wages with average wages for
adult, full-time employees only. This comparison shows that average weekly cash earnings for full-
time non-managerial adult truck drivers were $1,386, while those for all full-time non-managerial
adult employees were $1,374. Thus, average full-time adult truck driver wages were $12 per week,
or 0.9 per cent higher than average full time adult wages.
The data for the United Kingdom and the United States was also reviewed in order to ensure
comparability as far as possible. The ABS data cited above refer to mean earnings, whereas those
cited for the United Kingdom appear to refer to median earnings. Thus, estimates of mean earnings
for the United Kingdom have been sourced to enhanced comparability, while it has been confirmed
that the data relate specifically to full time employees and are therefore broadly comparable in this
respect with the ABS data. In the case of the United States, it was verified that the data in question
report mean (cf. median) earnings and updated data giving the annual average for 2012 were
adopted. However, the United States data appears to relate to all employees, rather than full time
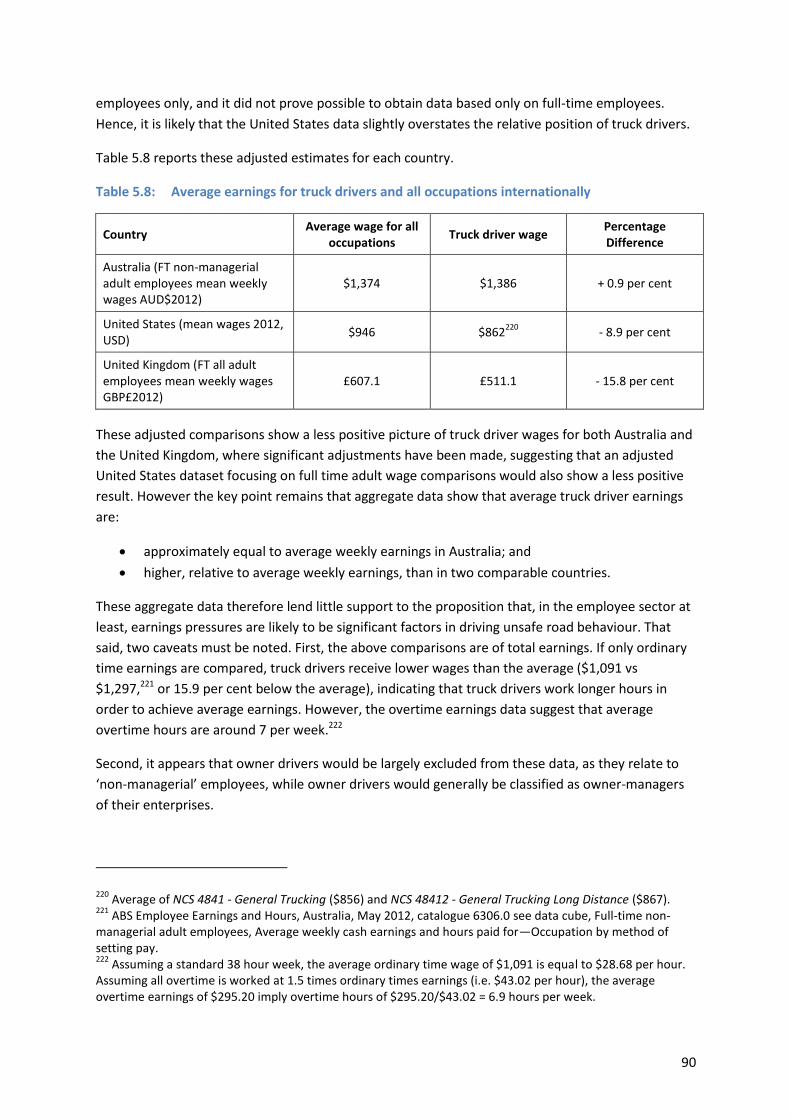
90
employees only, and it did not prove possible to obtain data based only on full-time employees.
Hence, it is likely that the United States data slightly overstates the relative position of truck drivers.
Table 5.8 reports these adjusted estimates for each country.
Table 5.8: Average earnings for truck drivers and all occupations internationally
Country Average wage for all
occupations Truck driver wage
Percentage Difference
Australia (FT non-managerial adult employees mean weekly wages AUD$2012)
$1,374 $1,386 + 0.9 per cent
United States (mean wages 2012, USD)
$946 $862220
- 8.9 per cent
United Kingdom (FT all adult employees mean weekly wages GBP£2012)
£607.1 £511.1 - 15.8 per cent
These adjusted comparisons show a less positive picture of truck driver wages for both Australia and
the United Kingdom, where significant adjustments have been made, suggesting that an adjusted
United States dataset focusing on full time adult wage comparisons would also show a less positive
result. However the key point remains that aggregate data show that average truck driver earnings
are:
approximately equal to average weekly earnings in Australia; and
higher, relative to average weekly earnings, than in two comparable countries.
These aggregate data therefore lend little support to the proposition that, in the employee sector at
least, earnings pressures are likely to be significant factors in driving unsafe road behaviour. That
said, two caveats must be noted. First, the above comparisons are of total earnings. If only ordinary
time earnings are compared, truck drivers receive lower wages than the average ($1,091 vs
$1,297,221 or 15.9 per cent below the average), indicating that truck drivers work longer hours in
order to achieve average earnings. However, the overtime earnings data suggest that average
overtime hours are around 7 per week.222
Second, it appears that owner drivers would be largely excluded from these data, as they relate to
‘non-managerial’ employees, while owner drivers would generally be classified as owner-managers
of their enterprises.
220 Average of NCS 4841 - General Trucking ($856) and NCS 48412 - General Trucking Long Distance ($867).
221 ABS Employee Earnings and Hours, Australia, May 2012, catalogue 6306.0 see data cube, Full-time non-
managerial adult employees, Average weekly cash earnings and hours paid for—Occupation by method of setting pay. 222
Assuming a standard 38 hour week, the average ordinary time wage of $1,091 is equal to $28.68 per hour. Assuming all overtime is worked at 1.5 times ordinary times earnings (i.e. $43.02 per hour), the average overtime earnings of $295.20 imply overtime hours of $295.20/$43.02 = 6.9 hours per week.
91
6 The policy context – Addressing heavy vehicle safety in Australia
Key Points
Historically heavy vehicle safety in Australia has been regulated through a combination of specific road transport legislation and generally applicable workplace health and safety legislation.
Key Commonwealth, state and territory regulation relevant to heavy vehicle safety and driver remuneration and conditions, includes:
o road transport regulation such as the Heavy Vehicle National Law and the concept of
‘Chain of Responsibility’;
o workplace health and safety regulation, including the model Work Health and Safety Act
and Regulations, and relevant codes of practice and guidance notes;
o Commonwealth, state and territory legislation regulating driver remuneration and
conditions such as the Fair Work Act 2009 (Cth), Chapter 6 of the Industrial Relations
Act 1996 (NSW), the Owner Drivers and Forestry Contractors Act 2005 (Victoria) and the
Owner drivers (Contracts and Disputes) Act 2007 (WA);
o legislation regulating the relationship between owner drivers and their hirers, such as
the Independent Contractors Act 2006 (Cth), and the Competition and Consumer Act
2010 (Cth); and
o other relevant Government policies and initiatives aimed at addressing safety concerns
in the road transport sector.
A substantial program of regulatory reform has been implemented in the area of heavy vehicle safety since the establishment of the National Road Transport Commission by all Commonwealth, state and territory governments in 1991. This has culminated in the recent adoption of the Heavy Vehicle National Law and establishment of the National Heavy Vehicle Regulator.
Key reforms adopted in a range of areas are a progressive move away from prescriptive regulation toward more flexible performance-based and process-based regulation, and the adoption of the ‘Chain of Responsibility’ concept to require parties other than drivers to take responsibility where they have influence over safety outcomes.
The reform program is still underway, with notable initiatives yet to be completed including a review of the Chain of Responsibility laws and the implementation of the road freight transport industry strand of the Work Health and Safety Strategy 2012-2022.
There is significant regulatory overlap, duplication and inconsistency between a range of existing legislation and the RSR Act. The extent of this overlap and duplication is necessarily increased to the extent that the Tribunal takes a broad view of its remit to address ’remuneration-related conditions’ under an RSRO, as has apparently been the case to date. The extent of regulatory overlap and inconsistency also appears to be increased to the extent that the approach adopted under the RSRS is essentially prescriptive in nature, in contrast to that of the Heavy Vehicle National Law and the Work Health and Safety laws.

92
6.1 Introduction
The primary objective of the RSR Act and the Tribunal is to promote safety and fairness in the road
transport industry, with fairness in this context presumably relating to remuneration and related
conditions. The Tribunal is empowered by the RSR Act to inquire into sectors, issues and
practices within the road transport industry and, where appropriate, determine mandatory
minimum rates of pay and related conditions for employee and owner drivers (generally
referred to as owner drivers).
Importantly, however, heavy vehicle safety—like road safety generally—is addressed via a range of
policy tools that go beyond the scope of government regulation. Improving the quality of the road
network is a key factor in achieving better safety performance and may be particularly important in
the heavy vehicle context. Improved vehicles which incorporate a range of new safety-related
technologies also contribute. While governments frequently regulate to require particular
technologies to be fitted to all vehicles sold, there is also an important market dynamic in this
regard.
The context for considering heavy vehicle safety is one in which the National Road Safety Strategy
2011–2020 has established a goal of reducing the annual numbers of both deaths and serious
injuries on Australian roads by at least 30 per cent by adopting a holistic approach to road safety
improvement and the interactions of various elements of the road transport system.
Historically heavy vehicle safety in Australia has been regulated through a combination of specific
road transport legislation and generally applicable work health and safety legislation. These areas of
legislation are currently undergoing change, with Commonwealth, state and territory governments
introducing a number of significant reforms in both areas.
The key initiative in the area of road transport legislation is the Heavy Vehicle Regulatory Reform,
which is intended to harmonise heavy vehicle laws across jurisdictions and deliver benefits in terms
of improved productivity, safety and environmental outcomes, while reducing regulatory burdens.
This reform involves the establishment of the NHVR to administer the new Heavy Vehicle National
Law (HVNL). This will constitute the first time in which there has been a single regulator with
jurisdiction over heavy vehicle safety regulation across Australia.
Work health and safety legislation, which is of general application and therefore covers the road
transport industry, has also been subject to a process of harmonisation towards a goal of nationally
consistent regulation. At the same time, under the Australian Work Health and Safety Strategy 2012-
2022 the road freight transport industry will be the focus of national prevention efforts to reduce
the number of fatalities in the industry.223
With specific regard to truck driver remuneration and conditions, legislation has been enacted in
NSW, Victoria and Western Australia which is directly targeted at regulating the relationship
between owner drivers and their hirers to ensure a safe and sustainable road freight industry in
223 As noted in the Transport Workers' Union submission, the number of heavy vehicle driver fatalities makes
the road freight industry one with the highest workplace fatality rate.
93
those states. However, the approach adopted in each state differs, particularly between the model
adopted in NSW and that employed in both Victoria and Western Australia. The RSR Act borrows
various aspects from each of these pieces of state legislation.
In addition to these state laws, as small businesses, owner drivers are also subject to various
Commonwealth laws that regulate the relationship between owner drivers and their hirers, including
the Independent Contractors Act 2006 (Cth) (IC Act), and the Competition and Consumer Act 2010
(Cth) (CC Act).
Employee drivers are meanwhile also covered by industrial legislation and instruments including the
Fair Work Act 2009 (Cth) (FW Act), which provides various employment protections and a minimum
safety net of wages and conditions.
The implementation of each of the above approaches to regulating road safety and truck driver
remuneration is discussed in further detail below.
6.2 Legislation addressing heavy vehicle safety
Road safety regulation 6.2.1
Constitutional responsibility for the regulation of road transport lies with state and territory
governments. Consequently each state and territory has historically implemented its own road,
vehicle and driver regulations, with the result that different state and territory legislation has been
required to be observed by all vehicles operating in, or through, each state or territory, regardless of
where the vehicle is registered. The difficulties caused by the regulatory inconsistencies inherent in
this system led over time to the establishment of the NRTC through an inter-governmental
agreement (IGA) in 1991, and its successor, the NTC, with responsibility to develop and coordinate
regulatory reforms and facilitate nationally consistent road transport policies and laws.224
The NTC has primarily sought to achieve nationally consistent road transport policies and laws
through the development and implementation of model national transport laws for adoption in each
state and territory. In doing so the NTC develops and submits reform recommendations for approval
to the Transport and Infrastructure Council (TIC) (formerly SCOTI) which comprises Commonwealth,
state and territory transport, infrastructure and planning ministers. The NTC also assists with
implementation planning to ensure reform outcomes are realised in practice, as well as
coordinating, monitoring, evaluating and maintaining the implementation of approved reforms.225
The NTC has developed as model legislation a common set of Australian road rules, uniform heavy
vehicle charges, common drivers licence classes, standard procedures for licence and registration
issues, and other measures designed to overcome inefficiency while improving productivity and
safety. However, while the IGA establishing the NTC encourages adoption of the model legislation,
there is no legal obligation on jurisdictions to do so. Thus, despite jurisdictions adopting model laws,
inconsistencies have persisted due to jurisdictions either varying specific provisions of the model
224 NTC, ‘About the National Transport Commission’, NTC [web page]
http://www.ntc.gov.au/ViewPage.aspx?documentid=44 (accessed 7 April 2014) 225
ibid
94
laws in accordance with their own legislative priorities, failing to adopt particular reforms, or
implementing reforms in a modified form in order to comply with particular drafting or other
legislative conventions specific to their state or territory.
6.2.1.1 Heavy Vehicle Regulatory Reform
More recently Australia’s transport and infrastructure ministers have agreed to a number of major
national transport reforms including the Heavy Vehicle Regulatory Reform. This reform establishes a
national system of regulation for all heavy vehicles weighing more than 4.5 tonnes, consisting of a
uniform national law, the HVNL, administered by a single national regulator, the NHVR.226 The
anticipated benefits of this reform include greater harmonisation of heavy vehicle laws across
jurisdictions than has been achieved under the model laws approach and consequently reduced
regulatory burdens and improved productivity, safety and environmental outcomes.
6.2.1.2 Heavy Vehicle National Law
The HVNL has come into effect during the course of the Review, commencing in Queensland, NSW,
Victoria, South Australia, Tasmania and the Australian Capital Territory on 10 February 2014.227 The
Northern Territory and Western Australia are not adopting the HVNL at this time. Moreover, NSW,
South Australia and Victoria have introduced a number of variations to the national law, some of
which will require a national response. The policy implications of these variations may be significant,
as their impact is not limited to a single jurisdiction and will require coordination with multiple
agencies.228 While these variations, together with the initial non-participation of two jurisdictions
will to some extent perpetuate the legislative inconsistency that the HNVL was intended to address
to some extent, the adoption of the HVNL marks a further step in the harmonisation of national
legislation in this area and should yield improvements in legislative effectiveness in a number of
areas. A more detailed overview of the NHVR is provided at Appendix 3. Importantly, section 18 of
the HVNL provides that it does not limit the application of WHS laws and regulations and that
evidence of a contravention of the HVNL is admissible in proceedings for offences against the
primary WHS legislation.
The object of the HVNL is:
“…to establish a national scheme for facilitating and regulating the use of heavy vehicles on
roads in a way that:
(a) promotes public safety; and
(b) manages the impact of heavy vehicles on the environment, road infrastructure and
public amenity; and
(c) provides for efficient road transport of goods and passengers by heavy vehicles; and
226 Council of Australian Governments, Intergovernmental Agreement on Heavy Vehicle Regulatory Reform,
COAG, 2011, http://www.coag.gov.au/node/54 (accessed 7 April 2014). 227
National Heavy Vehicle Regulator (2014), ‘Heavy Vehicle National Law (HVNL)’, NHVR [web page], 2014 https://www.nhvr.gov.au/law-policies/heavy-vehicle-national-law-hvnl (accessed 7 April 2014) 228
National Transport Commission (2013a), National Transport Reform Implementation Monitoring: Report to the Standing Council on Transport and Infrastructure – November 2013, , p.16, http://www.ntc.gov.au/filemedia/general/NatReformImplemMonRepNov13.pdf (accessed 7 April 2014).

95
(d) encourages and promotes efficient, innovative, productive and safe business
practices.”229
The HVNL applies to heavy vehicles over 4.5 tonnes gross vehicle mass and regulates, inter alia
heavy vehicle registration and charges, vehicle standards, mass and loading, compliance and
enforcement (including chain of responsibility), driver fatigue, speeding compliance and the
Intelligent Access Program.230
As discussed earlier, non-compliance with regulatory requirements in relation to speed and driver
fatigue constitutes the key mechanism through which low rates of remuneration are believed to lead
to poor safety outcomes. Thus, the content of the HVNL necessarily overlaps with the RSRS. The two
regulatory approaches differ in that the HVNL, in common with its predecessor legislation, seeks to
regulate speed and driver fatigue directly, while the RSRS seeks to improve driver behaviour in these
areas indirectly by removing economic incentives for non-compliant or, more generally, unsafe
behaviour.231 Importantly, the HVNL incorporates Chain of Responsibility (CoR) provisions.
6.2.1.3 Chain of Responsibility (CoR)
The CoR concept is similar to the legal ‘duty of care’ that underpins WHS law (see Section 6.2.2.1)
and extends legal responsibility for on-road compliance beyond the heavy vehicle driver and
operator to a broader range of parties and relationships within the transport chain including
schedulers, loaders and consignors, as well as extending personal liability to company executives.
The CoR therefore operates as a mechanism that imposes safety responsibilities on parties other
than drivers.
The CoR provisions in the HVNL cover speed, fatigue and MDL and seek to ensure that steps are
taken by all relevant parties to act to prevent the commission of an offence. In particular, parties in
the supply chain are prohibited from making demands, including verbally or in written contracts,
which could foreseeably result in a breach.
The effect of this is that where a driver has been found to have committed an offence in relation to
speeding, fatigue or MDL, other parties in the supply chain who have an influence in the commission
of the offence can also be held liable. For example, a scheduler whose demands effectively require a
driver to exceed enforceable speed limits or skip required rest breaks to make a delivery on time can
229 See section 3 of the HVNL.
230 The Intelligent Access Program (IAP) is a voluntary national program whereby heavy vehicle operators agree
to remote tracking of the movement and location of their vehicles to ensure they are complying with agreed operating conditions, in return for access or less restrictive access to road networks. IAP is a vehicle tracking system to monitor heavy vehicles that may damage road infrastructure and/or pose road safety risks. The IAP is built around vehicle telematics technology that can remotely monitor heavy vehicle use. This includes a combination of global positioning systems (GPS), in-vehicle sensors and transmitters, and communications technology for transmitting vehicle performance data to a base station for downloading and analysis. The collected data is then monitored to ensure heavy vehicles adhere to approved routes, at approved times and are not operating on inappropriate roads. 231
For example, inappropriate speed for the conditions may be a risky behaviour, though it may not constitute "speeding" in the specific regulatory sense.
96
be held liable for those offences. Similarly, the consignor could be held responsible for the offences
if the scheduling demands resulted from the terms of consignment.
The CoR concept has been adopted progressively in the road transport sector via a range of the
model laws developed by the NRTC/NTC over more than a decade. A key milestone in this area is the
Road Transport Reform (Compliance and Enforcement) Bill, approved unanimously by all Australian
transport ministers in 2003.232 The adoption of the CoR concept reflected a similar view of the
dynamics of the road freight industry to those that have underpinned the RSRS - i.e. that the
relatively stronger position of various upstream parties enables them to place pressure on drivers to
act in ways that are inconsistent with a range of safety legislation. As noted in the regulatory impact
statement accompanying the Road Transport Reform (Compliance and Enforcement) Bill:
"...existing legislation focuses almost exclusively on drivers and, to a lesser extent, transport operators as being responsible for any breaches of the road law. This is considered an inadequate approach to enforcement as it fails to recognise that other parties often bear substantial responsibility for breaches. The proposed Act would deal specifically with the duties of vehicle owners, operators, consignors, packers and loaders, as well as drivers. In addition, directors and senior managers of corporations involved in the operation of trucks will also be subject to liability for breaches of the road law.
This change will have benefits in two main areas:
fairness will be improved, since prosecutions will be better able to target those chiefly responsible for breaches of the road laws; and
effectiveness will be enhanced, since prosecution of all responsible parties, leading to the application of appropriate sanctions, can be expected to better deter law-breaking behaviour.
It can be expected that improved fairness will also have an indirect impact in improving compliance, since it will tend to lead to greater acceptance of the law and, hence, a higher level of ‘voluntary compliance’.”233
Stakeholders who have addressed this issue have expressed unanimous support for the CoR concept
to the Review, although there is some range of opinion as to the effectiveness of this concept to
date in addressing the underlying industry dynamics which are targeted by both CoR and the RSRS:
some stakeholders have suggested that little effective use has been made of these legislative powers
to date, while others highlighted significant instances of their enforcement in practice, despite
agreeing that major difficulties existed.
Discussion with an official of the NHVR with extensive experience in the area of CoR highlighted a
number of challenges in effectively applying the CoR provisions, including the time and cost involved
in CoR investigations and a lack of CoR investigative capabilities within enforcement agencies, but
232 Despite this unanimous approval, CoR has not, to date, been adopted in legislation in either Western
Australia or the Northern Territory. However, it is understood that it will shortly be adopted in the former jurisdiction. See Appendix 3 for a more detailed overview of the HVNL CoR provisions in relation to fatigue and speeding and additional information regarding CoR in Western Australia and the Northern Territory 233
National Road Transport Commission (2003), Road Transport Reform (Compliance and Enforcement) Bill. Draft Final Regulatory Impact Statement, p 12. Disclosure: This RIS was drafted by the present author.

97
also provided examples of cases in which substantial outcomes had been achieved through the
application of CoR laws in some jurisdictions.234
Two recent developments can be expected to improve the effectiveness of CoR in the medium term.
First, the improved national consistency of transport legislation and second, future reforms to CoR
laws.
6.2.1.3.1 National consistency
The adoption of the HVNL, including the establishment of the NHVR, can be expected to improve
effectiveness by removing the practical barriers created by the existence of state boundaries.
Previously, regulators in those states that had CoR laws were only empowered to enforce them
within their jurisdiction, despite the fact that supply chains stretch across state borders. By contrast,
the NHVR will be uniquely empowered to conduct cross border CoR investigations.
6.2.1.3.2 Future reform of CoR laws
CoR was identified during the development of the HVNL as an area that required further
examination and review235 to ensure the requirements are fair, effective and appropriately targeted,
as well as consistent with the COAG Principles on Directors’ Liability Provisions236 and affirmative
legal obligations under the model Work Health and Safety Act 2011 (Cth). Additionally, concerns
regarding inconsistencies of approach to CoR between different parts of the existing law were
identified.
In November 2012, SCOTI decided to establish a taskforce to undertake the review of the CoR
provisions (CoR Review). The CoR taskforce released an issues paper for public consultation on
5 July 2013237 and submissions to the CoR Review closed on 16 August 2013. According to the
discussion paper, the purpose of the Taskforce and CoR Review is to:
Ensure that the HVNL retains an effective CoR regime, capable of holding current identified
parties, including executive officers of those parties, sufficiently and appropriately
accountable for the influence and control they can exercise over the compliance and safety of
transport drivers, and the safety of the general public.
Examine recent CoR provisions proposed or enacted in the HVNL with a view to:
o Providing broad affirmative legal obligations, such as general or specific statutory
duties, upon the parties within the chain of responsibility, and including the executive
234 For example, a VicRoads case against Ag-Spread in 2010 resulted in a $95,000 fine against the company for
breaches of CoR fatigue laws, and a CoR investigation and court case run by NSW Roads and Maritime Services which specifically targeted the bulk grain storage and handling services sector, although ultimately lost, resulted in significant compliance improvements within the sector from 66% to 93%. 235
Chain of Responsibility Taskforce (2013), Chain of Responsibility in the Heavy Vehicle National Law: Issues Paper, National Transport Commission, 5 July 2013, p.6, http://ntc.gov.au/filemedia/Reports/CORintheHVNLIssuesPaperJul13.pdf (accessed 7 April 2014). 236
COAG, Principles on Directors’ Liability Provisions, COAG [web page], 2012, http://www.coag.gov.au/node/434 (accessed 7 April 2014). 237
CoR Taskforce (2013), op cit.

98
officers of those parties, that are consistent with the positive duties provisions which
apply under the Work Health and Safety Act 2011 (WHS Act); and
o Maintaining consistency with COAG’s “Principles and Guidelines” and other national
transport reforms relating to the imposition of criminal liabilities upon directors and
other corporate officers in connection with a corporate offence.
Advise whether, with respect to the HVNL, the penalty regime relating to existing chain of
responsibility provisions the HVNL needs to be amended as part of any move to adopt a
framework of affirmative legal obligations.
Advise whether any other amendments are desirable in order to advance the effectiveness,
appropriateness or fairness of the CoR regime.238
The CoR Review released an ‘Assessment of Options Paper’ on 14 February 2014 which contains a
range of specific proposals, presented as alternative responses to the key issues identified, and will
form the basis for consultation with regulatory bodies and industry groups.239
CoR has also been raised as an issue in the Heavy Vehicle Compliance Review (HVC Review). A
consultation draft for the HVC Review suggested that there is credible evidence CoR has
fundamentally changed the way the industry works and noted a consensus among all parties –
government and industry – that the NHVR’s compliance efforts should place significant emphasis on
CoR investigations.240 Indeed, a draft recommendation of the HVC Review is “That the NHVR’s
compliance effort place a major emphasis on chain of responsibility investigation”.241 However, the
HVC Review also noted that in doing so, a challenge for government is that the skills and attributes
required to conduct successful CoR investigations may be quite different to the skills and attributes
held by more traditional enforcement officers.242
While these reviews are continuing at the time of writing, the above discussion suggests that it is
likely that they will result in a number of changes to the CoR provisions of the HVNL, as well as a
greatly increased focus on the use of the reformed CoR provisions as a key part of the modus
operandi of the NHVR. These changes are expected to enhance the ability of the CoR provisions of
the HVNL to deal with a range of safety issues, including those relating to speed, driving hours and
fatigue. However, they also imply that the overlap already evident in terms of regulatory objectives
and approaches between CoR and the RSR Act will be likely to increase further in the near future.
238 Chain of Responsibility Taskforce (2013), op cit, p 7.
239 Chain of Responsibility Taskforce (2014), Chain of Responsibility Review Assessment of Options Paper,
National Transport Commission, February 2014, http://www.ntc.gov.au/DocView.aspx?DocumentId=2490 (accessed 7 April 2014). 240
National Transport Commission (2013b), Heavy Vehicle Compliance Review Consultation Draft, National Transport Commission, September 2013, p. 61, http://www.ntc.gov.au/filemedia/Reports/HVComplianceReview2013.pdf (accessed 7 April 2014). 241
Ibid, p.62. 242
Ibid, pp.61-62.
99
6.2.1.4 Vehicle telematics
Telematics is the technology of sending, receiving and storing information relating to remote
objects, such as vehicles, via telecommunication devices. For vehicles, it typically involves the
integration of Global Positioning System (GPS) technology and computers and mobile devices.
In-vehicle telematics technologies can be used for a range of management and monitoring purposes,
including:
Vehicle-based applications: speed, location, travel times, load, mass, vehicle conditions
Driver-based applications: work and rest hours, fatigue monitoring
Vehicle-driver applications: recording how the driver drives (such as harsh braking, idling
and gear change performance)243
These applications can in turn be used for commercial, compliance and enforcement purposes,
particularly in relation to speed, fatigue and mass monitoring and CoR. For example, mass data
generated by telematics systems could be collected by an operator to maximise loads and increase
productivity but could also be used to demonstrate legal compliance within an accreditation
scheme, or to meet obligations under CoR. The same information could also be used by regulators
and enforcement agencies to identify breaches and to issue infringements,244 or alternatively to
reward safe behaviours, such as through greater road access, and reduced insurance premiums.
A policy paper prepared by the United Kingdom's Royal Society for the Prevention of Accidents
identifies a number of studies which suggest that in-vehicle monitoring can help employers and at-
work drivers to reduce accident rates.245 This included one study which found that accident rates for
vehicles fitted with a monitoring device were reduced by 20 per cent,246 while another found a
reduction of 38 per cent in accidents.247 In one case the rate of specific unsafe driving behaviours
was found to be reduced by up to 82 per cent following the installation of monitoring devices.248
However, the paper also noted that the observed effects of telematics devices have varied between
fleets. While most studies showed a reduction in accident rates, some showed a small (though not
statistically significant) increase.
243 National Transport Commission (2013c), Developing a Compliance Framework for Heavy Vehicle Telematics
Discussion Paper, National Transport Commission, December 2013, p. 5, http://www.ntc.gov.au/DocView.aspx?DocumentId=2463 (accessed 7 April 2014). 244
ibid 245
Royal Society for the Prevention of Accidents (2013), Road Safety and In-Vehicle Monitoring (Black Box) Technology: Policy Paper, Royal Society for the Prevention of Accidents, February 2013, Birmingham, UK, pp.23-31http://www.rospa.com/roadsafety/info/black-box-technology.pdf (accessed 7 April 2014). 246
Peter I J Wouters and John M J Bos (2000), ‘Traffic Accident Reduction by Monitoring Driver Behaviour with In-Car Data Recorders’, , Accident Analysis and Prevention, 32, 2000, cited in Royal Society for the Prevention of Accidents (2013), op cit. 247
Tomer, T., Musicant, O., and Lotan, T. (2008), ‘In-Vehicle Data Recorders for Monitoring and Feedback on Drivers' Behaviour’, , Science Direct, Transportation Research Part C 16, 2008, cited in Royal Society for the Prevention of Accidents (2013), op cit. 248
Musicant, O., Bar-Gera, H. and Schechtman, E. (2011), ‘Individual Driver's Undesirable Driving Events - A Temporal Analysis’, paper submitted to the 3rd International Conference on Road Safety and Simulation, September 14-16, 2011, Indianapolis, USA , cited in Royal Society for the Prevention of Accidents (2013), op cit.

100
Telematics also has the potential to reduce compliance costs, for example, by automatically
computing complex fatigue regulations. The current written work diary is reported by stakeholders
to be administratively burdensome, requiring the driver to account for every 15 minutes of their
time. It is also time-consuming for on-road enforcement officers who have to review an extensive
record and make complex calculations about work and rest hours.249 The use of vehicle telematics
such as Electronic Work Diaries (EWD) provides opportunities to eliminate much of this work and
provide greater accuracy and accessibility of data.
The HVNL contains two regulatory applications that utilise heavy vehicle telematics: EWDs and the
Intelligent Access Program (IAP), although in both cases the definitions are framed in terms of
performance outcomes rather than the essential components of what constitutes a telematics
system or device.
An EWD device has not yet been finalised for regulatory purposes. However, a three year pilot
project undertaken by NSW Roads and Maritime Services (RMS) resulted in the development of a
technical specification for EWDs and a proposed systems framework. In May 2013 the then Standing
Council on Infrastructure and Transport decided to pass the RMS EWD Pilot’s findings and
recommendations to the NHVR (for consideration of implementation issues) and the NTC (for
consideration of legislative policy issues) to develop an approach for national adoption of EWDs.
However, as a result of the RMS EWD Pilot the NTC identified a need to examine policy issues in
relation to the use of vehicle telematics, particularly regarding privacy and surveillance challenges.
These issues were highlighted in the October 2013 Preparing Australia for Electronic Work Diaries:
Regulatory Issues Paper.250 The NTC is currently addressing these issues in consultation with
stakeholders in an attempt to develop a compliance and enforcement framework for heavy vehicle
telematics.
While these regulatory implementation issues continue to be addressed, the potential benefits of
heavy vehicle telematics are already recognised by the Australian road freight industry, which has
begun utilising it on a voluntary basis: Data indicate that the proportion of companies using some
form of telematics increased from 34 per cent in 2006 to 44 per cent in 2012.251 Similarly, a series of
surveys conducted in 2012 by AMR Research on behalf of the NTC252 indicated around 40 per cent of
road transport companies use some sort of electronic system to manage driver fatigue.253 The survey
also considered the uptake of heavy vehicle telematics by fleet size and found that larger companies
249 National Transport Commission (2013c), op cit.
250 National Transport Commission (2013d), Preparing Australia for Electronic Work Diaries: Regulatory Issues
Paper, http://www.ntc.gov.au/filemedia/Reports/PrepAustEWDsRegIssuesPaperOct13.pdf (accessed 7 April 2014) 251
Unpublished data from the Victorian Ministerial Freight Advisory Council, cited in Developing a Compliance Framework for Heavy Vehicle Telematics Discussion Paper, op cit, p. 14 252
AMR Research (2013a), op cit; and AMR Research (2012b), op cit.. 253
AMR Research (2013b), op cit

101
being more likely to have implemented this technology.254 Similar results were found regarding the
monitoring of driving speeds.255
Telematics use in Australia appears to lag behind that of the United States and the European Union,
in that these jurisdictions have mandated the use of telematics systems for enforcing compliance
with speed and fatigue regulation in response to the evidence of their effectiveness in reducing
accidents, vehicle and fuel costs and risky driving behaviours. However, the recent NTC discussion
paper ‘Developing a Compliance Framework for Heavy Vehicle Telematics’ 256 suggests that Australia
is at the forefront of regulatory development insofar as it is actively seeking to establish a national
policy for the consistent use of heavy vehicle telematics for a range of compliance purposes,
whereas the United States and European Union have addressed the use of telematics in the context
of specific regulatory issues, such as fatigue management. Thus, the intent appears to be that
Australia should ’leapfrog’ the current leaders in this regard.
That said, telematics developments necessarily continue in both the United States and European
Union, with areas of focus including:
seeking to incorporate telematics-generated data into risk rating systems and intelligent,
wireless roadside enforcement programs; and
seeking to develop telematics-based enforcement approaches as part of a broader risk
rating system, in order to ensure more consistent treatment of drivers, greater certainty for
industry, streamlined roadside enforcement and the development of risk-based and
proportionate measures that improve road safety.257
As vehicle telematics is increasingly integrated into the Australian road transport industry, both as a
result of voluntary industry driven initiatives and regulatory activity, benefits in terms of increased
compliance with fatigue, speeding and CoR obligations and, as a consequence, reduction in accident
rates can be expected.
Importantly, the adoption of electronic systems enabling detailed recording and monitoring of truck
movements to be undertaken would appear likely to reduce the benefits of prescriptive approaches
to managing speed and fatigue such as the use of very detailed safe driving plans.
6.2.1.5 Other relevant initiatives
A number of other national key areas of reform that will impact the national road transport sector
are discussed below:
254 ibid. 64% of companies with 30 or more trucks; 37% of companies with five to 29 trucks; 22% of companies
with one to four trucks. 255
ibid. 36% of companies with one to four trucks; 34% of companies with five to nine trucks; 59% of companies 10 to 49 trucks; 83% of companies with 50 or more trucks . AMR, Reform Evaluation in the Road Transport Industry, 2012: Compliance and Enforcement, and Speed, 2013. 256
national Transport Commission (2013c), op cit, pp. 21-27 257
ibid, p.25
102
6.2.1.5.1 National Road Safety Strategy 2011–2020:
The National Road Safety Strategy 2011-2020 (NRSS)258 adopts a ‘Safe System’ approach to road
safety improvement, which takes a holistic view of the road transport system and the interactions of
its various elements, consistent with the approaches adopted in Sweden (‘Vision Zero’) and in the
Netherlands (‘Sustainable Safety’).259 The NRSS represents the commitment of Commonwealth, state
and territory governments to an agreed set of national road safety goals, objectives and actions.
The NRSS presents a 10-year plan to reduce the annual numbers of both deaths and serious injuries
on Australian roads by at least 30 per cent through a series of ‘first steps’ actions to be undertaken
within three years, as well as a range of possible ‘future steps’ initiatives. Of these steps, a number
are directly targeted to heavy vehicle safety and underpin some of the work currently being
conducted by the NTC,260 including:
greater enforcement of CoR, particularly in relation to heavy vehicle speeding;
use of electronic work diaries for heavy vehicle drivers as an alternative to paper-based
diaries;
improved fatigue management
development of competency-based standards for licensing heavy vehicle drivers;
heavy vehicle design improvements; and
improved heavy vehicle infrastructure.
As is apparent, the first three of these initiatives are clearly focused on key unsafe behaviours to
which low remuneration rates are said to give rise- i.e. excessive speed and excessive hours of
work/fatigue.
Under the NRSS the Australian Government has responsibilities for allocating agreed infrastructure
resources to the national highway and local road networks, and for regulating safety standards for
new vehicles. State and territory governments have primary responsibilities for funding, planning,
designing and operating the road network, managing vehicle registration and driver licensing
systems, and enforcing road user behaviour.
6.2.1.5.2 Infrastructure Investment Programme
The Australian Government’s Infrastructure Investment Programme is aimed at assisting national,
regional economic and social development through the provision of funding aimed at improving the
performance of land transport infrastructure. There are several components under the
Infrastructure Investment Programme including the Heavy Vehicle Safety and Productivity
Programme (HVSPP).
258 Australian Transport Council (2011), National Road Safety Strategy 2011-2020, May 2011,
http://www.infrastructure.gov.au/roads/safety/national_road_safety_strategy/files/NRSS_2011_2020_15Aug11.pdf (accessed 7 April 2014) 259
See OECD (2011), op cit, p 190. 260
For example, the Chain of Responsibility Taskforce, pilot of electronic work diaries and the establishment of the HVNL and NHVR.

103
The HVSPP is an Australian Government initiative established under the Nation Building (National Land Transport) Act 2009 (Cth). HVSPP funding is provided to six categories of projects that directly improve conditions for heavy vehicle drivers, as follows:261
1. Rest Area projects: To improve the provision of heavy vehicle rest areas on key interstate
routes to more effectively manage fatigue.
2. Parking/Decoupling Bay projects: To provide heavy vehicle parking/decoupling areas and
facilities in outer urban/regional areas.
3. Technology Trial projects: Funding trials of technologies with the potential to improve heavy
vehicle safety and/or productivity.
4. Road Enhancement projects: To enhance the capacity and/or safety of roads (including
bridges) to allow access by high productivity (i.e. heavier) vehicles to more of the road
network.
5. Demonstration projects: To facilitate innovation to improve heavy vehicle safety and
productivity projects.
6. Livestock Transport Industry projects: To improve heavy vehicle safety and productivity for
specific livestock transport operations.
Work Health and Safety Legislation 6.2.2
In addition to the specific road safety legislation outlined above, the generally applicable WHS laws
necessarily also apply to the road transport industry. Several key similarities between the heavy
vehicle laws and WHS laws can be noted, as follows:
State and territory governments have constitutional responsibility for WHS;262
Substantial regulatory harmonisation efforts have been undertaken over an extended
period;
Harmonisation efforts have culminated in the recent adoption of national legislation, albeit
with some non-participating jurisdictions; and
The specific laws in place are supported by a long-term strategy for improving safety
performance.
Safe Work Australia leads the development of national policy to improve WHS and workers’
compensation arrangements across Australia. It coordinates and develops national policy and
strategies; assists with the implementation of model WHS legislation; undertakes research, and
collects, analyses and reports data. However, Safe Work Australia does not regulate or enforce WHS,
as each jurisdiction remains responsible for its own WHS arrangements.
Safe Work Australia has been responsible for developing the model WHS Act, supported by model
WHS Regulations and model codes of practice and guidance material for adoption by governments
around Australia. With the exception of Victoria and Western Australia, all jurisdictions have enacted
261 Department of Infrastructure and Regional Development (2014), ‘Heavy Vehicle Safety and Productivity
Programme’, Department of Infrastructure and Regional Development [webpage], 17 January 2014, http://investment.infrastructure.gov.au/funding/Heavyvehicles/Index.aspx (accessed 7 April 2014) 262
However, the Commonwealth government has WHS responsibility for its own workers and enables certain eligible corporations to self-insure under the Comcare scheme
104
consistent model WHS laws. However, Victoria and Western Australia remain committed to the
principle of harmonisation of WHS laws and continue to take steps towards achieving that outcome.
6.2.2.1 Duty of Care
The model WHS arrangements capture a broad range of employment relationships and potentially
cover a sole trader (for example a self-employed person), each partner within a partnership, a
company, unincorporated association or government department of public authority (including a
municipal council), regardless of whether or not profit or gain are pursued, under the rubric of a
‘person conducting a business or undertaking’ (PCBU).
The WHS Act requires all PCBUs to ensure, 'so far as is reasonably practicable’, the health and safety
of workers engaged (or caused to be engaged) by the person, and workers whose activities are
influenced or directed by the person, while at work in the business or undertaking. PCBUs owe a
similar duty of care to other people who may be at risk from work carried out by the business or
undertaking, including ‘others’ that may enter an area where work is being undertaken. A self-
employed person must ensure his or her own health and safety while at work, so far as is reasonably
practicable.
Under the primary duty of care PCBUs must ensure, so far as is reasonably practicable:
the provision and maintenance of a working environment that is safe and without risks to
health, including safe access to and exit from the workplace;
the provision and maintenance of plant, structure and systems of work that are safe and do
not pose health risks (for example providing effective guards on machines and regulating the
pace and frequency of work);
the safe use, handling, storage and transport of plant, structure and substances (for example
toxic chemicals, dusts and fibres);
the provision of adequate facilities for the welfare of workers at work (for example access to
washrooms, lockers and dining areas);
the provision of information, instruction, training or supervision to workers needed for them
to work without risks to their health and safety and that of others around them;
that the health of workers and the conditions of the workplace are monitored to prevent
injury or illness arising out of the conduct of the business or undertaking; and
the maintenance of any accommodation owned or under their management and control to
ensure the health and safety of workers occupying the premises.263
A worker is defined as any person who carries out work for a PCBU, including work as an employee,
contractor, subcontractor, self-employed person, outworker, apprentice or trainee, work experience
student, employee of a labour hire company placed with a ‘host employer’ or volunteer.
263 Safe Work Australia (2012), Guide to the Model Work Health and Safety Act, October 2012, p. 7,
http://www.safeworkaustralia.gov.au/sites/swa/about/publications/pages/guide-to-the-work-health-and-safety-act- (accessed 7 April 2014)
105
Workers have a duty to take reasonable care for their own health and safety and to ensure that their
acts or omissions do not adversely affect the health or safety of others. Workers must also comply
with any reasonable instruction, policy or procedure of a PCBU. Similar duties apply to other persons
at a workplace, including customers and visitors.
The strong general duties provisions of the WHS laws imply that employers and others within the
supply chain have significant obligations under this legislation, while the breadth of the concept of
‘person conducting a business undertaking’ and that of the definition of ‘worker’ adopted under the
laws would appear to imply that a wide range of contractual relationships fall within the ambit of the
WHS law. Thus, it would appear that this constitutes another significant body of legislation
addressing safety performance within the road freight industry.
6.2.2.2 Road safety codes of practice and guidance
Codes of practice are used to assist duty holders to comply with their obligations under WHS laws.
Codes of practice are not mandatory, in that non-compliance does not, of itself, give rise to any civil
or criminal liability. Instead, in any proceeding, codes of practice may be used by the court to
establish what is known about a particular hazard or risk to determine what is reasonably practicable
in the circumstances to which the code relates.
Safe Work Australia has developed several model codes of practice relevant to the road freight
industry, including the WHS Code of Practice: Traffic Management in Workplaces, which provides
practical guidance to PCBUs on identifying, assessing and controlling risks associated with traffic in
the workplace; the Traffic Management Guide: Construction work; Traffic Management Guide:
Shopping centres; Traffic Management Guide: Warehousing; and Traffic Management Guide: Events.
However, as the NTC is primarily responsible for evaluating proposed new legislative safety
measures for the road transport industry, Safe Work Australia has not developed any codes of
practice or guidance material specifically targeted at the transport sector. The Guide for Managing
the Risk of Fatigue at Work and Fatigue Management Workers Guide developed by Safe Work
Australia to assists duty holders in applying practical principles to manage fatigue issues in the
workplace, are clearly relevant to the sector. However, they are not designed to provide information
on managing fatigue in specific industries and do not replace requirements related to fatigue under
other laws.
6.2.2.3 Discriminatory, coercive or misleading conduct
The model WHS Act prohibits discriminatory, coercive or misleading conduct against workers,
prospective workers and others because of the performance of legitimate safety-related functions or
activities, or because they have raised a work health and safety concern under the model WHS
Act.264
As previously indicated, a worker is broadly defined to mean any person who carries out work for a
PCBU, in any capacity, including employees and contractors. The prohibition also applies to
commercial arrangements, thereby protecting a person from being refused a contract or from
264 See sections 104, 108 and 109 of the Model Work Health and Safety Bill.
106
having a contract terminated because they have exercised a right or function, or raised a health and
safety concern under the model WHS Act.
6.2.2.4 Drugs and alcohol in the workplace
The implementation of workplace drug and alcohol policies is not mandatory under WHS law.
However, the general duties of a PCBU under the WHS legislation extend to ensuring a worker
affected by alcohol or other drugs does not place themselves or other persons at risk of injury while
at work. Likewise, workers affected by alcohol or other drugs have a duty to ensure the safety of
themselves and others (e.g. other road users). Workplace hazards and risks associated with the use
of alcohol and other drugs are therefore required to be eliminated or reduced, as far as practicable.
One way of achieving this outcome is through the implementation of a drug and alcohol policy.
In recognition of these duties and the health and safety risks associated with the use of drugs and
alcohol in the workplace, all states and territories have developed guidance material for addressing
drugs and alcohol in the workplace.
6.2.2.5 Australian Work Health and Safety Strategy 2012-2022
Road freight transport is a priority industry under the Australian Work Health and Safety Strategy
2012-2022265 (WHS Strategy), which was developed and is being implemented by Safe Work
Australia in association with jurisdictional regulators.
The WHS Strategy entails a collaborative approach between the Commonwealth, state and territory
governments, and industry, and is focused on identifying the causes of injury and illness, and on
working to find and implement solutions. It seeks to achieve four outcomes:
1. Reduced incidence of work-related death, injury and illness, achieved by
2. Reduced exposure to hazards and risks, using
3. Improved hazard controls, supported by
4. An improved work health and safety infrastructure.
The WHS Strategy identifies seven action areas that are required to support the outcomes:
1. Healthy and safe by design
2. Supply chains and networks
3. Health and safety capabilities
4. Leadership and culture
5. Research and evaluation
6. Government, and
7. Responsive and effective regulatory framework.
Three targets were set to measure progress in achieving the vision:
265 Safe Work Australia (2012), Australian Work Health and Safety Strategy 2012-2022, October 2012,
http://www.safeworkaustralia.gov.au/sites/swa/about/publications/pages/australian-work-health-and-safety-strategy-2012-2022 (accessed 7 April 2014)
107
1. 20 per cent reduction in the number of fatalities due to traumatic injuries
2. 30 per cent reduction in incidence rates of all work-related injury claims resulting in one or
more weeks off work, and
3. 30 per cent reduction in the incidence rate of claims for musculoskeletal disorders resulting
in one or more weeks off work.
The road transport industry was identified as a priority industry under the WHS Strategy due to the
high numbers and rates of injury and fatalities in the industry and will be the focus of national
prevention efforts for the first five years of the WHS Strategy. Relevant sub-sectors from within the
industry will also be chosen by jurisdictions during specified periods throughout the life of the WHS
Strategy in order to target areas that require the greatest improvement.
Progress on the WHS Strategy is to be reported annually, however as at the time of writing this
report the first WHS Strategy annual report is yet to be published. Given the early stage of
implementation of the strategy, no further information on the initiatives likely to be pursued with
respect to the road transport industry is currently available. However, as a general comment, there
is clearly potential for additional duplication to arise between actions adopted under the strategy
and current or future RSROs.
6.3 Legislation specifically addressing driver remuneration & conditions
State-based schemes 6.3.1
The relationship between owner drivers and their hirers is regulated in NSW, Victoria and Western
Australia. In NSW this is done through Chapter 6 of the Industrial Relations Act 1996 (NSW Act). In
Victoria this occurs through the Owner Drivers and Forestry Contractors Act 2005 (Victorian Act) and
its associated regulations and codes of practice, and in Western Australia through the Owner Drivers
(Contracts and Disputes) Act 2007 (WA Act) and associated regulations. Each of these instruments is
discussed below, with additional detail provided at Appendix 4.
The RSR Act was partly modelled on provisions in the NSW Act and is therefore similar in operation
to that Act, with a significant difference being that the NSW Act applies only to owner drivers, where
the RSR Act also applies to employee drivers. In this regard, the RSR Act is significantly broader in
scope than the NSW Act.
Under the NSW Act the NSW Industrial Relations Commission (IRC) is provided powers to make
‘contract determinations’ and resolve certain disputes between principal contractors and owner
drivers regarding terms and conditions in contracts of carriage.
‘Contract determinations’ are similar to awards and establish a safety net of minimum mandatory
remuneration and other employee like terms and conditions for ‘contract carriers’ (i.e. owner
drivers), and include provisions for leave, termination and dispute resolution procedures among
others. Contract determinations apply to specific classes of ‘contracts of carriage’, and are binding
on all parties to those contracts and enforceable by the NSW IRC.
However, each of the contract determination is unique in terms of application and content,
presumably reflecting the complex variety of work and business models evident in the road
transport industry. Rates of remuneration vary quite substantially between determinations and
108
according to variables including the size, type and age of vehicles, the load being carried and the
distances travelled, while standing and running rates are also differentiated. TWU officials stated,
during consultation with the Review, that they believe this sector-by-sector approach to be the
appropriate one for the Tribunal to adopt. However, as set out below, the TWU submission to the
Tribunal on the content of a future RSRO dealing with mandatory rates appears to set out a set of
broadly applicable rates, along the lines of the Victorian and Western Australian approaches rather
than pursuing the sector-by-sector approach.
Additionally, one contract determination made by the NSW IRC is the Transport Industry - Mutual
Responsibility for Road Safety (State) Contract Determination does not specifically address
remuneration rates. Rather, it establishes a number of requirements targeted at health and safety in
the long distance transport sector which extends beyond contract drivers to consignors and
transport operators, thus incorporating CoR elements. These requirements include safe driving
plans, an instrument now replicated in the RSRO issued by the Tribunal, work health and safety
training and drug and alcohol policies, the latter also being addressed in the RSRO.
The NSW Act also provides for the making of ‘contract agreements’ between a principal contractor
and a group of owner drivers (i.e. collective bargaining). ‘Contract agreements’ are akin to enterprise
agreements under the FW Act and must provide terms and conditions at least equivalent to the
relevant contract determination that would otherwise apply. Contract agreements are exempt from
the competition provisions of the Competition and Consumer Act 2010 (Cth).
In contrast to the NSW model, the Victorian and Western Australian Acts adopt a lighter-handed
approach to regulating owner driver remuneration and conditions, which recognises that owner
drivers choose to be independent contractors and operate as small businesses and accordingly
treats them within a framework of commercial laws, albeit with some additional protections and
avenues for challenging harsh business practices.
The Victorian and WA Acts are similar in many respects, due in part to the fact that the WA Act is
broadly based on the Victorian Act. Both Acts focus on improving the ability of owner drivers to
assess their operating costs, negotiate sustainable contract arrangements and pursue their interests
in the event of disputes. Thus, key provisions include the specification of disclosure requirements to
be met by hirers, the provision of a range of information to owner drivers, including rate and cost
schedules, and the provision of low-cost dispute resolution arrangements.
The key difference between the approaches taken in the state laws is that, while the NSW legislation
provides for mandatory minimum rates to be established, in both Victoria and Western Australia the
published rates schedules have ‘guideline’ status only. Consistent with this, the guideline rates
schedules set a relatively small range of rates, each of which is regarded implicitly as having broad
application, in contrast to the NSW model of numerous individual determinations.
The Victorian and Western Australian legislation is intended to provide cost and rate benchmarks to
which owner drivers in particular can refer when negotiating payment rates and conditions.
However, it is notable that the guideline rates in the two states differ in terms of structure and
value, sometimes significantly.

109
Guideline rates in Western Australia are published for 13 different vehicle type combinations over
4.5 tonnes,266 and are also divided into metropolitan (short haul) and regional (long distance) rates,
and for new vehicles and 5 year old vehicles. By comparison, Victoria publishes guideline rates for six
vehicles types of one tonne and over267 and does not distinguish between vehicles of different ages
or between metropolitan and regional services. The Victorian rates also do not incorporate
calculations for a return on investment, while the Western Australian rates do. However, even
where guideline rates exist for vehicle of a comparable type and age in each state, the values are
often not aligned. While there appears to have been some degree of convergence in the Victorian
and Western Australian guideline rates since 2011,268 it appears that this reflects changes made
independently by the two jurisdictions, rather than any conscious attempt at co-ordination.
The following tables provide some comparative examples of the differences between the applicable
rates in NSW, Victoria and Western Australian for similar truck types, where available. Also included
for comparative purposes are the rates proposed by the Transport Workers' Union in its
4 March 2014 application to the Tribunal following the 11 February 2014 Conference on rates of
payment and associated issues and the second annual work program.
Various differences of approach complicate attempts to compare the various rates. In addition to
those noted above in respect of Victoria and Western Australia, a further difficulty arises because,
while the Victorian and Western Australian rates are based on payment of either the hourly rate or
the per kilometre rate, the NSW rates are based on payment of both rates simultaneously.
Moreover, the TWU's application to the Tribunal does not state whether its proposed hourly and per
kilometre rates are intended to be paid jointly (as in NSW) or as alternatives, as in Victoria and
Western Australia and in the relevant awards for employee drivers.
Table 6.1 below compares the various rates, in respect of an 8 - 10 tonne rigid truck. The Victorian
rates tend to be the lowest of the group with the Western Australian and NSW metropolitan hourly
rates both higher than the Victorian rate by 13.8 per cent and 35.1 per cent respectively, while the
TWU's proposed rate is substantially higher, being 53.2 per cent above the equivalent Victorian rate.
The differences between regional rates are in some cases substantially larger, with the Western
Australian hourly rate being 64.3 per cent higher than the (undifferentiated) Victorian metropolitan
rate. The TWU regional hourly rate is almost 20 per cent lower than the Western Australian regional
hourly rate, while the TWU regional per kilometre rate is less than half of that of Western Australia's
(the only other regional per kilometre rate specified). These observations could suggest an intention
that the TWU rates be applied together, however, to do so would yield a total rate that was
substantially higher than any comparable rate.
266 Vehicle types include: 5 tonne GVM (rigid truck, 2 axles); 8 tonne GVM (rigid truck, 2 axles); 15 tonne GVM
(rigid truck, 2 axles); 22.5 tonne GVM (rigid truck, 3 axles); Prime Mover (haulier - 1 trailer) (2 axles, 31.5 tonne GCM); Prime Mover (haulier - 1 trailer) (3 axles, 42.5 tonne GCM); Prime Mover (haulier - 2 trailers) (3 axles, 79 tonne GCM); Prime Mover (haulier - 3 trailers) (3 axles, 122.5 tonne GCM); Prime Mover + one trailer (42.5 tonne GCM); Prime Mover + two trailers (79 tonne GCM); Prime Mover + three trailers (122.5 tonne GCM); B-Double (3 axles, 62.5 tonne GCM); and Pocket Road Train (haulier - 2 trailers) (79 tonne GCM). 267
Vehicle types include: 1 tonne GVM – General Freight; 4.5 tonne GVM; 8 tonne GVM; 12 tonne GVM (2-axle); Prime Mover (Bogie Drive); and Semi-Trailer (Bogie Drive, 6-axle). 268
As revised rates schedules have been published in both jurisdictions.

110
Table 6.1: Rates comparisons - Rigid trucks
Vehicle type NSW TWU VIC WA
Rigid truck, 2 axles
8-10 tonnes > 3 yrs old
8-10 tonnes (all vehicle ages)
8 tonne GVM > 5 yrs old
8 tonne GVM > 5 yrs old
Rate – Metro $34.82 per hour
$0.72 per km
$69.31 per hour Not available per
km
$45.23 per hour $2.26 per km
$51.45 per hour $2.38 per km
Indicative hrly rate
$61.10 per hour269
Not available Not available Not available
Regional (if separate rate applicable)
Not applicable $60.80 per hour
$0.55 per km Not applicable
$74.30 per hour $1.12 per km
Notes:
- Contract carriers in NSW are entitled to receive both the standing and running cost rates for all time and
distance that the contract carrier travels with respect to a contract of carriage, including time and
distance travelled to deliver and pick up goods (whether or not goods are carried), and time spent loading
or unloading goods.
- It appears likely that the above rules are also applicable to the TWU proposed rates which have similarly
low per km rates to the NSW contract determination, and much lower than the Victorian and Western
Australian Guideline Rates. However, it is not clear from the Draft RSRO submitted by the TWU to the
Tribunal whether the rates are intended to be treated the same way as those in the NSW contractor
determination.
- Where the Victorian and Western Australian Guideline Rates list an hourly rate and a per km rate, these
are to be treated as alternatives, i.e. they are not both payable at the same time for the same work.
Table 6.2 below provides an equivalent comparison in respect of articulated trucks. It shows that, as
with rigid trucks, the Victorian rates tend to be the lowest of the group. However, the extent of the
differences in the metropolitan rates is smaller, with the TWU rate being 29 per cent above the
Victorian rate, vs 53.2 per cent in the above comparison. Other relativities also differ: based on an
indicative distance per hour, the NSW rate appears to be 23.3 per cent higher than the TWU
metropolitan rate in Table 6.2, where it was 13.4 per cent below the TWU rate in Table 6.1, based on
the same distance estimate.
269 NSW rates are based on the combination of the hourly and per km rates, whereas all other rate schedules
are based on payment being made on either the hourly or per km rate. Thus, to enable a broad comparison to be made, an equivalent total hourly rate has been estimated, based on the latest RMS survey data which indicate an average speed of 36.5km/hr in the metropolitan context in 2010. See RMS, Travel Speeds in Sydney Metropolitan Area, http://www.rms.nsw.gov.au/publicationsstatisticsforms/downloads/travelspeeds_sydney_metro_area.html (accessed 7 April 2014).

111
Table 6.2: Rates comparison - Articulated vehicles
Vehicle type NSW TWU VIC WA
Semi-Trailer Bogie axle prime mover > 3 yrs old
Bogie axle prime mover (all vehicle
ages)
Semi-trailer (bogie drive, 6 axles) > 10
yrs old
Prime mover + 1 trailer (42.5
tonnes) > 5yrs old
Metro rate $56.11 per hour
$1.57 per km
$91.98 per hour Not available per
km
$71.31 per hour $3.96 per km
$82.07 per hour $3.32 per km
Indicative hourly rate
$113.42 / per hour
270
Not applicable Not applicable Not applicable
Regional (if separate rate applicable)
Not applicable $75.54 per hour
$1.05 per km Not applicable
$119.64 per hour $1.80 per km
Notes:
- Contract carriers in NSW are entitled to receive both the standing and running cost rates for all time and
distance that the contract carrier travels with respect to a contract of carriage, including time and
distance travelled to deliver and pick up goods (whether or not goods are carried), and time spent loading
or unloading goods.
- It is understood that the above rules are also applicable to the TWU proposed rates which have similarly
low per km rates to the NSW contract determination, and much lower than the Victorian and Western
Australian Guideline Rates. However, it is not clear from the Draft RSRO submitted by the TWU to the
Tribunal whether the rates are intended to be treated the same way as those in the NSW contractor
determination.
- Where the Victorian and Western Australian Guideline Rates list an hourly rate and a per km rate, these
are to be treated as alternatives, i.e. they are not both payable at the same time for the same work.
6.3.1.1 Methodological differences
It appears that a significant part of the observed differences between the rates summarised above is
explained by differing methodological approaches and assumptions. Differences exist in relation to
the assumed age of vehicles, their capital value and their assumed ownership (i.e. leasehold or
freehold). Some specific differences are as follows:
While the NSW General Carriers Contract Determination differentiates between rates for
vehicles less than a year old, between one to three years old and vehicles over three years
old, the Victorian guideline rates and TWU proposed rates do not.
The Victorian guideline rates for an 8 tonne rigid truck assume that the vehicle is 5 years old,
with a current capital value of $63,563 and subject to a leasing arrangement over a 4 year
270 NSW rates are based on the combination of the hourly and per km rates, whereas all other rate schedules are based on payment being made on either the hourly or per km rate. Thus, to enable a broad comparison to be made, an equivalent total hourly rate has been estimated, based on the latest RMS survey data which indicate an average speed of 36.5km/hr in the metropolitan context in 2010. See RMS, Travel Speeds in Sydney Metropolitan Area, http://www.rms.nsw.gov.au/publicationsstatisticsforms/downloads/travelspeeds_sydney_metro_area.html (accessed 7 April 2014).

112
term with a 25 per cent residual and interest at a comparison interest rate of 8.10 per cent
per annum.
Conversely, the Western Australian guideline rates included in the Tribunal’s schedule for an
8 tonne rigid truck assume that the vehicle is new.271 The rates have been constructed
independently of the Victorian guideline rates, using differing assumptions on current capital
value and leasing arrangement details.
In relation to articulated vehicles, the Victorian guideline rates for a semi-trailer (bogie drive,
6 axle) assume the vehicle is 10 years old with a current capital value of $112,117 and
subject to a leasing arrangement over a 4 year term with a 25 per cent residual and interest
rate of 8.10 per cent per annum. Under the Western Australian guideline rates the
equivalent prime mover and one trailer (42.5 tonnes) is assumed to be subject to a leasing
arrangement over a 5 year term with an interest rate of 7.24 per cent per annum and a
current capital value of $226,352. It is not clear from the TWU draft RSRO what assumptions
underlie their proposed rates.
These differences highlight the inherent difficulty—perhaps the impossibility— of determining an
appropriate ‘safe rate’ that would be applicable in a wide range of circumstances relating to key
variables such as truck age and financing arrangements. While such differences are perhaps of
relatively limited significance in the context of setting guideline rates, where mandatory rates are
concerned, the importance of these assumptions is inevitably much greater.
Moreover, the example of NSW, which has apparently sought to address this issue by specifying
three sets of rates differentiated according to truck age, highlight a further difficulty in this area.
Table 6.3 reproduces Table 1 from the NSW General Contract Carriers Determination.
271 A second schedule included with the Western Australian guideline rates assumes the vehicles are 5 years
old. However, these are not the rates used in the comparison schedule prepared by the Tribunal.

113
Table 6.3: Vehicle Rates - NSW General Contract Carriers Determination
Class of vehicle and Rigid Vehicles Carrying Capacity
Vehicle Age, Scale A (Up to 1
year) hourly Standing
Rate ($ per hour)
Vehicle Age, Scale A (Up to 1
year) running
Rate (cents per km)
Vehicle Age, Scale B (Over 1
year, up to 3 years) hourly
Standing Rate ($ per
hour)
Vehicle Age, Scale B (Over 1
year, up to 3 years)
running Rate (cents
per km)
Vehicle Age, Scale C (Over 3 years) hourly
Standing Rate ($ per
hour)
Vehicle Age, Scale C (Over 3 years)
running Rate (cents
per km)
Up to 2 tonnes Not
applicable Not
applicable Not
applicable Not
applicable Not
applicable Not
applicable
2 to 5 tonnes 35.91 42.23 31.53 45.30 25.30 45.36
5 to 8 tonnes 42.47 58.45 36.11 58.71 27.16 58.75
8 to 10 tonnes 49.64 71.46 41.16 72.28 34.82 72.31
10 to 12 tonnes 66.36 100.60 52.09 99.48 42.32 99.61
12 to 14 tonnes 86.06 126.47 65.07 126.42 51.05 126.57
14 tonnes + 95.93 150.09 71.75 148.76 54.75 148.94
Single Axle Prime Mover
69.50 136.54 54.42 137.16 44.41 137.28
Bogie Axle Prime Mover
98.58 157.14 73.66 157.02 56.11 157.19
Table 6.3 shows that the rates applicable decline as the age of the vehicle increases. Thus, for
example, in relation to a bogie axle prime mover, the Scale B standing rate (over 1 year, up to 3
years) is 25.3 per cent lower than the Scale A rate, while the Scale C rate (over 3 years) is 23.8 per
cent lower than the Scale B rate and 43.1 per cent lower than the Scale A rate. While total
remuneration will clearly differ significantly less than these comparisons suggest, since the running
rates are near identical, it is arguable that these differences may create incentives to use the truck
intensively in the period prior to its moving from one rate scale to the next, thus promoting unsafe
driving practices .
Fair Work Act 2009 6.3.2
For employee drivers covered by the national workplace relations system,272 the FW Act provides a
safety net of minimum terms and conditions of employment comprising the national minimum
wage, National Employment Standards (NES) and modern awards.
The NES cover matters including hours of work, flexible working arrangements, leave, public
holidays, notice of termination and redundancy pay, and information requirements. Modern awards
272 The Department of Employment has estimated that approximately 96% of all private sector employees are
covered by the Fair Work Act.

114
set out minimum wages and conditions for specific industries or occupations and apply on top of the
NES and minimum wage.
The two main modern awards which apply in the road transport industry are the RTD Award and the
RLTO Award.273 These awards cover a number of matters such as hours of work, minimum rates of
pay, allowances, leave, and consultation and dispute resolution.
The LDO Award provides for employees engaged in long distance operations to be paid for all driving
time pursuant to either a specified hourly or per kilometre rate.274 Further, where an employer has
an accredited Fatigue Management Plan in place (as approved under a Commonwealth or state law),
the LDO Award provides that the hourly rate may be used to calculate a trip rate for the journey
based on the number of driving hours specified in the Fatigue Management Plan for that journey.275
The LDO Award also requires employees to be paid an hourly rate for time spent loading/unloading
vehicles,276 and for up to 8 hours delay occurring because of breakdowns or impassable highways.277
The FW Act also affords employee drivers employment protections under the general protections
and unfair dismissal provisions,278 while the FWC can make orders to resolve disputes in relation to
enterprise agreements, bargaining and unfair dismissal. The FWC can also conciliate or mediate
general protections disputes, and can arbitrate the dispute if the parties agree. Alternatively, a
relevant court can also make a binding decision in a general protections dispute.
Appendix 5 contains further information on the operation of the FW Act, modern awards and
enterprise agreements.
Owner drivers are primarily covered by commercial rather than employment law, given their legal
status as independent contractors - in effect, small business operators. They are therefore not
entitled to minimum wages or conditions, such as annual leave, sick leave and notice of termination,
provided for under the NES or a modern award. They typically provide services to other
organisations (i.e. a hirer) under a contract for service, which will usually include negotiated rates
and other working arrangements and payment terms. However, some of the general protections
provided under the FW Act extend to independent contractors and their principals (hirers).279 As
273 Modern Awards can be viewed on the Fair Work Commission website at www.fwc.gov.au.
274 The LDO Award includes schedules of agreed driving distances (clause 13.4(b)) and hours (clause 13.5(c)) for
journeys between specified centres which are to be used in the calculation of payments. Where a journey to be completed is not listed in clause 13.5(c), payments are required for actual hours worked and must not be pursuant to a trip rate which provides for a fixed amount per trip. 275
See clause 13.5(a)(iii) of the LDO Award. 276
See clause 13.6 of the LDO Award. 277
See clause 22 of the LDO Award. 278
The General Protections, in Part 3-1 of the Fair Work Act, include protection from adverse action taken against an employee because the employee has a workplace right, has or has not exercised a workplace right, or proposes to, or not to, exercise a workplace right. It also includes protection from adverse action taken against an employee because of their industrial activity or for a discriminatory reason. 279
An independent contractor or principal is protected from adverse action by a principal (person who has or proposes to enter into a contract for services) because the independent contractor has a workplace right, has or has not exercised a workplace right, or proposes to, or not to, exercise a workplace right or because of their engagement in industrial activities. In the context of an owner driver, adverse action by a principal contractor against the owner driver includes refusing to engage the owner driver, terminating the contract for service,
115
with employees, the FWC can assist in the resolution of general protections disputes by mediation or
conciliation if the parties agree to participate. However, the FWC cannot make any binding decisions
or orders. All disputes regarding a contract for services will need to be pursued through the courts
for formal resolution.280
Other legislation 6.3.3
In addition to the protections under the FW Act, independent contractors are also capable of having
harsh and unfair contracts reviewed by the Federal Circuit Court under the Independent Contractors
Act 2006 (Cth) (IC Act). The court will look at the terms of the contract and the circumstances when
the contact was made. In doing so the Court may have regard to, among other things, whether the
total remuneration paid to the independent contractor is less than an employee doing the same
work would have received. If it finds the contract is unfair or harsh, it can vary the contract.281
The Competition and Consumer Act 2010 (Cth) (CC Act) permits the ACCC to authorise independent
contractors to collectively bargain with larger operators subject to certain conditions. It is also worth
noting that the Government committed in its election policy282 to extend to small business the
‘unfair contracts terms’ protections already available to consumers under the CC Act,283 and to
conduct a “root and branch” review of competition laws. While some detail on the latter has been
published in the form of draft terms of reference, details on the former are yet to be released.
Appendix 5 provides further detail on the operation of the IC Act and CC Act.
6.4 Objectives of the Road Safety Remuneration Act 2012
The key objectives of the RSR Act are to promote safety and fairness in the road transport industry.
Section 3 of the RSR Act, which sets out these objectives, also specifies in part the manner in which
they are to be achieved:
3 Object
The object of this Act is to promote safety and fairness in the road transport industry by
doing the following:
refusing to make use of the owner driver’s services, altering the position of the owner driver to their prejudice and discriminating against the owner driver in the terms or conditions offered. See Part 3-1 of the Fair Work Act. 280
Alternative dispute resolution methods are available (such as voluntary mediation, conciliation and arbitration), however if they are not successful the dispute will ultimately require court action to achieve resolution. 281
It is understood that there have been very few cases with regard to independent contractors seeking relief
from unfair contracts, and only one case in particular involving owner drivers. In Keldote Pty Ltd & Ors v
Riteway Transport Pty Ltd [2010] FMCA 394 (16 June 2010), the Federal Magistrates Court of Australia ruled
that the Contracts between three owner drivers and a transport company were unfair because they required
the owner drivers to upgrade their vehicles without an applicable trip rate. 282
Refer to ‘The Coalition’s Policy for Small Business’ at http://www.liberal.org.au/our-policies (accessed 7 April 2014). 283
See Schedule 2, Part 2-3 ‘Unfair Contract Terms’.

116
(a) ensuring that road transport drivers do not have remuneration-related incentives to
work in an unsafe manner;
(b) removing remuneration-related incentives, pressures and practices that contribute to
unsafe work practices;
(c) ensuring that road transport drivers are paid for their work; including loading or
unloading their vehicles or waiting for someone else to load or unload their vehicles;
(d) developing and applying reasonable and enforceable standards throughout the road
transport industry supply chain to ensure the safety of road transport drivers;
(e) ensuring that hirers of road transport drivers and participants in the supply chain
take responsibility for implementing and maintaining those standards;
(f) facilitating access to dispute resolution procedures relating to remuneration and
related conditions for road transport drivers.
The above discussion highlights the potential for overlap that exists between a range of existing
legislation and the RSR Act, particularly in relation to employee drivers and the subclauses of
Section 3 of the Act which specify how the objectives of improving safety and fairness are to be
achieved.
For example, since the definition of ‘road transport driver’ includes an ‘employee driver’,284
clause (c) of the ‘Object’ provision of the RSR Act overlaps with the LDO Award,285 which also states
that drivers are to be paid for loading and unloading times. While the LDO Award is currently silent
on the issue of waiting time, this comparison highlights the fact that, in this area as in many others,
existing industrial arrangements appear to be capable of dealing with specific issues of the kind
which the RSR Act purports to address.
Similarly, clauses (d) and (e) of the ‘Object’ clearly overlap with the CoR concept in the HVNL and the
objects of that law, as set out below:286
3 Object of Law
The object of this Law is to establish a national scheme for facilitating and regulating the use
of heavy vehicles on roads in a way that—
(a) promotes public safety;
(clauses b and c excluded)
(d) encourages and promotes productive, efficient, innovative and safe business
practices.
284 See sections 5 and 6 of the RSR Act.
285 See clauses 13.3 and 13.6 of the LDO Award.
286 See sections 3 and 4 of Chapter 1, Part 1.1 of the HVNL.

117
4 Regulatory framework to achieve object
The object of this Law is to be achieved by a regulatory framework that—
(clauses a and b excluded)
(c) prescribes requirements about the following—
(i) the standards heavy vehicles must meet when on roads;
(ii) the maximum permissible mass and dimensions of heavy vehicles used on
roads;
(iii) securing and restraining loads on heavy vehicles used on roads;
(iv) preventing drivers of heavy vehicles exceeding speed limits;
(v) preventing drivers of heavy vehicles from driving while fatigued; and
(d) imposes duties and obligations directed at ensuring heavy vehicles and drivers of
heavy vehicles comply with requirements mentioned in paragraph (c)(i) to (v) on
persons whose activities may influence whether the vehicles or drivers comply with
the requirements; and…”
This potential overlap between the objectives of the RSR Act and existing legislation was consistently
raised as a key concern of many stakeholders, who often described specific instances where the RSR
Act was perceived to duplicate or overlap existing legislation. These views are examined in detail in
Section 7.3.3 of this report.

118
7 Stakeholder Views
Key Points
A total of 26 stakeholder submissions were received, while a number of direct consultations with stakeholders were conducted by teleconference. Only five submissions supported the continuation of the RSRS in its current form. 11 submissions called for the abolition of the RSRS while 10 called for major reform of it.
Supporters of the RSRS argued that it was the only effective means of addressing the link between remuneration and safety and of ensuring all supply chain participants were involved in improving safety performance in the industry. They also argued that certain regulatory efficiencies could be attained via the RSRS, as it enables an integrated approach to safety issues to be taken.
By contrast, many opponents of the RSRS argued that the link between remuneration and safety has not been adequately established and should be the subject of further research before any policy action of this type was taken. They therefore believe that little, if any, safety benefit is likely to arise from the implementation of the RSRS.
However, these stakeholders focused strongly on the additional regulatory compliance costs that they see as arising from the RSRS. These are said to be the result of the high level of regulatory overlap and duplication created by the system and the associated complexity involved in ensuring compliance. Particular concerns were voiced by a number of stakeholders as to the ability of small business to meet its obligations.
Opponents of the RSRS generally argued for further reform of existing heavy vehicle safety regulation, together with better implementation, as a preferred means of improving safety performance.
In the event that the RSRS is to be retained, several stakeholders argued that its scope should be restricted to owner drivers and/or that a lighter-handed approach, not involving mandatory rate setting should be adopted. Several stakeholders also argued that the scope of RSRO should be restricted to remuneration per se, so that the level of regulatory duplication they entail is reduced.
7.1 Description of consultation undertaken
The Review sought the input of interested parties in several ways following the media release
regarding the conduct of the review issued by Minister Abetz on 20 November 2014. First, a public
call for submissions was made via the Review website. Second, the reviewer wrote to a range of key
stakeholders highlighting the Review and inviting submissions. Third, teleconferences were
undertaken with a number of stakeholders, some initiated by the reviewer and others at the request
of the stakeholders themselves. The majority of stakeholders which engaged with the Review via
teleconferences also provided written submissions. The exceptions to this were the NHVR and
Linfox; the views expressed in this report are therefore taken from those discussions rather than
from written material supplied.
The public call for submissions invited interested parties to provide submissions in response to the
Terms of Reference, including addressing the following matters:
1. The impact to date of the Tribunal on the road transport industry and its safety performance
119
2. The potential future impact of the Tribunal on the road transport industry and its safety
performance
3. The appropriateness of the Tribunal model as a means of addressing safety performance in
the road transport industry, having regard to key policy considerations of effectiveness and
efficiency
4. Any preferred approaches to addressing road safety concerns in the road transport industry
5. The nature and extent of any regulatory overlap and duplication arising from the operation
of the Road Safety Remuneration System, including any additional regulatory or economic
burdens and potential means of addressing these
6. Any other issues considered relevant to the Review
An overview of the views expressed by the various stakeholders on these matters is provided below.
7.2 Overview of stakeholder submissions
A total of 26 written submissions were received. The majority of submissions are available on the
Department of Employment’s website,287 but four organisations requested that their submissions
remain confidential. While these views have been taken into account, the report does not attribute
the views expressed by these stakeholders. As may be anticipated, the views expressed by
stakeholder are varied, although they may be broadly summarised as follows:
11 submissions strongly oppose the RSRS; that is, they recommend the Tribunal be abolished
and the RSR Act be repealed;
10 submissions do not specifically support or oppose the RSRS but raise significant concerns
with the Tribunal, the RSR Act and/or the 2014 Order;
1 submission specifically supports retaining the Tribunal with a refined scope and role; and
4 submissions fully support the RSRS.
Each of the submissions agreed that heavy vehicle safety was a significant policy issue and that
improving performance should be an industry and public policy priority. However, the quite strong
level of concern expressed regarding the RSRS and the operation of the Tribunal is notable and
clearly represents a significant issue. Key comments regarding the merits of the RSRS as a whole are
summarised below.
Submissions in support of the RSRS 7.2.1
As noted above, five submissions supported the RSRS, although one of these advocated changes to
the scope of the Tribunal's functions and its specific role. The four submissions in support of the
RSRS in its current form came from two unions (TWU and National Union of Workers) and from two
individuals working in the field. With the exception of the TWU submission, these submissions in
support of the RSRS were extremely brief (one to 2.5 pages) and provided relatively little detail as to
the views expressed.
The TWU is fully supportive of the RSRS, stating that:
287 See www.employment.gov.au

120
“The Road Safety Remuneration Act 2012 and the Road Safety Remuneration Tribunal were
set up in response to more than 20 years of evidence showing the link between driver rates
and safety on our roads.
The legislation draws on a substantive body of evidence demonstrating that improving safety
on our roads requires the active involvement of all supply chain participants. It is only by
engaging clients, fleet owners, transport companies, operators and drivers that commercial
pressures that reverberate through the supply chain can be addressed in both a safe and fair
way.”288
The submission from Intercapital Trucking Pty Ltd argued that the RSRS constituted an essential
response to:
"...the refusal of major companies to conduct themselves in a fair way when conducting
business with people who do not have the business acumen, knowledge of their common law
rights, and the RSRT gives the tribunal the right to address these issues if it is bought to their
attention."289
A third submission emphasised the role of the Tribunal in mediating between the interests of a wide
range of parties and saw the resulting decisions as having democratic legitimacy.
Submissions expressing concerns regarding the role or operation of the RSRS 7.2.2
A large number of stakeholders identified regulatory duplication and/or overlap as a key general
issue of concern regarding the RSRS, but did not specifically oppose the continuation of the system.
These concerns include, but are not limited to, the nature and extent of regulatory overlap and the
impact on owner drivers, compliance burdens, the operation and conduct of the Tribunal, and
coverage of the RSR Act.
The Victorian Government identified a number of areas where there is overlap in the application and
content of the Order and the Victorian Act, instruments and other State regulation which may lead
to some duplication of obligations under the various regulatory systems, as well as complexity in
determining which obligations apply to particular engagements and how they may be satisfied. They
also questioned the necessity of the RSRO:
“The Tribunal’s decision accompanying the Order does not clearly answer the question as to
whether the obligations imposed by the Order are necessary given the concurrent operation
of State-based laws, or whether they represent an increase in regulatory burden that is not
sufficiently offset by an increase in safety standards.”290
Similarly, the NSW Government stated that:
“…any approach to addressing safe payments must closely consider how to complement,
potentially leverage or at the very least not duplicate existing work health and safety, and
288 Submission of Transport Workers Union, p.2.
289 Submission of Intercapital Trucking Pty Ltd, p.2.
290 Submission of the Victorian Department of Treasury and Finance, p.16.
121
road safety, legislation. Such duplication may cause confusion for participants in the road
freight transport sector and thereby detract from their ability or willingness to comply with
‘safe rates’ legislation.
This conflict and overlap with existing legislation could result in job losses, small business
closures, reduced industry investment, prevent market entry and limit innovation within the
industry and pass unnecessary costs on to consumers.”291
Other submissions seeking reform, rather than abolition, of the RSRS focused on its scope and
proposed various limitations. Thus, the Australian Road Transport Industrial Organisation (ARTIO)
submitted that the Tribunal's activities should be limited to addressing the remuneration-safety link
and to complementing the CoR and WHS provisions enacted by the states and territories:
“Currently the Road Safety Remuneration Act does not prevent the Tribunal from overriding,
extending or duplicating obligations contained in other legislation.”292
Similarly, ARTIO argued strongly that it is not appropriate that the RSRS has jurisdiction over
employees already covered by the FW Act, modern awards or enterprise agreements. The Australian
National Retailers’ Association (ANRA) suggested the Tribunal would be best placed to focus on
establishing minimum rates of remuneration and related conditions that apply only to contracts
involving small independent contractors:
“Large operators already have systems in place to ensure they are meeting all the safety and
remuneration obligations under the laws that exist outside the Road Safety Remuneration
System.”293
Finally, the Australian Logistics Council (ALC) raised concerns as to the qualifications of the Tribunal
to address the safety issues over which its legislation gives it jurisdiction, commenting that “…a
majority of members are effectively industrial relations practitioners with limited specialist
knowledge in safety issues relating to the sector”,294 implying that the Tribunal may not have
appropriate knowledge to make decisions on behalf the industry.
Submissions opposed to the RSRS 7.2.3
As noted above, there is substantial opposition to the premise underpinning the RSRS. For example,
the Australian Chamber of Commerce and Industry (ACCI) argue:
“…There is no conclusive finding of cause and effect relating to remuneration and safety
outcomes.
…The existing RSRS is an excessive regulatory intervention to appropriately address this issue.
It unreasonably includes within its coverage parties which are already satisfactorily regulated
at a state and territory level, or otherwise through the Fair Work system.
291 Submission of the New South Wales Department of Industrial Relations, p.1.
292 Submission of the Australian Road Transport Industrial Organisation, p.12
293 Submission of the Australian National Retailers’ Association, p.4
294 Submission of the Australian Logistics Council, p.6

122
…Any proposed regulatory intervention should consider gaps in coverage or application.”295
Similarly, the Northern Territory Government recommends that the RSRS be abolished and that
matters regarding safety and related pay and work conditions should be managed through existing
regulatory arrangements. Their argument for the abolition of the system highlighted the fact that
existing legislation is already in place (i.e. the Fair Work system, WHS provisions and HVNL) that
adequately deal with the issues as well as business and industry considerations in the Northern
Territory, particularly relating to the Northern Territory’s relative remoteness and dispersed
population and the associated high costs of transporting goods and services for both business and
the general population.
State governments that already address remuneration issues legislatively highlighted the overlap
between the RSRS and their own legislation in expressing their opposition. The Western Australian
Government reiterated the views expressed in their submission in response to the Safe Rates, Safe
Roads Directions Paper:
“…the State Government was opposed to the introduction of a national road transport
tribunal on the basis that a national tribunal would overlap the road transport regulatory
system already in place in Western Australia and would result in confusion and an increased
regulatory burden for transport operators, as well as being less effective than the existing
State system in delivering safety outcomes.”296
The Western Australian Government also notes that prior to the establishment of the RSRS they:
“…expressed opposition to any potential use of the trade and commerce power of the
Australian Constitution to support the establishment of the desired national framework on
the basis of the potential for a national system to further erode State responsibility and
introduce another level of complexity into the current regulatory framework”.297
A number of industry submissions highlighted the issue of regulatory overlap and duplication as key
to their opposition to the RSRS. Thus, Master Builders Australia (MBA) submits that the RSRS should
be abolished, stating that it is “…superfluous as there is overlapping regulation that is better suited to
regulating safety within the road transport industry.”298
Coles Supermarkets Australia is concerned about the potential for the RSRS to impose regulatory
and compliance measures on supply chain participants which:
“…merely duplicate existing measures imposed by other legislative schemes (including State and Territory chain of responsibility and WHS legislation, the Fair Work Act and the Heavy Vehicle National Law) without addressing the key issue of adequately enforcing existing regulation;
295 Submission of the Australian Chamber of Commerce and Industry, p.3.
296 Submission of the Western Australian Department of Commerce, p.6.
297 ibid, p.6.
298 Submission of the Master Builders Australia, p.12.
123
impose significant cost burdens without yielding corresponding improvements to safety outcomes;
in some respects, simply cannot be complied with in a practical sense (either due to the scale of the relevant supply chain, or the degree of control exercisable by the supply chain participant over the relevant activity);
do not adequately focus on those operators and sectors within the industry which face the most significant compliance issues (such as smaller operators in the inbound line haul sector); and
act as a mechanism to apply industrial pressure outside of the established enterprise bargaining regime.”299
Some stakeholders expressed concern that the RSRS is the wrong approach to achieve its stated
objective. The Australian Industry group (Ai Group) stated in its submission that improving safety in
the industry requires a whole-of-government approach rather than a narrow focus upon the method
and quantum of remuneration. It highlights the need for any regulatory intervention to have broad
support, including the support of Commonwealth, state and territory governments and industry and
argues that this is lacking in the case of the RSRS:
“The RSR System does not have broad support. It is a flawed system which was implemented
by the previous Government in response to the Transport Workers Union’s Safe Rates, Safe
Roads industrial campaign.
The RSR System is distracting Government and industry attention resources away from the
measures which are widely recognised as improving safety, towards a regime which is not
widely supported nor underpinned by robust economic modelling.”300
The National Farmers’ Federation (NFF) also views that the establishment of the Tribunal has:
“…distracted government and industry attention and resources away from the measures
which are widely recognised as improving safety, such as risk identification and control;
improving roads; fatigue management; education and training; drug and alcohol policies; use
of technology; and stronger compliance and enforcement mechanisms.”301
299 Submission of Coles Supermarkets Australia, p.1.
300 Submission of the Ai Group, p.2.
301 Submission of the National Farmers’ Federation, p.5.
124
The NFF believes that:
“…the Road Safety Remuneration Act 2012 (RSR Act) falls short in providing any real
measures to improve safety in the transport industry. ‘The RSR Act is focused upon providing
remuneration mechanisms/outcomes without any requirement for improved safety.”302
The ACCI is also concerned that the RSR Act does not provide any avenue of appeal beyond judicial
review under the Constitution. The ACCI submits that any revised regulatory system should allow an
aggrieved party to appeal decisions of the relevant regulator.
7.3 Stakeholder views on key issues
The following summarises the views received from stakeholders on several key issues identified in
the Terms of Reference. Additional detail on some issues, in particular those relating to regulatory
duplication and overlap, is provided in Appendix 6.
Impact to date of the Tribunal on the industry and its safety performance 7.3.1
The majority of stakeholders agree that it is difficult to assess the impact of the Tribunal to date,
given that it has been operating for less than two years and that its first RSRO will not take effect
until May 2014. The ALC argued that the review is necessarily an ex ante one and that it is therefore
not possible to assess the economic burden of the Tribunal on the Australian economy. Coles
Supermarkets Australia similarly stated that “…as the Tribunal has yet to meaningfully exercise its
statutory functions it cannot be said to have had any demonstrable impact on the road transport
industry’s safety performance to date.”303
The TWU went further, stating that the “…review of the road safety legislative framework at this
point of time is premature at best and ideologically charged at worst.”304 It expressed the view that
the latest commencement date for the review specified in the Act - 1 July 2015 - “…represents a
more accurate and useful juncture of assessing if the Act has allowed more drivers to return home
safely each night.”305
The Ai Group was of the view that despite the fact that the 2014 Order has yet to take effect, the
RSRS has nevertheless had a negative impact on the industry:
“…it would be difficult to assert that, to date, the RSR System has delivered any identifiable
positive impact on safety in the road transport industry. Its first RSRO is yet to commence.
Nonetheless, we note that the system has resulted in a significant level of uncertainty and
anxiety within industry regarding the potential changes to the regulatory environment that
may flow from the Tribunal’s operation. Such uncertainty undermines business confidence
and productivity. It undermines industry’s capacity to make and implement relevant decisions
regarding their operations, and it undermines safety. Improved safety is not furthered by
complexity and confusion. The implementation of the RSR System has already imposed a
302 ibid, p.4.
303 Submission of Coles Supermarkets Australia, p.2.
304 Submission of the Transport Workers’ Union, p.9.
305 ibid, p.2
125
significant burden and distraction on industry. It has been forced to come to terms with an
entirely new legislative regime that interacts with existing laws in an extremely complex
manner.”306
In total, 17 of the 26 submissions received explicitly stated that the Tribunal has had little observable
impact on the road transport industry to date, with the 2014 RSRO not yet operational. Several
stakeholders expressed surprise or disappointment that the Tribunal has not made use of its
research function to investigate the fundamental issue of the nature and extent of linkages between
rates of pay and road safety outcomes, with the context for these observations being that a number
of stakeholders have previously unsuccessfully lobbied the Tribunal to incorporate such research
into its work program.
7.3.1.1 2014 Order
The 2014 Order was raised as a concern by a number of stakeholders, with the key issues identified
being duplication, the practicability of complying with its provisions and the administrative costs
likely to be incurred in doing so.
The ARTIO state that “…the Tribunal ruled that its jurisdiction was not limited strictly to
remuneration related conditions and may include within an order any measure that may be related
to safety within the industry.” Therefore the ARTIO believe “…that there exists considerable potential
for orders to overlap and duplicate existing regulatory schemes and impose significant cost and
compliances burdens on the industry.”307
Further, in relation to the consultation processes, the Australian Trucking Association (NSW) stated
that their members were baffled at the release of the 2014 Order, stating that it reflected a
“…complete lack of understanding of the ad hoc nature of the industry…” and demonstrated that the
Tribunal “…ignored the strong evidence provided by those in industry that this order affects the
most.”308
Some stakeholders argued that the 2014 Order requires participants in the road transport supply
chain to comply with additional regulation that unnecessarily duplicates existing regulation and is
also, in some respects, inconsistent with existing regulation. Key areas of overlap identified were the
HVNL and WHS legislation.
The ACCI maintains its concern that the RSRS regulates a significant number of matters that are
currently regulated by state or territory based legislation, other Commonwealth bodies such as the
NHVR, or that will be addressed through the COAG.
The Ai Group commented that:
“…industry has been obliged to attempt to engage with the new RSR Tribunal concerning the
making of RSROs with the potential to impose significant and problematic new obligations.
306 Submission of the Ai Group, p.15 and 16.
307 Submission of the Australian Road Transport and Industrial Organisation, p.3.
308 Submission of the Australian Trucking Association (NSW), p.1.

126
Unfortunately, this burden has been insurmountable for the vast majority of stakeholders.
Very few employers have directly participated in the Tribunal’s operations. The increased
regulatory burden imposed on industry by the RSR System comes at a time when industry is
still grappling with the implementation of important reforms to work health and safety laws
and Transport Regulation along with successive and ongoing changes to the workplace
relations system (both in the legislative context and in relation to the content of relevant
modern awards).”
“The burden will be exacerbated by the recent release of the Tribunal’s first RSRO…”309
A number of stakeholders were of the view that the obligations imposed by the 2014 Order would
present particular compliance difficulties for small business operators. The industry bodies
representing small to medium businesses are concerned that the potential extra compliance
obligations and associated administrative burdens imposed would be very costly and time-
consuming for smaller businesses, particularly owner drivers.
Many stakeholders argued that the Tribunal had not complied with its obligation to fully consider
and examine existing legislation in the course of making the 2014 Order. Furthermore, some
stakeholders believe that the timeframes for submissions and consultations on the draft RSRO were
considered to be too rushed and that opportunities to participate in discussions on its content were
limited. The Ai Group claim that:
“…the approach of the Tribunal severely limited industry’s involvement in the making of the
first RSRO. In contrast to the development of the first RSRO, the Heavy Vehicle National Law
and harmonised work health and safety laws were the product of extensive and detailed
consultation and input from a very broad array of industry participants over several years.
This represents a far more effective approach to the development of safety regulation.”310
Similarly, the ALC highlighted a number of problems with the process by which the 2014 Order was
developed. It stated that some evidence was not considered due to witness unavailability for cross
examination and that much time was spent on whether the parties had enough time to consider
evidence presented. They further commented that there “…is some doubt as to whether this is the
best method to develop legally binding safety standards.”311
The ANRA criticised the “unnecessarily” broad scope of the 2014 Order, in that its coverage extends
beyond owner drivers and includes employee drivers.
The state governments that currently have legislation in place in relation to remuneration matters
made a number of comments concerning the relationship between the 2014 Order and their own
legislative arrangements, highlighting both key differences and areas of overlap.
The Victorian Government commented:
309 Submission of the Ai Group, p.16.
310 ibid, p.19
311 Submission of the Australian Logistics Council, p.7.

127
“…there may be circumstances where owner-drivers move in and out of coverage of the
Order, such as where short haul drivers operate in a number of sectors, only some of which
are covered by the Order. This may contribute to uncertainty by industry participants about
their obligations, in particular small operators.”312
“There are areas of overlap in the coverage and content of the Order and the Victorian Act,
instruments and other State regulation. This may lead to some duplication of obligations
under the various systems, as well as some complexity in determining which obligations
apply to particular engagements. Therefore, the interactions between the RSR System, the
Order and existing State regulation have the potential to cause some complexity and
confusion for participants in the Victorian road transport industry. This has the potential to
increase the regulatory burden and impose additional costs on participants in the
industry.”313
The Western Australian Government submitted that:
“…the high level objectives of the RSR Act and the OD Act are broadly similar. Both Acts seek
to promote safety in the road freight transport industry by putting into place measures that
reduce the financial incentive for owner-drivers to operate in ways that increase the risk of
death and injuries on the road. Both Acts also aim to improve fairness for owner-drivers by
ensuring that they are paid equitably for their work, and both acts facilitate access to dispute
resolution procedures relating to remuneration and related conditions for road freight
drivers. The RSR Act has broader coverage and wider powers than the OD Act, such as
providing for the making of national road safety remuneration orders and collective
agreements. In addition, the RSR Act covers employee drivers and other participants in the
supply chain not covered in WA’s OD Act.”314
The NSW Government is concerned “…that the concurrent operation of these State and
Commonwealth provisions could create significant duplication of regulation which is a matter of
material concern to the NSW Government and NSW stakeholders. Duplication generally leads to
uncertainty and confusion for stakeholders and may increase costs that are passed on to
consumers.”315
Potential future impact of the Tribunal on the road transport industry and its 7.3.2safety performance
As a supporter of the Tribunal in its current format, the TWU advanced the view that the RSR Act
establishes a legislative framework that simplifies current regulatory arrangements:
312 Submission of the Victorian Department of Treasury and Finance, p.10.
313 Submission of the Victorian Department of Treasury and Finance, p.9.
314 Submission of the Western Australian Department of Commerce, p.6.
315 Submission of the New South Wales Department of Industrial Relations, p.3.
128
"...the Act establishes a legislative framework that simplifies the regulatory response to this
critical safety issue. Empowering the one regulator to address rates, commercial practices,
safe driving and enforcement issues..."316
The TWU stated that the Tribunal is the only way to deal with the issue of remuneration and safety,
as WHS legislation does not deal with economic pressure and the CoR legislation only deals with the
symptoms but not the cause of issues that arise due to power imbalances within the industry. The
TWU believes a key point of difference between the RSRS and other existing legislation bearing on
heavy vehicle safety is that the Tribunal is taking a proactive approach to safety, rather than focusing
on post-breach actions, as occurs under WHS legislation.
The TWU expressed the view that it would like the Tribunal to set remuneration rates in a manner
consistent with that currently used in NSW in future RSRO, as they believe this will address the
present excessive undercutting of rates by owner drivers and provide stability within the industry.
The TWU also highlighted the importance of the Tribunal’s unique capacity to address the complex
range of matters impacting on road safety in a holistic fashion, taking into account factors from a
range of other regulatory fields (including road transport law, CoR and fatigue management, WHS
and modern awards). The TWU also argued that prior to the passage of the RSR Act and
establishment of the Tribunal regulatory efforts in road safety were principally focussed on
compliance. Previous attempts to expand the scope of other regulatory arrangements to enable
remuneration-related matters to be addressed have so far been rejected, making the RSR Act and
Tribunal the only mechanisms “…capable of implementing the suite of measures, identified as
necessary, to address the root causes of the safety crisis in the road transport industry.”317
Intercapital Trucking Pty Ltd particularly lauded the ability of the Tribunal to function as a no-cost,
independent forum for independent contractors to raise disputes against larger entities, thereby
better balancing the difference in bargaining power.318
The ARTIO submission was generally supportive of the underlying intent of the RSR Act and the
Tribunal, viewing it as the only legislative mechanism currently available to address the core issues
pertaining to remuneration and safety at a national level. They concede there is a role for the
Tribunal, but argue that it needs to be more limited than it is at present and driven by research.319
Many stakeholders have expressed the view that the Tribunal will increase regulatory burdens and
compliance costs without actually producing improvements in safety outcomes. This is considered to
be a particular concern for small businesses - notably owner drivers - as they do not have the
resources and capacity to deal with additional legislative requirements. The ANRA stated that, by
contrast, the major operators already have systems and processes in place to meet their
obligations.320 The NSW Government expressed concerns about how current and future obligations
316 Submission of the Transport Workers’ Union, p.9.
317 ibid, p.35
318 Submission of Intercapital Trucking Pty Ltd, p.2.
319 Submission of the Australian Road Transport and Industrial Organisation, p.6.
320 Submission of the Australian National Retailers’ Association, p.5.

129
under WHS legislation, and heavy vehicle and road safety legislation will interact with the operation
of the Tribunal and its education and compliance framework.321
Some larger organisations are concerned about the potential of the Tribunal to impose regulatory
and compliance measures on supply chain participants. There is concern that future RSROs that
regulate rates of pay, as foreshadowed by the Tribunal, would unreasonably increase costs and
regulatory burdens for all parties.
Regulatory overlap and duplication arising from the operation of the RSRS 7.3.3
The majority of stakeholders felt that there was substantial overlap and duplication arising from the
operation of the RSRS and that this would add to regulatory and economic burdens for business. A
fundamental aspect of this concern arises from the fact that the Tribunal's 2014 Order deals almost
exclusively with matters other than remuneration. A number of stakeholders have argued that the
Tribunal has, in making its 2014 Order, adopted an unduly broad interpretation of the permitted
scope of the RSRO, in light of the provisions of section 27 of the Act. This inevitably means that the
level of duplication and overlap implied in the current RSRO is greater than would otherwise be the
case, while the closely related concern expressed was that this approach potentially presages a
wider range of interventions in areas other than remuneration per se in future RSRO and other
activities.
Section 27(1) of the RSR Act states that:
"If the Tribunal decides to make a road safety remuneration order, the Tribunal may make
any provision in the order that the Tribunal considers appropriate in relation to remuneration
and related conditions for road transport drivers to whom the order applies."
A widely held stakeholder view, in light of the adoption of an initial RSRO that generally deals with
issues other than remuneration per se, is that many of the matters dealt with cannot easily be seen
as being remuneration-related conditions. For example, one confidential submission stated in this
context that:
“…[we believe] that the RSRT is trying to expand its reach into areas that are already
regulated by other laws (such as the Fair Work Act, state and territory work health and safety
laws, and the Heavy Vehicle National Laws).”322
This issue appears to relate particularly to the provisions contained in Part 5 of the 2014 Order,
which establish very prescriptive requirements in respect of Safe Driving Plans as well as
requirements in relation to training and drug and alcohol policies. While such provisions are clearly
safety-related, in the broader sense, section 27 of the RSR Act constrains the use of RSROs to
promoting safety via conditions that are ‘related’ to remuneration.
As discussed elsewhere, the issues underlying the Safe Driving Plan requirements are clearly within
the scope of the HVNL and are addressed via aspects of that legislation. The fact that the Tribunal, in
321 Submission of the New South Wales Department of Industrial Relations, p.5.
322 Confidential submission.

130
its first ever RSRO, has shown a willingness to address such safety-related issues, which appear not
to have direct and clear-cut relationships to remuneration, highlights the extent of the potential for
future RSRO to further expand the extent of the legislative overlap to which the RSR Act gives rise.
The Tribunal has argued, in paragraphs 396-7 of its judgement, that safe driving plans are
remuneration-related, in that such a plan:
"…requires an employer or hirer to provide a written record of how the road transport service
to be ...performed in accordance with safe work practices...It also requires consideration of
whether any unsafe work practices arose in the performance of the road transport service. ...
This is information which is central to the provision of adequate rates of payment...Thereby it
is information which is central to reducing or removing a remuneration-related incentive
and/or pressure that contributes to unsafe work practices.”323
However, it also cites clause 89 of the Explanatory Memorandum of the RSR Act, as follows:
"The list provides guidance to the Tribunal about what matters can be related conditions. It
should be remembered that subclause 20(2) includes provisions that will also require the
Tribunal to take into account existing laws and other road transport regulatory systems. It is
not intended to overlap or duplicate conditions (such as fatigue laws) which will be set out
in the National Heavy Vehicle laws." 324 [Emphasis added]
The subject matter of the fatigue provisions of the HVNL and its predecessor legislation seem clearly
to lie at the heart of the Safe Driving Plan requirements of the 2014 Order, suggesting that the
inclusion of this key element in the Order is at the least arguably at odds with the intention of the
Act as described above in the Explanatory Memorandum. The Tribunal's decision in relation to the
2014 Order makes no comment on this specific point.
As noted above, a number of stakeholders criticised what they described as the Tribunal’s broad
interpretation of the definition of the term ‘remuneration and related conditions’, as used in
section 27 of the RSR Act, highlighting the potential for this approach to exacerbate regulatory
duplication and overlap. For example, the Ai Group has stated:
“The RSR Tribunal’s decision making the first RSRO reveals that the Tribunal has concluded
that it has power through the making of RSROs to regulate far more than remuneration. This
expanded view of the Tribunal’s power is not appropriate or consistent with the rationale for
its implementation. If effectively means that the Tribunal is afforded a very broad capacity to
regulate both the road transport industry along with its supply chain and issues of safety
generally.
323 Full Bench Decision of 17 December 2013 making the Road Transport and Distribution and Long Distance
Operations Road Safety Remuneration Order 2014, [2013] RSRTFB 7, [396-397]. 324
ibid, para.389

131
…Given that the RSR Tribunal has adopted a very broad view of the scope of matters that can
be regulated through RSROs there is significant potential for enforceable instruments made
by the Tribunal to override and oust the operation of other regulatory regimes.”325
Stakeholders expressed concern that the Tribunal’s interpretation has resulted in a range of matters
being included in the 2014 Order which were never intended by the RSR Act, nominating the
provisions on adverse conduct protection, safe driving plans, training and drug and alcohol policies
and testing. In particular, the Australian Federation of Employers and Industry (AFEI) was critical of
the Tribunal’s reasoning regarding the interpretation of ‘remuneration and related conditions’ as
outlined in the Tribunal’s decision on the 2014 Order, while this criticism was also raised by a
number of other parties during the development of the Order:
“According to this [the Tribunal’s] reasoning, the ‘legitimate’ regulation of ‘remuneration and
related conditions’ through road safety remuneration orders is potentially unlimited
notwithstanding significant doubt that actual improvements in road safety will eventuate.”326
The AFEI argued on behalf of its members that the 2014 Order requires participants in the road
transport supply chain to comply with additional regulation which is unnecessarily onerous,
duplicates and/or is inconsistent with existing regulation. The ACCI similarly stated its view that the
RSRS regulates a significant number of matters that are currently regulated by state or territory
based legislation, other Commonwealth bodies such as the NHVR, or that will be progressed through
the COAG.
The Ai Group argues that the potential for overlap between the RSRS and other laws is significant.
Given that the Tribunal has adopted a very broad view of the scope of matters that can be regulated
through RSROs, they believe there is significant potential for enforceable instruments made by the
Tribunal to effectively overrule aspects of many other regulatory regimes. The Ai Group also argue
that there is potential for the interaction of provisions set out in Division 3 of the RSR Act to lead to
substantial uncertainty and complexity for industry parties faced with the challenge of determining
which elements of respective laws apply to them. This is seen as a particularly confronting task for
the small businesses that constitute the majority of the road transport industry. The problem will be
magnified by the fact that RSROs, if made on a sectoral basis as advocated by parties including the
TWU, are likely to apply in a piecemeal manner and potentially only at certain times, based on the
nature of work being performed. Consequently parties may move in and out of the coverage of the
relevant systems.
In contrast, TWU states that none of the current regulators have the capacity to make the changes
that the Tribunal has been charged with. In their view, while there is indeed overlap between the
RSRS and other legislation dealing with heavy vehicle safety, this is inevitable given the proven
inadequacy of the existing suite of legislation in addressing the safety concerns that gave rise to the
RSRS. Thus, the RSRS will substantially extend and improve the regulatory structure already in place.
The TWU also argues that the RSRS:
325 Submission of the Ai Group, pp.19 and 33.
326 Submission of the Australian Federation of Employers and Industry, p.5.

132
"…not only benefits employee and owner-drivers, but also all companies and fleet operators
in the industry that are currently at the mercy of powerful clients...Empowering one regulator
to address rates, commercial practices, safe driving and enforcement issues, the Act/Tribunal
finally provides an opportunity to cut the death toll."327
Conversely, the NSW Government states that the:
“…conflict and overlap with existing legislation could result in an additional compliance
burden, uncertainty and costs, particularly for smaller businesses, without achieving any real
gain in productivity, safety or remuneration. Independent contractors and small businesses
do not have adequate resources and systems to enable them to implement duplicated
obligations that already exist under other legislation such as the WHS Act. In addition, the
multiple client points of contact that independent contractors engage with will burden the
driver with additional paperwork and regulatory obligations, which is very different from the
experience of a driver within a large operator, whose freight task may be a single delivery of
an entire truckload between only two points.”328
At an institutional level, the NHVR highlighted the need for effective co-ordination mechanisms to be
developed and maintained between itself and the Tribunal in order to ensure consistent and co-
ordinated approaches were taken in complementary and/or overlapping areas of jurisdiction. The
need for such co-ordination is clearly greater to the extent that a RSRO addresses issues other than
remuneration per se.
The Victorian Government considers that the 2014 Order does not clearly establish that the
obligations imposed are necessary given the concurrent operation of state based laws, or whether
they represent an increase in regulatory burden that is not sufficiently offset by an increase in safety
standards. Similarly, the NSW Government stated:
“...any approach to addressing safe payments must closely consider how to complement,
potentially leverage or at the very least not duplicate existing work health and safety, and
road safety legislation. Such duplication may cause confusion for participants in the road
freight transport sector and thereby detract from their ability or willingness to comply with
safe rates legislation. This conflict and overlap with existing legislation could result in job
losses, small business closures, reduced industry investment, prevent market entry and limit
innovation within the industry and pass unnecessary costs on to consumers.”329
An example provided was the stated overlap between requirements under the HVNL to complete
work diaries, keep or hold permits and notices, and complete consignment or delivery paperwork
and the need to develop and document safe driving plans under the 2014 Order. Additionally, some
minimum contract requirements in the 2014 Order were said to be likely to add further regulatory
obligations and compliance burdens to supply chain participants.
327 Submission of the Transport Workers’ Union, p.9.
328 Submission of the New South Wales Department of Industrial Relations, p.4.
329 ibid, p.1

133
Other stakeholders were concerned about the practicalities of implementing safe driving plans
under the 2014 Order, highlighting the impacts of driver work patterns and the required timeframes
for completion of plans and retention of records. As noted elsewhere, a number of stakeholders
expressed the view that the safe driving plan requirements were highly prescriptive in nature and
that this would cause implementation difficulties in some sectors at least.
A number of stakeholders also noted the duplication of the regulation already operating in the road
transport industry, for example between Safe Work Australia's Guide for managing the risk of
fatigue at work and the fatigue provisions of the Heavy Vehicle National Regulations. Many
stakeholders made the point that WHS is already heavily regulated, so that the making of a RSRO
which deals almost exclusively with safety issues, rather than remuneration issues per se, inevitably
gives rise to significant overlap. Those stakeholders that believe the current model is inappropriate
state that safety issues are best dealt with by industry specific legislation enforced by a specialist
safety regulator, such as the NHVR. They argue that it is not apparent how the road safety
remuneration provisions will complement WHS legislation or how the NHVR will interact with the
Tribunal and the operation of the RSRS. In this view, reform of existing safety laws, such as the
HVNL, would be a preferred approach to the continuation of the Tribunal.
The Ai Group highlighted the potential economic impacts of future RSRO setting mandatory
remuneration levels. A key issue raised in this context was with the potential ‘second round’ effects,
of clients substituting employee driver services or even transport by other modes in the event that a
future RSRO were to seek to significantly increase owner driver remuneration:
“…the progressive implementation of RSROs will potentially have an extremely damaging
effect on the road transport industry, including negative employment / engagement effects
on owner drivers and employee drivers. Employee drivers can often be readily substituted for
owner drivers and accordingly ill-conceived regulation puts the livelihood of owner drivers in
jeopardy. Similarly, road transport services often compete with other modes of transport,
such as rail, air and shipping. Excessive road transport cost increases are likely to lead to a
shift to other forms of transport with a consequent adverse effect on the road transport
industry and the people employed / engaged in the industry”.330
However, a large number of stakeholders were concerned that concurrent operation of both state
and Commonwealth provisions could create significant duplication. The Northern Territory
Government commented that:
“The Northern Territory does not consider the expected benefits from operating a standalone
system for the road industry to justify the potential financial and administrative burden on
this industry as well as the potential impact on the cost of living in the Northern Territory.
The current and future safety issues within this industry can be more appropriately addressed
through other regulatory and non-regulatory means. Instead of a separate and additional
legislation and regulatory entity specifically for the road transport industry, the Northern
Territory sees greater benefit in the effective utilisation and as required, strengthening of
330 Submission of the Ai Group, p.60.

134
existing legislative mechanisms outside this System to deal with matters related to the
remuneration and work conditions of road transport workers that impact on road safety.”331
Appendix 6 provides information regarding the interaction of the RSR Act with other legislative
instruments and provides more detailed discussion regarding concerns of stakeholders relating to
specific areas of overlap.
Appropriateness of the Tribunal model 7.3.4
Stakeholders supportive of the Tribunal argued that it provides an effective and appropriate
mechanism for addressing safety concerns, enabling mediation between stakeholders and providing
a forum for resolving issues in the road transport industry, as well as playing a vital role in
monitoring and canvassing complex issues such as vertical supply chain pressures, contracts and safe
driving plans. However, as noted at the beginning of this chapter, a substantial number of
submissions opposed the RSRS, while a further large group raised major concerns with the operation
of the system without explicitly calling for its abolition. Those opposed to the RSRS questioned the
potential for the system to have positive safety impacts and suggested that large economic costs
would more than outweigh any benefits. Thus, for example, the Ai Group argued:
“The Tribunal is not well placed to assess the economic consequences of its orders. Moreover,
Ai Group believes the RSR Act places insufficient obligation on the Tribunal to have regard to
the economic ramifications of any potential RSROs. Alarmingly, section 20 of the Act does not
place any express obligation on the Tribunal to take into account the impact on the road
transport supply chain. Even in relation to the road transport industry, the RSR Act merely
requires the Tribunal to have regard to the likely impact of any order on the ‘viability’ of such
businesses, as opposed to their profitability. There is no obligation on the Tribunal to have
regard to the potential impact of a proposed RSRO on employment.
…The RSR System represents a risky and inappropriate approach to regulating safety with the
potential for very significant and potentially unforeseen adverse consequences for the
Australian Economy and the broader community.”332
Coles Supermarkets Australia argued that the RSRT model “…faces significant challenges from an
efficiency standpoint” 333and imposes “…significant cost burdens without yielding corresponding
improvements in safety.”334
The NFF believes the RSRS “…falls short in providing any real measures to improve safety in the
transport industry. The RSR Act is focused upon providing remuneration mechanisms/outcomes
without any requirement for improved safety.”335
331 Submission of the Northern Territory Northern Territory Department of Business, Northern Territory
WorkSafe, p.3. 332
Submission of the Ai Group, p.61. 333
Submission of Coles Supermarkets Australia, p.2. 334
ibid, p.1 335
Submission of the National Farmers’ Federation, p.4.

135
Some stakeholders have expressed the strong view that the RSRS was established on the basis of
limited evidence of links between rates of pay and safety within the road transport industry and that
the policy basis of the legislation is therefore inadequate. As noted above, the ACCI state the RSRS is
an “excessive regulatory intervention” to deal with the issue of ‘safe rates’ as they do not believe
there is a direct causal link between remuneration and safety outcomes. The calls, which were noted
above, for the Tribunal to exercise its research function to assess the evidence on this issue and
attempt to establish the precise nature of any links between remuneration and safety clearly derive
from this concern.
A number of submissions highlighted the institutional nature of the Tribunal as a quasi-judicial body
and what was believed to be the consequential inevitability of the adoption of an adversarial
approach to its operations. This was contrasted unfavourably with the approach of traditional safety
regulators. For example, the ARTIO stated in its submission:
“We believe that the adversarial manner of hearings may be an inefficient use of the
Tribunal’s power to create meaningful reform to address core issues concerning
remuneration and remuneration related conditions.”336
The ALC argued that a potentially more efficient model to deal with the core issue of the failure of
small operators to fully account for their costs when negotiating rates would be to adopt some of
the elements of existing Victorian legislation requiring the provision of information to independent
contractors so they can make better informed business decisions without the undue interference of
an arbitral body.
Prescriptive versus risk management approaches to safety 7.3.5
In addition to the matters addressed above, stakeholders were asked to identify any other matters
which this Review should consider. One notable aspect of the identified overlap between the 2014
Order and other existing legislation is that very different regulatory approaches have been adopted
in certain areas. Thus, stakeholders including the ALC and Ai Group have highlighted the fact that the
prescriptive nature of the 2014 Order stands in stark contrast to the performance-based and
process-based approaches adopted in particular in the WHS laws and the HVNL, via their adoption of
risk-management based approaches to safety and the adoption of the ‘as low as reasonably
practical’ principle. For example, the Ai Group stated:
“The HVNL operates in a far more flexible and instructive way than the first RSRO. For
example, many provisions of the HVNL are expressed to require parties to take ‘reasonable
steps’ to achieve certain outcomes or to prohibit certain conduct if a party would ‘know, or
ought reasonably to know’ it would have a particular effect. The legislation provides
guidance as to what factors may be taken into consideration in deciding whether such
obligations have been complied with. As such, the HVNL ensures a level of practicality in the
336 Submission of the Australian Road Transport Industrial Organisation, p.7.
136
legislation’s operation. The Tribunal’s first RSRO generally adopts a far less sophisticated
approach to regulating safety.”337
While the NFF said:
“The imposition of the Road Safety Remuneration Orders as a measure to address safety is
contrary to the Robens principles which have long underpinned the approach to the
regulation of Occupational Health & Safety (OH&S) throughout Australia and many other
developed nations.”338
Preferred approaches to addressing road safety concerns in the road transport 7.3.6industry
There were many and varied responses from stakeholders with regard to their preferred approach
to addressing road safety concerns in the road transport industry.
The TWU, as a strong supporter of the RSRS, stated that “…the key to solving the industry’s safety
crisis is to look vertically up transport supply chains and focus on the role, power and influence of
industry clients.” During a teleconference, the TWU pointed to the NSW IRC Chapter 6 system as
demonstrating that it is feasible to set remuneration rates on a sector by sector basis and argued
that, if done well, this approach provides a stable sector which is beneficial for all. They highlighted
stability within industry sectors as a key benefit, stating that this stability gave companies and owner
drivers the confidence to enter into long-term investments, supported by long-term contracts. The
TWU also argued that the Tribunal as it currently operates has a unique opportunity to span the
different areas of regulation impacting on the road transport industry, including modern awards,
work health and safety and road transport regulation, stating that:
“Any attempts to expand other regulators to address road-safety related matters have so far
been rejected, making the Road Safety Remuneration Act 20012 and Road Safety
Remuneration Tribunal the only mechanisms capable of implementing the suite of
measures—identified as necessary—to address the root causes of the safety crisis in the road
transport industry.”339
Other stakeholders argued that the preferred approach was to effectively enforce the current
requirements of the HVNL and other relevant legislation in relation to key safety determinants
including speed, fatigue management, wearing of seatbelts, zero tolerance of drugs and alcohol,
driving to road conditions and developing further codes of practice; with the NHVR, enforcement
agencies and those administering WHS legislation being responsible for addressing road safety
concerns within their particular remits. Additionally, focusing on building better infrastructure, road
improvements and investing in safer vehicles were measures that were considered likely to be more
effective in improving safety performance than regulating remuneration.
337 Submission of the Ai Group, p.54 and 55.
338 Submission of the National Farmers’ Federation, p.13.
339 Submission of the Transport Workers’ Union, p.8.

137
The ACCI state that addressing road safety requires a whole of Government approach and
engagement and support from relevant stakeholders. Their view is that the focus should be on
achieving compliance with existing laws and instruments which directly address safety and on the
performance of road transport operations. This must involve greater efforts to promote education
and strong enforcement of existing laws, particularly the FW Act, the HVNL and WHS laws.
The ALC position is that the NHVR should, through its experience gained in regulating the heavy
vehicle sector and its own research, continue to identify ways to improve road safety and, to the
extent there is any need for remedial legislation to assist any perceived information asymmetry
affecting the capacity of owner drivers to make informed business decisions, consideration could be
given to inserting into law provisions requiring the publication of an information booklet along the
lines of that contained in Part 2 of the Owner Drivers and Forestry Contractors Act 2005 (Vic).
A number of stakeholders also argued that the Tribunal should focus solely on establishing minimum
rates of remuneration, rather than taking on the broader issues of workplace health and safety.
More generally, any proposed regulatory intervention should focus on gaps in the coverage or
application of current regulation, rather than risking extensive duplication.
7.4 Conclusions
The above discussion clearly indicates that a large proportion of stakeholders who made submissions
to the Review believe that there is substantial overlap and actual or potential inconsistency between
the RSR Act and a range of existing Commonwealth, state and territory regulation, including WHS
legislation, the HVNL and state-based owner driver schemes. The numerous specific examples
provided, covering a very wide range of matters, demonstrate the existence of this substantial
overlap. However, the practical extent of the problems—including uncertainty, additional regulatory
costs and complexity—that would arise over time due to the implementation of the RSR Act
necessarily remains uncertain, given the limited extent to which the powers provided by it have
been exercised to date.
The substantial regulatory overlap identified by stakeholders appears to be a significant factor in the
high level of opposition to the legislation and the low level of explicit support for it expressed in
submissions, with many stakeholders apparently being of the view that there is little need for the
additional level of regulation established under the RSRS, given the existing regulatory mechanisms
to address the relevant safety issues. In particular, there is a strong view that both the HVNL and
WHS legislation recognise the responsibility of employers and hirers for safety outcomes and include
tools that enable unsafe practices of the kind that are the focus of the RSRS to be addressed. The
CoR provisions that prohibit the inclusion of conditions in contracts that may cause or provide
incentive for drivers to speed or breach their work and rest hour requirements are of particular
importance in this regard.
The broad scope of the WHS legislation also suggests that there is much scope for it to be used to
address systemic issues of the kind that have underlain the development of the RSRS. While WHS
regulators have deliberately stayed clear of making industry-specific interventions to date, the

138
inclusion of the owner driver sector as one of the target areas for the current Australian Work
Health and Safety Strategy 2012-2022340 suggests a recent change in this regard and implies the
likelihood of significant interventions in the industry under the authority of the WHS legislation in
the medium term.
These areas of overlap and duplication are of significant concern to a wide range of stakeholders,
including industry and state governments, who have expressed fears of the potential for increased
costs, complexity and uncertainty to result. These concerns in relation to complexity and compliance
costs are in part a reflection of the prescriptive nature of the RSRS as it is currently evolving. Thus,
for example, while clause 204 of the HVNL establishes a duty for employers, prime contractors and
operators to ensure that their business practices will not cause the driver to speed and provides
examples of ‘reasonable steps’ of the kind that are required to be taken in this regard, the 2014
Order requires a Safe Driving Plan to be undertaken for each journey that includes, inter alia "...a
travel plan detailing the anticipated timeframes and distances for each leg or stage involved in the
provision of the road transport service, including but not limited to, when meal breaks, rest breaks,
crib breaks and any other breaks are to be taken."
Similarly, where section 11.1 of the 2014 Order establishes a specific requirement that "An employer
or hirer must take all reasonable measures to ensure a road transport driver employed or engaged by
them is trained in work health and safety systems and procedures relevant to the road transport
service to be provided by the road transport driver", the HVNL effectively creates a presumption in
favour of the provision of training by including this as a matter to be considered in determining
whether a hirer or other party has taken ’reasonable steps’ to acquit duties or obligations under that
Act, but does not establish specific training requirements.
This prescriptive approach places the RSRS at odds with both the HVNL and WHS legislation, which
are process and performance based, as was the antecedent legislation in this area. The WHS
legislation has taken this form since the mid-1980s in most states, with the international origins of
this approach being found in the introduction of the Health and Safety at Work Act 1974 in the
United Kingdom in response to the findings of the seminal Robens Report. Similarly, the move away
from prescriptive regulation has been a fundamental element of the longer-term change in
legislative approach in relation to heavy vehicle safety per se, implemented by the NTC and state
regulators over an extended period and now carried forward via the adoption of the HVNL in 2012.
Thus, the prescriptive approach adopted in the 2014 Order appears to stand in contrast to the
progressive abandonment of such approaches by safety regulators in the field as a matter of
conscious policy.
Moreover, the movement away from prescriptive regulation is consistent with international trends
in the regulation of the road freight industry. Thus, the OECD noted in the OECD Report (2011)341
that performance-based regulation has become well established as the preferred approach to
regulation in the heavy vehicle sector. Under the performance-based approach, standards specify
the performance required from vehicle operations rather than mandating how that level of
340 Safe Work Australia (2012), op cit
341 OECD (2011), op cit
139
performance is to be achieved. This move toward the use of performance-based regulation is also
identified by the OECD as a broader trend, observable in many areas of regulation.
The concerns raised by stakeholders in relation to regulatory overlap creating potential uncertainty
have a variety of dimensions. These include the potential for compliance with an RSRO to not
necessarily guarantee compliance with other overlapping legislation; that the RSR Act may
undermine other legislation such as the HVNL, the WHS laws or state legislation, particularly with
regard to stated purposes such as reducing red tape; confusion created by inconsistencies between
the definitions used in the RSRS and overlapping legislation such as the definition of supply chain
parties under HVNL CoR provisions; and uncertainty with regard to the ‘default’ jurisdiction for
dispute resolution when the RSRO overlaps with existing state-based owner driver schemes.
A fundamental point in relation to regulatory overlap is that the 2014 Order largely deals with non-
remuneration safety matters. Stakeholders argue that these matters are already within the scope of
existing transport and safety-related regulation and improvements in road safety should be pursued
through those existing mechanisms and by those regulators.
Moreover, to the extent that future RSROs establish mandatory remuneration levels for employee
drivers, those provisions will inevitably overlap with the Modern Award system, as the RSR Act
acknowledges. The need for such overlap can clearly be questioned, given that the award system
appears to be capable of dealing with such matters (actually and potentially) in relation to employee
drivers. The remuneration for owner drivers is similarly already addressed in legislation in three
states, which collectively account for more than two-thirds of the Australian population albeit that
mandatory rates are only set in one of these.
Finally, a fundamental concern of stakeholders in respect of regulatory duplication and overlap
relates to the appropriateness of the Tribunal, which is in essence an ‘industrial’ tribunal, acting, in
effect, as a regulator of safety matters in the road transport industry in a context in which specialist
authorities such as the NHVR and Safe Work Australia are already established for this purpose.
In order to address these concerns, stakeholders have called for action by the Australian
Government ranging from abolishing the Tribunal to significantly reducing the scope of the RSR Act
and limiting the Tribunal’s powers. Others, notably the TWU, have cautioned against such actions
and instead suggest taking a ‘wait and see’ approach to determine to what extent the operation of
the Tribunal has improved safety in the road transport industry.
140
8 Potential impacts of rate setting via RSROs
Key Points
While the Tribunal did not set any rates in its first RSRO, it has indicated its intention to do so in a subsequent Order and has taken steps toward this outcome. Mandatory rate-setting would have potentially significant, but very difficult to predict, impacts.
Available data indicate that average earnings among employee drivers are not low. This implies that the main impact of future mandatory rate setting may be on owner drivers. While data is limited, it appears likely that many owner drivers experience low levels of remuneration. This implies that future RSROs could significantly increase rates for this group.
However, the wide range of published rates, including NSW contract determinations, Victorian and Western Australian guideline rates and the TWU's rates as proposed to the Tribunal, indicates that there is great uncertainty as to what would be the outcome of future mandatory rate setting by the Tribunal.
The impact of such increases on aggregate incomes for this group is also unclear. Higher base rates may lead to significant entry to the market, while it would also be likely to lead to demand switching toward employee driver services. Both of these factors will tend to offset the impact of rate rises in increasing aggregate owner driver remuneration.
Assessment of the current relative position of Australia's heavy vehicle industry in terms of safety performance provides indicative benchmarks as to the extent of achievable safety improvements. The fact that safety performance is the outcome of a range of regulatory and other policy initiatives (e.g. road building), as well as vehicle standards improvements, highlights further the limited impact that rate setting can realistically be expected to have.
In this context, the large safety impacts predicted by a very few individual studies have limited plausibility in practice. Conversely, the small impacts predicted by other studies suggest that the benefits of mandatory rate-setting would be unlikely to offset the economic and regulatory costs highlighted above.
8.1 Financial and economic impacts
The basic policy rationale for the RSR Act is that increases in driver incomes are required in order to
remove current economic incentives for unsafe performance. As labour costs represent a significant
element of the total cost structure in the road freight industry, these increases will necessarily have
a range of broader economic impacts.
Predicting the size and incidence of these impacts is necessarily subject to considerable uncertainty:
the Tribunal has, as yet, given little indication of the manner in which it will exercise its rates setting
powers under the legislation while, as preceding sections have demonstrated, there is limited data
regarding current income levels in the owner driver sector in particular. Given this, the purpose of
the following discussion is to highlight in general terms the expected implications of rate setting by
the Tribunal via a future RSRO.
The above discussion noted evidence that average truck driver incomes are relatively high in
Australia by comparison with the United States and United Kingdom and in relation to average
weekly earnings. This high average income is likely to reflect in particular the comprehensive award
coverage of employee drivers and the existence of numbers of enterprise agreements providing for
141
above award payment rates.342 By contrast, while data is limited, it appears that average owner
driver incomes are considerably lower: a view that is also reflected in both the owner driver focus of
state legislation in relation to driver remuneration and in the general focus on this group in
discussions on remuneration issues. Thus, it can be anticipated that the major impact of rate-setting
activity by the Tribunal would be felt in the owner driver sector.
Section 5 above included a calculation updating ACIL-Tasman's 2003 estimate of average owner
driver incomes to current dollar terms and compared this with the relevant award wage for an
articulated truck driver, based on the average 51 hour working week reported in the ABS data. It
shows that owner drivers would need to receive an increase in average earnings, net of operating
costs, of around 70 per cent in order for their net remuneration to be equal to that of an employee
driver being paid the award rate for an equivalent working week. Using ACIL-Tasman's data, this
implies an increase in gross income of around 21 per cent.343
Thus, if the Tribunal were to adopt a concept of ‘safe rates’ that implied owner drivers should
receive rates that would enable them to earn average incomes similar to award wages, an increase
in rates paid in the owner driver sector of around 20 per cent might be expected to result. However,
given the paucity of available data on owner driver remuneration, it must be stressed that this
represents an indicative calculation only.
Other estimates 8.1.1
As noted above, there is much uncertainty as to the approach that would be taken by the Tribunal in
practice in setting minimum rates, with no indication having been given to date as to the Tribunal's
preferred approach.
The extent of this uncertainty can be illustrated by comparison of the various rates schedules
published to date. As discussed in Section 6.3 of this report, the guideline rates published pursuant
to the Victorian and Western Australian legislation differ in many areas, while the minimum rates set
in NSW are different again. Moreover, the Tribunal has already received a number of proposed
RSROs from stakeholders in response to its recent request, with some, such as that submitted by the
TWU, containing detailed proposed rates schedules. It is clearly possible that the Tribunal could set
rates at any point within the range spanned by these various rates schedules.
To illustrate the range of potential outcomes, the impact on owner driver incomes of adopting rates
consistent with the Victorian and Western Australian guideline rate schedules has been modelled
below. Table 8.1 below is based on two comparable rates drawn from these rate schedules: the
Western Australia prime mover + trailer (42.5 tonnne) regional rate of $120/hr and the Victorian
semi-trailer (6 axle) rate of $71.31/hr.344
342 As summarised on the Tribunal's website.
343 See ACIL-Tasman (2003), op cit, Table 10, p 13. A 70.8% increase in average operating profit before tax
would require a 20.9% increase in total operating income for the cohort of non-employing enterprises. 344
These rates have been used for comparative purposes as the articulated vehicle sector undertakes the majority of the freight task, measured in terms of tonne-kilometres. However the degree of variation in comparable rates between the two guideline rate schedules varies significantly.

142
Table 8.1: Comparison of gross income using Victorian and Western Australian Guideline Rates
Measure Victoria Western Australia
Hourly rate $71.31 $119.64 (regional)
Hours per week 51 51
Weekly revenue $3,638.81 $6,101.64
Annual revenue $174,662.88 $292,878.72
Notes: 1. Rates relate to six-axle semi-trailer. 2. Annual revenue based on 48 week working year.
Table 8.2 below compares the overall impact on average owner driver incomes of the adoption of
different rates outcomes. The base revenue figure is equal to the average revenue for non-
employing enterprises reported by ACIL-Tasman, converted to current dollar terms. The ‘base case’
figure reflects the above calculation based on the ACIL-Tasman data to estimate the increase in
income required to generate net revenue equal to an award wage. As per Table 8.1, all revenue
estimates are based on a 51 hour working week, which was the average owner driver working week
reported by ACIL-Tasman.
Table 8.2: Potential revenues (annual) and increases over estimated current revenue
Measure Revenue Increase on current Per cent increase
Current revenue $105,302 Not applicable Not applicable
Base case $127,395 $22,093 21 per cent
Victorian guideline rates
$174,663 $69,361 65.9 per cent
WA guideline rates $292,879 $187,577 178.0 per cent
Table 8.2 demonstrates the wide range of outcomes that could, at least theoretically, arise from a
mandatory rate set by the Tribunal, as well as the potential for very substantial changes in current
prices and freight prices. That said, the specific estimated revenue increases associated with the
adoption of the rates contained in the Victorian and Western Australian models would clearly
constitute over-estimates, in that they implicitly assume that the average hours worked are all paid
hours, while it is widely argued that owner drivers effectively work many unpaid hours. Moreover,
the requirement of section 20(1)d of the RSR Act for the Tribunal to have regard to "the likely impact
of any order on the national economy and on the movement of freight across the nation" might also
be seen as rendering it unlikely that mandatory rates would be set at the levels suggested above.
Specific rate impacts
It is notable that not only do comparable rates vary significantly across the various rate schedules
discussed above, but the pattern of rates also differs widely. For example, the Victorian guideline
rates make no distinction between metropolitan and regional rates, while both the Western
Australian guideline rates and the rates contained in the TWU's proposed RSRO do include separate
regional rates. This highlights the extent of the differences in approach to the determination of
appropriate rates in different circumstances.

143
As suggested above, the guideline rates currently in place in Victoria and Western Australia imply
that the relevant industry councils have reached quite different conclusions in many cases as to what
constitutes a reasonable rate. This appears in large part to reflect some basic differences in the
assumptions used in calculating these rates. For example, a key methodological difference between
the Victorian and Western Australian approaches is that the former is based on the cost of operating
a 10 year old truck, while the latter is based on the cost of a new truck.345
In sum, the above discussion highlights the extent of the uncertainty that inevitably exists as to the
impact on owner driver incomes of mandatory rate setting by the Tribunal via a future RSRO.
Nonetheless, it suggests that relatively large increases in owner driver remuneration are likely to
result. Importantly, it was noted above that mandatory rate setting is likely to have a larger impact
on the owner driver sector than on employee drivers. This raises the question of the likely impact of
such changes on the structure of the road freight industry.
8.1.1.1 Substitution effects
The owner driver sector and larger fleets using employee drivers are likely to be relatively close
substitutes throughout much of the road freight industry. Thus, should the practical impact of rate
setting under a future RSRO be to significantly increase the relative price of services provided by
owner drivers, a market response involving a shift in demand away from this sector can be
anticipated. The size of such a shift is difficult to estimate, since consultation with a range of
stakeholders highlights the fact that a number of factors other than price are relevant to the
decision as to whether to use in-house fleets, large independent operators or owner drivers or some
combination.
Nevertheless, the shift in relative prices would suggest a shift in employment in the industry away
from owner drivers and toward employee drivers. The Productivity Commission346 has estimated the
price elasticity of demand for road freight to be 0.431. That is, a 10 per cent increase in the price of
road freight was found to lead to a reduction in demand of 4.3 per cent. However, this estimate
assesses the demand response to a given price increase across the road freight sector. The likely
increase in the relative price of owner drivers constitutes a price increase within the sector, and
could be expected to yield a larger demand response, since other road freight services (i.e. those
provided by employee drivers) represent a closer substitute.
Net impact on owner driver incomes 8.1.2
The expectation of a significant substitution away from the use of owner drivers as a result of their
becoming relatively more expensive due to mandatory rate setting means that the impact of rate
345 A second schedule of rates based on a 5 year old truck is also published in Western Australia, however, this
is not the rate used in the comparison schedule prepared by the Tribunal. Note that the ‘base case’ estimates provided above are also implicitly based on the costs of operating a 10 year old truck, since the expenses component used is based on actual survey evidence and 11.5 years is the approximate average age of the fleet of articulated vehicles. See ABS Motor Vehicle Census, 2013 (Cat.9309.0). The average age of the articulated vehicle fleet in 2009 was 11.5 years. The average age of heavy rigid vehicles was 15.6 years, while the average age of light rigid trucks was 10.4 years. 346
Productivity Commission (2006), Road and Rail Freight Infrastructure Pricing: Productivity Commission Inquiry Report No.41,. 22 December 2006. See p.F16.
144
setting on their aggregate incomes is uncertain. Higher rates would be expected to encourage entry
to the sector in the short term, increasing supply to a potentially significant extent. However,
demand will simultaneously be reduced, as it is switched toward relatively cheaper employee-driver
based services. Thus, larger numbers of owner drivers will compete for a reduced amount of work at
fixed minimum rates.
These dynamics are clearly important to the extent that rate-setting is undertaken in pursuit of
equity objectives—i.e. the goal is to increase owner driver incomes—as they suggest that the impact
of rate setting on the aggregate incomes of this group will be much smaller in percentage terms than
the increase in rates arising from rate-setting via a future RSRO.347 However, from a ‘safe rates’
perspective, the above dynamic does imply a reduction in the extent of any economic pressures to
drive in an unsafe manner (i.e. for excessive hours or at excessive speeds), even if the impact of rate
setting on total incomes is limited.
Impact on employee drivers 8.1.3
The above discussion has focused on the impact on owner drivers of the Tribunal setting a
mandatory rate via an RSRO, as it appears likely that the impact of such rate setting is likely to be
largely felt in this sector. A major reason is that concerns regarding low income levels among heavy
vehicle operators have largely been expressed in relation to owner drivers, rather than employee
drivers.348 This reflects the fact that the award system provides a legal minimum wage structure for
employee drivers, whereas owner drivers, because they are considered to be independent
contractors, and hence small businesses, do not benefit from similar protections.
Nonetheless, the Tribunal has powers to make rates orders affecting employee drivers, with the RSR
Act specifically indicating that such provisions of a RSRO would override the terms of awards and
enterprise agreements to the extent that they were less favourable to drivers. Moreover, the TWU
has argued that the ‘safe rates’ issue extends beyond the owner driver sector to include employee
drivers, highlighting the issue of unpaid time as affecting the latter group.
Thus, it is clearly possible that the issue of RSRO setting minimum rates will also have the effect of
increasing employee driver incomes. Moreover, should the Tribunal make determinations that
employee driver incomes must rise from current levels to achieve a safe rates outcome, this
presumably implies that the extent of increases in the owner driver sector may also be higher than
at least the above ‘base case’ calculation suggests.349
However, there is no current basis for assessing the size of any impact on employee driver incomes.
While the Tribunal has sought applications for a draft RSRO including remuneration rates from
stakeholders, the focus of those received and published to date is clearly on the owner driver sector.
347 Note that it is possible for the combination of increased supply and reduced demand for owner driver
services could lead to a position in which aggregate revenue per driver would actually be reduced, at least in the short term. However, in the medium term, this could be expected to lead to exit from the sector. 348
See, for example: industrial Relations Victoria (2005), Report of Inquiry: Owner Drivers and Forestry Contractors. Volume 1 – Report and Recommendations, p 10. Victorian Government, February 2005. 349
Given that this was based on an implicit equalisation of owner driver incomes with current award rates.

145
For example, the TWU application350 contains detailed rates schedules for owner drivers, but no
proposed rates in respect of employees.
That said, the data presented above indicating that average truck driver incomes are approximately
equal to average earnings suggest that it is unlikely that future RSROs would adopt substantial
increases in employee driver income in pursuit of a ‘safe rates' objective.
8.2 Equity effects
The above analysis has focused closely on the safety impacts of the RSRS. However, the object of the
RSR Act is to ’promote safety and fairness’ in the road transport industry. Hence, any analysis of the
impacts of rate setting via RSROs should include consideration of the potential equity benefits of
institutionally driven wage determination.
Australia's industrial relations system has historically focused on provision of a ’living wage’ or
‘safety net’ for all workers. Moreover, an issue that has received significant attention in recent years
is the position of nominally independent contractors who, because they work largely or wholly for a
single hirer, often have very limited bargaining power and can be seen as being ‘quasi-employees’.
For example, the recent inquiry into the Victorian taxi industry considered at length the question of
whether taxi drivers should be deemed legislatively to be employees.351 Similarly, the Victorian
Government's 2005 inquiry into the road freight industry highlighted the low level of independence
of many owner drivers. According to the report, over 50 per cent of owner drivers are ’dependent
contractors’, defined as operators who obtain more than half of their income from a single source.352
In this context of what might be characterised as ‘quasi-employee’ relationships, the equity benefits
that would flow from the adoption of the safe rates proposal should arguably be weighed.
Conversely, owner drivers' self-image as small businesspersons—including their expressed desire to
avoid being ‘deemed’ to be employees, as documented by Quinlan and Wright353—must be noted.
Government regulation in support of business incomes enjoys significantly less support than the
‘living wage’ concept. To the extent that this is so, the weight to be given to equity benefits must be
reduced. The Victorian Government's 2005 inquiry notes that the regulation of commercial activities
must be undertaken with care, as it has the potential to raise the costs of business transactions and
interfere with the operation of efficient markets. It also notes that the role of fair trading laws
generally is to maintain and/or promote the operation of healthy and competitive markets, rather
than seeking to protect operators from the “harsh effects of competition.”354 However, the
initiatives contained in the resulting legislation did focus strongly on equity issues.
Thus, the Second Reading Speech in respect of the Victorian Owner Drivers and Forestry Contractors
Bill 2005 suggests that the Bill is at least equally concerned with improving equity outcomes for this
group as it is in improving safety outcomes. The Minister stated:
350 http://www.rsrt.gov.au/default/assets/File/CurrentRSROapps/F2_RTO2013_1.pdf (accessed 7 April 2014)
351 See: www.taxiindustryinquiry.vic.gov.au
352 Industrial Relations Victoria (2005), op. cit, Vol. 2, p.37.
353 Quinlan & Wright (2008), op cit
354 Industrial Relations Victoria (2005), op cit, Vol 1, p.101.

146
"The purpose of this bill is to provide some basic protections and a framework for effective
resolution of disputes to improve the position of vulnerable small businesses, namely, owner-
drivers in the transport industry..."
"...the low and declining level of earnings of this group are not only unjust and well below an
acceptable community standard, but are simply not sustainable, and have serious
ramifications for the safety of the drivers themselves and for other road users."355
Consistent with this approach, the RIS in respect of the regulations adopted under the RSR Act
focused primarily on equity issues and discussed potential road safety gains as a secondary source of
benefits.356
Data issues 8.2.1
It is widely asserted that owner drivers have experienced sustained, low remuneration levels over an
extended period and that this reflects, in large part, the structure of the road transport industry,
which is said to be characterised by long contracting chains with those at the end of these chains
having very limited ability to influence the terms and conditions on which they work. However,
Section 5 of this report shows that, while there is some evidence for the contention of sustained,
low remuneration levels for owner drivers, it is limited in extent and in some cases significantly
dated. Moreover, the only market analysis of the industry included in submissions to this Review—
prepared by Deloitte for Coles Supermarkets Australia—emphasises the wide range of sectors from
which the demand for road freight services are derived and, by implication, suggests that it is
unlikely that there are substantial imbalances due to accretions of market power on the demand
side.
8.3 Safety impacts
The costs of heavy vehicle-related accidents are clearly substantial and indicate that any policy
capable of achieving a significant reduction in these costs will yield substantial benefits in terms of
both deaths and injuries averted and property damage avoided. Perhaps surprisingly, the Review has
found no comprehensive estimates of the costs of heavy vehicle related accidents in Australia. Thus,
Appendix 2 reports estimates of these derived using recent accident data, past research by
Australian road safety authorities and standard regulatory impact assessment methodologies.
In sum, there were 246 heavy vehicle related fatalities in 2012, while a plausible estimate of the
number of heavy vehicle related serious injuries is around 1,230 (see Appendix 2). The total cost of
these heavy vehicle related accidents is estimated at approximately $3.2 billion per annum. These
estimates highlight the scale of the benefits that can be derived from effective measures to improve
heavy vehicle safety: they suggest that, for each 1 per cent reduction in heavy vehicle-related
accidents, benefits of $32 million will be attained.
355 Hon. Rob Hulls MP, Minister for Industrial Relations. Legislative Assembly, 21 April 2005.
356 Industrial Relations Victoria (2006), Regulatory Impact Statement: Owner Drivers and Forestry Contractors
Regulations 2006.
147
Benchmarking potential safety gains 8.3.1
8.3.1.1 International comparisons
This section estimates the benefits of improving Australia's heavy vehicle safety performance to a
level equivalent to that found at present in the best performing countries. The purpose of this
analysis is to provide an indicative assessment of the potential for further improvements in safety
performance, given Australia's current relative position. That is, it is clearly extremely difficult for
individual policy actions (or even combinations of such actions) to drive major changes in a country's
relative safety performance over the medium term - as demonstrated by the degree of stability in
countries' relative positions over time (see Chapter 4). Given this perspective, an assessment of the
difference between Australia's current safety performance and that of the best performing countries
can be seen as providing a practical upper bound for the combined impact of policy actions that may
be taken to improve heavy vehicle safety performance - of which the ‘safe rates’ proposal is one - in
the medium term.
As noted above, improved road safety results from the interaction of a wide range of factors
including improved vehicle safety and improved road quality as well as improvements in regulatory
design, implementation and enforcement, with many of these measures being synergistic. This
necessarily suggests that regulatory improvements, in total, are likely to be minority contributors to
overall safety improvements.357 The benefits of adopting the ‘safe rates’ proposal necessarily
constitute a sub-set of these available regulatory benefits.
8.3.1.1.1 Fatalities per vehicle kilometre
Table 8.3, below, reproduces the most recent OECD-sourced data on fatal truck crashes per 100
million vehicle kilometres travelled as discussed in Chapter 4 of this Report. The data for 2005, the
last year for which data are presented from all the comparator countries, shows Australia's fatality
rate to be the third lowest among the eight countries compared, with only the United States and
Switzerland having lower rates. The data for 2007, the last for which data are available, shows that
Australia's fatality rate of 1.43 is slightly lower than that of Belgium, slightly higher than that of the
United Kingdom and significantly higher than that of the United States and Switzerland.
357 As noted below, previous NRTC research suggests that road quality improvements constitute the most
promising approach to improving heavy vehicle safety in Australia.
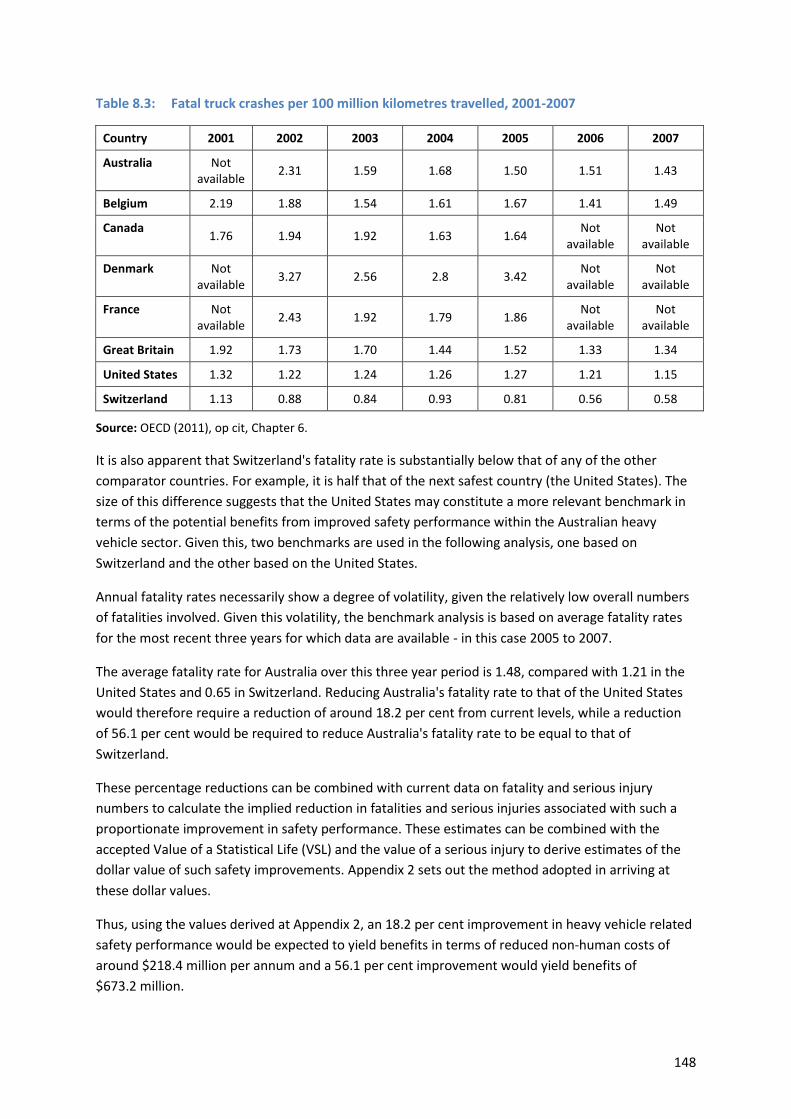
148
Table 8.3: Fatal truck crashes per 100 million kilometres travelled, 2001-2007
Country 2001 2002 2003 2004 2005 2006 2007
Australia Not available
2.31 1.59 1.68 1.50 1.51 1.43
Belgium 2.19 1.88 1.54 1.61 1.67 1.41 1.49
Canada 1.76 1.94 1.92 1.63 1.64
Not available
Not available
Denmark Not available
3.27 2.56 2.8 3.42 Not
available Not
available
France Not available
2.43 1.92 1.79 1.86 Not
available Not
available
Great Britain 1.92 1.73 1.70 1.44 1.52 1.33 1.34
United States 1.32 1.22 1.24 1.26 1.27 1.21 1.15
Switzerland 1.13 0.88 0.84 0.93 0.81 0.56 0.58
Source: OECD (2011), op cit, Chapter 6.
It is also apparent that Switzerland's fatality rate is substantially below that of any of the other
comparator countries. For example, it is half that of the next safest country (the United States). The
size of this difference suggests that the United States may constitute a more relevant benchmark in
terms of the potential benefits from improved safety performance within the Australian heavy
vehicle sector. Given this, two benchmarks are used in the following analysis, one based on
Switzerland and the other based on the United States.
Annual fatality rates necessarily show a degree of volatility, given the relatively low overall numbers
of fatalities involved. Given this volatility, the benchmark analysis is based on average fatality rates
for the most recent three years for which data are available - in this case 2005 to 2007.
The average fatality rate for Australia over this three year period is 1.48, compared with 1.21 in the
United States and 0.65 in Switzerland. Reducing Australia's fatality rate to that of the United States
would therefore require a reduction of around 18.2 per cent from current levels, while a reduction
of 56.1 per cent would be required to reduce Australia's fatality rate to be equal to that of
Switzerland.
These percentage reductions can be combined with current data on fatality and serious injury
numbers to calculate the implied reduction in fatalities and serious injuries associated with such a
proportionate improvement in safety performance. These estimates can be combined with the
accepted Value of a Statistical Life (VSL) and the value of a serious injury to derive estimates of the
dollar value of such safety improvements. Appendix 2 sets out the method adopted in arriving at
these dollar values.
Thus, using the values derived at Appendix 2, an 18.2 per cent improvement in heavy vehicle related
safety performance would be expected to yield benefits in terms of reduced non-human costs of
around $218.4 million per annum and a 56.1 per cent improvement would yield benefits of
$673.2 million.
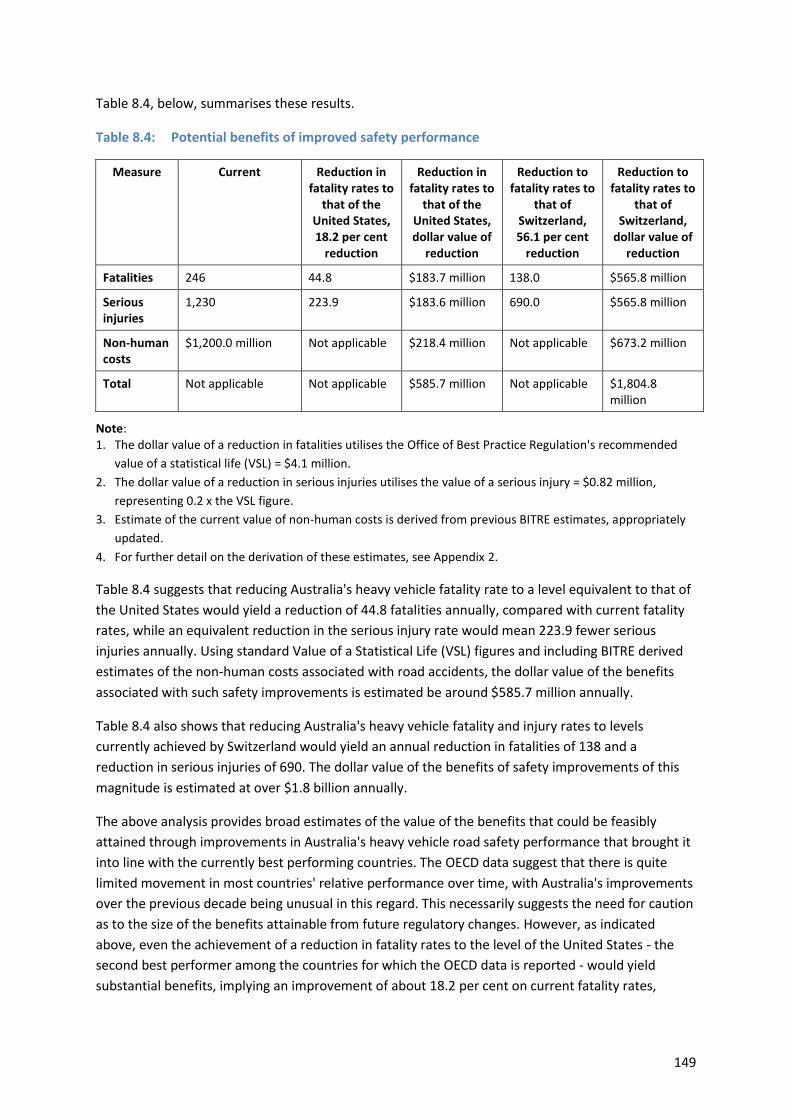
149
Table 8.4, below, summarises these results.
Table 8.4: Potential benefits of improved safety performance
Measure Current Reduction in fatality rates to
that of the United States, 18.2 per cent
reduction
Reduction in fatality rates to
that of the United States, dollar value of
reduction
Reduction to fatality rates to
that of Switzerland, 56.1 per cent
reduction
Reduction to fatality rates to
that of Switzerland,
dollar value of reduction
Fatalities 246 44.8 $183.7 million 138.0 $565.8 million
Serious injuries
1,230 223.9 $183.6 million 690.0 $565.8 million
Non-human costs
$1,200.0 million Not applicable $218.4 million Not applicable $673.2 million
Total Not applicable Not applicable $585.7 million Not applicable $1,804.8 million
Note: 1. The dollar value of a reduction in fatalities utilises the Office of Best Practice Regulation's recommended
value of a statistical life (VSL) = $4.1 million.
2. The dollar value of a reduction in serious injuries utilises the value of a serious injury = $0.82 million,
representing 0.2 x the VSL figure.
3. Estimate of the current value of non-human costs is derived from previous BITRE estimates, appropriately
updated.
4. For further detail on the derivation of these estimates, see Appendix 2.
Table 8.4 suggests that reducing Australia's heavy vehicle fatality rate to a level equivalent to that of
the United States would yield a reduction of 44.8 fatalities annually, compared with current fatality
rates, while an equivalent reduction in the serious injury rate would mean 223.9 fewer serious
injuries annually. Using standard Value of a Statistical Life (VSL) figures and including BITRE derived
estimates of the non-human costs associated with road accidents, the dollar value of the benefits
associated with such safety improvements is estimated be around $585.7 million annually.
Table 8.4 also shows that reducing Australia's heavy vehicle fatality and injury rates to levels
currently achieved by Switzerland would yield an annual reduction in fatalities of 138 and a
reduction in serious injuries of 690. The dollar value of the benefits of safety improvements of this
magnitude is estimated at over $1.8 billion annually.
The above analysis provides broad estimates of the value of the benefits that could be feasibly
attained through improvements in Australia's heavy vehicle road safety performance that brought it
into line with the currently best performing countries. The OECD data suggest that there is quite
limited movement in most countries' relative performance over time, with Australia's improvements
over the previous decade being unusual in this regard. This necessarily suggests the need for caution
as to the size of the benefits attainable from future regulatory changes. However, as indicated
above, even the achievement of a reduction in fatality rates to the level of the United States - the
second best performer among the countries for which the OECD data is reported - would yield
substantial benefits, implying an improvement of about 18.2 per cent on current fatality rates,

150
saving around 45 lives and 224 serious injuries per year and generating benefits with a total dollar
value of around $0.6 billion per annum.
Achieving such gains in overall heavy vehicle safety performance would require action to be taken
across the full range of relevant policy areas. The key question from the point of view of the current
Review is that of the extent to which the adoption of the ‘safe rates’ proposal would have the
potential to contribute to the achievement of such an outcome.
Potential benefits due to adoption of the safe rates proposal 8.3.2
As discussed above, the literature supporting links between remuneration and safety performance
demonstrates limitations in terms of the small number of published papers, the range of different
remuneration-related variables tested and the widely varying conclusions reached. A particular
impediment to attempts to model the likely safety impacts of changes to driver remuneration is that
only a small number of published studies include functions estimating the impact of driver
remuneration on safety performance. Moreover, these studies yield significantly differing
conclusions, as discussed below. These widely differing conclusions make the estimation of likely
benefits from setting mandatory rates virtually impossible. To illustrate this point, the following
discusses the implications of applying the functions suggested by the relevant papers. Comparison of
the conclusions obtained with the above discussion of the feasible range of improvements in safety
performance due to all policy action provides a ‘reality check’ on the applicability of these specific
research findings to macro-level data.
The key studies providing quantitative estimates of functions linking driver remuneration and
accident risk are those of Nafukho et al,358 Rodriguez et al359 and Belzer et al.360 The implications of
their conclusions for estimation of the potential benefits of mandatory rate setting via a future RSRO
are discussed in turn.
8.3.2.1 Nafukho et al361
Nafukho et al found that the six remuneration-related variables included in his statistical analysis
collectively accounted for a total of 3.2 per cent of the observed variation in accident rates. This
implies that, even were the Tribunal able to identify an ‘optimum’ set of rates, the implementation
of which completely removed remuneration as an explanatory variable in safety performance, safety
performance improvements of more than 3.2 per cent would be unlikely to result.
The above calculations (see Section 8.3 and Appendix 2) found that the annual benefits of each 1 per
cent improvement in safety performance would be equal to $32 million. This implies that the upper
bound level of potential gains from adopting the safe rates proposal, calculated using Nafukho et al's
coefficient is:
3.2 x ($32 million) = $102.4 million.
358 Nafukho et al (2007), op cit
359 Rodriguez et al (2006), op cit
360 Belzer et al (2002), op cit
361 Nafukho et al (2007), op cit
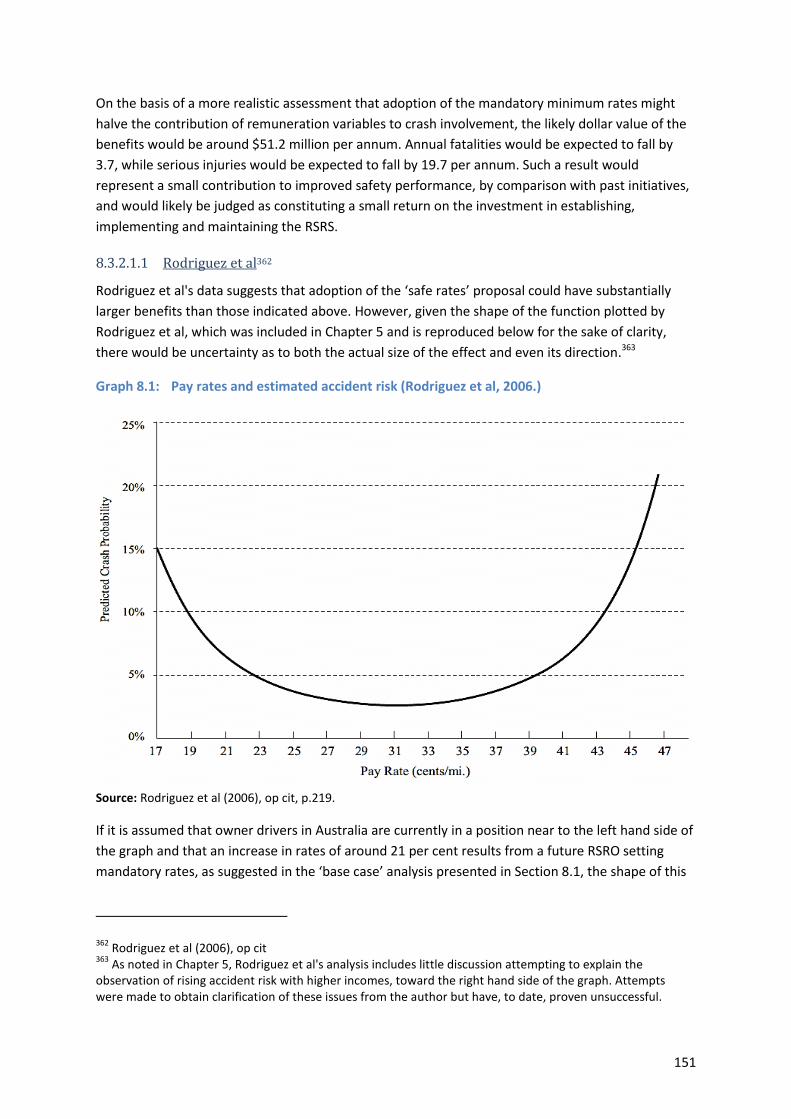
151
On the basis of a more realistic assessment that adoption of the mandatory minimum rates might
halve the contribution of remuneration variables to crash involvement, the likely dollar value of the
benefits would be around $51.2 million per annum. Annual fatalities would be expected to fall by
3.7, while serious injuries would be expected to fall by 19.7 per annum. Such a result would
represent a small contribution to improved safety performance, by comparison with past initiatives,
and would likely be judged as constituting a small return on the investment in establishing,
implementing and maintaining the RSRS.
8.3.2.1.1 Rodriguez et al362
Rodriguez et al's data suggests that adoption of the ‘safe rates’ proposal could have substantially
larger benefits than those indicated above. However, given the shape of the function plotted by
Rodriguez et al, which was included in Chapter 5 and is reproduced below for the sake of clarity,
there would be uncertainty as to both the actual size of the effect and even its direction.363
Graph 8.1: Pay rates and estimated accident risk (Rodriguez et al, 2006.)
Source: Rodriguez et al (2006), op cit, p.219.
If it is assumed that owner drivers in Australia are currently in a position near to the left hand side of
the graph and that an increase in rates of around 21 per cent results from a future RSRO setting
mandatory rates, as suggested in the ‘base case’ analysis presented in Section 8.1, the shape of this
362 Rodriguez et al (2006), op cit
363 As noted in Chapter 5, Rodriguez et al's analysis includes little discussion attempting to explain the
observation of rising accident risk with higher incomes, toward the right hand side of the graph. Attempts were made to obtain clarification of these issues from the author but have, to date, proven unsuccessful.
152
curve suggests that predicted crash probability for this group could be reduced by around 50 per
cent.364
However, there is necessarily uncertainty as to the specific ‘safe rates’ that would be determined by
the Tribunal, as indicated by the above comparison between the Victorian and Western Australian
guideline rates, the NSW Contract Carrier determination and the rates proposed in the TWU's
submission on a future RSRO (see Section 8.1.1). As set out in Table 8.2 above, were the Tribunal to
adopt rates equivalent to those set out in the Victorian guideline rates, an average remuneration
increase of approximately 66 per cent could result, while adoption of those included in the Western
Australian guideline rates could increase remuneration by almost 180 per cent. Measuring increases
of these magnitudes against the above graph suggests quite different outcomes. Thus, if
remuneration were to increase by 66 per cent from a starting point equivalent to the 17c/mile
point365 on the above graph to 28.22c/mile, predicted accident involvement would be reduced by
approximately 80 per cent. However, an increase of 180 per cent from the same starting point to
47.6c/mile would suggest an outcome in which accident involvement would increase by around 33
per cent.
Substituting different assumed starting points on Rodriguez et al's function yields different results
again, further highlighting the degree of uncertainty involved. For example, if the starting point for
owner driver remuneration is equivalent to the 23c/mile point on the graph, rather than 17c/mile,
the impact on accident involvement probability of a 66 per cent increase in remuneration would be
near zero, in contrast to the 80 per cent reduction found if the starting point were 17c/mile.
In sum, the U-shaped curve described by Rodriguez et al, when combined with the high degree of
uncertainty as to the outcome of attempts at mandatory rate-setting, necessarily implies that the
resulting safety impacts would be very difficult to estimate.
However, a further significant issue becomes apparent when the estimates of the size of the impact
of rate setting are considered. The above discussion highlights the fact that the potential impact of
mandatory rates setting is likely to be greatest in the owner driver sector, reflecting the evidence of
their sustained low remuneration levels, on the one hand, and the above evidence suggesting that
employee drivers are relatively well remunerated overall, on the other.366 While the expected
benefits in terms of improved safety performance would seem likely to derive largely from the
owner driver sector, since this is where remuneration changes are likely to be greatest, the research
that has measured the safety performance of this sector relative to that of the employee driver
sector has not shown that owner drivers have higher accident involvement rates. Indeed, as
discussed in Section 5.2.5, Cantor et al367 found owner drivers to have a 22 per cent lower rate of
364 That is, an increase from the equivalent of 17c/mile to 20.6c/mile would reduce predicted crash probability
from 15% to around 7.5%. 365
Note that there is no direct comparison to be made in terms of the actual payment rates reported by Rodriguez et aland those currently applying in Australia, given differences in time and place. References to points on the Rodriguez et al curve simply refer generically to the shape of the function plotted by the authors. 366
i.e. the average wage comparisons reproduced above from the Deloitte market analysis and the discussion of rates contained in various enterprise agreements summarised on the Tribunal's website. 367
Cantor et al (2013), op cit
153
accident involvement than employee drivers, a result which was found to be statistically significant.
The authors also highlighted similar results reported by Dammen368 and, in particular, the findings of
Williamson et al 369 in the Australian context, which were that owner-operators drove more miles
while reporting one-sixth the level of accidents of employee drivers.
That owner drivers appear to have both lower average remuneration and lower (or, at a minimum,
no higher) accident involvement than employee drivers complicates the estimation of the net impact
of mandatory rate setting.
8.3.2.1.2 Belzer et al370
While the Rodriguez et al371 paper uses one of the same datasets as the Belzer et al paper, Belzer et
al do not graph a specific function linking safety performance and remuneration levels, as does
Rodriguez et al. Rather, Belzer et al reports the estimated impact of a 10 per cent increase in
remuneration rates as applied to each of the three datasets he considers. The results are reductions
in accident numbers of 9.2 per cent, 21 per cent and 34 per cent. Faced with these quite wide
differentials, the authors conclude that:
"It is difficult to come up with a single summary estimate of the effect of driver pay, as
elasticities vary across datasets and model specifications, but conservatively we can say that
the relationship between safety and pay probably is better than 2:1."372
Applying this fairly speculative figure in the context of an estimated 20 per cent increase in
remuneration suggests that accident reductions of the order of 40 per cent could be expected to
result. This is similar to the estimated effects derived from Rodriguez et al373 function above.
However, attempts to estimate the impact of larger increases in remuneration are problematic. If
the relationship between the variables were assumed to be linear in nature, the absurdist result of a
complete elimination of road accidents would be reached at the point of a 50 per cent increase in
remuneration (i.e. a remuneration level broadly consistent with the adoption of the Victorian
recommended rates). Implicitly, the safety benefits of further remuneration increases must decline
progressively. However, the observation that one dataset found a 34 per cent reduction in crash
incidence resulting from a 10 per cent change in remuneration suggests that this would occur at a
point at which very high proportionate increases in accident numbers had been achieved.
Consideration of the Belzer et al’s conclusions in the context of both time-series and cross-section
comparisons of heavy vehicle safety performance suggests that questions exists as to the plausibility
of the results.
368 Dammen, S.J., (2005), ’The effects of safety practices, technology adoption, and firm characteristics on
motor carrier safety’. Journal of the Transportation Research Forum, 44 (1), pp.103–120. 369
Williamson et al (2009), op cit 370
Belzer et al (2002), op cit 371
Rodriguez et al (2006), op cit 372
Belzer et al (2002), op cit 373
Rodriguez et al (2006), op cit
154
8.3.2.2 Summary
The conclusions of the three key studies estimating relationships between driver remuneration and
safety performance suggest very different outcomes from mandatory rate setting via a future RSRO.
In terms of ‘first round’ effect, the results of Nafukho et al374 suggest that a modest change in safety
performance would be obtained. The results of Belzer et al375 suggest implausibly large safety gains,
while the results of Rodriguez et al376 suggest that similarly large gains would be obtained unless
mandatory minimum rates were set at too high a level - in which case deterioration in safety
performance could result.
Importantly, to the extent that mandatory rate setting raises the relative price of owner driver
provided services (i.e. because they address a lower current remuneration level), a level of
substitution toward the use of employee drivers would be expected. As discussed above, some
studies within the (limited) literature comparing the safety performance of the two groups find that
owner drivers have lower accident involvement rates, while no research has been identified that
suggests the contrary conclusion. This suggests the possibility that, by reducing the market share of
owner drivers, mandatory rate setting could also have an offsetting negative impact on safety
performance. Given the size of the differences in accident involvement rates between the two
sectors reported by some authors, the size of this offsetting impact could potentially be significant.
Moreover, the observation of lower average incomes co-existing with equal or better safety
performance suggests that other incentives operating on owner drivers may mean that the size of
any linkage between remuneration and safety performance is smaller among this group than the
average for the industry as a whole. Were this the case, the positive direct impacts on safety
performance of future RSRO setting rates to improve the incomes of this sector may be significantly
smaller than some of the above research would suggest, while, as noted above, the possibility of
significant offsetting effects - i.e. reductions in safety performance due to substitution in favour of
employee drivers - appears very real. These probable dynamics add a further dimension of
uncertainty to the estimation of the potential safety impacts of mandatory rate setting via future
RSRO.
Impact of current legislated initiatives in respect of freight rates 8.3.3
The estimates of very large safety gains due to increased remuneration reported in the Belzer et al377
and Rodriguez et al378 papers discussed above, should also be considered in light of the fact that a
mandatory rate-setting regime has been in place in NSW for several decades. As previously noted,
the Review is unaware of any reviews completed to date of the effectiveness of the legislation
addressing driver remuneration in NSW. This is also the case in relation to the Victorian and Western
Australian legislation addressing remuneration for the owner driver sector, albeit that a review has
recently been commenced in the latter jurisdiction. In this context, the Review has analysed the
available data on heavy vehicle-related fatalities for these three states, to determine whether there
374 Nafukho et al (2007), op cit
375 Belzer et al (2002), op cit
376 Rodriguez et al (2006), op cit
377 Belzer et al (2002), op cit
378 Rodriguez et al (2006), op cit

155
are any observable trends in the data that could be attributed to the impact of these legislative
arrangements. Graph 8.2 shows the proportion of Australia's total number of articulated truck
related fatalities occurring in each of these three states over the period 1990 to 2012.
Graph 8.2: Proportion of articulated truck related fatalities occurring in relevant states, 1990-2012
Source: BITRE, Australian Road Deaths Database
Notwithstanding the year to year volatility evident in the data, review of the data suggests that the
proportionate contribution of each state to total fatalities has been broadly constant over the
period. This is perhaps unsurprising in the case of NSW, since the relevant legislative provisions have
been in place throughout the period graphed. However, it is notable that there is no apparent
impact of the legislation adopted in Victoria or Western Australia. That said, the relatively recent
adoption of these legislative regimes, combined with the volatility evident in the data generally,
could explain the lack of any immediately apparent impact.
A further comparison is made in Graph 8.3. This compares the NSW fatality rate (i.e. fatalities per
100 million vehicle kilometres) for accidents involving articulated trucks with that of Australia as a
whole, with both raw data and trend estimates included in the graph.

156
Graph 8.3: Comparative fatality rates for accidents involving articulated trucks - NSW vs Aust, 1998-2012
Source: BITRE, Australian Road Deaths Database
Graph 8.3 shows that, despite the longstanding operations of the NSW IRC in setting mandatory
rates in the road freight industry in that state, fatality rates in NSW remain substantially higher than
those observed in Australia as a whole. Moreover the trend lines suggest that the rate of
improvement in fatality rates is broadly similar, so that there has been little convergence over the 15
year period graphed. Again, this comparison yields little evidence of the effectiveness of the
mandatory rate-setting model adopted in NSW in improving road safety performance in that state.
Contributors to improved safety performance 8.3.4
As noted above, road safety improvements achieved over time have resulted from a wide range of
actors, including improvements to vehicle quality, roads and a range of regulatory design,
implementation and enforcement factors. The relative importance of these factors is likely to differ
depending on the contexts, reflecting different environments and the mix of interventions that have
previously been adopted. The Review has not identified any recent assessments of the performance
of Australia in heavy vehicle safety relative to international comparisons which address the question
of what are the key policy ‘gaps’ needing to be addressed to enable further improvement. However,
in response to previous international heavy vehicle safety comparisons published by the OECD, the
then NRTC commissioned a truck safety international benchmarking study, which concluded as
follows:
"The study concludes that the higher fatality rates on Australian roads compared to Great
Britain and the United States may be largely explained by the lower proportion of truck travel
on divided and limited access roads in Australia, and possibly truck speed limits....” 379
379 Haworth, N., Vulcan, P. & Sweatman, P. (2002), op cit

157
The study further concluded that:
“Based on simple assumptions, it can be shown that if Australian roads were upgraded to
having similar proportions of divided and limited access roads, as in the United States or
Great Britain, the Australian truck fatality rate could be expected to be similar to that in
these countries and well below the rates in Canada and Germany."380
That is, the authors conclude that the major intervention required to improve Australian heavy
vehicle safety to international best practice levels is greater investment in road building, rather than
regulatory reform. While this conclusion is more than a decade old, there seems to be little reason
to believe that it is no longer applicable, particularly given the authors' emphasis on the fact that
such road upgrades would necessarily require a long-term investment program to bring to fruition.
This conclusion also provides important context in relation to the potential contribution of
remuneration related issues to heavy vehicle related accidents and, by implication, the effectiveness
of mandatory rates setting in improving safety performance.
Fault in heavy vehicle related accidents 8.3.5
Finally, another factor that tends to call into question the potential gains from mandatory rate
setting is the data that indicates that a relatively small proportion of heavy vehicle accidents - at
least those involving other vehicles - are the fault of the heavy vehicle driver. While recent official
data have not been found, research from the 1990s published by the Federal Office of Road Safety
(FORS)381 concludes in relation to multiple vehicle accidents:
"...research has shown that for most of these fatalities and serious injuries, the truck driver is
not at fault. Car drivers were primarily responsible for five out of six crashes involving an
articulated truck and two out of three crashes involving a rigid truck.382
In relation to the overall picture of accidents involving articulated trucks (i.e. including single vehicle
accidents and those involving pedestrians), FORS found:
20 per cent of fatalities were single vehicle accidents, with the driver at fault in the great
majority of cases;
70 per cent of fatalities were multiple vehicle accidents, with the driver of the truck at fault
in 16 per cent of cases; and
10 per cent of fatalities were pedestrian crashes, with the truck driver responsible in 27 per
cent of cases.
Aggregating the above, and assuming the truck driver to be responsible for all single vehicle
accidents, suggests that the truck driver is primarily at fault in relation to 33.9 per cent, or around
380 ibid
381 Federal Office of Road Safety (1997), Trucks and Road Trauma. Monograph No. 18.
http://www.infrastructure.gov.au/roads/safety/publications/1997/pdf/Truck_Crash_2.pdf (accessed 7 April 2014) 382
OECD (2002) Safety on Roads: What's the Vision?, p 82. Data cited are from Federal Office of Road Safety Monograph No. 18, 1997 (data relate to 1995).

158
one third, of heavy vehicle related fatalities. Clearly, the major impact of any regulatory initiative
targeted at heavy vehicles will be on this subset of accidents.
ACIL-Tasman383 found a similar picture. Using 2000 data from the Australian Truck Crash Database,
they estimated that in 82 per cent of multiple vehicle crashes involving heavy vehicles, the driver of
the heavy vehicle was not at fault.384 Similarly, the NTI/NTARC data discussed in Chapter 4 concludes
that truck drivers are only at fault in a small proportion of multiple-vehicle accidents (0 per cent in
2011 and 18 per cent in 2009).
These findings point to inherent limitations in the potential for regulatory actions focusing on the
heavy vehicle industry to affect its safety performance. That is, strategies aiming to improve truck
drivers' on-road behaviour are likely to have relatively little impact in relation to accidents that are
not the fault of the truck driver.
Conceptual discussion 8.3.6
The above discussion of the relative safety performance of the Australian heavy vehicle sector in
international terms provides benchmarks that indicate the broad scale of achievable improvements
due to regulatory and other intervention. That is, the safety performance of the best performing
countries identified provides a reasonable guide to the maximum extent of the improvement to
Australian safety performance that could be expected in the medium term due to government policy
action.
However, it is important to note that the sustained improvement in road safety performance
observed internationally over several decades has been the result of the combined impact of a wide
range of policy interventions. Safety-related regulation has clearly been a major contributor. Such
regulation embraces a wide range of initiatives including the mandating of the incorporation of
various safety devices in vehicles and more stringent regulation and greater enforcement in areas
such as speeding, drink-driving and driving hours. Other major contributors include improvements in
road quality and technological improvements that have led to vehicle safety advances other than
those specified in regulation.
Given this, it is unlikely that improvements in safety regulation alone can bridge the gap between
current Australian road safety performance and that of the best-performing countries. Moreover,
the current regulatory context is one in which a number of recent initiatives are yet to be fully
implemented. Full implementation of these initiatives is expected to further improve Australia's
current heavy vehicle safety performance. Given that a number of these initiatives address the same
issues as the RSRS, the potential for additional benefits to be obtained via RSRS is evidently
diminished to the extent these prior initiatives prove to be effective in practice.
The literature review conducted above provides some support for the proposition that improving
truck driver remuneration would lead to improved safety performance. However, studies of this
relationship are relatively small in number, suggesting that caution is required in drawing
383 ACIL-Tasman (2003), op cit
384 Conversely, the driver of the heavy vehicle was at fault in around 80% of single vehicle crashes. Three
quarters of crashes involving heavy vehicles were found to be multiple vehicle crashes.
159
conclusions as to the likely impact of regulating payment rates. Moreover, such studies as do exist
yield differing conclusions, while the suggested size of the impacts in some cases lack plausibility,
when measured against the aggregate impact of past safety measures and the relative position of
Australia in terms of international safety performance comparisons. Given this, there is uncertainty
as to the likely size of the possible impact of mandating rates.
An additional factor to be weighed in this regard is the current Australian policy environment. The
research finding correlations between remuneration and safety is based on United States data that is
in most cases a decade or more old. An important contextual difference is that Australian regulators
have implemented a wide range of policies that aim to address fatigue and speeding in the heavy
vehicle industry in recent years. To the extent that these policies are successful - essentially in
reducing the likelihood that drivers will be able to speed or drive excessive hours without detection,
the potential benefits of policies that reduce incentives to engage in these behaviours are inevitably
reduced. As discussed above, some data from both NTC and NTI suggest that there have been
significant changes in performance in these areas in recent years.
In addition, to the Review's knowledge, NSW appears to constitute the one jurisdiction currently
implementing mandatory rates-setting. The fact that heavy vehicle safety performance is not
observably better than the national average, despite the long-standing implementation of these
rates-setting arrangements, inevitably calls the potential effectiveness of future rate-setting activity
by the Tribunal into question.
Finally, data reported above indicate that the average income levels of truck drivers in Australia are
higher in relative terms than in either the United States or the United Kingdom. More importantly,
truck driver wages in Australia are approximately equal to domestic average weekly earnings (see
Section 5.2.3). This suggests that, to the extent that low rates are yielding unsafe outcomes, the
dynamic may affect a minority of drivers. While available data suggest that owner drivers are most
likely to experience low income levels, research specifically focussing on this sector suggests that
their safety performance compares very favourably with that of employee drivers as a group.
160
9 Conclusions
9.1 Regulatory and economic burden
The Terms of Reference require the Review to assess the regulatory and economic burden of the
RSRS on industry participants and the economy and to examine whether other Commonwealth,
state and territory regulations and initiatives provide a more appropriate means of improving safety
outcomes.
The Review was commenced less than 18 months after the commencement of the RSR Act. Given
this, and the fact that the Tribunal's first RSRO is not due to take effect until 1 May 2014, the
conduct of the Review has largely preceded any substantive implementation of the RSR Act. This
necessarily implies that the impact of the RSR Act to date has been very limited. While stakeholders
have clearly expended significant resources on engaging with the Tribunal in its work to date of
developing annual work programs and the first RSRO, the fact that the 2014 Order has not yet taken
effect necessarily means that the RSRS has not yet directly imposed any substantive regulatory or
economic burden. It follows, therefore, that no measurable impacts on road safety performance can
be identified as a result of the operations of the Tribunal to date.
Given this context, the Review has instead focused on attempting to assess the likely future impact
of the RSRS in terms of the imposition of regulatory and economic burdens on the industry and the
economy more generally. While it has not been possible to quantify these expected future burdens
in any meaningful sense, the Review concludes that they are substantial in size. At a fundamental
level, this reflects the potential for the Tribunal to exercise its powers to undertake minimum price-
setting and give rise to significant economic distortions if mandatory minimum rates are set at
inappropriate levels. The difficulties involved in setting rates at or near socially optimal levels in a
large and multi-faceted industry are necessarily substantial, as numerous stakeholder submissions
have underlined. The removal of previous price regulation regimes in this industry in numerous
OECD countries arguably reflects recognition of this problem, as well as the general move away from
the use of price regulation in market economies in recent decades. Thus, the potential regulatory
and economic burden resulting from the continuation of the RSRS is significant.
A second source of regulatory burden arises to the extent that the operation of the RSRS gives rise to
significant regulatory overlap, duplication and uncertainty. Numerous stakeholders highlighted
substantial concerns in this regard, particularly given the broad scope of the Tribunal's 2014 Order,
which addresses numerous safety related issues that are also addressed by a range of other existing
legislation and regulators.
In assessing whether this regulatory overlap suggests that other regulations and initiatives provide
more appropriate means of improving safety in the industry, it is necessary to consider whether
other existing regulation and initiatives have been effective in addressing heavy vehicle safety
and/or whether they are likely to demonstrate such effectiveness in the future. That is, the question
of whether regulatory overlap and duplication are necessary in order for appropriate safety
outcomes to be attained must be considered.
161
In order to answer this question, the current and historical safety performance of the industry must
be properly understood and the potential for the RSRS to yield further safety improvement must be
assessed.
9.2 Safety performance of the road freight sector
The available data show that significant improvement in road safety performance has been achieved
in the heavy vehicle sector in Australia in the 23 years since the establishment of the then NRTC by
the Commonwealth, state and territory governments. The available data from the ABS, BITRE and
other sources indicates that the extent of the improvement in the overall safety performance of the
Australian heavy vehicle sector over this period has been very similar, in proportionate terms, to
that recorded by the road transport fleet generally. As noted previously, taking account of the
increase in distances travelled over the period, the 2012 fatality rate for all road vehicles was 30.0
per cent of its 1988 level, while the rate for articulated trucks was 24.0 per cent of its 1988 level.
The available international data suggest that the safety record of the Australian heavy vehicle
industry is also relatively good, although it may not be among the leading countries. Australia's
relative safety performance improved noticeably relative to other comparable countries during the
first half of the last decade. However, data limitations mean that it is not possible to draw clear
conclusions as to more recent performance.
The observed improvements in the safety performance of the industry have occurred in a context of
substantial regulatory reform, much of it driven by the NRTC/NTC. Key areas of reform have included
the adoption of the CoR concept, the establishment of a more sophisticated sanctions and
enforcement regime, better management of fatigue and speed issues and the adoption of
performance-based regulation, which has facilitated changes to the trucking fleet in favour of
heavier vehicles, which have been shown to have superior safety performance in the aggregate.
Available evidence suggests that these regulatory reforms have been important contributors to the
observed improvements in safety performance, albeit that, in common with other areas of road
safety, improvements in both road and vehicle quality will also have been factors.
This improvement in safety performance provides the basic context for consideration of the RSRS
model. Some submissions to this Review, as well as views advanced in the lead up to the
establishment of the RSRS, argued for the adoption of the system as a crisis response and an
initiative made necessary by the alleged failure of other regulatory initiatives to improve safety
performance.
Despite the major improvements in heavy vehicle safety performance that have occurred, the sector
continues to account for a significant proportion of road fatalities and, as such, must remain the
subject of concerted policy action to continue to improve its performance. Again, however, policy
must be based on a clear understanding of the relevant data. While heavy vehicle-related fatality
rates are more than twice those of the road transport fleet as a whole, data indicates that this is not
due to higher accident rates in the heavy vehicle sector but, rather, to the lesser survivability of
accidents between heavy vehicles and other road users. Indeed, Australian data on total fatality and
162
injury accident rates indicate that these are significantly lower for heavy vehicles than for all
vehicles—a conclusion that is consistent with those of the OECD on this issue.385 Moreover, data also
indicates that a majority of multiple vehicle accidents involving heavy vehicles occur due to the fault
of a light vehicle driver.
In sum, the available data strongly suggest that the program of regulatory reform pursued in the
heavy vehicle sector since the establishment of the NRTC has been effective in addressing key heavy
vehicle safety issues. In addition, it is clear that substantial regulatory reform is continuing and that
the impacts of key recent initiatives, such as the adoption of the HVNL, as well as initiatives currently
in train such as the reform to CoR laws and moves to enable or require the more widespread use of
telematics and other technological advances, have yet to be felt.
9.3 Potential of the RSRS to yield further safety gains
The regulatory and policy reforms adopted in Australia since the early 1990s are largely consistent
with those pursued in other OECD countries for which data is available. This reflects the existence of
a strong network of heavy vehicle safety regulators and policy specialists and effective dissemination
of information on new policy initiatives and a consequently relatively high level of consensus as to
key regulatory and policy priorities. Key initiatives identified by the OECD386 include mechanisms to
manage fatigue and address inappropriate speed, truck design factors (such as enabling the use of
heavier vehicles, under-run protection and axle steering on semi-trailers), infrastructure factors
(such as road improvements and separation of heavy vehicles from other traffic) and improved
driver training and licensing. Identified priority areas for future policy initiatives include a range of
driver support and communication measures, including lane departure warning, adaptive cruise
control, electronic stability control, forward collision warning, driver fatigue detection systems,
automatic crash notification and vehicle condition monitoring systems.387
However, in contrast to this generally high level of similarity in the direction of policy and regulation,
the Review has been unable to identify any other country that has either adopted regulatory
initiatives based on the ‘safe rates’ concept or is currently considering adopting such initiatives.388
NSW is the only jurisdiction identified which currently implements similar regulatory arrangements;
however, no evidence has been found to suggest that heavy vehicle safety performance in that state
is superior to the national average. Neither has any discussion of the merits of initiatives such as the
RSRS been identified in official documents published by the OECD or other relevant international
organisations. Similarly, little evidence of the consideration of this issue by authorities responsible
for heavy vehicle safety was identified. A notable exception is the United States FMCSA, which
indicated in 2007 that it was unconvinced by the evidence from research on what it described as the
385 OECD (2011), op cit, p.177
386 ibid
387 ibid
388 The 2013 OECD/ITF Annual Report notes the establishment of the Tribunal, without referring to any similar initiatives in Member countries. Questions to OECD subject experts yielded the response that they were unaware of any similar initiatives, while web searches also failed to identify relevant initiatives.
163
‘purported’ link between remuneration and heavy vehicle safety, while also cautioning that it was
not possible to understand the precise nature of any relationship between the two factors.389
While some researchers have taken the view that important links between remuneration and safety
exist, several reviews of the available research have concluded that the evidence for causal
relationships is limited and/or unclear. Importantly, the available research literature addresses
several different relationships, involving both driver remuneration and firm financial performance
and both actual safety performance and indirect risk indicators. Thus, only a minority of the research
literature specifically addresses the link between driver remuneration and safety performance
per se.
Consistent with these views, this Review's assessment of the current state of the research literature
is that evidence for a link between driver remuneration and safety performance remains relatively
weak, while the specific nature of any link also remains unclear. This does not suggest that the
potential existence of a link is, or should be, dismissed. However, there is clearly a need for further
high-quality research to clarify this issue. This view has been emphasised by a number of
stakeholders, some of which argued that the Tribunal should include such research in its work
program.
Given the lack of either direct evidence from other countries of the effectiveness of legislation
setting minimum rates or a strong body of research demonstrating clear and substantial links
between remuneration and safety, there must be significant doubt as to the potential for regulation
along the lines of the RSRS to yield substantial safety benefits in any context. However, the
likelihood of the RSRS leading to the achievement of such benefits in Australia at present is further
reduced by the observation that remuneration rates do not appear, on the whole, to be particularly
low. ABS data shows that truck driver earnings are approximately equal to the national average, and
that this relativity is more favourable than that observed in either the United States or the United
Kingdom, while details of several enterprise agreements published by the Tribunal also demonstrate
the existence of over-award payments. This does not suggest that some drivers are not experiencing
low levels of remuneration. Indeed, some limited evidence suggests that many owner drivers may be
in this position. However, it does suggest that there is not an industry-wide issue of low
remuneration.
A further issue is that of the likely impact of mandatory rate-setting on actual remuneration levels.
While the broad discretion accorded to the Tribunal implies that a range of outcomes are possible,
current data does not indicate that the mandatory rate-setting arrangements in operation in NSW
have led to significantly higher average driver incomes in that state. Thus, uncertainty as to the size
of the impact of the Tribunal's operations on driver incomes adds further doubt as to the potential
safety impact of the RSRS.
In summary, even if the existence of a strong link between remuneration and safety performance
were accepted in general terms, minimum rate-setting may have a very limited impact in the current
Australian context.
389 Federal Motor Carrier Safety Administration (2007), op cit.
164
9.4 Owner drivers
While the scope of the RSRS embraces both employee drivers and owner drivers, it appears that a
large part of the rationale for, and focus of, the system relates to owner drivers. Employee drivers
have award coverage which sets minimum weekly remuneration, requires payment for major non-
driving duties (loading and unloading) and provides an avenue for addressing remuneration-related
concerns at an industry-wide level. Conversely, owner drivers must understand their own cost
structures and be able to negotiate rates that provide a sustainable return on both their labour and
capital: tasks that require significant business skills. The fact that the Victorian and Western
Australian legislation applies solely to owner drivers suggests that both governments have taken a
view that it is in this sector that concerns over remuneration levels lie.
Given the underlying logic of the RSRS, the apparently low remuneration levels of owner drivers
would suggest, a priori, that this group would be strongly over-represented in heavy vehicle
accidents. However, while this specific issue has been the subject of research, the results have
largely failed to demonstrate any such link, with the results either showing no significant differences
in accident involvement between employees and contractors (i.e. owner drivers) or, in some cases,
significantly lower accident involvement rates for contractors, despite their lower average
remuneration. Thus, to the extent that the issue of low remuneration is concentrated in the owner
driver sector in the Australian context, these research findings tend to cast further doubt on the
likelihood that mandatory rate setting would yield substantial safety gains.
In sum, there is a lack of research demonstrating a clear and strong link between driver
remuneration and safety performance and no evidence of the effectiveness of a model consistent
with the RSRS in improving safety in other jurisdictions. These factors, plus the evidence suggesting
that truck driver remuneration cannot, on the whole, be considered to be particularly low in
Australia, mean that there can be little confidence that the RSRS will yield significant safety benefits
in the future. The fact that Australia's heavy vehicle safety record currently compares favourably
with most comparable countries necessarily suggests that there is lesser likelihood of the RSRS, or
indeed other significant regulatory changes, yielding a ‘step change’ in safety performance.
9.5 Potential costs of the RSRS
Conversely, the potential costs of the RSRS appear to be high. Fundamentally, these involve the
economic distortions that may arise from the imposition of price regulation across a large, multi-
faceted industry. Setting minimum rates at too high a level would yield significant economic costs, a
factor which underlays the removal of price regulation from most industries in which it had existed
in recent decades, while one of the few research papers showing clear and significant links between
remuneration and safety even finds that safety performance declines significantly when
remuneration is set at too high a level (see Rodriguez et al (2006)). 390 These factors underline both
the difficulty involved in attempting to set mandatory rates and the potential for significant harm to
occur should rates be set at inappropriate levels.
390 Rodriguez et al (2006), op cit.

165
Comparison of the guideline rates established in Victoria and Western Australia highlights the extent
of this problem in practical terms, with some rates differing substantially between the two
jurisdictions. These differences highlight the difficulty of setting industry, or even sector-wide rates.
This issue was highlighted by a wide range of stakeholders, who identified specific difficulties
including the fact that very different payment mechanisms are used in different sectors and that cost
structures can differ significantly between sectors due to specific truck-related requirements and the
product being transported.
The Tribunal has itself commented on the difficulties involved in setting rates, in the Full Bench
Decision accompanying the 2014 Order.391 The fact that even the proposed requirement that "A
hirer must pay a contractor driver engaged by them a reasonable amount for work ", included in the
draft RSRO published in mid-2013, was subsequently removed as a result of objections received
from stakeholders points to the scale of the challenges faced by the Tribunal in this regard. The fact
that the 2014 Order, while entitled ‘Road Safety Remuneration Order’, contains no content related
to remuneration, other than a provision in relation to payment time and to deductions from
payments made, further underlines this point. The fact that the Tribunal has requested parties to
submit ‘proposed Orders’ which they seek to have made, rather than simply submissions on the
rates issue, may also point to the scale of the challenges involved, as may the widely varying
approaches proposed by stakeholders.
In addition, the possibility that perverse safety outcomes may arise from the operations of the
Tribunal should be weighed. These could arise as a result of the effect of the RSR Act in fragmenting
responsibility for non-remuneration related safety regulation and thereby reducing the cohesiveness
and, potentially, the effectiveness of the suite of safety regulation. The focus of the Tribunal's 2014
Order on matters other than remuneration per se highlights this potential concern, while the fact
that a core aspect of the 2014 Order—that of safe driving plans—lies within the broad scope of the
HVNL tends to underline it.
In summary, even were it to be considered that the evidence in favour of a link between
remuneration and safety is sufficient to justify the setting of mandatory minimum rates, it is
questionable whether such an intervention would yield benefits sufficient to justify the expected
costs. That is, making the case for regulation requires not only that the nature and extent of the
problem be clearly established but that it be shown that regulation will be able to address the
problem effectively, at proportionate cost and without creating other, unanticipated problems.
There appears to be substantial doubt as to whether this would be the outcome in practice of the
adoption of mandatory minimum rates as part of the future operation of the RSRS. It is notable that
even the RIS prepared in connection with the Road Safety Remuneration Bill concluded that the
legislation would not give rise to net benefits to society.392
391 See Full Bench Decision of 17 December 2013 making the Road Transport and Distribution and Long
Distance Operations Road Safety Remuneration Order 2014, [2013] RSRTFB 7, [428]. 392
PricewaterhouseCoopers (2011), op cit.
166
9.6 Alternative approaches
Three states, covering more than two-thirds of Australia's population, had adopted legislation
addressing the remuneration of heavy vehicle drives prior to the establishment of the RSRS.
However, while the NSW model is broadly similar in approach to the RSRS, Victoria and Western
Australia have adopted very different approaches.
Victoria and Western Australia have adopted significantly ‘lighter-handed’ regulation, which can also
be seen as more targeted in that it:
attempts to directly address certain perceived market failures, such as information
asymmetry, by relying on a combination of guideline rates, information provision, disclosure
requirements and prohibitions on unconscionable conduct; and
applies only to the owner driver sector, where concerns over low remuneration levels have
largely arisen.
The fact that neither legislative scheme has yet been reviewed means that it is not yet possible to
assess directly the effectiveness of this approach. However, it is notable that these approaches
apparently enjoy a significantly higher level of industry support than the RSRS. This was evident in
the comments of a number of stakeholders to the Review and is also suggested by the active
involvement of industry representatives on the bodies charged with aspects of the implementation
of these Acts.
Importantly, these lighter-handed regulatory options do not give rise to the high potential costs of
poor regulatory implementation that have been identified above in respect of the RSRS. Such an
approach could, therefore, be seen as more proportionate in relation to the current strength of the
evidence for a link between remuneration and safety performance. Moreover, principles of good
regulation suggest that more interventionist regulatory options should be adopted only if and when
it is determined that a lighter-handed approach has proven ineffective and is unlikely to be able to
be reformed successfully.
These factors suggest that the adoption of a lighter-handed regulatory model at the national level
could constitute a viable alternative to the RSRS as currently configured, were the Government of
the view that continued regulatory intervention is required in this area.

167
10 Recommendations
1. That the Road Safety Remuneration System should not continue in its current form.
The adoption of price regulation in the context of a competitive industry risks creating significant
economic distortions which can easily outweigh the benefits sought. The multi-faceted nature of the
road freight industry renders the task of price regulation particularly challenging and consequently
increases the extent of these risks. The strength of the evidence for the asserted link between driver
remuneration and safety is insufficient to support the use of such a highly interventionist regulatory
tool, which is rarely used in modern market economies. This conclusion is strengthened by the
evidence that the range of regulatory interventions adopted to date have been successful in
improving heavy vehicle safety, while the range of further reforms currently in train suggest that
further improvements in performance can be expected.
Moreover, the consultation undertaken as part of this Review reveals that there is very limited
support for the continuation of the RSRS in its current form and substantial concern regarding the
likely costs of the system in terms of regulatory overlap, duplication and complexity.
2. That, accordingly, the provisions of the RSR Act authorising the Tribunal to set mandatory
rates should be repealed.
Should the Government wish to retain a remuneration-related regulatory function, consideration
should be given to amending the RSR Act to establish a light-handed regulatory model, similar to
those in place in Victoria and Western Australia, which is based on some combination of guideline
rates, information provision, disclosure requirements and/or the provision of fora for dispute
resolution. Such an approach would be more targeted and proportionate in nature and likely to
yield significantly greater stakeholder support.
3. That, should the Government determine that mandatory price setting powers should be
retained, the scope of these powers should be narrowed to encompass only owner drivers.
The existence of the modern award system provides an appropriate means of addressing any
remuneration-related issues relating to employee drivers and appears to have sufficient scope to do
so in its current format. This includes the issues of payment for waiting, loading and unloading time
which have been most commonly raised in this context. The adoption of a mandatory RSRO in
relation to employee driver remuneration would therefore inevitably entail extensive overlap and
duplication between the RSRO provisions and those of the relevant awards, leading to complexity,
uncertainty and increased costs. Moreover, the key area of concern in respect of driver
remuneration appears to be that of owner drivers, who do not benefit from these protections.
Hence, if mandatory rate setting is to be retained, it should be targeted in this area of particular
concern.
4. That, should the RSR Act be retained, it should be amended to ensure that the scope of the
Tribunal's operations is limited to remuneration and to matters that are directly
remuneration-related.
The adoption of a broad interpretation of the current section 27 provisions of the RSR Act
authorising a RSRO to address ‘remuneration related’ matters has led the Tribunal to include

168
provisions in its first RSRO that overlap substantially in subject matter with other legislation, notably
the HVNL. As advocated by most stakeholders, there should be clear delineation of responsibilities in
these areas, with safety-related matters that are not clearly and directly remuneration-related being
addressed by experienced and specialised safety regulators.
5. That, should the RSR Act be retained, the Tribunal should enter into a formal
memorandum of understanding with the National Heavy Vehicle Regulator to ensure that
a shared understanding of the respective roles of these bodies is developed, co-operation
is encouraged where relevant and overlap and duplication are minimised.
Both the review of relevant legislation undertaken as part of this report and the clear views of a
majority of stakeholders consulted demonstrate the substantial potential for overlap and duplication
between the Tribunal and other institutions involved in heavy vehicle safety. To the extent that the
Tribunal's future role continues to give rise to actual or potential overlap and duplication, this should
be managed through the adoption of a formal protocol addressing these issues and promoting co-
operation and a shared understanding of the respective roles of the Tribunal and the NHVR as the
institution with primary responsibility for regulating the heavy vehicle sector.
6. That, should the Government decide to retain legislation addressing heavy vehicle driver
remuneration issues, it should consult with state and territory governments with a view to
enabling a single, national scheme to operate.
As indicated in submissions to the Review, there is significant overlap between the RSRS and
legislation dealing with remuneration currently in place in NSW, Victoria and Western Australia. Such
overlap would continue and, at least potentially, could increase in extent were the Australian
Government to move to adopt a lighter-handed regulatory approach as envisaged in
Recommendation 2, above.
Thus, should the Australian Government decide to retain regulatory provisions in this area, it should
explore the option of adopting a co-operative approach with the states and territories which could
result in a single, national system replacing the current state-based approaches. Such an approach
would be consistent with the high level of national harmonisation achieved over the past two
decades in respect of the regulation of heavy vehicle safety.
An important element of such an approach should be to ensure that a detailed review of the
operation and impacts of the existing state legislation in this area is undertaken to provide an
appropriate evidence base to support the development of any light-handed regulatory approach at
the Commonwealth level.
7. That, should a single national system addressing remuneration issues be agreed, as per
Recommendation 6, consideration should be given as to the most appropriate institutional
arrangements to implement the system.
The Tribunal has been established under the aegis of the Fair Work Commission to implement a
mandatory rates system. These institutional arrangements, which are formal and somewhat
adversarial in nature, may not be the most appropriate means by which to implement an alternative,
lighter-handed regulatory approach.

169
Therefore, consideration should be given to alternative options. In this context, the models currently
adopted under the relevant Victorian and Western Australian legislation may provide a useful
starting point. Moreover, given the broad responsibilities of the NHVR with regard to heavy vehicle
safety, it may be appropriate for that body to provide support services to any new decision-making
body.

170
11 Submissions received and consultations undertaken
11.1 Submissions received
A total of 26 submissions were received. Four submitters requested that the content of their
submissions remain confidential. Submissions were received from the following organisations:
Australian Business Industrial and New South Wales Business Chamber [Confidential]
Australian Chamber of Commerce and Industry
Australian Federation of Employers and Industry
Australian Industry Group
Australian Livestock and Rural Transporters Association
Australian Logistics Council
Australian National Retailers Association
Australian Risk Policy Institute
Australian Road Transport Industrial Organisation (Queensland Branch)
Australian Trucking Association (New South Wales)
Business SA [Confidential]
Coles Supermarkets Australia
Dr Jann Karp PhD (Social Policy, University of New South Wales)
Intercapital Trucking Pty Ltd, Victoria
Livestock and Rural Transport Association of Western Australia (Inc.)
Masters Builders Australia
National Farmers’ Federation
National Transport Commission [Confidential]
National Union of Workers
NatRoad [Confidential]
New South Wales Government - New South Wales Department of Industrial Relations
Northern territory Government - Northern Territory Department of Business, Northern
Territory WorkSafe
Professor Philip Laird PhD (Faculty of Engineering and Information Sciences, University of
Wollongong)
Transport Workers’ Union Australia
Victorian Government - Victorian Department of Treasury and Finance
Western Australian Government - Western Australian Department of Commerce
11.2 Consultations undertaken
The following organisations participated in direct consultations via teleconference as part of the
Review:
Australian Chamber of Commerce and Industry
Australian Industry Group
Australian Logistics Council
Australian Road Transport Industrial Organisation (Queensland Branch)
Coles Supermarkets Australia

171
Linfox
National Heavy Vehicle Regulator
NatRoad
Transport Workers’ Union Australia
172
Appendix 1: Terms of Reference for a Review of the Road Safety
Remuneration System
The Purpose of the Review
The purpose of the Review is to assess the operation of the Road Safety Remuneration Act 2012 and
the Road Safety Remuneration Tribunal (together - the Road Safety Remuneration System) and
advise Government on whether this system represents an effective and appropriate means of
addressing safety concerns in the road transport industry.
The scope of work
The Review will:
assess the regulatory and economic burden of the Road Safety Remuneration System on
participants in the road transport industry and the Australian economy generally;
examine whether other Commonwealth, state and territory regulations and initiatives
provide a more appropriate means of improving safety outcomes in the road transport
industry;
examine any available evidence about the impacts of the Road Safety Remuneration System
on improving road safety (e.g. accident data);
assess the operation and conduct of the tribunal and the extent to which it has achieved its
aim and objectives;
consult relevant stakeholders as necessary; and
make recommendations to Government, based on the evidence and assessment above.
Principles
The following principles will guide the Review:
Eliminate duplication of regulation.
Ensure that regulations and policies for improving safety performance in the road transport
industry are based on credible evidence.
Consultation
In developing recommendations, the Review will detail the level of consultation undertaken with
industry, government and other stakeholders and the outcomes of those consultations.
Outputs and reporting requirements
A report will be prepared for Government outlining any recommendations and their anticipated
regulatory impact, supporting data and implementation and compliance strategies.

173
Appendix 2: Estimates of the costs of heavy vehicle related accidents
In 2012 there were 148 fatalities involving articulated trucks and a further 98 fatalities involving
heavy rigid trucks Australia-wide, yielding a total of 246 heavy vehicle related fatalities.
Equivalent published data on the current number of heavy vehicle-related serious injuries do not
appear to be available. However, data published by the FORS in 1997 indicated that the serious
injury rate for articulated trucks was approximately 3.5 times the fatality rate, while the serious
injury rate for rigid trucks was almost 6.3 times that of the fatality rate.393 While fatality and injury
rates have fallen significantly since this time, it is probable that the ratio of fatalities to injuries in
respect of these two categories of accident would have remained similar. Consequently, a rough
average of these ratios has been used to estimate an average ratio of the number of serious injuries
to fatalities for the fleet as a whole. Given the fact that articulated trucks account for at least 60 per
cent of total fatalities, a ratio of 5.0 has been adopted in deriving the following estimates.
These potential gains from improved safety performance can be multiplied by generally accepted
figures for the Value of a Statistical Life (VSL) and the value of a serious injury in order to obtain
dollar estimates of the value of the benefits of such improvements in safety performance.
The Office of Best Practice Regulation's Best Practice Regulation Guidance Note on VSL argues that
an appropriate base case figure for VSL is $3.5 million, expressed in 2007 dollars.394 This is equivalent
to $4.1 million in 2013 dollars. This figure is based on research by Abelson,395 which involved a meta-
analysis of relevant research, using Willingness to Pay (WTP) methodologies.
The WTP approach is widely, though not universally, regarded as superior to alternative (typically
human capital based) approaches in calculating VSL figures. It can be noted, however, that these
alternative approaches generally yield significantly lower VSL figures. Figures within the range of
$1.5 - $2 million are reasonably typical results where human capital based approaches are adopted.
Given the preference of OBPR for the use of a WTP methodology for VSL purposes, a methodological
complication arises from the fact that most estimates of injury costs are based on less
comprehensive approaches (typically involving calculation of medical costs and productivity losses)
which, at least arguably, substantially understate true costs and are in any case not methodologically
consistent with the VSL approach required to be taken by OBPR.
However, some literature argues that serious injuries should be valued in terms that are consistent
with the VSL figure used, by adopting an estimate that represents a proportion of the VSL figure. A
review of sources indicates that accepted values are in the range of 0.20 to 0.23 times the estimated
393 Federal Office of Road Safety (1997), op cit. Based on 1995 data. For articulated trucks, fatalities/serious
injuries per 100m vehicle km were 3.91/13.64. For Rigid trucks, this was 3.20/20.12. 394
Office of Best Practice Regulation (2008), Best Practice Regulation Guidance Note: Value of Statistical Life, Australian Government Department of Finance and Deregulation, Nov 2008. http://www.dpmc.gov.au/deregulation/obpr/docs/ValuingStatisticalLife.pdf (accessed 7 April 2014) 395
Abelson, P. (2007), Establishing a Monetary Value for Lives Saved: Issues and Controversies, Paper prepared for the Office of Best Practice Regulation.

174
VSL.396 This approach is preferred to alternatives because it is comprehensive and it effectively
adopts a consistent WTP approach to valuing both fatalities and injuries. Consequently, the above
VSL figures are also used as the basis for calculation of the benefits due to reductions in serious
injury numbers. Serious injuries are valued at 0.2 times the VSL figure adopted in the following
calculations (i.e. at $0.82 million).
These potential benefits, while substantial, nonetheless under-estimate the total value to society of
safety improvements, since a range of other costs are incurred due to road accidents. The following
list of ‘non-human’ costs was drawn from research by the Bureau of Transport and Regional
Economics.397 The costs cited are for all road accidents in Australia and relate to 2006.
Table A2.1: Non-human costs of road accidents in Australia, 2006
Cost type Cost
Repair costs (vehicle and other) $4,227 million
Insurance administration $1,421 million
Travel delays $840 million
Vehicle unavailability costs $214 million
Police & emergency services $73 million
Health cost of accident caused pollution $53 million
Street furniture damage cost $40 million
Total non-human $6,869 million
Table A2.1 shows that these ‘non-human’ costs amounted to around $6.9 billion in 2006. This is
equal to $8.4 billion in current dollar values.398 However, subsequent improvements in road safety
performance suggest that these costs will have declined in real terms. For example, whereas there
were 1,602 road fatalities in 2006, this had been reduced to 1,303 in 2012. Applying this ratio to the
above figure suggests that the non-human costs of road accidents in 2012 could have been of the
order of:
(1,303/1,602) x $8.0 billion = $6.5 billion399
Heavy vehicle related fatalities accounted for approximately 18.9 per cent of all road fatalities in
2012.400 On a conservative assumption that heavy vehicle related accidents account for a similar
proportion of non-human costs, this would imply that the non-human costs of heavy vehicle related
accidents is around $1.2 billion per annum.401 In practice, the non-human costs associated with
396 Soby, BA., Ball, DJ. & Ives, DP. (1993). Safety Investment and the Value of Life and Injury. Risk Analysis, Vol.
13, No. 3, June 1993, pp 365-370. 397
BTRE (2006). Road Crash Costs in Australia: Report No. 118. 398
CPI all groups Australia December 2013/December 1996: 104.8/86.6 = 1.21. $6.9bn x 1.21 = $8.4bn. 399
This calculation effectively assumes, in the absence of other information, that the real non-human cost per fatal/injury accident has remained constant since 1996. 400
246 of 1,303 fatalities, albeit this is an atypically large proportion. 401
i.e. $6.5 billion x 0.189 = $1.2285 billion.

175
heavy vehicle-related accidents are considered likely to be higher than this amount, since it seems
intuitively probable that the average non-human cost of a heavy vehicle related accident would be
higher than the average for all road accidents.402 However, no data have been found to confirm this
speculation.
The above estimates are summed in Table A2.2, below, to derive estimates of the total cost of heavy
vehicle-related accidents in Australia at present.
Table A2.2: Cost of heavy vehicle-related accidents in Australia, 2012
Measure Number Value per fatality/injury Total value
Fatalities 246 $4.1 million $1,008.6 million
Serious injuries 1,230403
$0.8 million $1,008.6 million
Non-human costs Not applicable Not applicable $1,200.0 million
Total Not applicable Not applicable $3,217.2 million
Table A2.2 shows that the total cost of heavy vehicle related accidents involving fatalities and/or
serious injuries in 2012 was in the vicinity of $3.2 billion. By implication, for each 1 per cent
improvement in heavy vehicle safety performance, annual benefits with a value of around $32
million would be obtained.
402 In particular, the two largest categories of non-human costs as per Table A2.1, being vehicle related costs
and travel delays both appear likely to be larger on average where heavy vehicles are concerned, given that the average value of a heavy vehicle is considerably higher than that of a car, while a higher proportion of heavy vehicle accidents will involve commercial (as compared to leisure) travel. 403
i.e. 246 fatalities x the ratio of 5.0 estimated above.

176
Appendix 3: Road safety legislation
Chain of Responsibility
CoR is a concept incorporated in the HVNL that is similar to the legal ‘duty of care’ that underpins
WHS law. It was first developed by the NTC for use in the model Road Transport Reform (Compliance
and Enforcement) Bill 2003 as a way to encourage greater compliance across industry by extending
legal responsibility for non-compliance with road transport laws to all parties in the supply chain.
The CoR concept and its operation under the HVNL are discussed in detail in the Chain of
Responsibility in the Heavy Vehicle National Law: Issues Paper prepared by the Chain of
Responsibility Taskforce, which is currently undertaking a review of the CoR provisions in the
HVNL.404 However, in summary the CoR concept generally recognises that the behaviour of one party
in the supply chain can be influenced or controlled by other parties in the chain, although the degree
of control over potential risks will vary depending on each party’s place within the chain and their
activities. CoR therefore operates to ensure that any party in a position to control, influence, prevent
or encourage particular on-road behaviours is identified and held appropriately accountable.
Under the HVNL CoR provisions, specified parties in the supply chain can be held accountable for
transport breaches relating to MDL, fatigue and speeding requirements because of the degree of
control or responsibility that they exercise over road transport activities. This is achieved by
imposing duties on all parties in the supply chain to ensure that their action or inaction does not
contribute to or encourage breaches of road transport laws.
In particular, parties are specifically prohibited from making demands that they ought to know
would cause a breach; from coercing, inducing or encouraging breaches; or from passing on false or
misleading information that could cause a breach.
For example, under CoR, schedulers whose business practices place unrealistic timeframes on
drivers which cause the drivers to exceed their work rest options, or operators who do not provide
drivers with a sleep environment which allows for quality sleep if their work requires them to sleep
away from home (approved sleeper cab, access to rest stops), could be held responsible for
breaches of the HVNL.405
Parties in the supply chain must also make sure the terms of consignment and work/employment
contracts will not result in, encourage, reward or provide an incentive for other parties in the supply
chain (e.g. a driver or scheduler) to break any road transport laws.406
A ‘party’ in the supply chain includes, but is not limited to: 407
404 Chain of Responsibility Taskforce, Chain of Responsibility in the Heavy Vehicle National Law: Issues Paper,
National Transport Commission [web page], 2012, http://www.ntc.gov.au/filemedia/Reports/CORintheHVNLIssuesPaperJul13.pdf (accessed 7 April 2014). 405
National Heavy Vehicle Regulator, ‘About the Chain of Responsibility’, National Heavy Vehicle Regulator [website], 2013, https://www.nhvr.gov.au/safety-accreditation-compliance/chain-of-responsibility/about-the-chain-of-responsibility (accessed 7 April 2014). 406
ibid

177
a) corporations, partnerships, unincorporated associations or other bodies corporate
b) employers and company directors
c) exporters/importers
d) primary producers
e) drivers (including a bus driver and a contractor/owner driver)
f) prime contractors of drivers
g) operator of a vehicle
h) schedulers of goods or passengers for transport in or on a vehicle, and the scheduler of its
driver
i) consignors/consignees/receivers of the goods for transport
j) loaders/unloaders of goods
k) loading managers (the person who supervises loading/unloading, or manages the premises
where this occurs)
A person may also be a party in the supply chain in more than one way. For example a person may
have duties as the employer, the operator and the consigner of goods.408
The CoR Taskforce describes the CoR duties under the HVNL as a series of general and intermediate
duties supported by process-based requirements, specification standards, and executive officer
liability provisions. 409
General duty offences establish an obligation on parties to secure or avoid certain broadly described
outcomes, while intermediate duty offences are based around the role and functions of the relevant
parties. Unlike the model WHS Act, the HVNL contains a single broad general duty under section 229
regarding fatigue and a series of narrower intermediate duty offences in relation to the speed and
fatigue requirements.410
Process-based requirements specify particular processes or steps that may be followed in order to
meet an obligation and can be used for establishing a defence (i.e. ‘reasonable steps defence’, see
below) for certain MDL offences, or in determining whether an offence has been committed (i.e.
whether all ‘reasonable steps’ have been taken) in some speed and fatigue related intermediate
duty offences.411
Specification standards provide guidance to duty holders as to how to meet a duty by providing
precise and detailed information on what is required and are provided under the MDL, speeding and
fatigue management chapters of the HVNL.412 In certain circumstances, where a breach of a driver’s
specification standard relating to keeping documents, or to a MDL, speed or fatigue requirement is
407 ibid
408 ibid
409 Chain of Responsibility Taskforce, op cit, p.15.
410 ibid, paras 50-51.
411 ibid, paras 54-55.
412 ibid, p.17, paras 57-58.
178
identified, CoR provisions in the HVNL extend liability to persons other than the driver and operator
of a heavy vehicle, known as ‘deemed liability'.413
Section 636 of the HVNL also extends liability to executive officers of corporations for breaches of
specified offences (e.g. fatigue and speeding) committed by the corporation.
A defence of ‘reasonable steps’ is available where a breach of transport laws has occurred.414
Reasonable steps are the actions people can take to ensure that heavy vehicle drivers do not drive in
contravention of road transport laws. A ‘reasonable steps’ defence can be claimed by a party in the
supply chain if they can show they took all reasonable steps to prevent the breach, or that there
were no reasonable steps they could have taken to prevent the breach. The defence of ‘reasonable
steps’ can also be claimed if the party did not know, or could not reasonably have been expected to
know, that a breach had occurred.415 For the defence to be successful, all ‘reasonable steps’ must
have been taken. It is not sufficient that only some steps were taken. Taking ‘all reasonable steps’
involves doing what is reasonable and proportionate considering all relevant circumstances,
including the nature of the risk and the seriousness of the potential consequences. It does not
require implementing every conceivable countermeasure.416
Where a CoR breach has been established, the fines imposed can run into the tens of thousands of
dollars.
Western Australia
Heavy vehicles are generally regulated in Western Australia under the Road Traffic (Administration)
Act 2008 (WA) and the Road Traffic (Vehicles) Act 2012 (WA). CoR is not currently a component of
these laws but will shortly be introduced, while fatigue management is administered under the
Occupational Safety and Health Act 1984 (WA).
Western Australia is currently in the process of implementing CoR reforms based on the national
model Road Transport Reform (Compliance and Enforcement) Bill which also formed the basis for
CoR provisions in the HVNL, although some industry driven changes were made to the proposed
Western Australian legislation.417 The Western Australian CoR reforms at this stage appear to be
restricted to MDL offences only.
An additional significant difference between the Western Australian CoR legislation and that of other
states is the extension of coverage of the CoR provisions to all vehicles regardless of size, as opposed
to the HVNL and NTC model laws which only apply to heavy vehicles over 4.5 tonnes. This is
achieved by specifying two categories of vehicles to which the legislation applies: ‘Heavy vehicles’
(GVM of 4.5 tonne or over) and ‘light vehicles’ (GVM of less than 4.5 tonne). Thus small vehicles such
as ‘utes’ and courier/delivery vans are also covered by the Western Australia CoR provisions.
413 ibid, para 59
414 See section 618 of the HVNL.
415 ibid
416 Chain of Responsibility Taskforce, op cit, p. 37 para 133.
417 Main Roads Western Australia, ‘Chain of Responsibility – Overview’, Main Roads Western Australia,
https://www.mainroads.wa.gov.au/Documents/Chain%20of%20Responsibility%20-%20Overview.RCN-D13%5E23372552.PDF (accessed 7 April 2014).
179
Western Australia believes that to gain maximum road safety benefits, it is essential that the CoR
provisions apply to all parties in the transport chain that are able to influence compliance outcomes
for light vehicles so they can also be held accountable for offences.418
The Western Australian CoR reforms are being implemented via amendments to the Road Traffic
(Administration) Act 2008 (WA) and the Road Traffic (Vehicles) Act 2012 (WA). The amending
legislation was passed by the Parliament of Western Australia in May 2012 and is expected to
commence in October 2014 following the drafting of supporting regulations.419
The NHVAS does not operate in Western Australia, instead operators of certain types of heavy
vehicles must become accredited under the Western Australian Heavy Vehicle Accreditation Scheme
(WAHVAS) to gain a permit or notice from Main Roads Western Australia. The WAHVAS includes two
modules: one for fatigue management and one for vehicle maintenance.
Accreditation under the NHVAS is recognised in Western Australia, except for fatigue management
which must comply with the Western Australian requirements for fatigue management.
Northern Territory
Heavy vehicles are generally regulated in the Northern Territory under the Motor Vehicles Act 2011
(NT), including heavy vehicle driver licensing, MDL and vehicle registration. Heavy vehicles registered
in the Northern Territory are required to undergo annual inspections unless the vehicle is accredited
under the NHVAS, which is administered by the NHVR.
There are no heavy vehicle CoR provisions operating in the Northern Territory. However this may
change depending on the extent to which the Northern Territory Government adopts the HVNL.
Fatigue management for drivers of heavy vehicles is administered under the Work Health and Safety
(National Uniform Legislation) Act 2011 (NT).
Fatigue management
In addition to general WHS obligations there are also existing heavy vehicle laws which specifically
regulate fatigue management of drivers in the road transport industry and long distance operations.
With the exception of Western Australia and the Northern Territory, these fatigue laws have been
harmonised under the HVNL. Fatigue laws are enforced by state and territory road transport
authorities and police agencies on behalf of the NHVR.
Heavy Vehicle National Law
Driver fatigue is a significant safety hazard for the road transport industry. The National Road Safety
Strategy 2011 – 2020 estimates that fatigue is implicated in 20–30 per cent of deaths on the road
418 Main Roads Western Australia, ‘Chain of Responsibility – Frequently Asked Questions’, Main Roads Western
Australia, https://www.mainroads.wa.gov.au/Documents/PDF%20version%20-%20Chain%20of%20Responsibility%20-%20FAQs%20-%20January%202014.RCN-D14%5E2325811.PDF (accessed 7 April 2014) 419
Main Roads Western Australia, ‘Chain of Responsibility’ [website], 13 March 2014, https://www.mainroads.wa.gov.au/UsingRoads/HeavyVehicles/Compliance/Pages/CoR.aspx (accessed 7 April 2014)
180
and around 8 per cent of total serious injuries.420 This would mean fatigue is the cause of between
approximately 46 and 69 deaths per annum from crashes involving heavy rigid and articulated
trucks.421
The main causes of driver fatigue are too little sleep, driving during normal sleep hours and working
or being awake for very long hours.422 The HVNL recognises the seriousness of this issue through the
incorporation of provisions for the management of fatigue for drivers of heavy vehicles.
The main elements of fatigue management under the HVNL include working hours, recording work
and rest times, accreditation schemes (i.e. NHVAS), and CoR obligations.
Driver work and rest hours are strictly regulated under the HVNL and the Heavy Vehicle (Fatigue
Management) National Regulation 2013, although greater flexibility in determining work and rest
hours is available through accreditation under the NHVAS ‘Basic Fatigue Management’ or ‘Advanced
Fatigue Management’ modules. All drivers of fatigue-regulated heavy vehicles who operate in an
area with a radius of 100km or more from their home base or under the NHVAS fatigue management
modules are required to complete a work diary423 to record their work and rest times.424
Requirements for work diaries are detailed in Part 6.4 of the HVNL and the Heavy Vehicle (Fatigue
Management) National Regulation 2013. These laws provide a legal structure for the approval and
operation of electronic work diaries (EWDs) in the heavy vehicle sector. However, when the national
law was drafted the nature and technical elements of the EWD were not known. Therefore a range
of EWD provisions are the subject of further review to ensure the HVNL is consistent with the policy
position and technological direction of EWDs.425
Under the HVNL drivers have a general duty not to drive on the road while impaired by fatigue.426
This duty is backed up by CoR provisions requiring each person in the supply chain to take all
reasonable steps to ensure a heavy vehicle driver can perform his or her duties without breaching
the fatigue provisions. This obligation is similar to WHS laws and is enshrined in a single broad
420 Standing Committee on Transport, National Road Safety Strategy 2011-2020, Department of Infrastructure
[web page], May 2011, p. 25, http://www.infrastructure.gov.au/roads/safety/national_road_safety_strategy/files/NRSS_2011_2020_15Aug11.pdf (accessed 7 April 2014) 421
Calculated as follows: BITRE figures indicate 229 deaths from crashes involving heavy rigid and articulated trucks in Australia during the 12 months to the end of March 2013 (Department of Infrastructure and Transport, BITRE, Fatal Heavy Vehicle Crashes Australia Quarterly Bulletin, Jan–Mar 2013, p. 1). Applying the National Road Safety Strategy proportions of 20–30% of deaths results in figures between 45.8 and 68.7. 422
NHVR, ‘About Fatigue Management’, National Heavy Vehicle Regulator [web page], https://www.nhvr.gov.au/safety-accreditation-compliance/fatigue-management/about-fatigue-management (accessed 7 April 2014) 423
Drivers completing work less than 100 km from their base must also comply with statutory hours, however, do not have the same record-keeping requirements. 424
NHVR, ‘Work Diaries’, National Heavy Vehicle Regulator [web page], https://www.nhvr.gov.au/safety-accreditation-compliance/fatigue-management/work-diaries-and-record-keeping (accessed 7 April 2014) 425
See the NTC report ‘Preparing Australia for Electronic Work Diaries: Regulatory Issues Paper’ op cit 426
See section 228.
181
general duty under section 229 of the HVNL regarding fatigue, as well as a number of additional
obligations targeted towards ‘off-road’ parties in the supply chain, including the following:427
Employers, prime contractors and operators must ensure their activities do not cause the
vehicle’s driver to drive while fatigued or in breach of regulated work and rest hours,428 and
that each scheduler for the vehicle has complied with their scheduling obligations.429
Schedulers must ensure a schedule does not cause a driver to drive while fatigued or in
breach of regulated work and rest hours, including allowing for adequate rest breaks and
establishing flexible contingencies to accommodate unplanned delays due, for example, to
traffic conditions, congestions and delays caused by loading, unloading or queuing.430
Consignors and consignees must:
o ensure the terms of consignment will not result in, encourage or provide an
incentive for the driver to drive while fatigued or in breach of regulated work and
rest hours;431
o ensure the terms of consignment will not result in, encourage or provide an
incentive for an employer, prime contractor or operator to cause the driver to drive
while fatigued or in breach of regulated work and rest hours;432
o assure themselves that employers, prime contractors, operators and schedulers
have complied with their obligations before entering into a contract or
agreement;433 and
o refrain from making demands that may cause a scheduler to contravene their
obligations.434
Loading managers must ensure:
o queuing is managed so loading/unloading is done in a way to prevent a driver driving
while fatigued or in breach of regulated work and rest hours;435 and
o a driver is able to rest while waiting for loading/unloading if there are delays to the
notified starting or finishing times for loading/unloading, or these times are
unknown.436
Each of the above duties is subject to the ‘reasonable steps’ defence outlined earlier.
Additional provisions437 under the HVNL CoR also prohibit parties in the supply chain from:
427 NHVR, ‘General fatigue obligations – off-road parties’, National Heavy Vehicle Regulator [web page],
https://www.nhvr.gov.au/safety-accreditation-compliance/fatigue-management/general-fatigue-obligations-%E2%80%93-off-road-parties (accessed 7 April 2014). 428
See section 230. 429
See sections 231 and 232. 430
See sections 233 and 234. 431
See section 235(1). 432
See section 235(2). 433
See section 236. 434
See section 237. 435
See section 238. 436
See section 239. 437
See sections 240 and 241 of the HVNL.

182
asking, directing or requiring, either directly or indirectly, a driver to do or not do something
the person knows, or ought reasonably to know, would have the effect of causing the driver
to breach fatigue laws; and
entering into a contract or other agreement with a driver or another party in the supply
chain that the person knows, or ought reasonably to know, would cause, encourage or
provide an incentive for the driver, or a party in the supply chain to cause a driver, to breach
fatigue laws.
Corporations, partnerships, unincorporated associations or other body corporates are also liable for
offences committed by their employees, directors or officers.438
Fatigue laws also operate in Western Australia and the Northern Territory despite both states opting
not to adopt the HVNL. However, while sharing some similarities with the HVNL, the fatigue
management laws in Western Australia and the Northern Territory are administered under WHS
legislation rather than transport legislation.
Western Australia
Western Australia has opted not to participate in the national process to harmonise WHS laws.
In Western Australia laws governing driver fatigue are administered under the Occupational Safety
and Health Act 1984 (WA), Occupational Safety and Health Regulations 1996 (WA)439 and the Code of
Practice Fatigue Management for Commercial Vehicle Drivers.
The Occupational Safety and Health Act 1984 (WA) imposes a general duty on employers (‘the
responsible person at a workplace’) and employees to take reasonable care to ensure their own
safety and that of others at the workplace, including other road users. For employers this duty of
care means identifying and assessing fatigue risks and taking actions to eliminate or control those
risks. This includes ensuring that employees and contractors who drive commercial vehicles have
adequate information, instruction, training and supervision in order that they can work in a safe
manner.440 For employees who drive commercial vehicles this duty of care means reporting hazards
to their employer, ensuring they follow their employer’s safety instructions and reporting for work
rested and fit for duty.441 A person can have duties in more than one capacity. In the case of
contractor drivers, they are required to comply with both sets of duties as an employee and a
responsible person.442
The Occupational Safety and Health Regulations 1996 (WA) also set out additional specific duties for
the ‘responsible person’ that work in tandem with the general duties under the Occupational Safety
and Health Act 1984 (WA), including ensuring the following:
438 See section 636.
439 Part 3 Division 10.
440 See section 19.
441 See section 20.
442 See section 21.
183
Commercial vehicles are operated in accordance with the ‘commercial vehicle operating
standard.’443
Drivers are certified by a medical practitioner as fit to drive the commercial vehicle.444
There is a fatigue management plan that covers every driver.445
Records of work time, breaks from driving, and non-work time are kept for each driver.446
Drivers similarly have duties under the Regulations to drive commercial vehicles in accordance with
the commercial vehicle operating standard and hold a current medical certificate that confirms their
fitness to drive a commercial vehicle.447
The ‘Commercial Vehicle Operating Standard’ regulates work and rest hours448 but is designed to
provide flexibility in hours of work so that extended hours of work can be performed in well-
managed circumstances. There is a requirement for the standard to be followed in ‘so far as is
practicable’, meaning that it may be varied but only in circumstances where the variation is minor, is
not a regular occurrence, is reasonable and does not increase the risk of fatigue.449 This approach
has been taken in recognition of the geography of Western Australia and the distances driven.
The fatigue management plan is a written document that provides information on an organisation’s
approach to fatigue management and must set out requirements and procedures relating to:
a) scheduling trips
b) rostering drivers
c) establishing a driver’s fitness to work
d) education of drivers in fatigue management
e) managing incidents on or relating to commercial vehicles
f) establishing and maintaining appropriate workplace conditions
There is no requirement within the regulations to maintain a logbook or trip diary. However, the
record must be “set out in a clear and systematic manner”, detail “work time, breaks from driving,
and non-work time” and be kept for at least three years after the date of the last entry. Heavy
vehicle drivers in Western Australia are not obliged to use the national work diary.
There is also no requirement to complete the records in a timely manner or for the driver to
complete the records. Rather, the regulations stipulate a ‘responsible person’.
Western Australia’s approach to fatigue management was recently criticised in a draft NTC report450
which identified particular enforcement challenges with using WHS laws to manage fatigue. In
particular, the NTC found that officers with jurisdiction over health and safety (i.e. WorkSafe
443 See regulation 3.131(1)(a).
444 See regulation 3.131(1)(b).
445 See regulation 3.133 and the definition of "driver fatigue management plan" in regulation 3.130.
446 See regulation 3.134.
447 See regulation 3.131(2).
448 See regulation 3.132.
449 WorkSafe Western Australia (2004), Code of Practice Fatigue Management for Commercial Vehicle Drivers,
2004, p.10. 450
NTC (2013), Heavy Vehicle Compliance Review: Consultation Draft, September 2013.
184
inspectors) do not have powers to intercept heavy vehicles, while officers with heavy vehicle
intercept powers (i.e. Main Roads Western Australia or Department of Transport officers) have no
jurisdiction over fatigue other than reviewing fatigue records for accreditation purposes.451 The
report suggested that this complication may be the reason for the comparatively low number of
successful fatigue prosecutions in Western Australia compared with other states.
Northern Territory
Similar to Western Australia, the Northern Territory has adopted a WHS approach to the
management of fatigue, which is based on the principles of risk identification, assessment and
control. This approach is taken in recognition of the different operating environment in remote
areas.
In the Northern Territory, management of driver fatigue is mandatory for all transport operators and
is regulated under the Work Health and Safety (National Uniform Legislation) Act 2011 (NT) and
Regulations and the Road Transport Fatigue Management Code of Practice made under the Act.
The Northern Territory fatigue management system encourages the adoption of record keeping
systems and self-monitoring to ensure drivers do not drive while fatigued. Instead of prescriptive
driving/working hours, drivers are required to comply with specified minimum rest periods, being a
minimum of two rest periods of at least 24 hours each in a 14-day period and at least six hours rest
in any 24-hour period.452 The intent of this is to provide drivers and operators greater flexibility to
stop and take rest when they themselves decide they need it based on a risk assessment of the task
at hand. 453
The documentation employers and drivers are required to keep include:
a) a risk assessment checklist
b) a safety plan checklist
c) driving records
d) staff rosters/records
e) medical records
f) evidence of driver experience, competence and qualifications
g) records of driver health training and information provided to drivers
The Northern Territory currently has no plans to adopt the national approach to fatigue
management under the HVNL. Rather the Northern Territory has indicated that that it is concerned
the national fatigue management system under the HVNL will be an impost on operators in remote
Australia and as such will not implement those provisions at this time.454
451 Ibid, p.75
452 Worksafe NT, Road Transport Fatigue Management Code of Practice.
453 ibid
454 Northern Territory Department of Transport (2014), National Heavy Vehicle Regulator: Northern Territory
Update, February 2014, http://www.transport.nt.gov.au/__data/assets/pdf_file/0011/38783/NHVR-Newsletter-February-2014.pdf (accessed 7 April 2014).

185
However, the Northern Territory will recognise the HVNL and Western Australia fatigue laws for
those companies operating across borders and will continue with its current WHS fatigue regime for
those operating solely within the Northern Territory.455 This is intended to allow Northern Territory
operators to opt into the system that best suits their business needs, without compromising
safety.456
Speeding
Speeding offences exist in all states and territories for vehicles that exceed legal speed limits.
Speeding laws are enforced by state and territory road transport authorities and police agencies,
with penalties ranging from monetary fines through to imprisonment.
With the exception of Western Australia and the Northern Territory, speeding is also addressed
through CoR provisions.
Heavy Vehicle National Law
Like fatigue, speed is widely acknowledged as a significant contributor to road deaths involving
heavy vehicles. The National Road Safety Strategy 2011 – 2020 estimates that speeding is implicated
in 34 per cent of deaths on the road and around 13 per cent of total serious injuries.457 This would
mean speeding is the cause of approximately 78 deaths per annum from crashes involving heavy
rigid and articulated trucks.458
The HVNL addresses speeding through CoR provisions similar to those for fatigue management.
Specific CoR obligations for speeding include the following:
Employers, prime contractors and operators must ensure their activities do not cause the
vehicle’s driver to exceed speed limits,459 and that each scheduler for the vehicle has
complied with their scheduling obligations.460
Schedulers must ensure a schedule does not cause a driver to exceed speed limits, including
by providing for compliance with speed limits, regulated work and rest hours and
establishing flexible back-up plans to compensate for unplanned delays.461
Loading managers must ensure the arrangements for the loading or unloading of goods
does not cause or encourage the vehicle’s driver to exceed speed limits.462
455 NTC (2013), National Transport Reform Implementation Monitoring: Report to the Standing Council on
Transport and Infrastructure, November 2013, p. 17. 456
Northern Territory Department of Transport (2014), op cit 457
Standing Committee on Transport, op cit 458
Calculated as follows: BITRE figures indicate 229 deaths from crashes involving heavy rigid and articulated trucks in Australia during the 12 months to the end of March 2013 (Department of Infrastructure and Transport, BITRE, Fatal Heavy Vehicle Crashes Australia Quarterly Bulletin, Jan–Mar 2013, p. 1). Applying the National Road Safety Strategy proportions of 34% of deaths results in a figure of 77.86. 459
See section 204. 460
See sections 205 and 206. 461
See sections 207 and 208. 462
See section 209.
186
Consignors and consignees must ensure the terms of consignment will not result in,
encourage, or provide an incentive for the driver (or a relevant party of the driver) to exceed
speed limits, or cause a scheduler to breach their obligations.463
Each of the above duties is subject to the ‘reasonable steps’ defence outlined earlier.
Additional provisions464 prohibit parties in the supply chain from:
asking, directing or requiring, either directly or indirectly, a driver to do or not do something
the person knows, or ought reasonably to know, would have the effect of causing the driver
to exceed applicable speed limits; and
entering into a contract or other agreement with a driver or another party in the supply
chain that the person knows, or ought reasonably to know, would cause, encourage or
provide an incentive for the driver, or a party in the supply chain to cause a driver, to exceed
applicable speed limits.
The HVNL also extends liability for speeding offences committed by the vehicle’s driver to persons
who are most directly responsible for the use of a heavy vehicle (i.e. the employer, prime contractor
or operator).465
Corporations, partnerships, unincorporated associations or other body corporates are also liable for
offences committed by their employees, directors or officers.466
The NHVR has no role in speeding offences other than in a CoR context.
Western Australia
Western Australia is currently in the process of implementing CoR reforms.467 However, at this stage
these reforms do not appear to extend to speeding. As a result, only the driver of a heavy vehicle
caught speeding is responsible for the speeding offence.
Northern Territory
CoR provisions do not currently operate in the Northern Territory. As a result, only the driver of a
heavy vehicle caught speeding is responsible for the speeding offence. However this may change
depending on the extent to which the Northern Territory Government adopts the HVNL.
Heavy vehicle speed limiting
The use of speed limiters in heavy vehicles has been regulated in Australia for over 20 years. Since
1991, Third Edition Australian Design Rule 65 (ADR 65) has required all vehicles over 12 tonnes gross
vehicle mass (GVM) to be speed limited to 100 km/h.
463 See sections 210 to 213.
464 See sections 215 and 216.
465 See section 219.
466 See section 636.
467 Main Roads Western Australia, ‘Chain of Responsibility – Overview’, op cit
187
The Australian Design Rules (ADR) are national standards for vehicle safety, anti-theft and emissions
and apply to all vehicles newly manufactured in Australia or imported as new or second hand
vehicles, and supplied to the Australian market.
For vehicles manufactured after July 1989, the application of the ADRs is the responsibility of the
Australian Government under the Motor Vehicle Standards Act 1989 (Cth). This Act is binding on the
Commonwealth and each state and territory, thereby ensuring nationally consistent application.
In 2006 the ADRs were re-made as national vehicle standards. At that time ADR 65 was registered on
the Federal Register of Legislative Instruments as the Vehicle Standard (Australian Design Rule
65/00 – Maximum Road Speed Limiting for Heavy Goods Vehicles and Heavy Omnibuses) 2006.
Heavy vehicle compliance with ADR 65 is mandatory in all Australian states and territories through
application of the HVNL468 and motor vehicle laws in Western Australia469 and the Northern
Territory.470 With the exception of the Northern Territory, each state and territory also makes it an
offence for a person to tamper with a speed limiter required by law to be fitted to a heavy vehicle.471
This offence is extended under the HVNL to apply to:
a person who fits, or directs the fitting of, a speed limiter that they know, or ought
reasonably to know, has been tampered with;472 and
an operator of a heavy vehicle who uses, or permits a vehicle to be used on a road if they
know, or ought reasonably to know, that a speed limiter fitted to the vehicle has been
tampered with.473
In the Northern Territory there is no specific offence for tampering with a speed limiter. However
Regulation 35 of the Motor Vehicles (Standards) Regulations (NT) makes it an offence for a person to
drive, or cause or permit to be driven on a public road, a vehicle that does not to comply with a
requirement of the Motor Vehicles (Standards) Regulations (NT) or Australian Vehicle Standards
Rules (NT).
468 Section 60 of the HVNL makes it an offence for a person to use or permit to be used, a heavy vehicle that is
in contravention of ADR 65. The Heavy Vehicle (Vehicle Standards) National Regulation 2013, made under the HVNL, require heavy vehicles over 12 tonnes gross vehicle mass to comply with ADR 65 and specify that the maximum speed limit for road trains is also 100 km/h. 469
In Western Australia, Part 3 Division 2 of the Road Traffic (Vehicle Standards) Rules 2002 require vehicles generally to comply with ADRs. Rule 149 of the WA Rules specify compliance with ADR 65. 470
In the Northern Territory, Part 3 Division 2 of the Australian Vehicle Standards Rules (NT) require vehicles generally to comply with ADRs. Rule 155 of the NT Rules specify compliance with ADR 65. 471
See section 93(1) of the HVNL and Regulation 68 of the Road Traffic (Vehicle Standards) Regulations 2002 (WA). 472
See section 93(2) of the HVNL. 473
See section 93(3) of the HVNL.
188
Appendix 4: Legislation addressing truck driver remuneration
New South Wales
Contractual arrangements between contractor drivers (i.e. owner drivers) and hirers in the NSW
road transport industry have been regulated under the NSW industrial system since 1979, initially
through the Industrial Arbitration Act 1940, the Industrial Relations Act 1991 and now Chapter 6 of
the Industrial Relations Act 1996 (NSW) (IR Act).
The IR Act provides the NSW Industrial Relations Commission (IRC) powers to make ‘contract
determinations’ upon application by specified parties. Contract determinations are similar to awards
as they establish a safety net of remuneration and other employee like terms and conditions for the
engagement of ‘contract carriers’ (i.e. contractor/owner drivers) and apply in relation to particular
‘contracts of carriage’ in the transport industry. A contract determination is binding on all principal
contractors and owner drivers who are parties to contracts of the class to which the determination
relates and is enforceable by the NSW IRC.
The IR Act prevents undercutting of prices by requiring that contractor drivers must be paid at least
as much as the safety net amount prescribed by the applicable contract determination, although
contractor drivers are allowed to contract above the minimum standards required by contract
determinations.
The IR Act provides for contract agreements, which are akin to enterprise agreements and deal with
terms and conditions specific to a particular enterprise. A contract agreement can be made between
a principal contractor and a group of contractor drivers, or an association representing either party
(e.g. union or industry group) and registered under the IR Act. A contract agreement does not have
effect unless it is approved by the NSW IRC and must provide at least equivalent terms and
conditions to the contractor drivers covered by the agreement when compared with the provisions
of a relevant contract determination, which would otherwise apply. The provisions of a contract
agreement prevail over the provisions of any contract determination to the extent of any overlap
and are binding on all parties to the contract agreement. Contract agreements are exempt from the
competition provisions of the Competition and Consumer Act 2010 (Cth), which is discussed
elsewhere in this Report.
The NSW IRC has powers under the IR Act to resolve disputes between principal contractors and
contractor drivers regarding terms and conditions in contracts of carriage. In doing so, the NSW IRC
may make a contract determination (‘interim determination’) to restore or maintain the conditions
existing between the parties immediately before the dispute. Interim determinations can only apply
for a maximum period of one month.
The IR Act also protects contractor drivers against the arbitrary termination of a contract, and
provides them the capacity to recover compensation in certain circumstances.

189
A total of 29 contract determinations operate under the IR Act.474 A further 115 enterprise-specific
contract agreements have been approved by the NSW IRC.475
One of the primary industrial instruments currently regulating the terms and conditions for NSW
contractor drivers is the Transport Industry General Carriers Contract Determination. This
determination applies in the Sydney metropolitan area and covers a number of matters including
remuneration, annual leave, lunch breaks, uniforms, termination, disputes and other obligations.
Regarding remuneration, the determination generally stipulates what rates (hourly and km)
contractor drivers should be paid.
In calculating the rates payable to contractor drivers, Schedule 1 of the determination expressly
notes that the payable rates take into account, and include payment for wages, overtime, leave
(annual, long service and sick) and public holidays and provide cost-recovery for registration,
insurances, administrative overheads, running costs (e.g. fuel, oil etc.), repairs and maintenance,
return on capital invested, depreciation and leasing costs. 476
A number of other contract determinations have been made to regulate contract prices and
arrangements for specific issues, enterprises and sectors of the transport industry such as couriers,
concrete movers, quarries, waterfront, waste collection, breweries, car carriers and general long
distance freight. However, the terms and conditions of engagement and calculation of rates varies
between contract determinations, sometimes significantly.
Transport Industry - Mutual Responsibility for Road Safety (State) Contract Determination
One of the contract determinations made by the NSW IRC is the Transport Industry - Mutual
Responsibility for Road Safety (State) Contract Determination, which has been in force since 2006.
This contract determination establishes a number of requirements targeted at health and safety in
the long distance transport sector including safe driving plans, accountability, compulsory basic
training that covers WHS and a requirement that employers and principal contractors implement
workplace drug and alcohol policies. The determination also sets out a process for resolution of
disputes.
The determination requires safe driving plans to specify a number of details including:
a) The period in which work is required to be performed.
b) The relevant pick-up and delivery location.
c) How the work to be performed will to be remunerated in accordance with any applicable
industrial instrument (e.g. the Transport Industry General Carriers Contract Determination).
d) The remuneration method chosen and the rate.
474 NSW Industrial Relations, ‘Industries and Awards – Transport Industry’, NSW Industrial Relations [web
page], 21 June 2013, http://www.industrialrelations.nsw.gov.au/oirwww/Industries_and_Awards/Transport_Industry.page (accessed on 7 April 2014). 475
NSW Industrial Registrar, ‘List of Awards and Contract Determinations as at December 2012’, NSW Industrial Gazette, Supplement to Volume 375, pp.10-12. 476
See Schedule 1 of the Transport Industry General Carriers Contract Determination (NSW).

190
e) The system(s) by which the effect of the chosen method of remuneration on driver fatigue
may be monitored and measured.
f) The means by which the amount of hours and work to be performed by contract carriers is
to be limited in order to prevent driver fatigue occurring and excessive hours being worked,
and the means by which such limitations are to be enforced.
g) How the work is to be performed (e.g. hours of work, limitations upon hours of work) and
rest breaks taken in accordance with applicable laws and industrial instruments.
h) The means for ensuring persons performing the work are not inhibited by drugs and alcohol.
The determination also establishes accountabilities throughout the supply chain for ensuring
compliance with safe driving plans and other applicable laws, similar to CoR requirements under the
HVNL.
Victoria
The Victorian Owner Drivers and Forestry Contractors Act 2005 (ODFC Act), regulates the
relationship between owner drivers (i.e. contractor drivers) and their hirers. It applies to owner
drivers including sole traders; non-public corporations and partnerships where an owner or a
director of the business is also the main driver of a vehicle supplied by the business; and the
business operates no more than three vehicles. The ODFC Act also applies to harvesting and haulage
contractors in the forestry industry.477 The ODFC Act does not apply to employee drivers.
The ODFC Act provides basic protections for small business owner drivers, forestry contractors and
haulage contractors, and a framework for the resolution of commercial disputes between these
contractors and their hirers. In particular, the Act:
a) requires the Minister to develop and publish annual rates and costs schedules for
contractors;478
b) requires hirers to provide tenderers and owner drivers in longer-term relationships (more
than 30 days in any three-month period) with a copy of the Victorian Owner Driver
Information Booklet479 and the rates and costs schedules;480
c) specifies certain requirements for contracts, including;
i. that longer-term contracts must be in writing, and must specify the minimum hours
or income to be paid;481
ii. minimum periods of notice for termination of longer term contracts;482 and
iii. prohibiting deductions by hirers (for example, for insurance) unless certain
conditions are met; 483
477 Victorian Department of Treasury and Finance, ‘Key features of the Owner Drivers and Forestry Contractors
Act’, Victorian Department of Treasury and Finance [web page], 2 December 2012, http://www.dtf.vic.gov.au/Victorias-Economy/Transport-and-forestry-industries/Key-features-of-the-Owner-Drivers-and-Forestry-Contractors-Act (accessed on 7 April 2014). 478
See sections 14 and 15. 479
See sections 10 to 13. 480
See sections 16, 17 and 18. 481
See section 20. 482
See sections 21 and 22.
191
d) provides a collective bargaining framework for groups of owner drivers to negotiate with
their common hirer, and to appoint an agent to negotiate on their behalf;484
e) provides protections for owner drivers who seek to exercise their rights under the Act;485
f) provides for regulations prescribing a code of conduct in relation to the engagement of
owner drivers and conduct and practice under owner driver contracts;486
g) makes ‘unconscionable conduct’ by hirers and owner drivers unlawful;487
h) establishes a framework for the resolution of disputes between owner drivers and their
hirers;488 and
i) establishes the Transport Industry Council (TIC) and the Forestry Industry Council (FIC).489
The Victorian Owner Driver Information Booklet provides information on business planning skills, the
legislation, the code of practice, health and safety, industry regulation and sources of advice and
assistance.
The schedules set out the typical operating costs of an owner driver business and act as a guide to
assist owner drivers to prepare their own individual cost models. The operating costs are made up of
variable costs (which vary depending on kilometres travelled, such as fuel and tyres), and fixed costs
(such as registration, finance, administration, insurance and superannuation). The schedules also
provide information on rates that would typically apply for the contractor’s own labour if he or she
completed the work as an employee.
Part 2 Division 2 of the ODFC Act requires that rates and costs schedules are published by the
Minister after advice from the TIC and FIC. These Councils are tasked under the ODFC Act with:490
providing the Minister advice on codes of practice in respect of owner drivers and forestry
contractors and relevant information booklets;
developing, publishing and promoting model owner driver, haulage and harvesting
contracts; and
advising the Minister on any other matters relevant to owner driver and forestry contractor
contracts, and the commercial practices generally engaged in by owner drivers, forestry
contractors and hirers in relation to each other.
Both the TIC and FIC are made up of representatives of participants in the transport and forestry
industries.
Under the disputes framework, the Victorian Small Business Commissioner provides an independent
dispute resolution service for disputes between owner drivers and forestry contractors and their
hirers regarding the requirements of the ODFC Act or regulations or the terms of a contract
483 See sections 23 and 24.
484 See Part 2 Division 5
485 See section 61.
486 See Part 3.
487 See Part 4.
488 See Part 5.
489 See Part 7.
490 ibid
192
regulated by the Act. Where a dispute cannot be resolved through this process, it can be referred to
the Victorian Civil and Administrative Tribunal for determination.
The ODFC Act is supported by the Owner Drivers and Forestry Contractors Regulations 2006, which
establishes the Owner Drivers and Forestry Contractors Code of Practice. For the purposes of the
ODFC Act the Code of Practice describes conduct that is likely to be ‘unconscionable’ and contract
terms that are likely to be unjust. The Code also contains some mandatory requirements with which
hirers and contractors must comply.
Collective bargaining between groups of owner drivers and their common hirer in accordance with
the ODFC Act is exempt from the competition provisions of the Competition and Consumer Act 2010
(Cth), which is discussed elsewhere in this Report.
Western Australia
Like Victoria, Western Australia also regulates the relationship between owner drivers (i.e.
contractor drivers) and their hirers through the Owner Drivers (Contracts and Disputes) Act 2007
(ODCD Act).
The Western Australian legislation generally covers all owner drivers and hirers operating vehicles
greater than 4.5 tonnes for the carriage of goods for reward in Western Australia.491 Employee
drivers are not covered by the ODCD Act. Likewise, owner driver contracts affected by an order or
determination made under either the Victorian or NSW owner driver system are not covered by the
ODCD Act.492
The ODCD Act is broadly based on the Victorian Owner Drivers and Forestry Contractors Act 2006
(Vic), and is therefore similar in many respects. Like the ODFC Act, the ODCD Act provides basic
protections for owner drivers, including guideline rates, and establishes a framework for the
resolution of commercial disputes between owner drivers and their hirers. Specifically, the ODCD Act
includes provisions for the following matters:
a) Certain contract provisions are prohibited:493
i. The ODCD Act bans liability of a party to pay money under the contract to another
party contingent, whether directly or indirectly, on the first party being paid money
by another person. Where such provisions are included they have no effect.
ii. Where an owner driver contract contains a provision requiring a payment to be
made more than 30 days after a payment claim is lodged, the ODCD Act provides
that the contract is to be read as being amended to require payment within 30 days
of the claim being made.
491 Western Australian Department of Transport (2013), Discussion Paper Review of the Owner-Drivers
(Contracts and Disputes) Act 2007, November 2013, p.7, http://www.transport.wa.gov.au/mediaFiles/rail-freight/freight_DiscussionPaperReviewODA.pdf (accessed on 7 April 2014). 492
Western Australian Department of Transport (2013), Western Australian Owner-Drivers Information Booklet, 2013, http://www.transport.wa.gov.au/mediaFiles/rail-freight/freight_OwnerDrivers_Information_Booklet.pdf (accessed on 7 April 2014). 493
See sections 9, 10 and 11.
193
iii. Additional prohibited provisions can be prescribed by regulations.
b) Where certain provisions are not already covered in the contract, implied provisions are set
for a number of matters including:494
i. Payment times: Payments must otherwise be made within 14 days if there is nothing
written in the owner driver contract about payment times.
ii. Interest on overdue payments.
iii. Making claims for payments.
c) The Road Freight Transport Industry Council (RFTI Council) is established to provide advice
and recommendations to the Minister in relation to the development and review of a code
of conduct and guideline rates and model contracts for owner drivers.495
d) Regulations may be made prescribing a code of conduct in relation to the engagement of
owner drivers under owner driver contracts and conduct and practice under owner driver
contracts.496
e) A collective bargaining framework is established to allow groups of owner drivers to
negotiate with a common hirer, and to appoint an agent to negotiate on their behalf.497
f) ‘Unconscionable conduct’ by hirers and owner drivers is prohibited. For this purpose the Act
specifies a number of matters to which the Tribunal may have regard in determining
whether a party has engaged in unconscionable conduct towards the other party.498
g) Industrial inspectors from the Labour Relations Division of the Department of Commerce are
provided powers to investigate alleged breaches of the ODCD Act, the Code of Conduct, or
an owner driver contract regulated by the Act.499
h) Owner drivers (or their representative) are provided rights for access to certain types of
records that a hirer is required to keep about that owner driver under the ODCD Act or Code
of Conduct.500
i) The Road Freight Transport Industry Tribunal (RFTI Tribunal) is established for the purpose of
resolving disputes between owner drivers and their hirers regarding payments or breaches
of a requirement of the ODCD Act, the Code of Conduct or a contract.501
A party to an owner driver contract cannot give away or bargain away any of the rights or obligations
that the ODCD Act or Code of Conduct gives or imposes on them.
The ODCD Act is supported by the Owner drivers (Contracts and Disputes) (Code of Conduct)
Regulations 2010, which establishes the Owner driver Contracts Code of Conduct 2010 (Code of
Conduct) for the purposes of sections 26 and 27 of the Act. Additional requirements imposed by the
Code of Conduct include:
494 See sections 13, 14 and 15.
495 See Part 3.
496 See Part 4.
497 The Code of Conduct prescribed by section 26 of the Act can provide for the conduct of negotiations for
owner driver contracts, whether on an individual or joint basis. This is reinforced by sections 28 and 29 of the Act which provide for the appointment of negotiating agents on behalf of groups of owner drivers or hirers. 498
See Part 6. 499
See Part 7. 500
See Part 8. 501
See Part 9.
194
A group of owner drivers and their hirer may conduct joint negotiations for an owner driver
contract.502
Before entering into a contract with an owner driver a hirer must provide the owner driver
with a copy of the Owner drivers Information Pamphlet503 and the guideline rates produced
by the RFTI.504
An owner driver is not liable to pay a hirer any amount that is a penalty.505
A hirer must not deduct any amount from money payable under an owner driver contract to
an owner driver, except in specific circumstances as set out in the Code or authorised by the
contract (e.g. in-house vehicle servicing or insurance cover).506
As with the Victorian rates and cost schedules, the guideline rates published by the RFTI Council set
a benchmark for owner drivers and hirers to refer to when negotiating payment rates and conditions
for the owner driver. The guideline rates address typical fixed and variable overhead costs for owner
drivers and also identify rates that would typically apply if the owner driver was an employee
performing the same or similar work. The Guideline Rates do not set a minimum or maximum rate,
but the RFTI Tribunal can refer to them to determine whether payments have been made at a safe
and sustainable rate.507
The Western Australian Industrial Relations Commission (WAIRC) has jurisdiction under the ODCD
Act to hear and determine certain disputes between owner drivers and hirers. When hearing those
disputes, the WAIRC sits as the RFTI Tribunal.508
The RFTI Tribunal can enquire into and deal with any other matter relating to the negotiation of
owner driver contracts that may be referred to it under the ODCD Act. The RFTI Tribunal can deal
with disputes under or in relation to breaches of the ODCD Act, Code of Conduct or an owner driver
contract, including payment terms and conditions of engagement. The RFTI Tribunal also has powers
to resolve disputes through compulsory conciliation and if necessary making an enforceable
determination (except in relation to joint negotiations).
The RFTI Tribunal can declare void any unjust term of an owner driver contract, but cannot insert
new terms into or vary owner driver contracts (even where the contract is found to be unfair)509 and
cannot require hirers of owner drivers to provide notice if they terminate an owner driver contract.
The RFTI Tribunal can also refer matters to other regulatory agencies. For example, if the RFTI
Tribunal considers that the fatigue management code or other safety legislation has been breached,
it can refer the matter to Western Australian Department of Commerce or WorkSafe inspectors.
502 See Regulation 5.
503 See Appendix 1 of the regulations.
504 See Regulation 7(2).
505 See Regulation 9.
506 See Regulation 10.
507 Western Australian Department of Transport (2013), Discussion Paper Review of the Owner-Drivers
(Contracts and Disputes) Act 2007, op cit, p.8 508
ibid, p.2 509
See section 48(5) of the ODCD Act.

195
Collective bargaining between groups of owner drivers and their common hirer in accordance with
the ODCD Act is exempt from the competition provisions of the Competition and Consumer Act 2010
(Cth), which is discussed elsewhere in this Report.

196
Appendix 5: Other legislation
Fair Work Act 2009 (Cth)
Currently, employee drivers are afforded a safety net under workplace relations law as set out under
the Fair Work Act 2009 (FW Act). Modern awards, together with the National Employment
Standards (NES) and the national minimum wage orders made by the FWC, make up the safety net
for employees covered by the national workplace relations system. The FW Act, Modern Awards and
any applicable agreements and instruments are administered and enforced through the FWO and
FWC.
The FW Act provides for the setting of national minimum wages and sets out the NES, which are the
minimum standards afforded to all employees in the national system. There are 10 NES that cover:
1. Maximum weekly hours – 38 hours per week, plus reasonable additional hours.
2. Requests for flexible working arrangements – Certain employees can ask for a change in
their working arrangements.
3. Parental leave – Up to 12 months unpaid leave per employee, as well as the right to request
an additional 12 months leave.
4. Annual leave – Four weeks paid leave per year, plus an additional week for some shift
workers.
5. Personal/carer’s leave and compassionate leave – 10 days paid personal/carer’s leave per
year, two days unpaid carer’s leave and two days compassionate leave (unpaid for casuals)
as required.
6. Community service leave – Unpaid leave for voluntary emergency management activities
and leave for jury service.
7. Long service leave – Paid leave for employees who have been with the same employer for a
long time.
8. Public holidays – A paid day off on a public holiday, unless reasonably requested to work.
9. Notice of termination and redundancy pay – Up to five weeks notice of termination and up
to 16 weeks redundancy pay.
10. Fair Work Information Statement – A statement which details the rights and entitlements of
employees under the system and how to seek advice and assistance must be provided to all
new employees.
The FWC is responsible for making a national minimum wage order for employees not covered by an
award or agreement.
Minimum standards in the NES can be built upon by Modern Awards or by enterprise agreements
(see below).
Employees must be paid at least the minimum wage provided in the relevant award or agreement. If
they aren’t covered by an award or agreement, they must be paid at least the national minimum
wage.
Unlike employees, independent contractors aren’t entitled to minimum wages or conditions such as
annual leave, sick leave and notice of termination that are in the NES or a Modern Award.
197
In addition to the minimum wages and conditions set by the NES and modern awards, the FW Act
also affords employees and independent contractors’ protections of certain rights including:
‘workplace rights’;
the right to engage in industrial activities;
the right to be free from unlawful discrimination; and
the right to be free from undue influence or pressure in negotiating individual
arrangements.
Workplace rights include where a person:
is entitled to a benefit or has a role or responsibility under a workplace law, workplace
instrument (such as an award or agreement) or an order made by an industrial body;
is able to initiate or participate in a process or proceedings under a workplace law or
workplace instrument; or
has the capacity under a workplace law to make a complaint or inquiry:
o to a person or body to seek compliance with that workplace law or workplace
instrument; or
o if the person is an employee, in relation to their employment.
These rights are protected from certain unlawful actions, including (but not limited to) adverse
actions as specified in the FW Act,510 coercion, misrepresentations and undue influence or pressure.
All states, except Western Australia, referred workplace relations powers for the private sector to
the Australian Government, starting on 1 January 2010.
The Australian Government has put in place a national workplace relations system for the private
sector. Approximately 96 per cent of all private sector employers and employees are covered by the
FW Act.
The FW Act is principally supported by the Commonwealth’s constitutional powers in relation to
constitutional corporations (that is, trading, financial and foreign corporations), interstate trade and
commerce and the territories.
The FW Act’s operation is extended by referrals of workplace relations power from all states except
Western Australia to the Commonwealth in relation to private sector employers otherwise outside
Commonwealth power (e.g. unincorporated employers) with effect from 1 January 2010. Most
states have retained workplace relations coverage of public sector and local government employees
and some states also have coverage of specified public sector corporations.
Western Australia has elected not to join the national system. In Western Australia the FW Act
applies to employers that:
are constitutional corporations;
510 See section 342 of the Fair Work Act 2009.

198
employ certain flight crew, maritime or waterside employees in interstate or international
trade or commerce; and
are Commonwealth agencies or authorities.
State referrals of workplace relations powers relate to employees and in some circumstances,
outworkers in the textiles, clothing and footwear sector. Referrals do not relate to ‘owner drivers’
that are independent contractors.
The Commonwealth, referring states and the territories signed the Multilateral Inter-Governmental
Agreement for a National Workplace Relations System for the Private Sector (IGA), which outlines
the principles of the national system and the roles and responsibilities of the parties. Under the IGA,
any amendment to the FW Act requires consultation between the Commonwealth, referring states
and the territories.
Many private sector employees and employers in Victoria have worked under the Commonwealth
system since 1996. The Victorian Parliament passed legislation in 2009 giving effect to a new referral
of workplace relations matters to the Commonwealth from 1 July 2009.
Modern awards
A Modern Award is an enforceable instrument that sets out minimum wages and conditions for an
industry or occupation in addition to any legislated minimum terms, and provides a benchmark for
assessing enterprise agreements before approval (see below).
Modern Awards apply on top of the NES and cover things like pay, hours of work, rosters, breaks,
allowances, leave, penalty rates, overtime and procedures for consultation, representation and
dispute settlement.
The FWC has responsibility for making and varying awards in the national workplace relations
system.
Employees in the road transport industry are covered by four Modern Awards:
1. Road Transport and Distribution Award 2010
2. Road Transport (Long Distance Operations) Award 2010
3. Transport (Cash in Transit) Award 2010
4. Waste Management Award 2010
Of these awards, the Road Transport and Distribution Award 2010 and Road Transport (Long
Distance Operations) Award 2010 provide the broadest coverage for employees in the road
transport industry.
These awards cover a number of matters such as hours of work, minimum rates of pay, allowances,
leave, and consultation and dispute resolution.
Enterprise agreements
Enterprise agreements are agreements made at an enterprise level between employers and
employees. An enterprise agreement sets out the minimum wages and conditions for a workplace.
When an agreement is in place, it will usually apply instead of the relevant modern award.
199
Enterprise agreements can include a broad range of matters such as:
rates of pay;
employment conditions e.g. hours of work, meal breaks, overtime;
consultative mechanisms;
dispute resolution procedures; and
deductions from wages for any purpose authorised by an employee.
Enterprise agreements cannot, however, include unlawful content prohibited by the FW Act, such as
discriminatory or objectionable terms.
The FWC can assist in the process of making enterprise agreements, can deal with disputes arising
under the terms of agreements, and assess and approve agreements.
Before approving an enterprise agreement, the Commission must ensure, among other things, that
the agreement or variation passes the ‘better off overall’ test. This test requires that each of the
employees to be covered by the agreement are better off overall than under the relevant modern
award.
Independent Contractors Act 2006 (Cth)
The Independent Contractors Act 2006 (IC Act) provides a national unfair contracts system for
independent contractors, such as owner drivers. The IC Act gives effect to Government policy that
independent contractors should be subject to commercial, and not industrial relations, law. To the
extent that it is constitutionally possible, the IC Act overrides state and territory laws that require
independent contractors to be treated as employees or provide employment-like entitlements,
unless a specific exemption has been granted.
Even if an owner driver is an independent contractor under common law, certain state and
Commonwealth legislation may still classify the owner driver as an employee for specific purposes.
This includes superannuation, WHS, workers compensation and payroll tax.
The IC Act does not override these laws. For the IC Act to apply to a services contract, one of the
parties to the contract must be either the Commonwealth, or a corporation incorporated in
Australia, or the contract must refer to work carried out in a territory. The contract must also be for
services to be provided by the independent contractor. In the case of owner drivers, this service is
the provision of transport services.
The IC Act allows for the Federal Court or the Federal Magistrates Court to review contracts, and to
vary, or set aside, the contract if it is found to be unfair or harsh. In deciding whether a contract is
unfair or harsh, the Court may consider the following:
The terms of the contract when it was made.
The relative bargaining strengths of the parties to the contract.
Any undue influence, pressure or unfair tactics which may have been used.
Whether the total remuneration paid to the independent contractor is less than an
employee doing the same work would have received.
Any other relevant matters.

200
Every owner driver in Australia has access to the unfair contract regime under the IC Act, provided
their service contract falls within the scope of the IC Act. Owner drivers in Victoria, NSW and
Western Australia may have additional unfair contract protections created under specific, state-
based, owner driver legislation.511
Independent contractor disputes that involve general commercial matters are usually heard in state
or territory courts or tribunals, including small claims divisions. Small claims processes are informal
and aim to keep costs low.
In NSW, Victoria and Western Australia, the rights of owner drivers are protected by state-specific,
owner driver legislation. The IC Act specifies that these laws are exempt from being overridden by
the IC Act. Without the exemption, the IC Act would prevent these state-based laws applying to
owner drivers (independent contractors) because they provide employee-like entitlements for
owner drivers.
Competition and Consumer Act 2010 (Cth)
The Competition and Consumer Act 2010 (CC Act) (formerly the Trade Practices Act 1974) provides
the legal framework for Australia’s competition and consumer policy rules. Competition and
consumer laws are designed to make markets work efficiently for the benefit of consumers.
The CC Act applies to the activities of corporations. The competition provisions also apply to other
businesses, through the application of the Competition Code in state and territory laws.
The CC Act includes:
Anti-competitive conduct (Part IV): Corporations are prohibited from engaging in certain
anti-competitive conduct. Rather than seeking to directly regulate particular outcomes of a
market, such as price or output levels, the CC Act instead promotes competitive markets. In
some cases, certain conduct which would otherwise be a breach of the CC Act may be
authorised provided there is a public benefit.
Fair trading and consumer protection (Schedule 2 – the Australian Consumer Law): The CC
Act sets out rules regulating business conduct towards consumers and other businesses, and
provides for consumer protection through rules on consumer rights in transactions and
product safety regulation.
Collective bargaining
The competition laws in the CC Act generally require businesses to act independently of their
competitors when making decisions about pricing, which firms they do business with, and the terms
and conditions of doing business. Competitors who act collectively in these areas are at risk of
breaching the competition provisions of the CC Act.
Collective bargaining is an arrangement where two or more competitors come together to negotiate
with a supplier or a customer over terms, conditions and prices. A group of businesses may
511 See the discussion on state owner driver legislation in Appendix 4 of this report.
201
sometimes appoint a representative, such as an industry association, to act on its behalf in the
negotiations.
In some circumstances, allowing collective arrangements may be in the public interest. For example
smaller businesses can face challenges when negotiating with larger businesses and the outcomes
from these negotiations may not be the most efficient or optimal. By getting together, small
businesses may have a better opportunity to have input into negotiations than if they stay on their
own.
The CC Act therefore allows protection from legal action to be granted to parties to engage in
anti-competitive conduct, including collective bargaining, when there are public benefits that would
outweigh the detriments to competition.
For a proposed collective bargaining arrangement, businesses can lodge an application for
authorisation to obtain protection from legal action under the cartel and anti-competitive conduct
provisions in the CC Act. In some cases, as an alternative to lodging an application for authorisation,
businesses may be able to lodge a collective bargaining notification. The protection from legal action
provided by a collective bargaining notification commences automatically 14 days after the
notification is validly lodged, unless the ACCC objects to the notification within the 14 day period.
The authorisation process is likely to be more suitable than lodging a notification for a proposed
collective bargaining arrangement when:
all members of the bargaining group cannot be identified or might change over time;
there is more than one supplier or customer (target) with whom the group wishes to
negotiate;
the annual value of the transactions each member of the bargaining group will have with the
target is greater than $3 million (the transaction threshold differs for some industries); or
the exemption is required for more than three years.
Unconscionable conduct
Under the CC Act businesses must not engage in ‘unconscionable conduct’ when dealing with other
businesses or customers.512 Although unconscionable conduct does not have a precise legal
definition, it is generally accepted to mean conduct which should not be done in good conscience.513
Business behaviour may be deemed ‘unconscionable’ if it is particularly harsh or oppressive, and is
beyond hard commercial bargaining.514
When assessing whether conduct is ‘unconscionable’ a court will consider:515
a) The relative bargaining strength of the parties;
512 See Schedule 2, Part 2-2 ‘Unconscionable Conduct’.
513 Australian Competition and Consumer Commission, ‘Unconscionable Conduct’, Australian Competition and
Consumer Commission [webpage], http://www.accc.gov.au/business/anti-competitive-behaviour/unconscionable-conduct (accessed on 7 April 2014) 514
ibid 515
ibid
202
b) Whether any conditions were imposed on the weaker party that were not reasonably
necessary to protect the legitimate interests of the stronger party;
c) Whether the weaker party could understand the documentation used;
d) The use of undue influence, pressure or unfair tactics by the stronger party;
e) The requirements of applicable industry codes;
f) The willingness of the stronger party to negotiate; and
g) The extent to which the parties acted in good faith.
If a court determines that unconscionable conduct has occurred, a variety of remedies may be
ordered including:516
a) Compensation for loss or damage.
b) Financial penalties.
c) Having the contract declared void in whole or in part.
d) Having the contract or arrangement varied.
e) A refund or performance of specified services.
CC Act exemptions under Commonwealth, state or territory legislation
Commonwealth, state and territory Acts and regulations are able permit conduct that would
normally contravene the competition laws, in accordance with subsection 51(1) of the CC Act.
The scope of exemptions is limited in several respects under section 51 of the CC Act, including:
the authorising provision must expressly refer to the CC Act in order to be regarded as
specifically authorising something;
apart from a Commonwealth statute, a law or regulation may not except something from
the operation of sections 50 or 50A (prohibition of acquisitions that would result in a
substantial lessening of competition); and
regulations will be effective for only 2 years after they are made, and any similar regulation
made after that time will be ineffective.
In accordance with subsection 51(1) of the CC Act, section 37A of the RSR Act provides an exemption
from most competition laws for:
anything done in accordance with an approved road transport collective agreement by the
participating driver, a contractor driver (who is providing applicable services to the
participating hirer) or their representatives;
entry into an approval-pending road transport collective agreement by a hirer or potential
hirer of contractor drivers and contractor drivers; and
anything done by a hirer or potential hirer, a contract driver or their representatives in
preparation for, or incidental to, entry into an approval-pending road transport collective
agreement.
516 ibid

203
The practical effect of this exemption is to allow collective action that may otherwise be prohibited
by the cartel conduct and other provisions of the CC Act, without the need for ACCC authorisation or
notification.
However, the exemption also provides that it does not extend to authorising primary or secondary
boycott conduct (such as subsection 45(2) and section 45D of the CC Act). Such conduct would still
require ACCC authorisation or notification to be legal.
204
Appendix 6: Additional stakeholder concerns regarding duplication
and overlap
Regulatory overlap was a major concern raised by stakeholders in relation to the RSR Act. A number
of submissions to the Review expressed concern that the RSR Act has substantial potential to
undermine, duplicate and overlap with the FW Act and existing WHS and road transport laws, and
that this in turn will increase the regulatory burden on the road transport industry.
Coverage and scope of the Road Safety Remuneration Act 2012
Coverage
As noted elsewhere, the vast majority of Australian employees are covered by the FW Act. This
coverage was achieved through a combination of the Commonwealth's Constitutional corporations
power and referrals of power to the Commonwealth by all states except Western Australia.
However, the position of the RSRS is somewhat different. As noted by the Australian Risk Policy
Institute, the Commonwealth Government does not have any “…direct power to deal with self-
employed drivers or interstate road contracts… The constitutional responsibility to act in this area is
instead a core responsibilities [sic] of the states.”517
Therefore, in order to provide a single national approach to the issue of driver remuneration, the
Commonwealth had to rely on a combination of Constitutional powers when trying to establish a
national RSRS, including the corporations power (Section 51(xx)), the trade and commerce power
(Section 51(i)), the power to regulate entities of the Commonwealth and Commonwealth
authorities, and the territories power. 518 As a result, the RSR Act applies to employees and
contractor drivers where they are working for a constitutional corporation, on interstate deliveries
or in the Australian Capital Territory or Northern Territory.
However, in the absence of state referrals of power, the Commonwealth’s reliance on Constitutional
powers is unlikely to achieve the same levels of coverage as that of the Fair Work system. This was
acknowledged in the RIS accompanying the Road Safety Remuneration Bill 2011, where achievable
coverage was assumed to be 60 per cent of contractor drivers and 90 per cent of employees. That is,
the Commonwealth view at the time of the introduction of the legislation was that around 40 per
cent of contractor drivers would remain outside the scope of the legislation. Given that, as discussed
previously, this group has historically been at the core of concerns regarding the adequacy of
remuneration levels, this limited coverage is particularly significant.
Despite the intention to provide a single national approach to the issue of driver remuneration via
the RSR Act, these gaps in coverage are likely to persist unless referrals of powers from the states
occur in the future. To some extent, the restricted coverage of the RSR Act is likely to exacerbate
those problems already identified regarding overlapping jurisdiction.
This issue has been highlighted by several stakeholders, including the Ai Group:
517 Submission from Australian Risk Policy Institute, p.3.
518 Refer to the Explanatory Memorandum for Road Safety Remuneration Bill 2011.
205
“The effectiveness of the RSR System is undermined by the limited constitutional capacity of
the Commonwealth Government to regulate the activities of the road transport industry and,
in particular, remuneration and related conditions for independent contractors.
A significant proportion of owner drivers remain outside the potential scope of the RSR
System.” 519
In acknowledging this issue, some stakeholders have also suggested that in order to establish
whether they are covered by the RSRS, many businesses will be required to engage expert industrial
relations or legal advice, thereby incurring substantial compliance cost. This is because determining
whether a business falls within the scope of the RSR Act requires an assessment of whether it:
is a constitutional corporation; or
is engaged in constitutional trade or commerce (i.e. contracting directly with a corporation
or trading across state borders or in a territory);
falls within the meaning of the ‘road transport industry’ of the Road Transport and
Distribution Award 2010 or ‘long distance operations’ of the Road Transport (Long Distance
Operations) Award 2010; and
is an employer, hirer or participant in the supply chain in relation to a road transport driver.
Furthermore, the Victorian Government has argued that there may be circumstances where drivers
move in and out of coverage of the 2014 Order:
“There may be circumstances where owner drivers move in and out of coverage of the Order,
such as where short haul drivers operate in a number of sectors, only some of which are
covered by the Order. This may contribute to uncertainty by industry participants about their
obligations, in particular small operators.”520
Scope
Many of the issues of overlap and duplication identified by stakeholders are directly related to the
scope of the RSR Act and powers conferred upon the Tribunal.
Some stakeholder submissions have suggested that given the extent of the existing regulatory
arrangements targeted at addressing road safety and the extensive potential for overlap between
the activities of the Tribunal and that regulation, it would be desirable for the Tribunal’s powers to
be limited to dealing with remuneration only. For example, ARTIO submitted that:
“…the Tribunal activities be limited to addressing the remuneration-safety link and
complement the COR and WH&S provisions enacted by the States and Territories. Currently
the Road Safety Remuneration Act does not prevent the Tribunal from overriding, extending
or duplicating obligations contained in other legislation.” 521
519 Submission from Ai Group, p.61-62.
520 Submission of Victorian Department of Treasury and Finance, p.10.
521 Submission of Australian Road Transport Industrial Organisation, p.12.
206
The Australian Livestock and Rural Transporters Association (ALRTA) generally shared this view, to
the extent that the continuation of the Tribunal was considered necessary, but did not specify what
the powers should be limited to, while the ANRA went further to suggest that the Tribunals powers
should be restricted to contracts involving small independent contractors:
“ANRA submits that if the Road Safety Remuneration System is retained it would be better
placed to focus on small operators only. By focusing on small operators the Road Safety
Remuneration System would not interfere with competitive bargaining processes between
large consignees and consignors.” 522
Interaction of the RSR Act with other legislation
A key concern raised was the ability of the RSR Act to override the provisions of a range of existing
laws, in a context in which those laws have been developed and revised over a long period and
through processes involving extensive consultation and harmonisation. Related to this is the concern
that the RSR Act has been adopted prior to the full impacts and benefits of those reforms being
realised, much less assessed. Several ongoing industry strategies and reviews aimed at improving
safety outcomes were highlighted in this context, including the CoR Taskforce, the National Road
Safety Strategy 2011–2020 and the Australian Work Health and Safety Strategy (2012-2022).
Sections 10 to 13 of the RSR Act: Prevalence in instances of inconsistency
A number of stakeholders highlighted the importance of sections 10 to 13 of the RSR Act in giving
rise to what they saw as substantial elements of duplication, overlap and inconsistency between the
RSRS and other regulation. Thus, the following discusses the content of these provisions and
summarises stakeholder views on this particular aspect of the RSR Act.
Section 10 of the RSR Act provides that the Act is not intended to exclude or limit the operation of
Commonwealth, state and territory laws that are capable of operating concurrently with the Act,
including state-based owner driver and WHS legislation, the HVNL and the FW Act. However,
section 11 of the RSR Act provides that an enforceable instrument made under the Act, such as a
RSRO, prevails over state laws to the extent of any inconsistency. This would include state laws such
as the HVNL and WHS acts.
With regard to employee drivers, section 12 of the RSR Act also provides that a term of an
enforceable instrument made under the Act (i.e. a RSRO) prevails over a term of a modern award,
enterprise agreement, FWC order or transitional instrument to the extent it is more beneficial to the
driver. Thus, where there is a difference between a term in a modern award or enterprise
agreement and an enforceable instrument, an employee driver should receive whichever
entitlement is the more beneficial. This raises the likelihood that, should the Tribunal make
significant use of its powers to specify remuneration through a RSRO in respect of employee drivers,
the existing awards covering this group will take on a ‘residual’ nature and be rendered increasingly
irrelevant in practice.
522 Submission from Australian National Retailers Association, p.6.

207
Section 13 of the RSR Act provides that owner drivers are entitled to at least the remuneration and
conditions in an applicable enforceable instrument made or approved by the Tribunal (i.e. a RSRO,
an approved road transport collective agreement or an arbitration order), regardless of the terms of
any contract to which the driver is a party. This applies to agreements made under NSW, Victorian
and Western Australian owner driver legislation.523 Thus, despite the obvious potential benefits of
these clauses to drivers, they also have the potential to introduce significant complexity, confusion
and uncertainty, both in relation to contracts with owner drivers and in relation to payment
arrangements for employee drivers and thereby increase the regulatory burden for industry
participants. A potentially significant issue in this regard is that of how ‘more favourable’ terms are
to be assessed in circumstances in which different payment arrangements are specified in an award
(or a contract) and a RSRO.
Where a term of a RSRO is not inconsistent with a state or territory law that deals with the same
issue, businesses would be expected to comply with both laws. This would effectively result in dual
obligations under the RSRO and state systems and was a particular concern outlined in a number of
submissions, including those from state and territory governments. Stakeholders noted that the
clauses would not only cause complexity in determining which obligations apply to particular
engagements and how they may be satisfied, but may also require parties to seek legal advice and
assistance to determine whether any change in practices is required. On this issue, the Victorian
Government indicated that:
“There are areas of overlap in the coverage and content of the Order and the Victorian Act,
instruments and other State regulation. This may lead to some duplication of obligations
under the various systems, as well as some complexity in determining which obligations
apply to particular engagements.” 524
These concerns were shared by the NSW Government, which stated:
“The concurrent operation of these State and Commonwealth provisions could create
significant duplication of regulation which is a matter of material concern to the NSW
Government and NSW stakeholders. Duplication generally leads to uncertainty and confusion
for stakeholders and may increase costs that are passed on to consumers.” 525
The Ai Group was similarly critical of the RSR Act regarding overlap with state owner driver systems:
“The operation of section 11 of the RSR Act raises complex questions about the validity of
elements of State systems and the utility in maintaining State systems. At the very least, the
continued operation of the RSR System will likely result in further complexity and uncertainty
for parties that operate in such jurisdictions.” 526
Regarding the NSW system in particular, the Ai Group noted that:
523 Section 33(2) of the RSR Act makes it clear that collective agreements made under State laws are not road
transport collective agreements made pursuant to the Act. 524
Submission from the Victorian Department of Treasury and Finance, p.9. 525
Submission of New South Wales Department of Industrial Relations, p.3. 526
Submission of Ai Group, p.45.

208
“…the operation of the RSR Act does not of itself oust the operation of the jurisdiction.
Instead RSROs, Road Safety Collective Agreements and the capacity for the RSR Tribunal to
perform certain dispute settlement functions give rise to complex questions and uncertainty
regarding the continued validity of elements of the NSW system.” 527
The Ai Group also indicated that it believes the operation of section 12 of the RSR Act has the
potential to cause significant uncertainty and complexity in determining employee conditions:
“The interaction between enforceable instruments and the laws applicable to employees
referred to in section 12 is particularly problematic. The section necessitates a potentially
subjective assessment of the ‘benefit’ of the relative terms. It also appears to dictate that the
test must be applied in the context of ‘…a particular driver’. Accordingly the test must be
applied to the specific circumstances of individuals. Depending on the terms of RSROs that
may ultimately be developed by the RSR Tribunal there is the potential for section 12 to result
in very uncertain and varying outcomes.
…It is unclear how section 12 of the RSR Act will apply in situations where an enforceable
instrument may be made setting a rate of pay for the performance of a particular activity
while an award or enterprise agreement might set a level of remuneration, such as a cents
per kilometre rate, that takes the performance of such activities into account without
prescribing that they attract separate payment. For example, the Road Transport (Long
Distance Operations) Award 2010 sets kilometre rates that take into account that drivers
often perform additional duties and have additional responsibilities such as arranging loads,
purchasing spare parts, tyres etc. but does not prescribe a separate payment for such
activities. It would be very difficult to determine which term was more or less beneficial.”528
The ALC also identified the operation of section 12 of the RSR Act as an area of concern, particularly
with regard to safe driving plans mandated under the 2014 Order:
“…one question is whether section 12 of the Act, which provides that the terms [of] an RSRO
effectively override a modern award or enterprise agreement where the terms are ‘more
beneficial’, means that the safe journey plans determined in enterprise agreements are
ousted and the RSRO becomes the requirement to be followed?” 529
It has also been asserted in submissions that compliance with a RSRO would not necessarily
guarantee compliance with other overlapping legislation. The Victorian Government highlighted
several scenarios in which this issue could arise, in particular in relation to WHS legislation. For
example, the 2014 Order requires the preparation of ‘safe driving plans’, however the Victorian
Government argued that:
“…successful implementation of a safe driving plan under the Order may not, of itself, equate
to full compliance with OHS duties… For example it is unclear whether the contents of the
527 ibid, p.44.
528 ibid, p.35.
529 Submission from Australian Logistics Council, p.8.
209
Fatigue Risk Management System to be recorded under clause 10.6(e) of the Order will be
consistent with the current state of knowledge, for example, as set out in WorkSafe Victoria’s
guidance material on fatigue management prevention in the workplace.” 530
This issue was also identified in the submissions of the ALC. Conversely, the ARTIO identified the
possibility that compliance with a state law would not necessarily guarantee compliance with a
RSRO:
“Many operators would in some form utilise safe driving plans, have drug and alcohol
policies and undertake training to comply with WH&S obligations. Such policies are
implemented by operators utilising best practice principles. However the very prescriptive
nature of the RSRO in relation to some of these provisions means that in many cases their
current practices may not comply with the RSRO and or systems currently utilised to manage
risks may not be recognised, even though those practices may be consistent with and comply
with other legislative obligations.”531
The Ai Group has also argued that section 12 of the RSR Act undermines the operation of the FW Act
and the FWC regarding employee driver terms and conditions, since any RSRO issued by the Tribunal
overrides modern awards and enterprise agreements made under FW Act and approved by the
FWC. This argument was echoed by the NFF:
“Any argument that the wages and conditions for employees in the road transport industry
are not fair, relevant or safe is an argument that the FW Act and the modern award system
have not delivered fairness.” 532
Likewise, a number of other stakeholders have also referred to the potential for the RSR Act to
overlap with and undermine other legislation, such as the HVNL and WHS laws. For example, the Ai
Group stated:
“The RSR System undermines the benefits of regulatory simplification flowing from the move
towards a single rule book (the HVNL), administered and overseen to a great extent by a
single regulatory body, the National Heavy Vehicle Regulator.” 533
Meanwhile, the Victorian Government also highlighted the potential for the RSR Act and RSRO to
undermine Victorian legislation and the HVNL:
“It is important that the operation and objectives of the Victorian OHS Act and Regulations
and other laws are not undermined as a result of the application of the Order, and that
benefits to be achieved in terms of red tape savings from implementation of the HVNL are
530 Submission from the Victorian Department of Treasury and Finance, p.13.
531 Submission from Australian Road Transport Industrial Organisation, p.4.
532 Submission from National Farmers Federation, p.12.
533 Submission from Ai Group, p.55.

210
not diminished. The HVNL is intended to reduce duplication and inconsistencies across State
and Territory borders and cut costs, red tape and confusion.” 534
Conversely, the TWU did not share other stakeholders’ views that the RSR Act potentially overlaps
and duplicates existing legislation. Rather, the TWU is of the opinion that the system established via
the RSR Act constitutes the only way to effectively address the link between driver remuneration
and safety:
“All of the evidence indicates that the key to solving the industry’s safety crisis is to look
vertically up transport supply chains and focus on the role, power and influence of industry
clients. The Road Safety Remuneration Tribunal’s ability to focus on the high level of
influence and control that is exercised by clients means that it is the only system that can
effectively address the safety concerns in the road transport industry.
It is also worthwhile noting that the Tribunal is the only body capable of examining the
vertical causes of truck deaths in a forward looking capacity instead of desperately seeking to
assign blame after a horrific fatality has occurred – a limitation that characterises most chain
of responsibility legislative endeavours.
“The TWU made submissions upon the initial making of modern awards to the effect that the
suite of safety matters identified in the body of evidence be contained in the proposed new
Federal instruments. The TWU’s submissions were rejected on the basis that safety matters
and matters extending beyond the direct employment relationship, such as supply chain
provisions (other than in the textiles clothing and footwear sector) could not be included as
provisions in modern awards. The TWU made no submission regarding owner drivers as it
was clear that owner driver provisions could not be contained in a modern award.
Further, the TWU has made ongoing attempts to have OHS regulators and OHS laws
recognise and deal with economic pressures relating to the performance of road transport
work, which the evidence indicates have a negative influence on safety outcomes. The
consistent response from both regulators and governments, however, is that rates of pay and
economic considerations are and should remain beyond the scope of OHS laws.
In short, the modern award system is incapable of including matters directly relating to safety, owner drivers or supply chain participants (other than for textile, clothing and footwear workers), and OHS systems do not deal with rates/economic issues.” 535
Section 20 of the RSR Act: ‘necessary’ overlap
Section 20 of the RSR Act outlines a number of matters that the Tribunal must have regard to when
deciding whether to make a RSRO, including the need to avoid any "unnecessary overlap" with the
FW Act and any other laws prescribed by regulation, and to reduce the compliance burden on the
road transport industry. However, as pointed out by ARTIO and ALC in their submissions, section 20
does not prevent the Tribunal from determining that regulatory overlap is ‘necessary’ or warranted.
534 Submission from the Victorian Department of Treasury and Finance, p.14.
535 Submission from the Transport Workers Union, pp.7-9.

211
Because of this there is significant scope under the Act for the Tribunal to issue RSROs that
‘necessarily’ overlap and potentially override existing laws. On this, Ai Group suggested that:
“…the provision falls well short of an obligation on the Tribunal to ensure there is no overlap
with obligations under other laws or instruments, or of imposing a positive obligation on the
Tribunal to develop an RSRO which would have the effect of reducing the level of regulation
imposed on industry. Moreover, such considerations are merely factors to be balanced
against other relevant considerations. The Tribunal is afforded significant discretion to
determine how much weight will be placed on such matters.” 536
The practical impact of this issue was evident during the Tribunal’s deliberations prior to issue of the
2014 Order where, although the Tribunal considered potential overlap of the Order with
Commonwealth and state and territory laws on a number of matters, it nonetheless determined that
there was no ‘unnecessary’ overlap or inconsistency between the 2014 Order and existing laws. With
regard to the training and drug and alcohol policy clauses of the 2014 Order, the Tribunal
determined that:
“While some suggested the training clause and the drug and alcohol policy clause in the draft
RSRO unnecessarily overlapped with the prescribed laws [for the purposes of s.20(g) of the
RSR Act], we are not persuaded that is so. In any instance, the training clause and the drug
and alcohol policy clause recognise the broad context in which the prescribed laws operate
and provide needed specificity within that context.” 537
While on the matter of the adverse conduct provisions of the 2014 Order, the ALC stated:
“There also appears to be no consideration given by the Tribunal as to the cost involved in
duplication.
For instance, parties to proceedings indicated that the adverse conduct provision of the RSRO
largely replicated general protection provisions contained in the Fair Work Act 2009.
Yet the clause was inserted.” 538
The Victorian Government was also critical of the Tribunal’s reasoning regarding ‘necessary’ overlap,
stating:
“The Tribunal’s decision accompanying the Order does not clearly answer the question as to
whether the obligations imposed by the Order are necessary given the concurrent operation
of State-based laws, or whether they represent an increase in regulatory burden that is not
sufficiently offset by an increase in safety standards.” 539
536 Submission from Ai Group, pp.35-36.
537 Full Bench Decision of 17 December 2013 making the Road Transport and Distribution and Long Distance
Operations Road Safety Remuneration Order 2014, [2013] RSRTFB 7, [421].. 538
Submission from the Australian Logistics Council, p.8. 539
Submission from the Victorian Department of Treasury and Finance, p.16.
212
The role of existing legislation and regulators
In voicing the concerns regarding overlap discussed above, several stakeholders noted that they did
not object to the use of instruments such as safe driving plans, driver training and drug and alcohol
policies and recognised their potential role in improving safety in the road transport industry.
Indeed, they argued that existing legislation, as well as industry practice, means that such
instruments are already in widespread use. The Tribunal itself lends support to this view, insofar as it
lists a number of instances in its decision accompanying the 2014 Order where safe driving plans,
driver training and drug and alcohol policies are already standard practice within the road transport
industry. 540
However, a primary concern raised in submissions from both industry groups and governments was
the ability of the RSRS to cut across a number of regulated fields. It was argued that a formerly
relatively clear delineation of regulatory responsibilities for road transport, safety and industrial
matters risks being significantly blurred as a result of the operations of the Tribunal. In this context,
there were strong arguments presented that any perceived gaps in the regulation of non-
remuneration based safety issues should be pursued via the pre-existing legislative structure rather
than via the use of RSROs to deal with non-remuneration related issues.
For example, the Ai Group stated:
“The focus should be on achieving compliance with existing laws and instruments which
directly address safety and on the performance of road transport operations. This must
involve greater efforts to promote education and strong enforcement of existing laws,
particularly the FW Act, the HVNL and work health and safety laws.” 541
The NFF recommended:
“Education and enforcement of the existing laws needs to be a key focus. It is simplistic to
perceive increases in remuneration as the silver bullet which will strike down problems of
safety in the road transport industry. Such an approach will also be counterproductive to a
range of important new measures to improve safety which have already been implemented
and which need to be supported plus given time to work, including:
The new national work health and safety laws;
Chain of responsibility laws; and
The National Heavy Vehicle Regulator.” 542
The Northern Territory Government also argued for the use of existing regulatory structures to
address remuneration-related concerns, in preference to the RSRS:
“Instead of a separate and additional legislation and regulatory entity specifically for the
road transport industry, the Northern Territory sees greater benefit in the effective utilisation
540 Road Safety Remuneration Tribunal, op cit
541 Submission from Ai Group, p.63.
542 Submission from the National Farmers Federation, pp.9-10.
213
and as required, strengthening of existing legislative mechanisms outside this System to deal
with matters related to the remuneration and work conditions of road transport workers that
impact on road safety.” 543
A further aspect of this stakeholder support for a focus on greater enforcement and extended
application of existing laws, in preference to continuation of the RSRS approach, was that a number
of stakeholders expressed reservations as to whether the Tribunal had the necessary expertise to
deal with broader safety matters and suggested that existing safety regulators were significantly
better qualified in this regard. The ALC raised this issue in its November 2013 submission to the
National Commission of Audit, and reiterated it again in its submission to this Review:
“ALC has strongly argued that safety issues are best dealt with by specialist laws - in the case
of heavy vehicles the HVNL, administered by specialist regulators - in the case of heavy
vehicles the newly established National Heavy Vehicle Regulator.” 544
The Ai Group also shared this concern:
“It must also be borne in mind that members of the FWC predominantly focus on matters of
an industrial character rather than dealing with the regulation of matters associated with
safety or the performance of on-road activities. In contrast, specialised bodies such as the
National Heavy Vehicle Regulator and Safe Work Australia are far better placed to tackle
issues associated with safety issues.” 545
Disputes about remuneration and ‘related conditions’
The Tribunal has powers under Part 4 of the RSR Act to deal with disputes between employee drivers
and their employer (or former employer), disputes between contractor drivers and their hirer (or
former hirer), and disputes involving supply chain participants.
Sub-sections 41(3) and 41(4) of the RSR Act prevent employee drivers making claims in both the
Tribunal and the FWC, providing that if a claim is made in one court it can only be brought in the
other if the original application has been withdrawn or failed on the grounds that the court does not
have jurisdiction to hear the matter. The intent of these provisions is presumably to prevent ‘forum
shopping’, whereby litigants seek to have their legal case heard in the court thought most likely to
provide a favourable judgment. However, the issue of jurisdiction for disputes is less than clear when
considered in the context of state contractor driver schemes.
Stakeholders have argued that Part 4 of the RSR Act creates jurisdictional overlap with state
authorities, with some disputes potentially able to be pursued through dispute resolution
mechanisms in multiple jurisdictions. This, in turn, adds complexity in that parties may have difficulty
determining which dispute resolution mechanism will be the most appropriate and may even result
in ‘forum shopping’. For example, the Victorian Government noted that:
543 Submission of the Northern Territory Department of Business, Northern Territory WorkSafe, p.3.
544 Submission from the Australian Logistics Council, p.5.
545 Submission from Ai Group, p.26.
214
“There is a potential overlap between disputes which may be dealt with by the [Road Safety
Remuneration] Tribunal, and disputes concerning potential breaches of the Victorian scheme
(which may be referred to the VSBC [Victorian Small Business Commissioner] for mediation,
and where this is unsuccessful, to VCAT [Victorian Civil and Administrative Tribunal]). For
instance, where a dispute relates to payment in lieu of notice on termination, the relationship
between the provisions of the Victorian Act and the Order, and which body could deal with
the dispute, are unclear.”546
The Western Australian Government identified similar concerns:
“There is the potential for some Western Australian owner drivers to have their disputes
heard by either the RSR Tribunal or RFTI [Road Freight Transport Industry] Tribunal and for
confusion in parts of the industry about jurisdictional issues to arise as a result.”547
The Ai Group noted similar issues in NSW regarding potential jurisdictional overlap between the
dispute settlement functions of the NSW IRC and the Tribunal:
“Further potential for overlap exists in relation to RSR Tribunal’s dispute settlement functions
and the operation of the NSW IRC’s dispute settlement functions under Part 4 of the
Industrial Relations Act 1996 [NSW] and the NSW IRC’s capacity to order reinstatement of
contracts of carriage pursuant to section 314 of the [NSW IR] Act.”548
The Ai Group has also indicated that the potential for such overlap may be observed in the Tribunal’s
utilisation of its dispute resolution functions to date:
“…there have only been 5 applications seeking to access the Tribunal’s dispute resolution
services and…the Tribunal has not issued a decision in relation to any dispute.
…It is also not possible to verify whether they [the disputes] were properly within the
jurisdiction of the Tribunal or whether they could have been dealt with through other
previously existing forums, such as through the various mechanisms established under the
FW Act or under the relevant State jurisdictions dealing with independent contractors. There
is significant overlap between such forums.” 549
These stakeholder concerns give rise to a number of other questions and possibilities around
‘primacy’ that would need to be addressed to provide stakeholders clarity as to the ‘default’
jurisdiction for hearing and ruling on certain types of broad disputes. For example, does the primacy
of Commonwealth over state law mean parties will increasingly move toward the Tribunal as the
arbitrator of disputes for fear of decisions of state bodies ultimately being overturned following
applications to the Tribunal by other parties aggrieved at the result? Or, given the potential for co-
existence of Commonwealth and state laws, is there potential for bodies at both the Commonwealth
546 Submission from the Victorian Department of Treasury and Finance, p.12.
547 Submission from the Western Australian Department of Commerce, p.7.
548 Submission from Ai Group, pp.43-44.
549 ibid, pp.23-24.

215
and state level to adjudicate on the same dispute and for their judgements to ‘co-exist’, to the
extent that they are not inconsistent?
Collective bargaining and protections from ‘unconscionable conduct’ and
unfair contracts
The RSR Act provides that where an RSRO applies to contractor drivers, those drivers are able to
negotiate as a group with their hirer or potential hirer for a road transport collective agreement,
which is similar to enterprise agreements made between employees and an employer at an
enterprise level under the FW Act. The RSR Regulations provide further protections in the form of a
code of conduct for negotiation of road transport collective agreements.
Several submissions, including those of the ALC and Ai Group, pointed out that the collective
bargaining provisions of the RSR Act duplicate collective bargaining processes already available to
independent contractors under the Competition and Consumer Act 2010 (Cth).
The ALC also noted that unconscionable or oppressive conduct provisions in the Consumer and
Competition Act 2010 (Cth) already provide businesses with protections from conduct including the
exploitation of vulnerabilities and the use of undue influence, pressure or unfair tactics by the other
party. 550 This view was shared by Master Builders Australia (MBA), which called for greater
enforcement of these provisions as opposed to further regulation through the RSR Act:
“…assertions [about problems with lack of compliance with awards and agreements,
especially among small operators], if true, should trigger a regulatory response to increase
Government endeavours for operators to follow the law as expressed in awards and
agreements and for legal action to be taken against those who unfairly contract with
owner/drivers utilising the provisions about unconscionability in the Consumer and
Competition Act 2011 (Cth) or the civil remedy provisions under the Fair Work Act 2009 (Cth).
In other words, the answer to the problem raised again appears to be greater enforcement of
the existing law rather than the continuation of the Road Safety Remuneration System with
its new rules and unnecessary bureaucracy.”551
It was also suggested in a number of submissions, including those of the MBA, ALC, Ai Group and the
NFF that the unfair contracts provisions of the Independent Contractors Act 2006 (Cth) already
provide independent contractors with avenues to deal with remuneration-related issues without the
need for the Tribunal. In making this argument, the Ai Group referred to the Safe Rates, Safe Roads
Directions Paper,552 which noted that “…every owner driver in Australia has access to the unfair
contracts regime under the IC Act, provided their service falls within the scope of the Act”.
This was summed up by the ALC:
550 Submission from Australian Logistics Council, Attachment 2, p.7.
551 Submission from Master Builders Association, pp.5-6.
552 Australian Government Department of Education, Employment and Workplace Relations (2010), op cit,
p.36.

216
“…bona fide independent contractors are capable of having unfair contracts reviewed by the
Federal Circuit Court under the Independent Contractors Act 2006 and that the Competition
and Consumer Act 2010 permits ACCC to authorise collective bargaining with larger
operators.” 553
2014 Order: Overlap with existing regulatory obligations and instruments
Beyond the high level observations noted above, almost all of the specific clauses of the 2014 Order
were identified in stakeholder submissions to this Review, and to the Tribunal during deliberations
on the Order, as overlapping or duplicating - and in many cases being inconsistent with - existing
provisions in state-based WHS laws and owner driver schemes, and the HVNL. Stakeholder concerns
regarding the various provisions of the 2014 Order are discussed below.
Definitions
Definitions of supply chain parties are not consistent across the Order and HVNL CoR provisions. For
example, the definitions of ‘consignor’ and ‘consignee’ differ, while the 2014 Order definitions of
‘intermediary’ and ‘operator of premises for loading and unloading’ do not directly correspond to
the HVNL.
Dispute resolution
The provisions in the 2014 Order overlap with dispute resolution processes under existing state-
based owner driver schemes (see Section 6.3.1 of this report).
Adverse conduct protection
The ‘Adverse Conduct Protection’ provisions of the 2014 Order overlap with the ‘General Protections
Provisions’ of Part 3-1 of the FW Act, the discrimination and victimisation provisions in section 699 of
the HVNL and state owner driver legislation. For example, the Victorian Government argued that:
“…while both section 61 of the Victorian Act and clause 6 of the Order confer protections on
contractor drivers in respect of adverse (detrimental) conduct, each provision refers back to
entitlements and proceedings under their respective systems and contain a number of other
differences in wording and scope. To the extent that protections under the Victorian Act are
capable of operating concurrently with the Order, there may be two potential avenues of
redress.” 554
Written contracts
The terms of written contracts required under the 2014 Order overlap with similar requirements in
the RTD Award and LDO Award, and state owner driver schemes. For example, both Awards already
regulate various provisions for employee drivers similar to those in the 2014 Order, while the
Victorian and Western Australian owner driver schemes already regulate a number of contract
provisions for owner drivers, including regarding payments, minimum hours, and termination.
553 Submission from Australian Logistics Council, p.6.
554 Submission from the Victorian Department of Treasury and Finance, p.11.

217
Another example is that the 2014 Order requires written contracts in all circumstances, while the
Victorian Owner Drivers and Forestry Contractors Act 2005 only requires them if the term of
engagement is for 30 days or more.555
Other contracts
It was argued that the ‘Other Contracts’ provisions in the 2014 Order are already covered by
obligations under WHS laws and CoR provisions in the HVNL. For example, the HVNL contains a
number of provisions pertaining to the content of contracts, particularly in prohibiting the inclusion
of conditions that may cause or provide incentive for drivers to speed or breach their work and rest
hour requirements. The 2014 Order contains some provisions relating to minimum contract
requirements, which although not necessarily a duplication of requirements, may serve to add
further layers to the regulation of road transport contracts and further compliance burdens on
supply chain participants.556
Additionally, participants in the supply chain already have a number of WHS obligations that would
prohibit them from contracting with another participant in the supply chain in a way that is
inconsistent with the safety requirements in the 2014 Order.557
Safe driving plans
Aspects of the safe driving plan provisions in the 2014 Order were identified as overlapping with
fatigue management requirements under the HVNL and state WHS laws, and similar provisions in
the NSW Mutual Responsibility for Road Safety Contract Determination. For example, on the matter
of safe driving plans the Ai Group noted:
“The content of the first RSRO already calls into question the continuing validity of elements
of the Mutual Responsibility for Road Safety Contract Determination which deals with similar
matters relating to the implementation of safe driving plans and drug and alcohol
policies.”558
While the Victorian Government stated:
“Clause 10 of the Order requires a safe driving plan to be prepared when a road transport
driver is to undertake a long distance operation using a motor vehicle with a GVM of more
than 4.5 tonnes.
Under subclause 10.7(b) (and subject to subclause 10.9), road transport drivers must record
the actual timeframes and distances involved in the provision of the road transport service. It
is noted that existing requirements for heavy vehicle drivers and operators to complete a
555 ibid
556 Confidential submission.
557 ibid
558 Submission from Ai Group, p.43

218
work diary under sections 191S, 191T, 191U and 191X of the Victorian RS Act [Road Safety
Act 1986] mean that similar information is already required to be kept.” 559
WHS training
The WHS training provisions of the 2014 Order were considered to overlap with training
requirements under Commonwealth and state WHS laws, which require the provision of
information, instruction, training or supervision to workers (including contractors) needed for them
to work without risks to their health and safety and that of others around them.
The ALRTA has also criticised the training provisions in the 2014 Order because, despite overlap with
other legislative requirements, they do “…not recognise accumulated workplace safety skills and
experience or other types of WH&S training that may occur under existing industry accreditation
schemes including: TruckSafe, truckcare, Western Australia's fatigue and mass management scheme
or the National Heavy Vehicle Accreditation Scheme.” 560
Drug and alcohol policies
The drug and alcohol policy provisions of the 2014 Order were considered to overlap with
requirements under Commonwealth and state WHS laws, road transport laws prohibiting the
consumption of drugs and alcohol when operating a heavy vehicle, and clauses in the NSW Mutual
Responsibility for Road Safety Contract Determination.
With regard to this overlap, the Victorian Government stated that:
“WorkSafe Victoria has published guidance material: Guidelines for Developing a Workplace
Alcohol Policy, to support compliance with OHS duties. It is important that drug and alcohol
policies developed pursuant to the Order align with WorkSafe Victoria’s published guidelines
in this area.
There is also existing legislation in place prohibiting drug and alcohol consumption when
operating a vehicle. For example, sub-section 49(1)(ba) of the RS Act [Road Safety Act 1986
(Vic)] provides that a person is guilty of an offence if he or she drives a motor vehicle or is in
charge of a motor vehicle while impaired by a drug, and sub-sections 52(1A) and (2) of the RS
Act provide that a person licensed to drive a large vehicle must have a zero concentration of
alcohol in the blood or breath while the person is driving or in charge of a large vehicle.
While the Order requires a drug and alcohol policy to set out the consequences for breaching
the policy, such as education or disciplinary action, different penalties are specified under the
RS Act.
It is noted that the question as to whether the obligations imposed by the Order are
necessary given concurrent OHS and other duties, or whether they represent an increase in
559 Submission from the Victorian Department of Treasury and Finance, p.13.
560 Submission from Australian Livestock and Rural Transporters Association, p.17.

219
regulatory burden that is not sufficiently offset by an increase in safety standards, is not
clearly answered in the Tribunal’s decision accompanying the Order.” 561
The extent of overlap between the 2014 Order and existing legislation was also broadly noted in the
submission from Coles Supermarkets Australia, who stated:
“In delivering a measured RSRO based on extensive evidence led by both union and employer
parties the Tribunal has in the most part traversed ground already covered by an extensive
and largely effective regulatory regime (set out in summary form in Coles’ 22 April 2013
submission at Annexure A to this submission).
That regulatory regime is overseen by multiple regulators across the various states and
territories and includes:
‘chain of responsibility’ legislation in various States and Territories, which imposes
obligations upon supply chain participants in areas such as vehicle safety, speed limits,
driver fatigue management, safety and security of loads, work and rest time, record
keeping, as well as noise and exhaust emissions and road damage issues 5
workplace health and safety legislation in various States and Territories; and
the Fair Work Act 2009 (Cth), which provides employee drivers with minimum conditions
(through awards, enterprise agreements and the NES) and general protections.”
“…Looking forward, the degree of regulatory overlap becomes increasingly pronounced in
light of the impending commencement of the Heavy Vehicle National Law (HVNL). The HVNL
will provide for a generally consistent set of enforceable national supply chain obligations
which specifically address mass requirements; load restraint; dimension requirements and
speed and fatigue management, backed by a regulator with on-road compliance and
enforcement powers in respect of those obligations.
As noted above, a close reading of the Final RSRO shows that much (if not all) of the
obligations go no further than obligations already (properly) dealt with under this existing
legislative scheme.” 562
561 Submission from the Victorian Department of Treasury and Finance, pp.13-14.
562 Submission from Coles Supermarkets Australia, pp.3-4.
220
Bibliography
Abelson, P. (2007), Establishing a Monetary Value for Lives Saved: Issues and Controversies, Paper
prepared for the Office of Best Practice Regulation.
ACIL-Tasman (2003), Freight Rates and Safety Performance in the Road Freight Industry, report
prepared for the SCOTI Working Group 8 April 2003.
AMR Research (2013a) Reform Evaluation in the Road Transport Industry, 2012: Driver Fatigue,
prepared for the National Transport Commission.
AMR Research (2013b) Reform Evaluation in the Road Transport Industry, 2012: Compliance and
Enforcement, and Speed, prepared for the National Transport Commission.
Australian Bureau of Statistics (2013), Causes of Death, Australia, 2012 (Cat. no. 3303.0).
Australian Bureau of Statistics (2013), Employee Earnings and Hours, Australia, May 2012 (Cat. no.
6306.0, Data cube 7).
Australian Bureau of Statistics (2013), Producer Price Index (Cat. no. 6427.0).
Australian Bureau of Statistics (1988, 1991, 1998-2007, 2010, 2012) Survey of Motor Vehicle Use,
various editions (Cat. no. 9208.0).
Australian Bureau of Statistics (2011), 2011 Census of Population and Housing (ABS Cat. no. 2911.0).
Australian Bureau of Statistics (2007), 2006 Census of Population and Housing (ABS Cat. no. 2914.0).
Australian Coalition (2013), The Coalition’s policy for Small Business, Canberra,
http://www.liberal.org.au/our-policies (accessed 7 April 2014).
Australian Competition and Consumer Commission, ‘Unconscionable Conduct’, Australian
Competition and Consumer Commission [webpage], http://www.accc.gov.au/business/anti-
competitive-behaviour/unconscionable-conduct (accessed 7 April 2014).
Australian Government Department of Education, Employment and Workplace Relations (2010),
Safe Rates, Safe Roads: Directions Paper, Canberra.
Australian Institute of Health and Welfare (2012), Serious injury due to land transport accidents,
Australia 2008-09. Injury research and statistics series no. 67. Cat. no. INJCAT 143. Canberra: AIHW.
http://www.aihw.gov.au/publication-detail/?id=10737421997 (accessed February 2014).
Australian Transport Council (2011), National Road Safety Strategy 2011 – 2020.
Belzer, MH., Rodruigez, DA. and Sedo, SA. (2002), ‘Paying for Safety: An Economic Analysis of the
Effect of Compensation on Truck Driver Safety’, Sponsored by Science Applications International
Corporation and Federal Highway Transport Safety Administration, www.ilir.umich.edu/Sweatshops
OnWheels/PayAndSafetyReport.pdf.

221
Britto, Rodrigo A., Corsi, Thomas M. and Grimm, Curtis M. (2010), ‘The Relationship between Motor
Carrier Financial Performance and Safety Performance’, Transportation Journal (American Society of
Transportation and Logistics); Fall 2010, Vol. 49 Issue 4.
Brodie, L., Lyndal, B., and Elias, I. J. (2009), ‘Heavy vehicle driver fatalities: Learning's from fatal road
crash investigations in Victoria’, Accident Analysis and Prevention, 41(3).
Bureau of Infrastructure, Transport and Regional Economics (2013), Fatal Heavy Vehicle Crashes
Australia Quarterly Bulletin, Jan–Mar 2013.
Bureau of Infrastructure, Transport and Regional Economics (2008), Freight Rates in Australia 1964-
65 to 2007-08, Department of Infrastructure, Transport and Regional Development, Canberra 2008.
Bureau of Infrastructure, Transport and Regional Economics (2006), Road Crash Costs in Australia,
Report No. 118, Canberra.
Cantor, DE., Celebi, H., Corsi, TM. and Grimm, CM. (2013), ‘Do Owner–Operators Pose a Safety Risk
on the Nation’s Highways?’, Transportation Research Part E Logistics and Transportation Review, 59
(2013).
Chain of Responsibility Taskforce (2014), Chain of Responsibility Review Assessment of Options
Paper, National Transport Commission, February 2014, http://www.ntc.gov.au/DocView.aspx
?DocumentId=2490 (accessed 7 April 2014).
Chain of Responsibility Taskforce (2013), Chain of Responsibility in the Heavy Vehicle National Law:
Issues Paper, National Transport Commission, 5 July 2013, http://ntc.gov.au/filemedia/Reports
/CORintheHVNLIssuesPaperJul13.pdf (accessed 7 April 2014).
Corsi, T., Barnard, R., and Gibney, J. (2002), Motor Carrier Industry Profile: Linkages Between
Financial and Safety Performance Among Carriers in Major Industry Segments, Paper prepared for
the Federal Motor Carrier Safety Administration, Analysis Division, U.S. Department of
Transportation, Washington, D.C.
Council of Australian Governments (2012), Principles on Directors’ Liability Provisions,
http://www.coag.gov.au/node/434 (accessed 7 April 2014).
Council of Australian Governments (2011), Intergovernmental Agreement on Heavy Vehicle
Regulatory Reform, http://www.coag.gov.au/node/54 (accessed 7 April 2014).
Council of Australian Governments (2004), Principles and Guidelines for National Standard Setting
and Regulatory Action by Ministerial Councils and Standard-Setting Bodies, http://archive.coag.
gov.au/coag_meeting_outcomes/2004-06-25/docs/coagpg04.pdf (accessed 7 April 2014).
Dammen, S.J. (2005), ‘The effects of safety practices, technology adoption, and firm characteristics
on motor carrier safety’, Journal of the Transportation Research Forum, 44 (1).
Deloitte Access Economics (2013), Market Analysis of the Australian Road Freight Transport Sector,
Prepared for Coles Supermarkets Australia, 22 April 2013.
222
Department of Infrastructure and Regional Development (2014), ‘Heavy Vehicle Safety and
Productivity Programme’, Department of Infrastructure and Regional Development [webpage],
http://investment.infrastructure.gov.au/funding/Heavyvehicles/Index.aspx (accessed 7 April 2014).
Department of Prime Minister and Cabinet (2014), The Australian Government Guide to Regulation,
Commonwealth of Australia, Canberra 2014, http://www.cuttingredtape.gov.au/sites/default/files
/documents/australian_government_guide_regulation.pdf (accessed 7 April 2014).
Elkington, J. and Stevenson, M. (2013), The Heavy Vehicle Study: Final Report. http://c-
marc.curtin.edu.au/local/docs/CMARC_HeavyVehicleStudy.pdf (accessed 7 April 2014).
Federal Motor Carrier Safety Administration (2007), Driver Issues: Commercial Motor Vehicle Safety
Literature Review, U.S. Department of Transportation, Washington, D.C.
Federal Motor Carrier Safety Administration (2007), Large Truck Crash Causation Study (Publication
FMCSA-RRA-07-017), U.S. Department of Transportation, Washington, D.C.
Federal Office of Road Safety (1997), Trucks and Road Trauma, Monograph 18,
http://www.infrastructure.gov.au/roads/safety/publications/1997/pdf/Truck_Crash_2.pdf (accessed
7 April 2014)
Flath, D. (1996), Japanese Regulation of Truck Transport, Working Paper No. 119, Center on
Japanese Economy and Business, Columbia Business School, New York, June 2006.
Haworth, N., Vulcan, P. and Sweatman, P. (2002), Truck Safety Benchmarking Study, Paper prepared
for the National Road Transport Commission, http://www.monash.edu.au/miri/research/reports
/oth er/trucksafety.pdf (accessed 7 April 2014).
Henscher, D., Battelino, H., Gee, J. and Daniels, R. (1991), Long Distance Truck Drivers' On Road
Performance and Economic Reward, Federal Office of Road Safety, Report No. CR 99.
Hon. Rob Hulls MP, Minister for Industrial Relations. Second Reading Speech: Owner Drivers and
Forestry Contractors Bill, Legislative Assembly, 21 April 2005.
Hunter, N. and Mangum, S. (1995), ‘Economic Regulation, Employment Relations, and Accident
Rates in the U.S. Motor Carrier Industry’, Labor Studies Journal, Vol. 20, No. 1 (Spring).
Imberger, K., Styles, T., and Walsh, K. (2009), Victorian truck rollover crashes 2003-2007. Paper
presented at the Australasian Road Safety Research Policing Education Conference 10-13 November
2009, Sydney, NSW.
Industrial Relations Victoria (2006), Regulatory Impact Statement: Owner Drivers and Forestry
Contractors Regulations 2006.
Industrial Relations Victoria (2005), Report of Inquiry: Owner Drivers and Forestry Contractors.
Volume 1 – Report and Recommendations, p 10. Victorian Government, February 2005.
223
Main Roads Western Australia, ‘Chain of Responsibility – Overview’, Main Roads Western Australia,
https://www.mainroads.wa.gov.au/Documents/Chain%20of%20Responsibility%20-
%20Overview.RCN-D13%5E23372552.PDF (accessed 7 April 2014).
Mayhew, C. and Quinlan, M. (2006), ‘Economic pressure, multi-tiered subcontracting and
occupational health and safety in the Australian long-haul trucking industry’, Employee Relations
28(3).
Monaco K. and Williams E. (2000), ‘Assessing the Determinants of Safety in the Trucking Industry’,
Journal of Transportation and Statistics, Vol. 3.
Mooren, Lori, Grzebieta, Raphael, Williamson, Ann, Olivier, Jake and Friswell, Rena. (2014), ‘Safety
management for heavy vehicle transport: A review of the literature’, Safety Science, Vol. 62.
Moses, Leon N., and Ian Savage (1994), ‘The effect of firm characteristics on truck accidents’,
Accident Analysis and Prevention, Vol.26, No.2.
Nafukho, M., Hinton, BE. and Graham, CM. (2007), ‘A Study of Truck Drivers and their Job
Performance Regarding Highway Safety’, Performance Improvement Quarterly 20(1).
National Heavy Vehicle Regulator, ‘About Fatigue Management’, National Heavy Vehicle Regulator
[web page], https://www.nhvr.gov.au/safety-accreditation-compliance/fatigue-management/about-
fatigue-management (accessed 7 April 2014).
National Heavy Vehicle Regulator, ‘About the Chain of Responsibility’, National Heavy Vehicle
Regulator [web page], https://www.nhvr.gov.au/safety-accreditation-compliance/chain-of-
responsibility/about-the-chain-of-responsibility (accessed 7 April 2014).
National Heavy Vehicle Regulator, ‘General fatigue obligations – off-road parties’, National Heavy
Vehicle Regulator [web page], https://www.nhvr.gov.au/safety-accreditation-compliance/fatigue-
management/general-fatigue-obligations-%E2%80%93-off-road-parties (accessed 7 April 2014).
National Heavy Vehicle Regulator, ‘Work Diaries’, National Heavy Vehicle Regulator [webpage],
https://www.nhvr.gov.au/safety-accreditation-compliance/fatigue-management/work-diaries-and-
record-keeping (accessed 7 April 2014).
National Transport Commission (2013a), National Transport Reform Implementation Monitoring:
Report to the Standing Council on Transport and Infrastructure, November 2013,
http://www.ntc.gov.au/filemedia/general/NatReformImplemMonRepNov13.pdf (accessed
7 April 2014)
National Transport Commission (2013b), Heavy Vehicle Compliance Review Consultation Draft,
September 2013, http://www.ntc.gov.au/filemedia/Reports/HVComplianceReview2013.pdf
(accessed 7 April 2014).
National Transport Commission (2013c), Developing a Compliance Framework for Heavy Vehicle
Telematics Discussion Paper, December 2013, http://www.ntc.gov.au/DocView.aspx?Document
Id=2463 (accessed 7 April 2014).

224
National Transport Commission (2013d), Preparing Australia for Electronic Work Diaries: Regulatory
Issues Paper, http://www.ntc.gov.au/filemedia/Reports/PrepAustEWDsRegIssuesPaperOct13.pdf
(accessed 7 April 2014).
National Transport Commission with Quinlan, M. and Wright, L. (2008), Safe Payments: Addressing
the Underlying Causes of Unsafe Practices in the Road Transport Industry, October 2008.
National Truck Accident Research Centre (2011), 2011 Major Accident Investigation Report, National
Transport Insurance,
http://www.nti.com.au/files/files/NTARC/2011MajorAccidentInvestigationReport_v10_WS1.pdf
(accessed 7 April 2014)
National Truck Accident Research Centre (2013), 2013 Major Accident Investigation Report, National
Transport Insurance, http://www.nti.com.au/files/files/NTARC/2013_NTI_Major_Accident
_Investigation_Report_-_Web.pdf (accessed 7 April 2014).
New South Wales Industrial Registrar, ‘List of Awards and Contract Determinations as at December
2012’, NSW Industrial Gazette, Supplement to Volume 375.
New South Wales Industrial Relations, ‘Industries and Awards – Transport Industry’, NSW Industrial
Relations [web page], 21 June 2013, http://www.industrialrelations.nsw.gov.au/oirwww/Industries_
and_Awards/Transport_Industry.page (accessed on 7 April 2014).
New South Wales Roads and Maritime (2011), Travel Speeds in Sydney Metropolitan Area,
http://www.rms.nsw.gov.au/publicationsstatisticsforms/downloads/travelspeeds_sydney_metro_ar
ea.html (accessed 7 April 2014).
Northern Territory Department of Transport (2014), National Heavy Vehicle Regulator: Northern
Territory Update, February 2014, http://www.transport.nt.gov.au/__data/assets/pdf_file/0011/
38783/NHVR-Newsletter-February-2014.pdf (accessed 7 April 2014).
OECD (2013), Secretary-General’s Report to Ministers 2013, OECD Publishing,
http://www.oecd.org/about/secretary-general/secretary-general-report-to-ministers-2013.pdf
(accessed 7 April 2014).
OECD (2011), Moving Freight with Better Trucks: Improving Safety, Productivity and Sustainability,
OECD Publishing, http://www.oecd-ilibrary.org/transport/moving-freight-with-better-
trucks_9789282102961-en (accessed on 7 April 2014).
OECD (2009), Regulatory Impact Analysis: A Tool for Policy Coherence, OECD Publishing, Paris.
OECD (2002), Regulatory Policies in OECD Countries: From Interventionism to Regulatory
Governance, OECD Publishing, Paris.
OECD (2002) Safety on Roads: What's the Vision?, OECD Publishing, Paris.
OECD (2001), OECD Economic Studies No. 32: Special Issue - Regulatory Reform, , OECD Publishing,
Paris.

225
OECD (1999), Regulatory Reform in Japan, OECD Publishing, Paris.
Office of Best Practice Regulation (2008), Best Practice Regulation Guidance Note: Value of Statistical
Life, Australian Government Department of Finance and Deregulation, Nov 2008. http://www.dpmc
.gov.au/deregulation/obpr/docs/ValuingStatisticalLife.pdf (accessed 7 April 2014).
Potter, Jeff. (2008), Analysis of International Heavy Vehicle Safety Data. Paper presented by,
National Transport Commission, to the 10th International Symposium on Heavy Vehicle Transport
Technology, 19-22 May 2008, Paris.
PricewaterhouseCoopers (PwC) (2011), Road Safety Remuneration System: Regulatory impact
Statement, November 2011.
Productivity Commission (2006), Road and Rail Freight Infrastructure Pricing: Productivity
Commission Inquiry Report No.41, 22 December 2006.
Quinlan, M. and Wright, L. (2008), Remuneration and Safety in the Australian Heavy Vehicle Industry:
A Review Undertaken for the National Transport Commission.
Quinlan, M. (2001), Report of Inquiry into Safety in the Long Haul Trucking Industry, Report
commissioned by the Motor Accidents Association of New South Wales.
Raftery, SJ., Grigo, JAL. and Woolley, JE. (2011), ‘Heavy Vehicle Road Safety: Research Scan’, Centre
for Automotive Safety Research (CASR) Report Series CASR100, July 2011, CASR, University of
Adelaide.
Rodriquez D., Targa F., Belzer M. (2006), ‘Pay Incentives and Truck Driver Safety: A Case Study’,
Industrial and Labor Relations Review 2006, 59(2).
Royal Society for the Prevention of Accidents (2013), Road Safety and In-Vehicle Monitoring (Black
Box) Technology: Policy Paper, Royal Society for the Prevention of Accidents, February 2013,
Birmingham, UK. http://www.rospa.com/roadsafety/info/black-box-technology.pdf (accessed
7 April 2014).
Safe Work Australia (2012), Australian Work Health and Safety Strategy 2012-2022, http://www.safe
workaustralia.gov.au/sites/swa/about/publications/pages/australian-work-health-and-safety-
strategy-2012-2022 (accessed 7 April 2014).
Safe Work Australia (2012), Guide to the Model Work Health and Safety Act, http://www.safework
australia.gov.au/sites/swa/about/publications/pages/guide-to-the-work-health-and-safety-act-
(accessed 7 April 2014).
Soby, BA., Ball, DJ. and Ives, DP. (1993), ‘Safety Investment and the Value of Life and Injury’, Risk
Analysis, Vol. 13, No. 3, June 1993.
Standing Committee on Transport, National Road Safety Strategy 2011-2020, Department of
Infrastructure [webpage], May 2011, http://www.infrastructure.gov.au/roads/safety/national_road
_safety_strategy/files/NRSS_2011_2020_15Aug11.pdf (accessed 7 April 2014).
226
Standing Committee on Transport Working Group (2003), Heavy Vehicle Safety and Safe Sustainable
Rates for Owner Drivers, May 2003.
Taxi Services Commission, Customers First: Service, Safety, Choice, 2012, http://www.taxiindustry
inquiry.vic.gov.au/final-report-customers-first (accessed on 7 April).
Transport Workers’ Union (2011), Make Our Roads Safer for All Australians: Submission to the House
Standing Committee on Infrastructure and Communications with Regards to the Road Safety
Remuneration Bill 2011, http://www.aph.gov.au/parliamentary_business/committees/house_of_
representatives_committees?url=ic/24nov/subs.htm (accessed on 7 April 2014).
Traynor, TL. and McCarthy, PS. (1993), ‘Economic Regulation And Highway Safety In The Trucking
Industry: A Limited Dependent Variable Analysis’, The Quarterly Review of Economics and Finance,
Vol. 33, Issue 2, Summer 1993.
Victorian Department of Treasury and Finance (2014),‘Key features of the Owner Drivers and
Forestry Contractors Act’, Victorian Department of Treasury and Finance [webpage], http://www.dtf
.vic.gov.au/Victorias-Economy/Transport-and-forestry-industries/Key-features-of-the-Owner-
Drivers-and-Forestry-Contractors-Act (accessed on 7 April 2014).
Western Australian Department of Transport, Discussion Paper Review of the Owner-Drivers
(Contracts and Disputes) Act 2007, November 2013, http://www.transport.wa.gov.au/mediaFiles
/rail-freight/freight_DiscussionPaperReviewODA.pdf (accessed on 7 April 2014).
Western Australian Department of Transport, Western Australian Owner-Drivers Information
Booklet, 2013,
http://www.transport.wa.gov.au/mediaFiles/railfreight/freight_OwnerDrivers_Information_Booklet.
pdf (accessed on 7 April 2014).
Williams, E., and Monaco, K. (2001), ‘Accidents and hours-of-service violations among over-the-road
drivers,’ Journal of the Transportation Research Forum, 40.
Williamson, A. and Friswell, R. (2012), ‘The effect of external non-driving factors, payment type and
waiting and queuing on fatigue in long distance trucking’, Accident Analysis and Prevention, 58,
September 2013.
Williamson, A. and Friswell, R. (2010), External Influences on health and safety outcomes in NSW
long distance trucking, Workcover Assisted Grants Program, Final Report, August 2010.
Williamson, A., Bohle, P., Quinlan, M. and Kennedy, D. (2009), ‘Short Trips and Long Days: Safety and
Health In Short-Haul Trucking’, Industrial and Labor Relations Review, Vol. 62, No. 3.
Williamson, A., Sadural, S., Feyer, A. and Friswell, R. (2001), Driver Fatigue: A Survey of Long Distance
Heavy Vehicle Drivers in Australia, Information Paper CR 198, National Road Transport Commission.
WorkSafe Western Australia, Code of Practice Fatigue Management for Commercial Vehicle Drivers,
2004.