review of thermal recovery technologies for the clearwater ...€¦ · review of thermal recovery...
TRANSCRIPT

Review of Thermal Recovery Technologies for theClearwater and Lower Grand Rapids Formations in the
Cold Lake Area in Alberta
Qi JiangBruce Thornton
Jen Russel-HoustonSteve Spence
Osum Oil Sands Corp.
CIPC Paper 2009-068

Outline
• Commercial Thermal Projects in Cold Lake• Reservoir Characteristics of Taiga Project• Recovery Process Selection for Taiga Project• Performance Forecast for Taiga Project• Conclusions

•CSS has been commercialsince mid 1980s in Clearwater
•IOL and CNRL have acombined thermal productionof over 220,000 Bbl/d (mostlyfrom CSS)
•SAGD has been tested inClearwater since mid 1990s
•Two commercial SAGDprojects by Husky and Shellare still in the early stage
•One commercial SAGDproject in Lower Grand Rapidsby CNRL in Wolf Lake
Commercial Thermal Recovery in Cold Lake
CSS and SAGD are two commercially applied processes
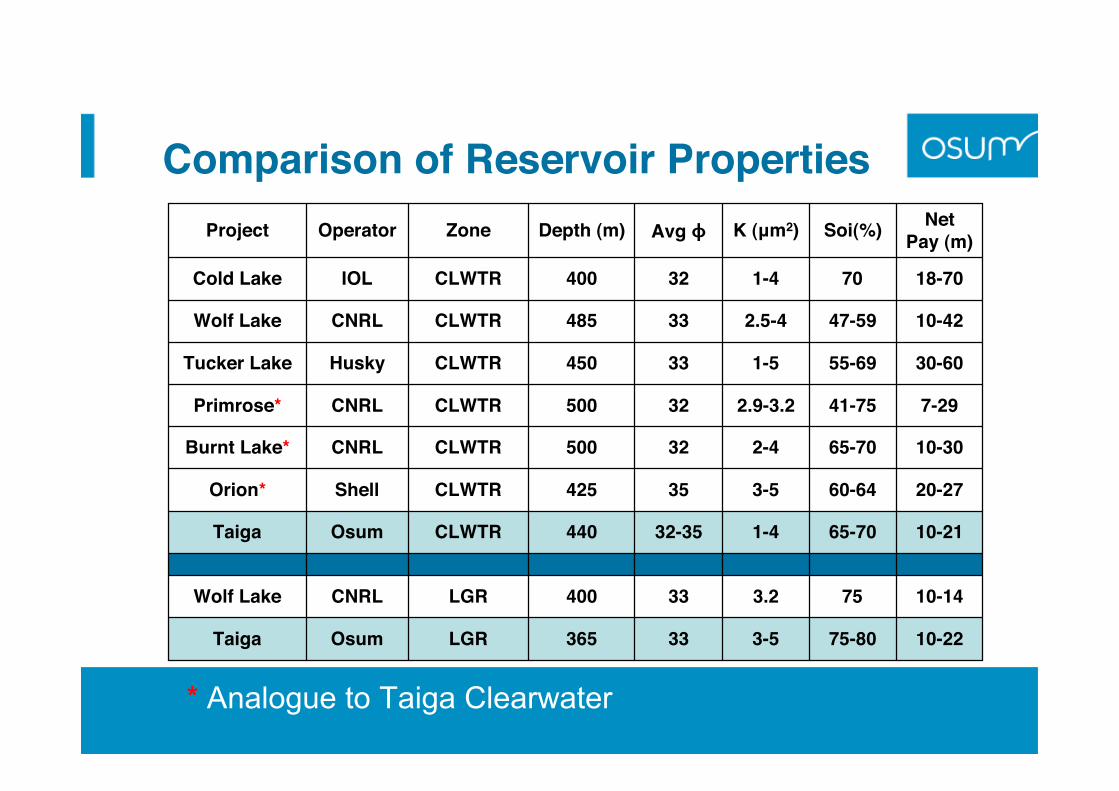
Comparison of Reservoir Properties
30-6055-691-533450CLWTRHuskyTucker Lake
20-2760-643-535425CLWTRShellOrion*
10-2275-803-533365LGROsumTaiga
10-14753.233400LGRCNRLWolf Lake
10-2165-701-432-35440CLWTROsumTaiga
10-3065-702-432500CLWTRCNRLBurnt Lake*
7-2941-752.9-3.232500CLWTRCNRLPrimrose*
10-4247-592.5-433485CLWTRCNRLWolf Lake
18-70701-432400CLWTRIOLCold Lake
NetPay (m)Soi(%)K (μm2)Avg ϕDepth (m)ZoneOperatorProject
* Analogue to Taiga Clearwater
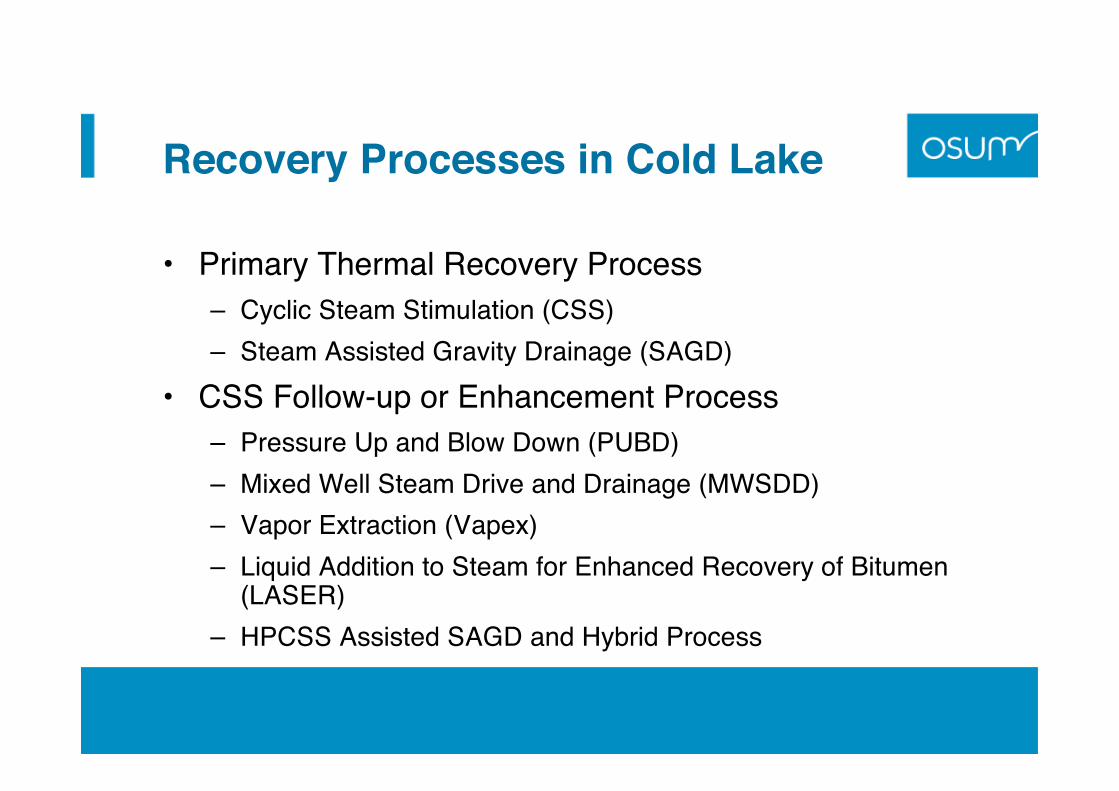
Recovery Processes in Cold Lake
• Primary Thermal Recovery Process– Cyclic Steam Stimulation (CSS)– Steam Assisted Gravity Drainage (SAGD)
• CSS Follow-up or Enhancement Process– Pressure Up and Blow Down (PUBD)– Mixed Well Steam Drive and Drainage (MWSDD)– Vapor Extraction (Vapex)– Liquid Addition to Steam for Enhanced Recovery of Bitumen
(LASER)– HPCSS Assisted SAGD and Hybrid Process

HPCSS in Clearwater Formation– Horizontal and vertical wells– Injection at fracture pressure– 60 m to 180 m spacing for horizontal wells– 2 to 8 Acre spacing for vertical wells– Development as low as 7 m net pay– In areas generally with no to minimal bottom water or top
gas– CSOR: 3.3 to 4.5– Predicted Ultimate recovery:15 to 35%
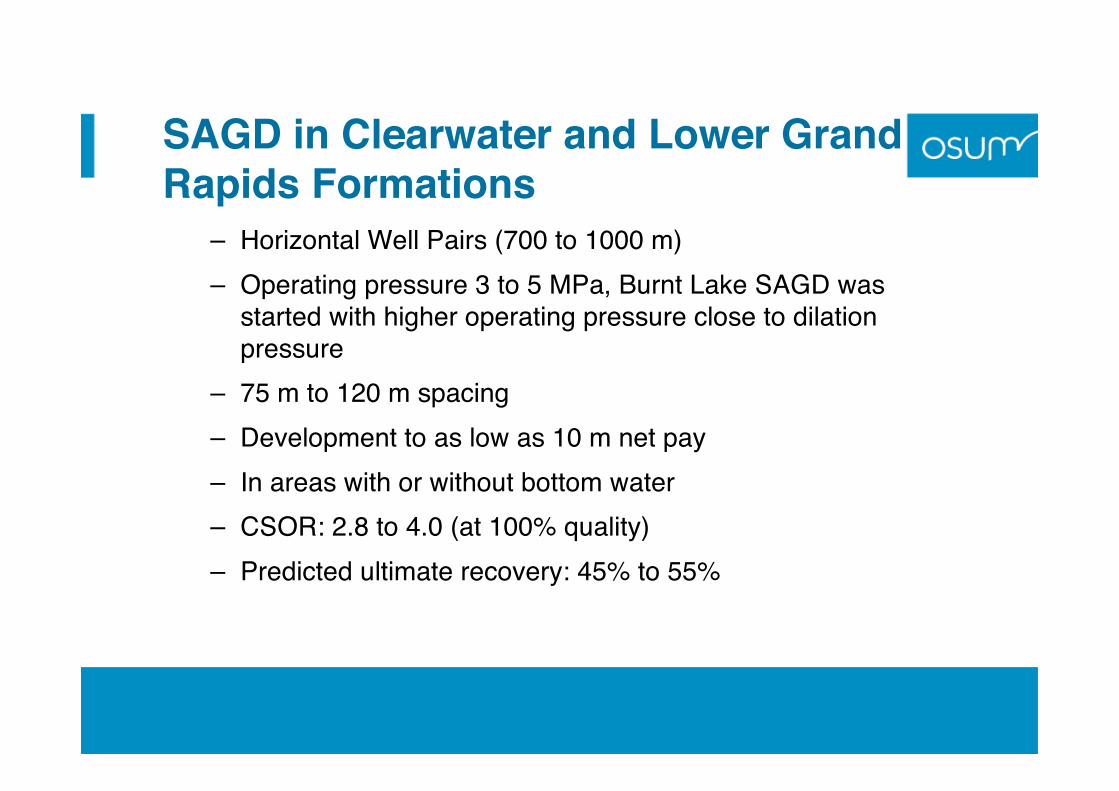
SAGD in Clearwater and Lower GrandRapids Formations
– Horizontal Well Pairs (700 to 1000 m)– Operating pressure 3 to 5 MPa, Burnt Lake SAGD was
started with higher operating pressure close to dilationpressure
– 75 m to 120 m spacing– Development to as low as 10 m net pay– In areas with or without bottom water– CSOR: 2.8 to 4.0 (at 100% quality)– Predicted ultimate recovery: 45% to 55%
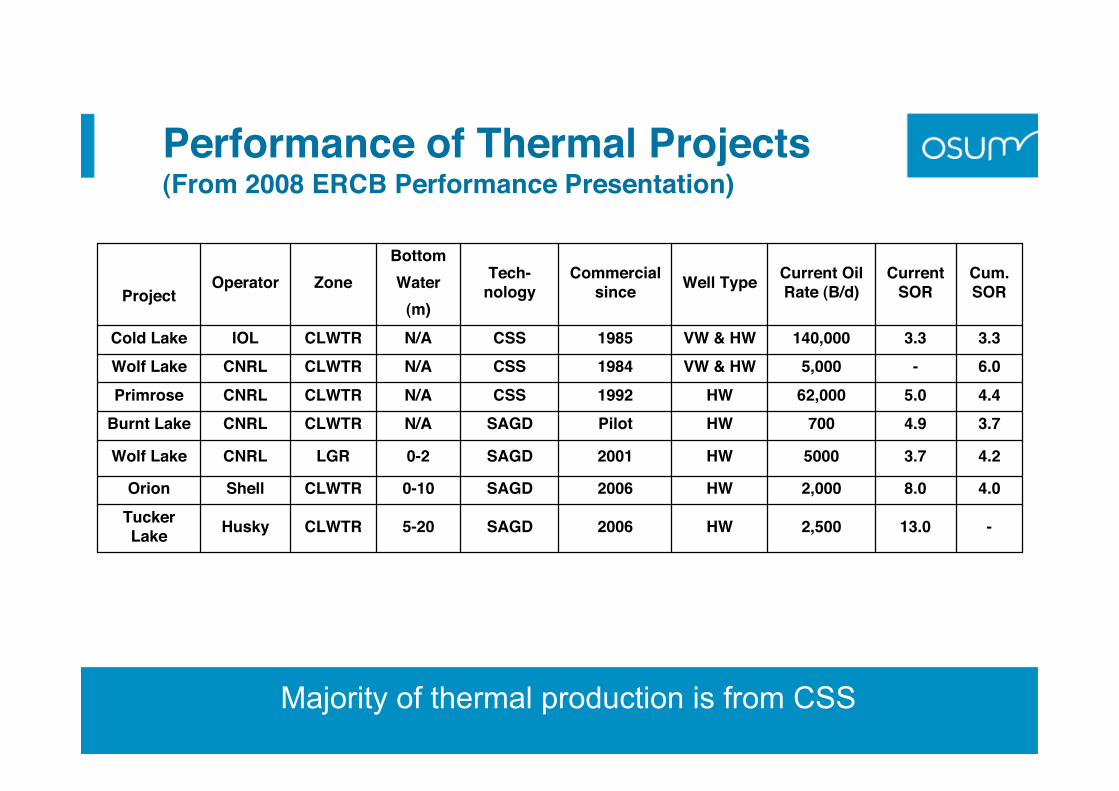
Performance of Thermal Projects(From 2008 ERCB Performance Presentation)
-13.02,500HW2006SAGD5-20CLWTRHuskyTuckerLake
4.08.02,000HW2006SAGD0-10CLWTRShellOrion
4.23.75000HW2001SAGD0-2LGRCNRLWolf Lake
3.74.9700HWPilotSAGDN/ACLWTRCNRLBurnt Lake4.45.062,000HW1992CSSN/ACLWTRCNRLPrimrose6.0-5,000VW & HW1984CSSN/ACLWTRCNRLWolf Lake3.33.3140,000VW & HW1985CSSN/ACLWTRIOLCold Lake
Cum.SOR
CurrentSOR
Current OilRate (B/d)Well TypeCommercial
sinceTech-
nology
BottomWater
(m)ZoneOperator
Project
Majority of thermal production is from CSS
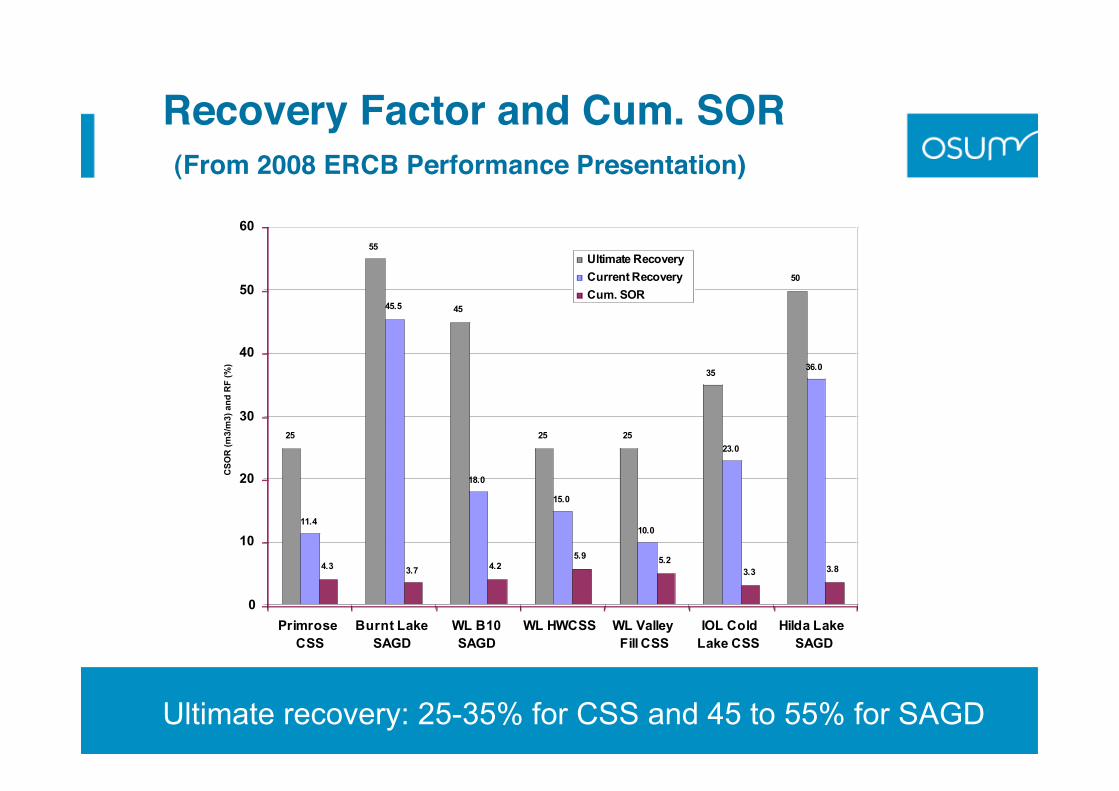
Recovery Factor and Cum. SOR (From 2008 ERCB Performance Presentation)
25
55
45
25 25
35
50
11.4
45.5
18.0
15.0
10.0
23.0
36.0
4.33.7
4.25.9
5.2
3.3 3.8
0
10
20
30
40
50
60
Primrose
CSS
Burnt Lake
SAGD
WL B10
SAGD
WL HWCSS WL Valley
Fill CSS
IOL Cold
Lake CSS
Hilda Lake
SAGD
CS
OR
(m
3/m
3)
an
d R
F (
%)
Ultimate Recovery
Current Recovery
Cum. SOR
Ultimate recovery: 25-35% for CSS and 45 to 55% for SAGD

Fuel Required for 1.0 m3 CWE Steam
2.0
2.1
2.2
2.3
2.4
2.5
2.6
2.7
0 2 4 6 8 10 12 14 16 18
Pressure (MPa)
Fu
el
Re
qu
ire
d,
Gj
pe
r M
3 S
tea
m
1.14
1.16
1.18
1.20
1.22
1.24
1.26
1.28
Ra
tio
b
etw
ee
n 1
00
% a
nd
75
% q
ua
lity
100% Injection Quality
75% Injection Quality
Ratio between 100% and 75%
15 to 25% more fuel required to increase steam quality from 75% to 100%

CSS vs. SAGD
• SAGD– Generally higher recovery– Better justified SOR at higher recovery factor– Requires higher vertical to horizontal permeability ratio– Applicable in areas with thick bottom water or top gas
• CSS– Generally lower recovery factor– Lower SOR initially– More robust and tolerate to heterogeneities– Not applicable in areas with thick bottom water or top gas
Reservoir characteristics and fluid Contacts are the keys for Selection of Recovery Process

Osum’s Taiga Project
Clearwater and Lower Grand Rapids

Reservoir Characteristics in Taiga Project
gas cap
basal water
M1
M2
S1
S2
6-26type well
6-26type well
Bottom Water
Gas Cap
M1 is beneficial for areas with top gas and M2 for areas with bottom water
Performance for Taiga Project
• Analogs– Clearwater Formation:
• CSS: CNRLʼs Primrose• SAGD: Burnt Lake and Shellʼs Orion
– Lower Grand Rapids Formation:• CNRLʼs B10 SAGD at Wolf Lake
• Reservoir Simulation– 3D geostatistical model
Recovery Process Selection
• Lower Grand Rapids Formation:– SAGD due to presence of bottom water
• Clearwater Formation:– SAGD for areas with no or minimal M1 mudstone
or with bottom water or top gas– CSS for areas with continuous M1 mudstone and
no bottom water
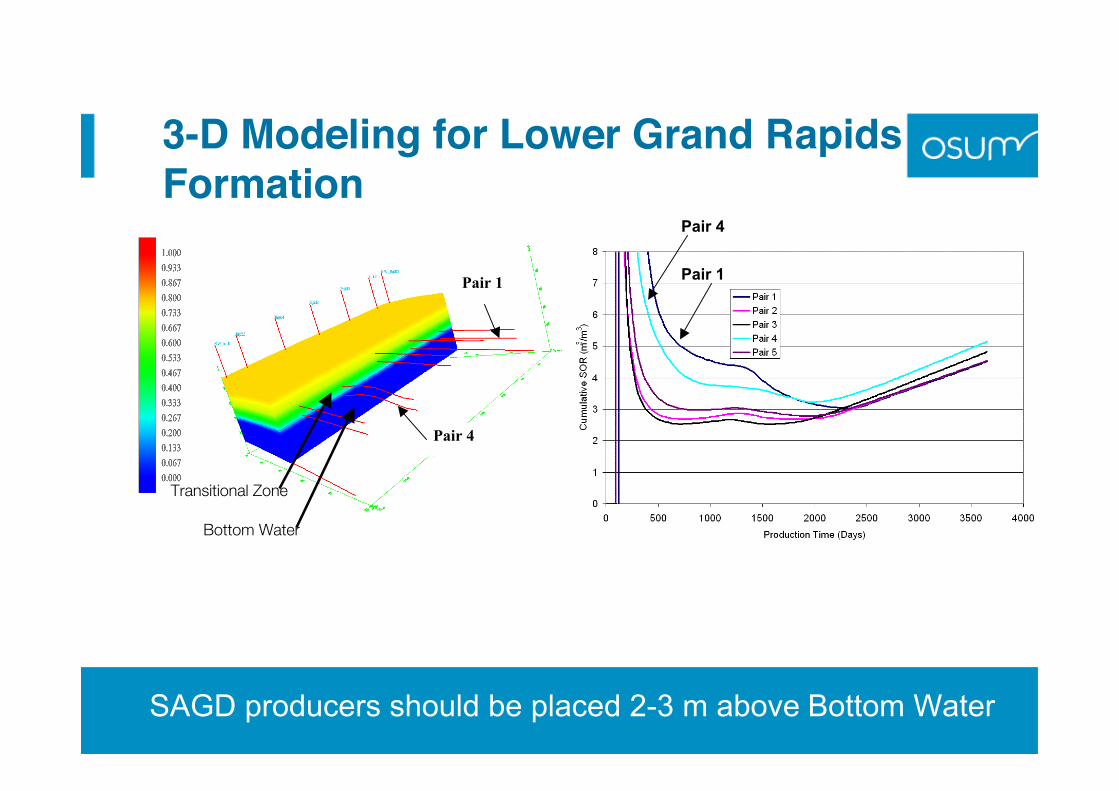
3-D Modeling for Lower Grand RapidsFormation
Pair 4
Pair 1
Bottom Water
Transitional Zone
SAGD producers should be placed 2-3 m above Bottom Water
Pair 1
Pair 4

3-D Modeling for Clearwater Formation
S2 Sand
M1 Mudstone
S1 Sand
SAGDChamber
Kv in M1 mudstone determines accessibility of S1 sand
(At 5 Years of SAGD)
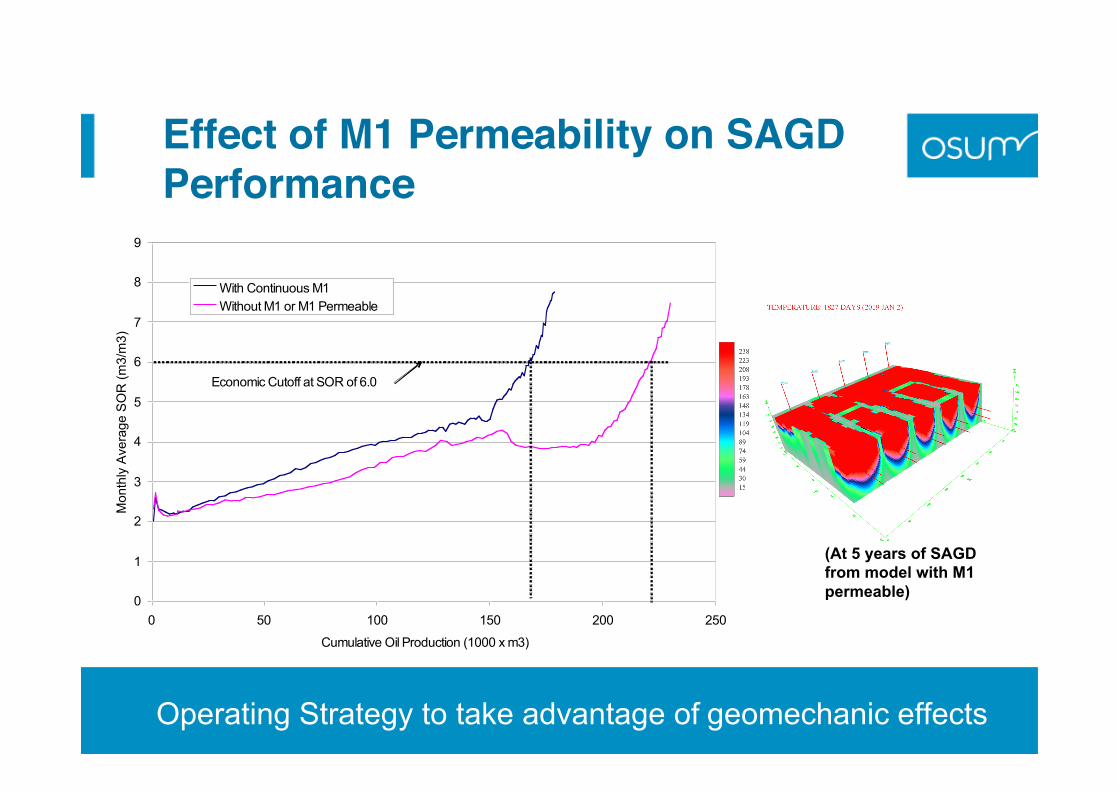
Effect of M1 Permeability on SAGDPerformance
0
1
2
3
4
5
6
7
8
9
0 50 100 150 200 250
Cumulative Oil Production (1000 x m3)
Month
ly A
vera
ge S
OR
(m
3/m
3)
With Continuous M1
Without M1 or M1 Permeable
Economic Cutoff at SOR of 6.0
(At 5 years of SAGDfrom model with M1permeable)
Operating Strategy to take advantage of geomechanic effects
Operating Pressures
• Lower Grand Rapids SAGD:• Steam chamber at 2.0 to 3.0 MPa in balance with bottom water
pressure
• Clearwater:– SAGD:
• Steam chamber at 3 to 4 MPa during normal operations• Injection pressure close to dilation for a short period is
anticipated in some areas to enhance vertical permeability– CSS:
• Injection at fracture pressure is required to access top S1 sandby breaking through M1 mudstone layer

Conclusions (Cold Lake Area)
• HP CSS is a proven commercial recovery process for theClearwater Formation
• Pilot test of SAGD has been success and applied commerciallyin the Clearwater Formation
• Vertical permeability, thickness and extension of bottom wateror top gas will be the major factors affecting the selection ofrecovery process between CSS and SAGD for Clearwater
• SAGD has been proven to be a commercial viable process forLower Grand Rapids Formation

Conclusions (Taiga)• SAGD will be applied in Osum's Lower Grand Rapids due to the
presence of thick bottom water.• High pressure assisted SAGD and HPCSS will be considered for
Clearwater Formation. Low pressure SAGD will be considered for theareas with bottom water or top gas.
• In some areas of the Clearwater in the Taiga project, operating SAGDat a pressure close to the dilation pressure is necessary to enhanceSAGD performance.
• For Lower Grand Rapids Formation, over 50% recovery is predictedusing SAGD at a CSOR of 3.0 to 3.5
• For Clearwater Formation, 35 to 55% recovery and CSOR of 3.5 to 4.2are predicted for SAGD

Acknowledgement
• Permission from Osum Oil Sands Corp.to publish the results from the Taigaproject
• Statistical modeling and geologicalinterpretation from Shawna Christensenof Throndson Energy Ltd. and JohnCarey of Petrel Robertson ConsultingLtd.