review questions a few members of a population have reached a favourable habitat with few predators...
TRANSCRIPT

Review questions
A few members of a population have reached a favourable habitat with few predators and unlimited resources, but their population growth rate is slower than that of the parent population. What is a possible explanation for this situation?
A) The genetic makeup of these founders may be less favourable than that of the parent population.
B) The parent population may still be in the exponential part of its growth curve and not yet limited by density-dependent factors.
C) The Allee effect may be operating; there are not enough population members present for successful reproduction.
D)a, b, and c may apply.
E) This scenario would not happen.

Review questions
As N approaches K for a certain population, which of the following is predicted by the logistic equation?
A) The growth rate will not change.
B) The growth rate will approach zero.
C) The population will show an Allee effect.
D) The population will increase exponentially.
E) The carrying capacity of the environment will increase.

Review questions
In which of the following habitats would you expect to find the largest number of K-selected individuals?
A) an abandoned field in Saskatchewan
B) the sand dunes south of Lake Michigan
C) the rain forests of Brazil
D) south Florida after a hurricane
E) a newly emergent volcanic island
Review questions
Which of the following variables is (are) important in contributing to the rapid growth of human populations?
A) the high percentage of young people
B) the average age to first give birth
C) carrying capacity of the environment
D) only A and B
E) A, B, and C

Chapter 53Chapter 53
Community Ecology
What Is a Community?
• A biological community
– is an assemblage of populations of various species living close enough for potential interaction
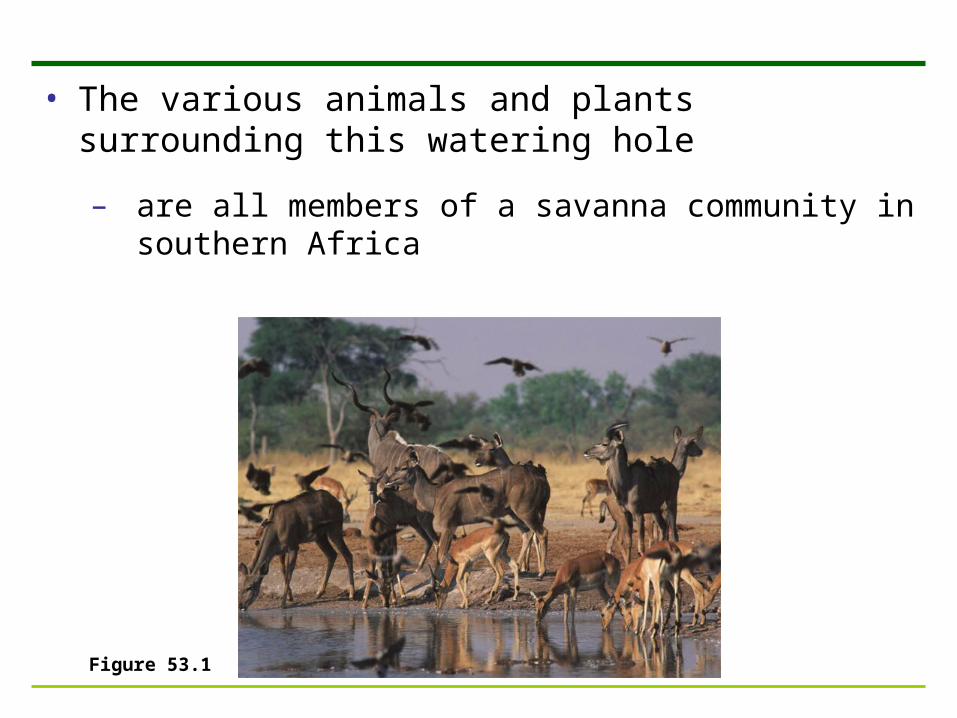
• The various animals and plants surrounding this watering hole
– are all members of a savanna community in southern Africa
Figure 53.1
• Concept 53.1: A community’s interactions include competition, predation, herbivory, symbiosis, and disease
• Populations are linked by interspecific interactions (symbiotic, parasitic, competition, disease.)
– that affect the survival and reproduction of the species engaged in the interaction

• Interspecific interactions
– can have differing effects on the populations involved
Table 53.1
Competition
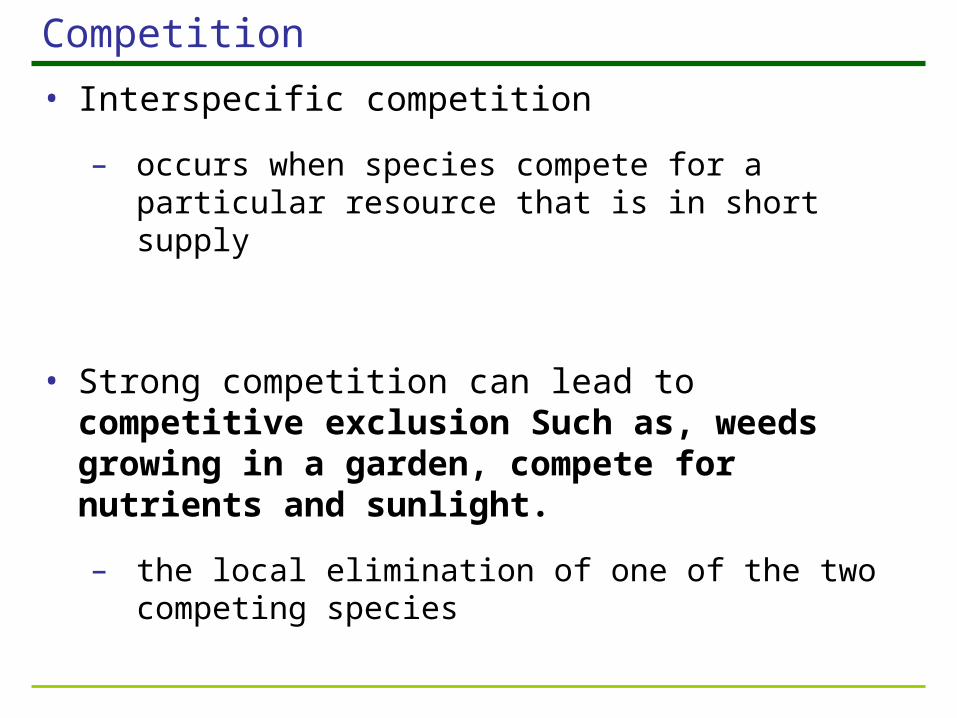
• Interspecific competition
– occurs when species compete for a particular resource that is in short supply
• Strong competition can lead to competitive exclusion Such as, weeds growing in a garden, compete for nutrients and sunlight.
– the local elimination of one of the two competing species
The Competitive Exclusion Principle
• The competitive exclusion principle
– states that two species competing for the same limiting resources cannot coexist in the same place
Ecological Niches
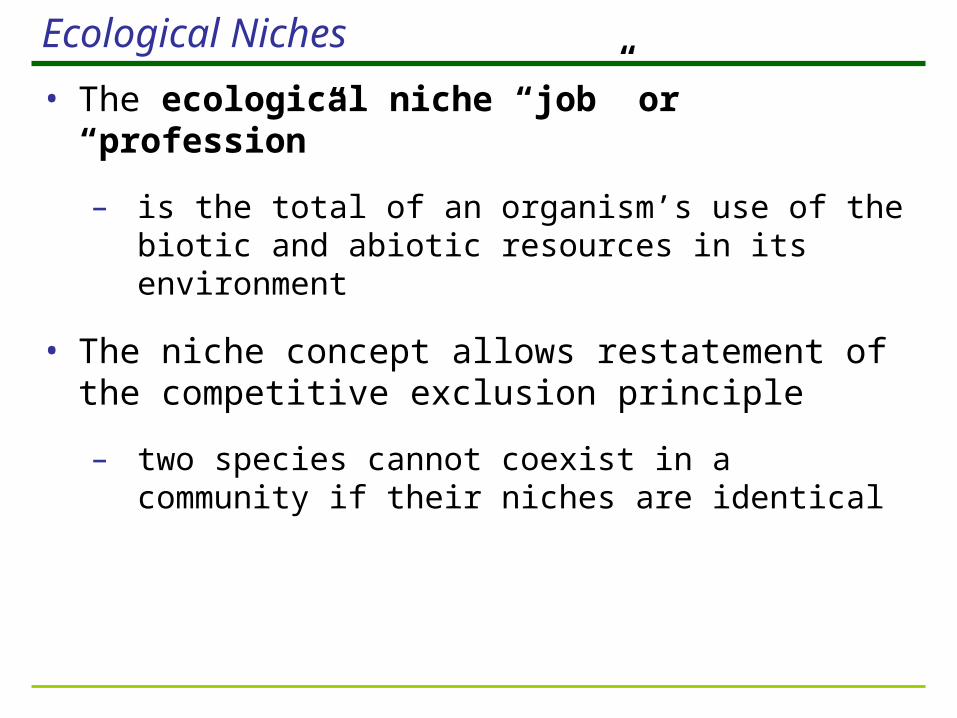
• The ecological niche “job” or “profession”
– is the total of an organism’s use of the biotic and abiotic resources in its environment
• The niche concept allows restatement of the competitive exclusion principle
– two species cannot coexist in a community if their niches are identical
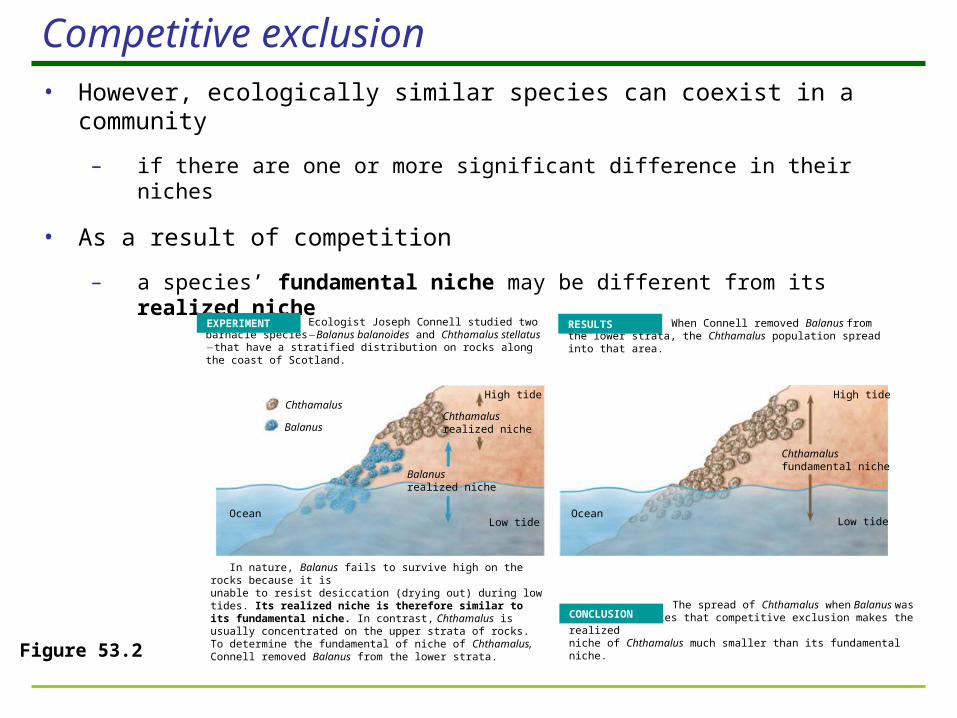
Competitive exclusion• However, ecologically similar species can coexist in a community
– if there are one or more significant difference in their niches
• As a result of competition
– a species’ fundamental niche may be different from its realized niche
When Connell removed Balanus from the lower strata, the Chthamalus population spread into that area.
The spread of Chthamalus when Balanus was removed indicates that competitive exclusion makes the realizedniche of Chthamalus much smaller than its fundamental niche.
RESULTS
CONCLUSION
Ocean
Ecologist Joseph Connell studied two barnacle speciesBalanus balanoides and Chthamalus stellatus that have a stratified distribution on rocks along the coast of Scotland.
EXPERIMENT
In nature, Balanus fails to survive high on the rocks because it isunable to resist desiccation (drying out) during low tides. Its realized niche is therefore similar to its fundamental niche. In contrast, Chthamalus is usually concentrated on the upper strata of rocks. To determine the fundamental of niche of Chthamalus, Connell removed Balanus from the lower strata.
Low tide
High tide
Chthamalusfundamental niche
Chthamalusrealized niche
Low tide
High tideChthamalus
Balanusrealized niche
Balanus
Ocean
Figure 53.2
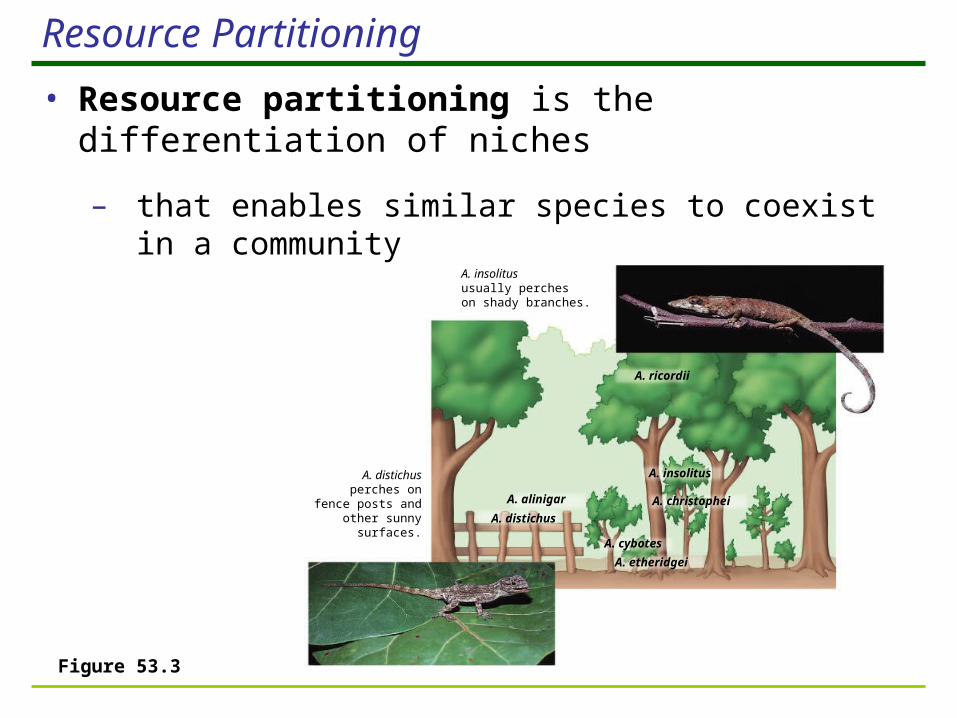
A. insolitususually percheson shady branches.
A. distichus perches on fence posts and
other sunny surfaces.
A. distichus
A. ricordii
A. insolitus
A. christophei
A. cybotes
A. etheridgei
A. alinigar
Figure 53.3
Resource Partitioning
• Resource partitioning is the differentiation of niches
– that enables similar species to coexist in a community

G. fortis
Beak depth (mm)
G. fuliginosa
Beak depth
Los Hermanos
Daphne
Santa María, San Cristóbal
Sympatric populations
G. fuliginosa, allopatric
G. fortis, allopatric
Per
cent
ages
of
indi
vidu
als
in e
ach
size
cla
ss
40
20
0
40
20
0
40
20
0
8 10 12 14 16
Figure 53.4
Character Displacement
• In character displacement
– there is a tendency for characteristics to be more divergent in sympatric (geographically overlapping) populations of two species than in allopatric (distinct) populations of the same two species
– Sympatric means geographic overlapping.

Predation
• Predation refers to an interaction
– where one species, the predator, kills and eats the other, the prey
• Feeding adaptations of predators include
– claws, teeth, fangs, stingers, and poison
• Animals also display
– a great variety of defensive adaptations

• Cryptic colouration, or camouflage
– makes prey difficult to spot
Figure 53.5

• Aposematic colouration
– warns predators to stay away from prey
Figure 53.6

• In Batesian mimicry
– a palatable or harmless species mimics an unpalatable or harmful model
(a) Hawkmoth larva
(b) Green parrot snake
Figure 53.7a, b

• In Müllerian mimicry
– two or more unpalatable species resemble each other
(a) Cuckoo bee
(b) Yellow jacketFigure 53.8a, b
Herbivory
• Herbivory, the process in which an herbivore eats parts of a plant
– has led to the evolution of plant mechanical and chemical defenses and consequent adaptations by herbivores
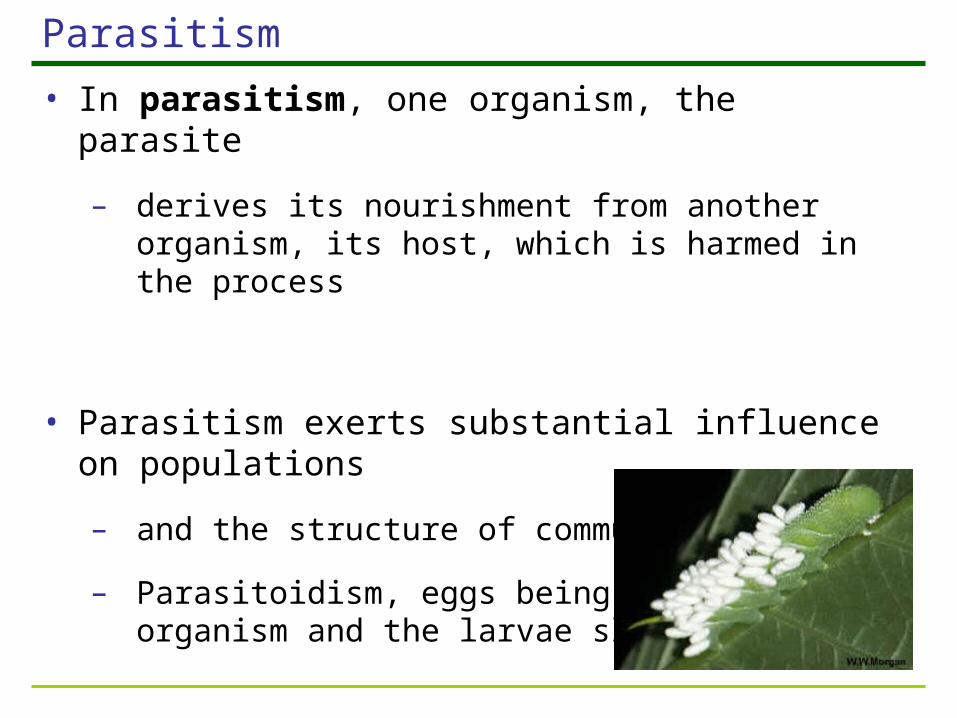
Parasitism
• In parasitism, one organism, the parasite
– derives its nourishment from another organism, its host, which is harmed in the process
• Parasitism exerts substantial influence on populations
– and the structure of communities
– Parasitoidism, eggs being laid inside and organism and the larvae slowly eat them.

Disease
• The effects of disease on populations and communities
– is similar to that of parasites
• Pathogens, disease-causing agents
– are typically bacteria, viruses, or protists

Mutualism
• Mutualistic symbiosis, or mutualism
– is an interspecific interaction that benefits both species
Figure 53.9
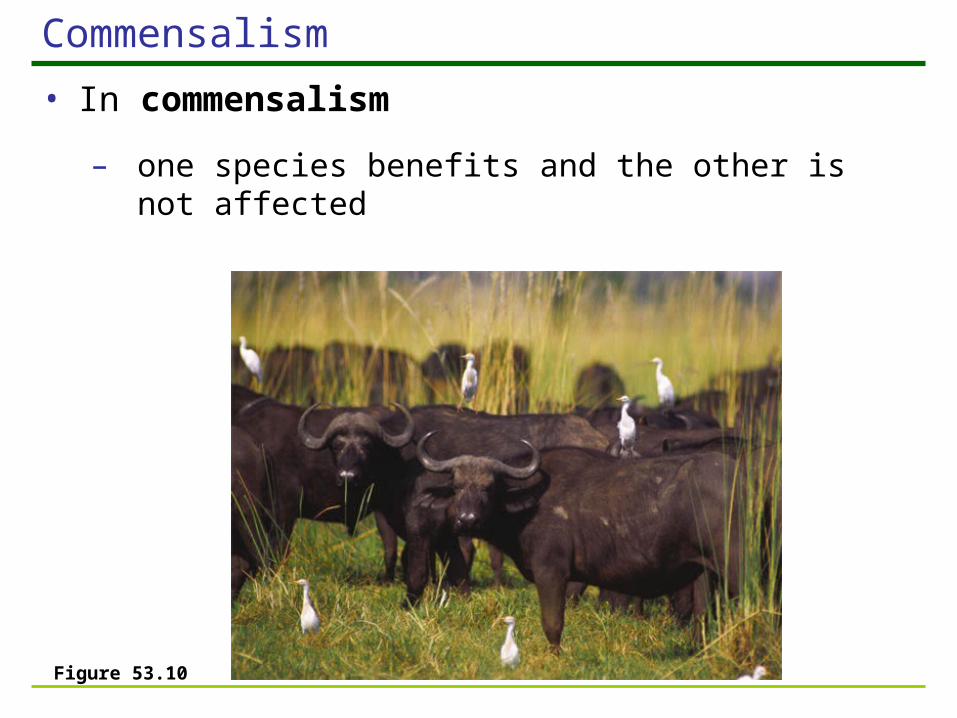
Commensalism
• In commensalism
– one species benefits and the other is not affected
Figure 53.10

Interspecific Interactions and Adaptation• Evidence for co-evolution
– which involves reciprocal genetic change by interacting populations, is scarce
• However, generalized adaptation of organisms to other organisms in their environment
– is a fundamental feature of life
The Australian Chiloglottis orchid attracts male thynnine wasps by mimicking the appearance, the feel and the smell of the female wasp. The males go to the flowers to try and mate, abandoning the females.

• Concept 53.2: Dominant and keystone species exert strong controls on community structure
• In general, a small number of species in a community
– exert strong control on that community’s structure

Species Diversity
• The species diversity of a community
– is the variety of different kinds of organisms that make up the community
– has two components
• Species richness
– is the total number of different species in the community
• Relative abundance
– is the proportion each species represents of the total individuals in the community

Community 1A: 25% B: 25% C: 25% D: 25%
Community 2A: 80% B: 5% C: 5% D: 10%
D
C
BA
Figure 53.11
• Two different communities
– can have the same species richness, but a different relative abundance
• A community with an even species abundance
– is more diverse than one in which one or two species are abundant and the remainder rare
Trophic Structure
• Trophic structure
– is the feeding relationships between organisms in a community
– is a key factor in community dynamics

• Food chainsQuaternary consumers
Tertiary consumers
Secondary consumers
Primary consumers
Primary producers
Carnivore
Carnivore
Carnivore
Herbivore
Plant
Carnivore
Carnivore
Carnivore
Zooplankton
Phytoplankton
A terrestrial food chain A marine food chainFigure 53.12
– link the trophic levels from producers to top carnivores

Food Webs
• A food web Humans
Baleen whales
Crab-eater seals
Birds Fishes Squids
Leopardseals
Elephant seals
Smaller toothed whales
Sperm whales
Carnivorous plankton
Euphausids (krill)
Copepods
Phyto-plankton
Figure 53.13
– is a branching food chain with complex trophic interactions
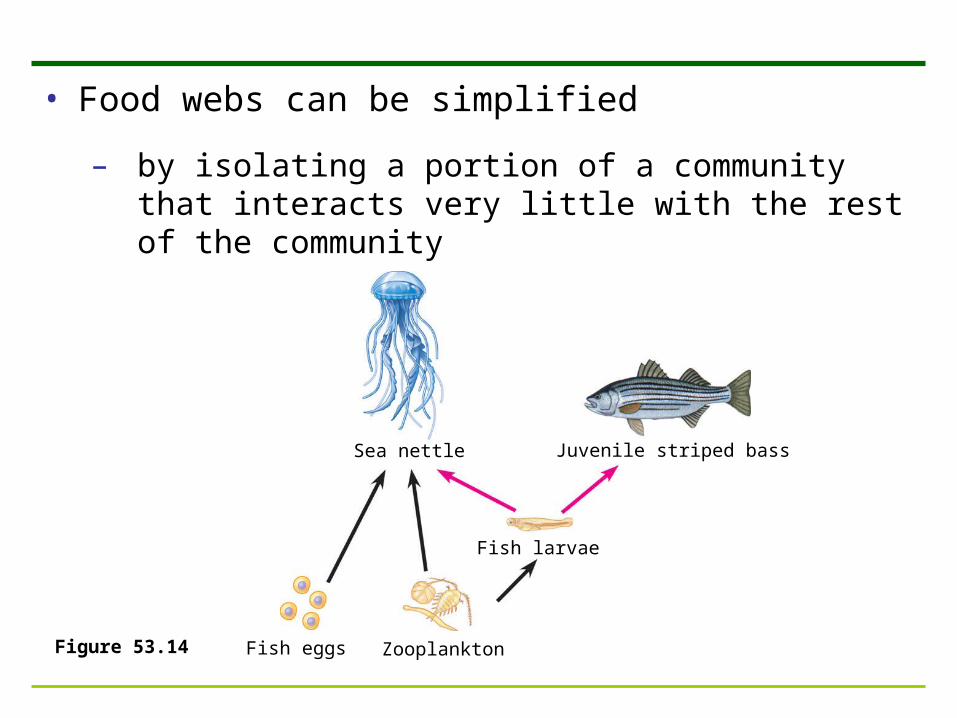
• Food webs can be simplified
– by isolating a portion of a community that interacts very little with the rest of the community
Sea nettle
Fish larvae
ZooplanktonFish eggs
Juvenile striped bass
Figure 53.14

Limits on Food Chain Length
• Each food chain in a food web
– is usually only a few links long (energy loss if too big).
• There are two hypotheses
– that attempt to explain food chain length

• The energetic hypothesis suggests that the length of a food chain
– is limited by the inefficiency of energy transfer along the chain
• The dynamic stability hypothesis
– proposes that long food chains are less stable than short ones

• Most of the available data
– support the energetic hypothesis
High (control)
Medium Low
Productivity
No. of species
No. of trophic links
Num
ber
of
spec
ies
Num
ber
of
trop
hic
links
0
1
2
3
4
5
6
0
1
2
3
4
5
6
Figure 53.15

Species with a Large Impact
• Certain species have an especially large impact on the structure of entire communities
– either because they are highly abundant or because they play a pivotal role in community dynamics
Dominant Species
• Dominant species
– are those species in a community that are most abundant or have the highest biomass
– exert powerful control over the occurrence and distribution of other species
• One hypothesis suggests that dominant species
– are most competitive in exploiting limited resources
• Another hypothesis for dominant species success
– is that they are most successful at avoiding predators

Keystone Species
• Keystone species
– are not necessarily abundant in a community
– exert strong control on a community by their ecological roles, or niches
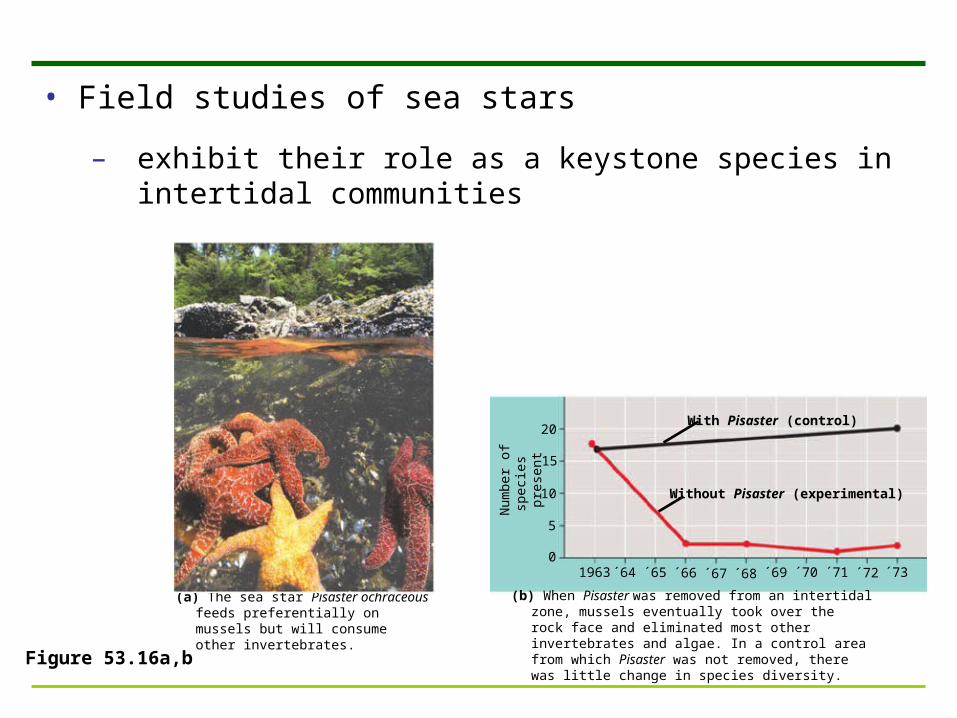
• Field studies of sea stars
– exhibit their role as a keystone species in intertidal communities
Figure 53.16a,b
(a) The sea star Pisaster ochraceous feeds preferentially on mussels but will consume other invertebrates.
With Pisaster (control)
Without Pisaster (experimental)
Num
ber
of s
peci
es
pres
ent
0
5
10
15
20
1963 ´64 ´65 ´66 ´67 ´68 ´69 ´70 ´71 ´72 ´73
(b) When Pisaster was removed from an intertidal zone, mussels eventually took over the rock face and eliminated most other invertebrates and algae. In a control area from which Pisaster was not removed, there was little change in species diversity.
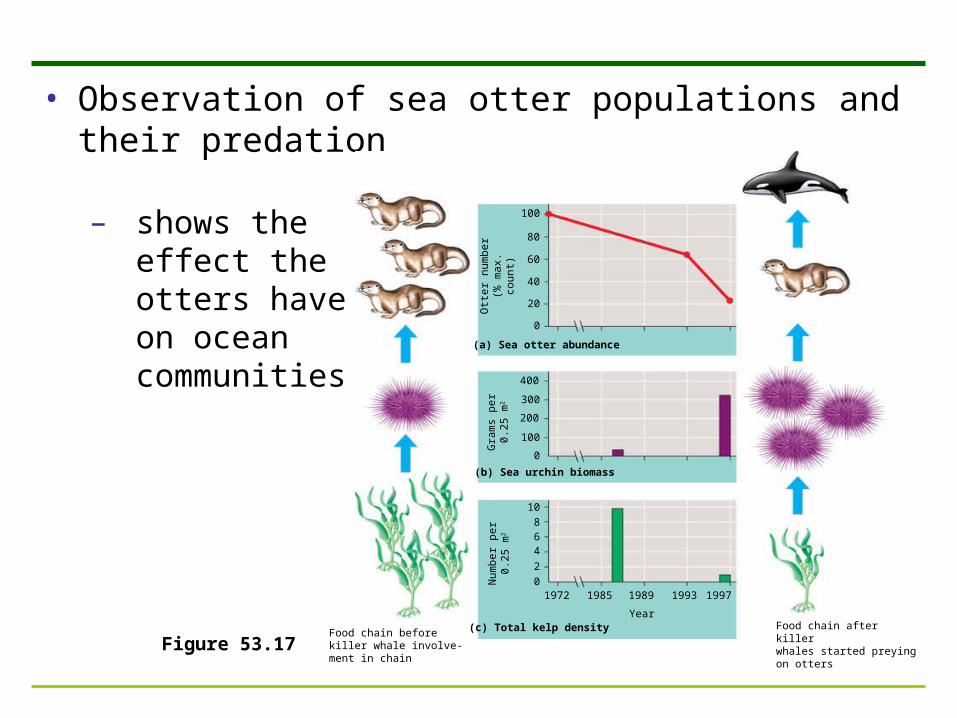
• Observation of sea otter populations and their predation
Figure 53.17Food chain beforekiller whale involve-ment in chain
(a) Sea otter abundance
(b) Sea urchin biomass
(c) Total kelp density
Num
ber
per
0.25
m2
1972 1985 1989 1993 19970
2
468
10
0
100
200
300
400
Gra
ms
per
0.25
m2
Ott
er n
umbe
r (%
max
. co
unt)
0
40
20
60
80
100
Year
Food chain after killerwhales started preyingon otters
– shows the effect the otters haveon ocean communities

Ecosystem “Engineers” (Foundation Species)• Some organisms exert their influence
– by causing physical changes in the environment that affect community structure
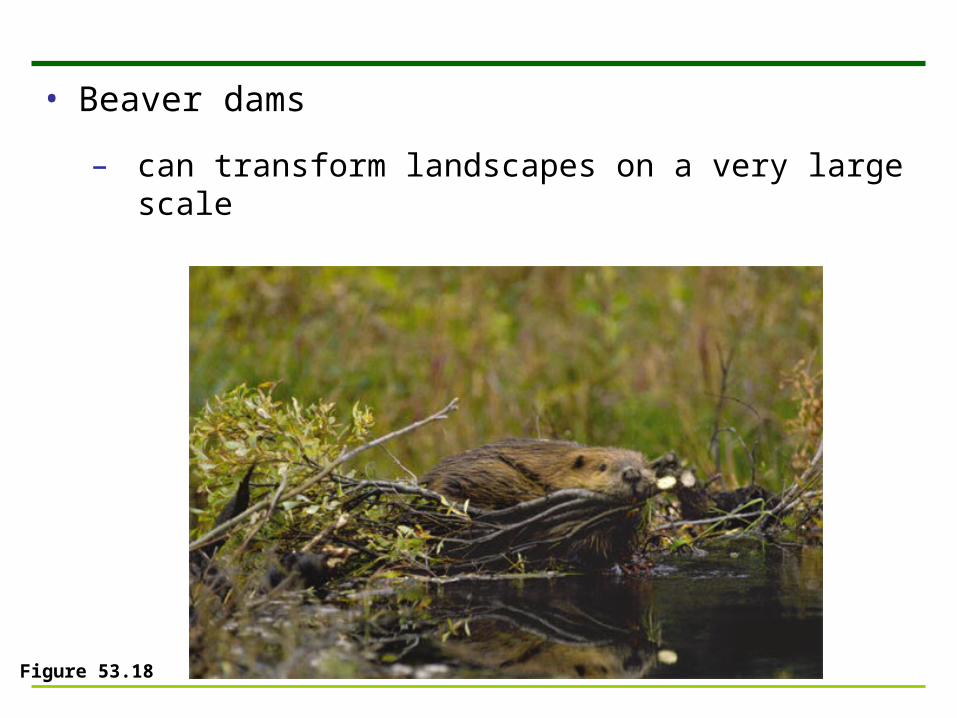
• Beaver dams
– can transform landscapes on a very large scale
Figure 53.18

• Some foundation species act as facilitators
– that have positive effects on the survival and reproduction of some of the other species in the community
Figure 53.19
Salt marsh with Juncus (foreground)
With Juncus
Without Juncus
Nu
mb
er
of
pla
nt
spe
cie
s
0
2
4
6
8
Conditions
Bottom-Up and Top-Down Controls
• The bottom-up model of community organization
– proposes a unidirectional influence from lower to higher trophic levels
• In this case, the presence or absence of abiotic nutrients
– determines community structure, including the abundance of primary producers
• The top-down model of community organization
– proposes that control comes from the trophic level above
• In this case, predators control herbivores
– which in turn control primary producers
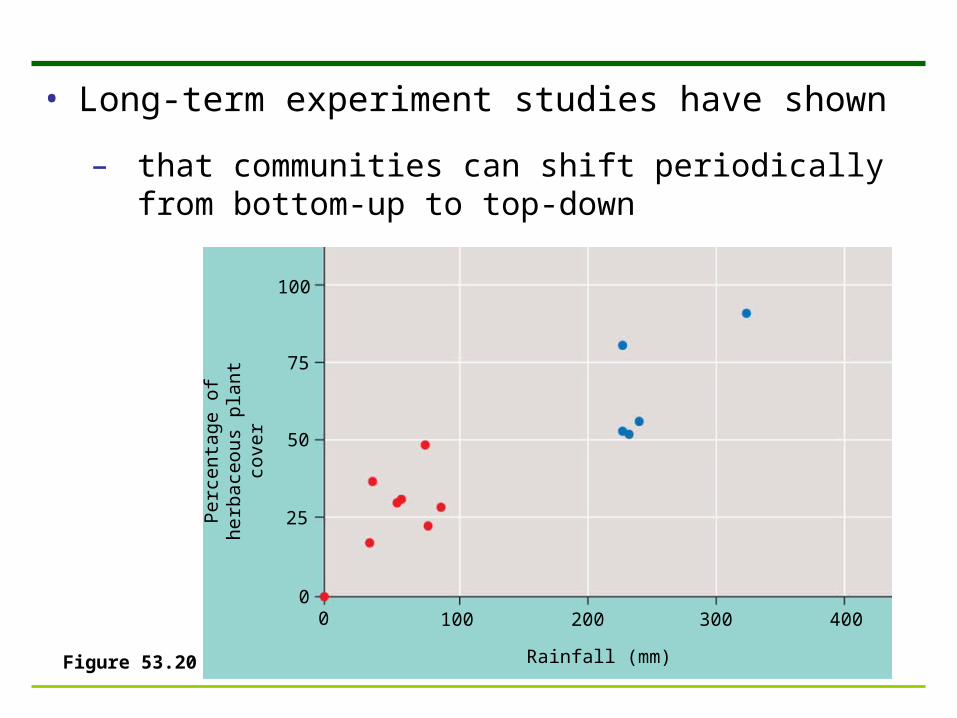
• Long-term experiment studies have shown
– that communities can shift periodically from bottom-up to top-down
Figure 53.20
0 100 200 300 400
Rainfall (mm)
0
25
50
75
100
Per
cen
tag
e o
f he
rbac
eous
pla
nt c
over
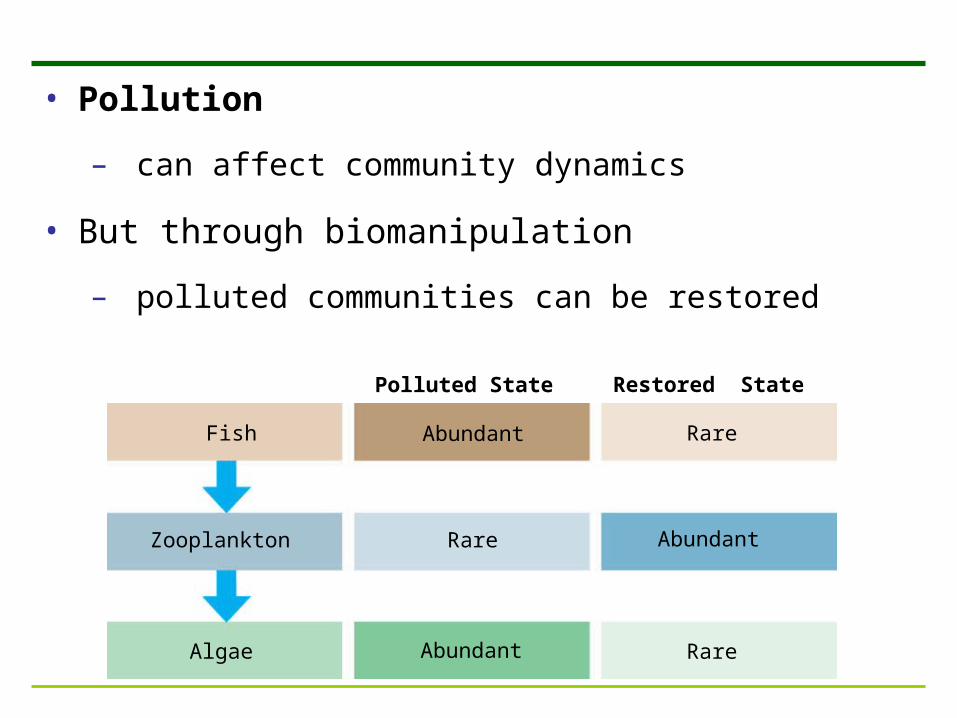
• Pollution
– can affect community dynamics
• But through biomanipulation
– polluted communities can be restored
Fish
Zooplankton
Algae
Abundant
Rare
RareAbundant
Abundant
Rare
Polluted State Restored State
• Concept 53.3: Disturbance influences species diversity and composition
• Decades ago, most ecologists favoured the traditional view
– that communities are in a state of equilibrium
• However, a recent emphasis on change has led to a nonequilibrium model
– which describes communities as constantly changing after being buffeted by disturbances
What Is Disturbance?
• A disturbance
– is an event that changes a community
– removes organisms from a community
– alters resource availability
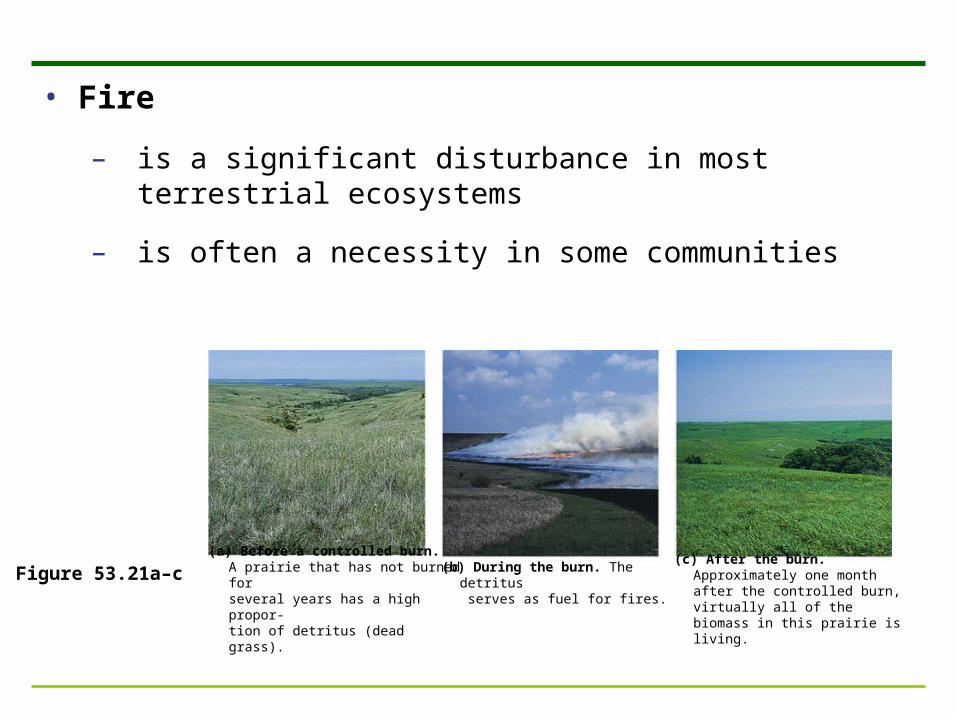
• Fire
– is a significant disturbance in most terrestrial ecosystems
– is often a necessity in some communities
(a) Before a controlled burn.A prairie that has not burned forseveral years has a high propor-tion of detritus (dead grass).
(b) During the burn. The detritus serves as fuel for fires.
(c) After the burn. Approximately one month after the controlled burn, virtually all of the biomass in this prairie is living.
Figure 53.21a–c
• The intermediate disturbance hypothesis
– suggests that moderate levels of disturbance can foster higher species diversity than low levels of disturbance

• The large-scale fire in Yellowstone National Park in 1988
– demonstrated that communities can often respond very rapidly to a massive disturbance
Figure 53.22a, b
(a) Soon after fire. As this photo taken soon after the fire shows, the burn left a patchy landscape. Note the unburned trees in the distance.
(b) One year after fire. This photo of the same general area taken the following year indicates how rapidly the community began to recover. A variety of herbaceous plants, different from those in the former forest, cover the ground.
Human Disturbance
• Humans
– are the most widespread agents of disturbance
• Human disturbance to communities
– usually reduces species diversity
• Humans also prevent some naturally occurring disturbances
– which can be important to community structure
Ecological Succession
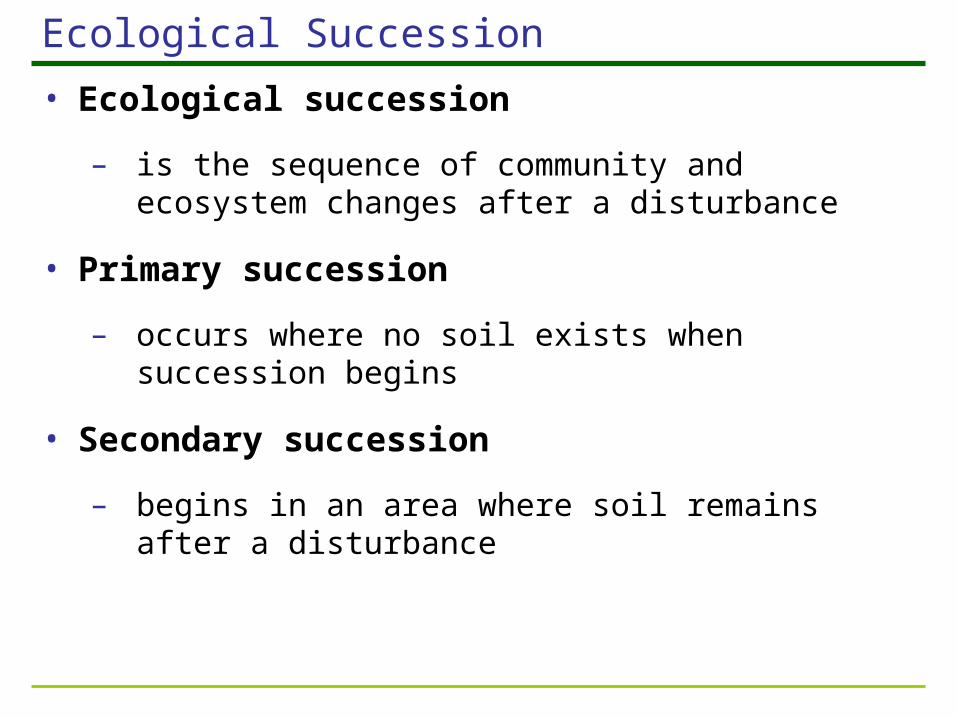
• Ecological succession
– is the sequence of community and ecosystem changes after a disturbance
• Primary succession
– occurs where no soil exists when succession begins
• Secondary succession
– begins in an area where soil remains after a disturbance
• Early-arriving species
– may facilitate the appearance of later species by making the environment more favourable
– may inhibit establishment of later species
– may tolerate later species but have no impact on their establishment
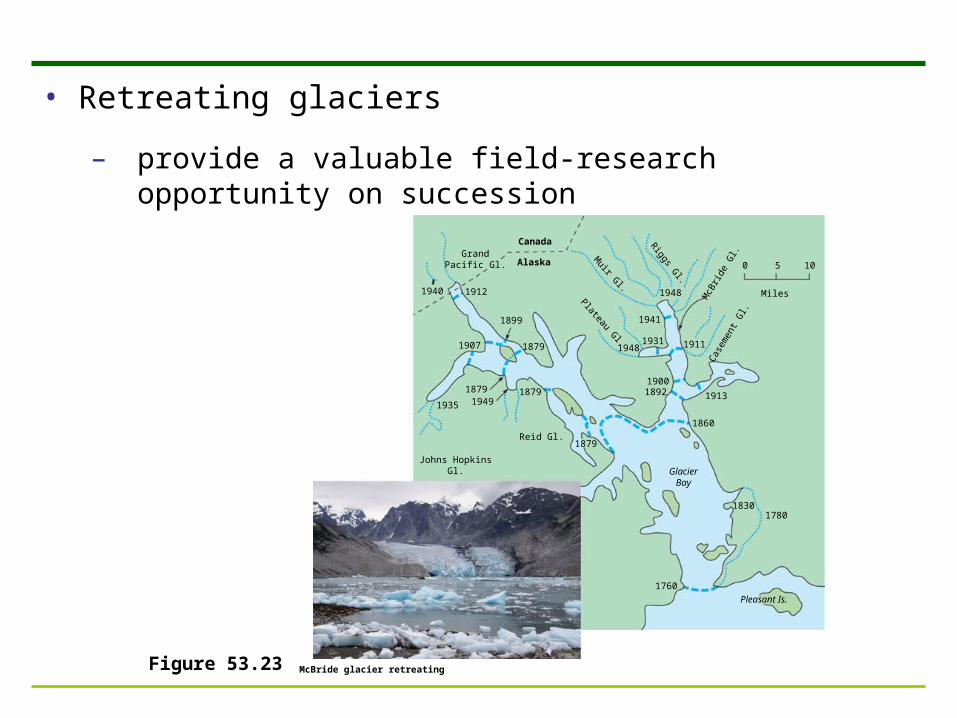
McBride glacier retreating
0 5 10
Miles
GlacierBay
Pleasant Is.
Johns HopkinsGl.
Reid Gl.
GrandPacific Gl.
Canada
Alaska
1940 1912
1899
1879
18791949
1879
1935
1760
17801830
1860
1913
1911
18921900
1879
1907 19481931
1941
1948
Cas
emen
t Gl.
McB
ride
Gl.
Plateau Gl.
Muir G
l.
Riggs G
l.
• Retreating glaciers
– provide a valuable field-research opportunity on succession
Figure 53.23
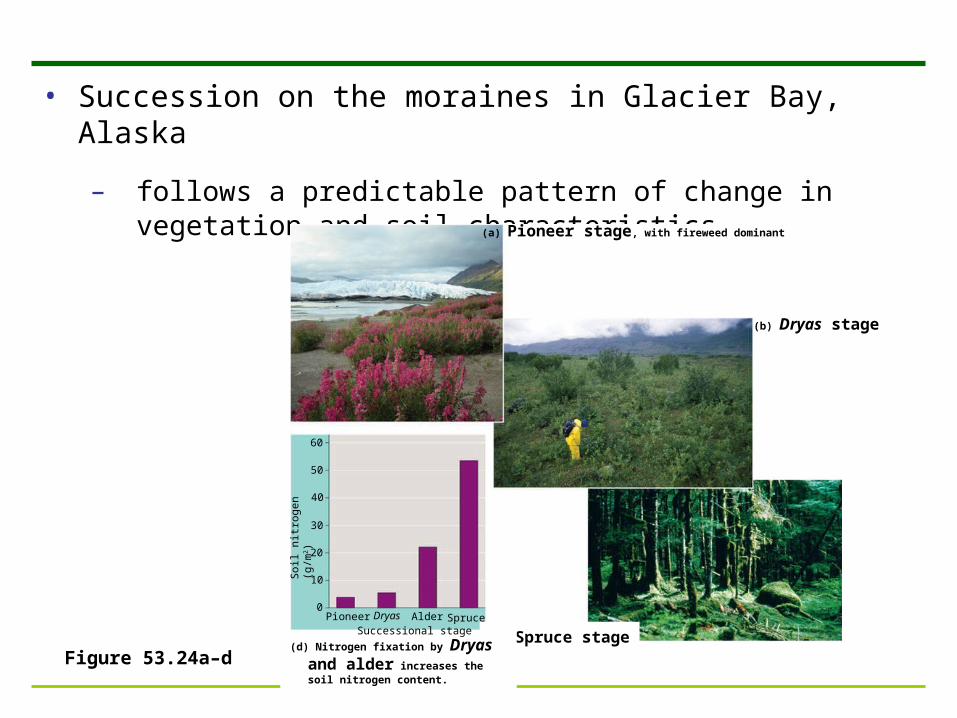
• Succession on the moraines in Glacier Bay, Alaska
– follows a predictable pattern of change in vegetation and soil characteristics
Figure 53.24a–d
(b) Dryas stage
(c) Spruce stage(d) Nitrogen fixation by Dryas and
alder increases the soil nitrogen content.
Soi
l nitr
ogen
(g/
m2)
Successional stagePioneer Dryas Alder Spruce
0
10
20
30
40
50
60
(a) Pioneer stage, with fireweed dominant

• Concept 53.4: Biogeographic factors affect community diversity
• Two key factors correlated with a community’s species diversity
– are its geographic location and its size

Equatorial-Polar Gradients
• The two key factors in equatorial-polar gradients of species richness
– are probably evolutionary history and climate
• Species richness generally declines along an equatorial-polar gradient
– and is especially great in the tropics
• The greater age of tropical environments
– may account for the greater species richness
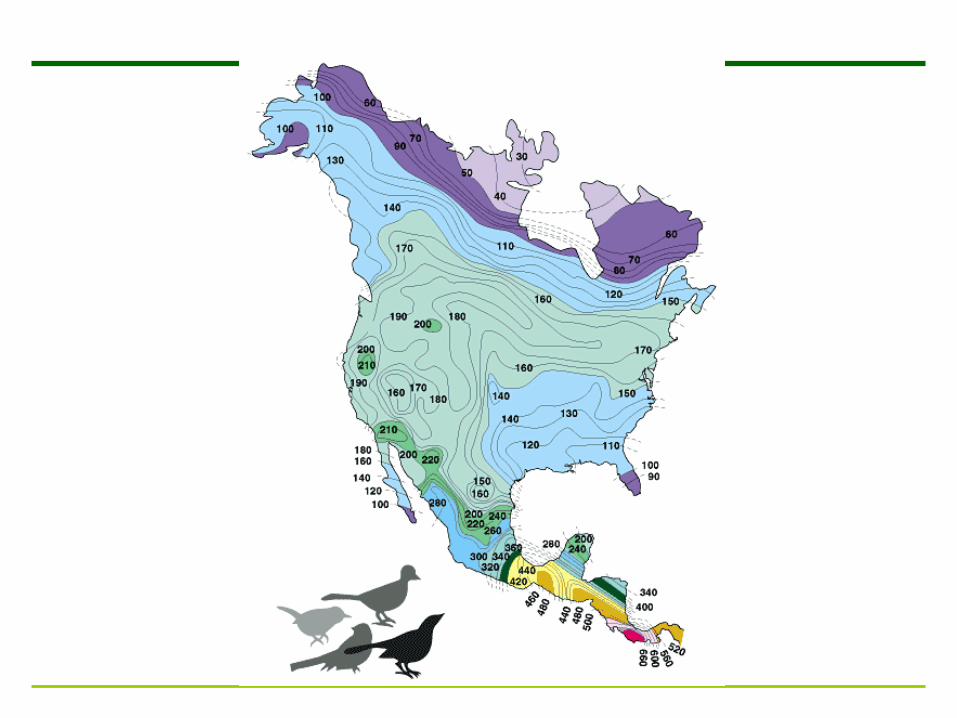
• Climate
– is likely the primary cause of the latitudinal gradient in biodiversity

• The two main climatic factors correlated with biodiversity
– are solar energy input and water availability
(b) Vertebrates
500 1,000 1,500 2,000
Potential evapotranspiration (mm/yr)
10
50
100
200
Ver
tebr
ate
spec
ies
richn
ess
(log
scal
e)
1
100 300 500 700 900 1,100
180
160
140
120
100
80
60
40
20
0
Tre
e sp
ecie
s ric
hnes
s
(a) TreesActual evapotranspiration (mm/yr)
Figure 53.25a, b

Area Effects
• The species-area curve quantifies the idea that
– all other factors being equal, the larger the geographic area of a community, the greater the number of species
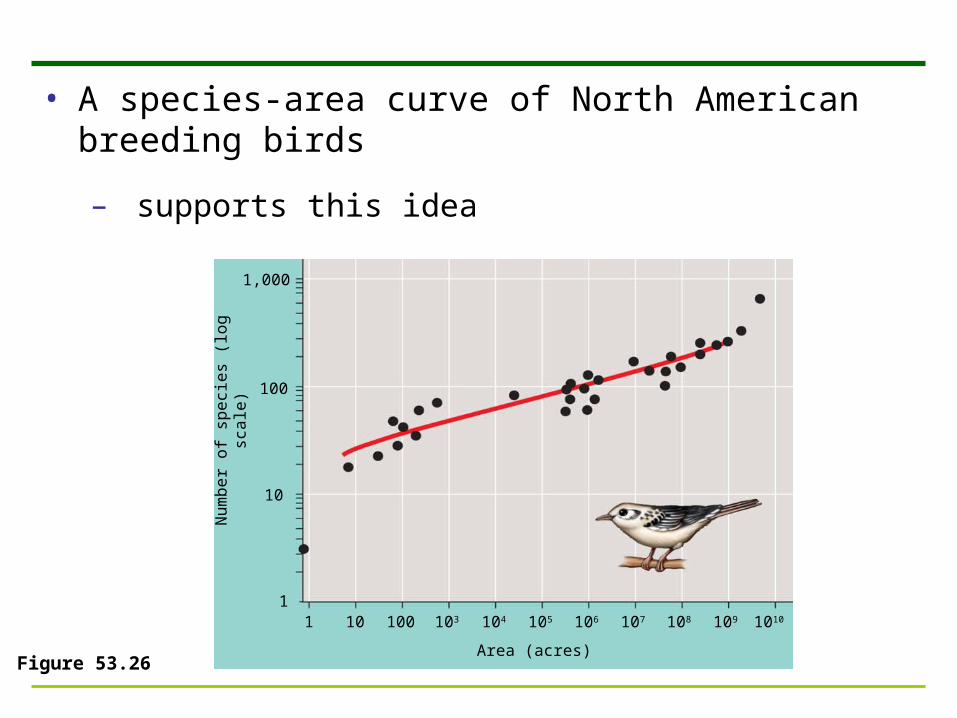
• A species-area curve of North American breeding birds
– supports this idea
Area (acres)
1 10 100 103 104 105 106 107 108 109 1010
Nu
mb
er
of
spe
cie
s (lo
g s
cale
)
1
10
100
1,000
Figure 53.26
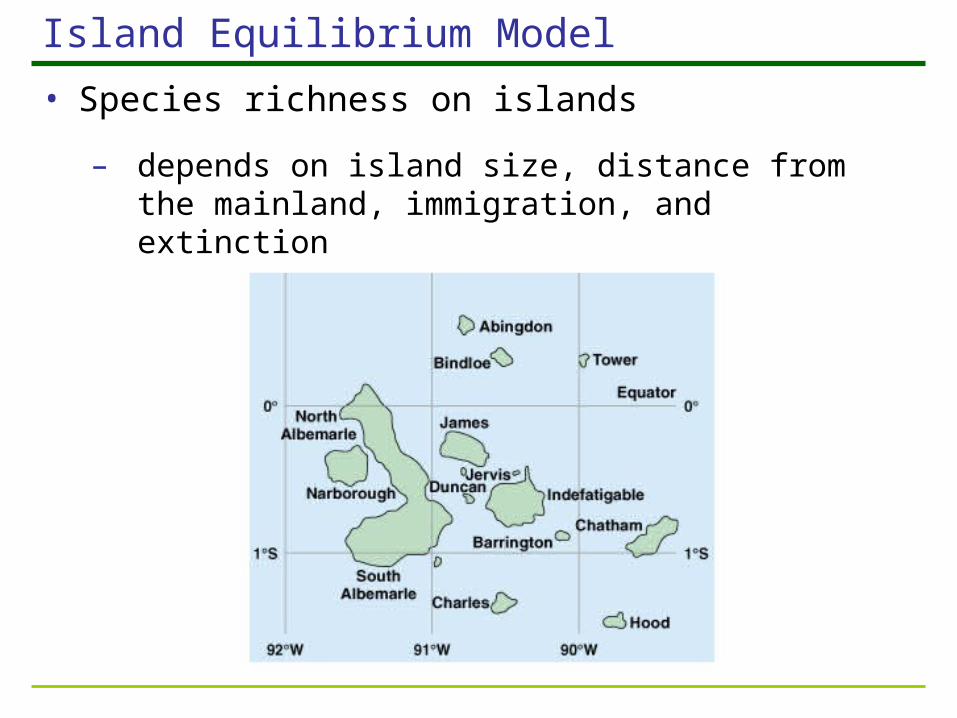
Island Equilibrium Model
• Species richness on islands
– depends on island size, distance from the mainland, immigration, and extinction
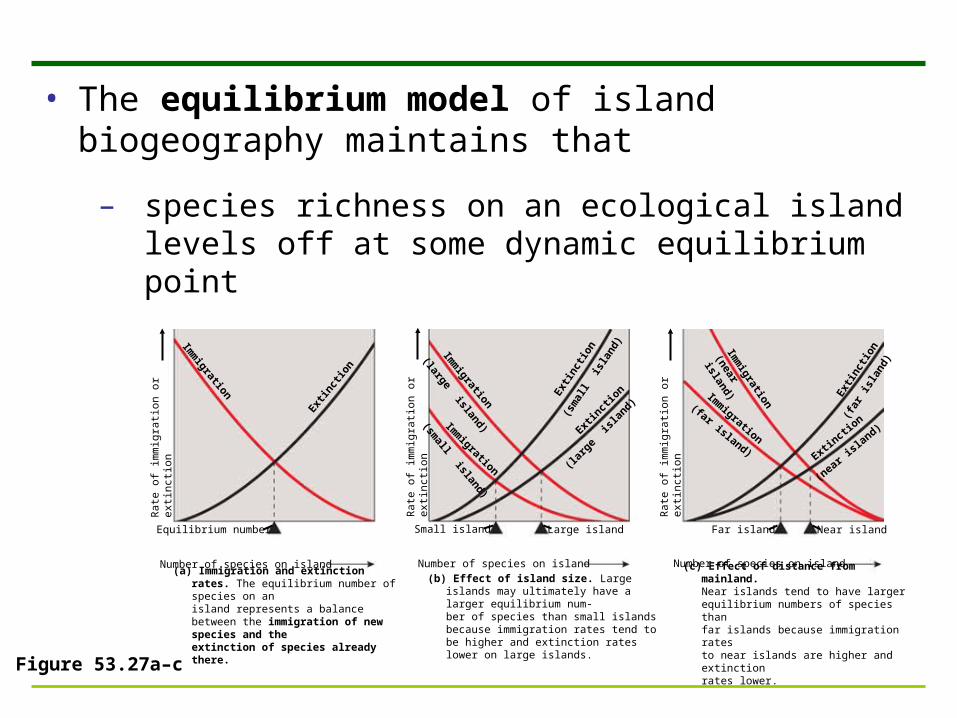
Figure 53.27a–c
• The equilibrium model of island biogeography maintains that
– species richness on an ecological island levels off at some dynamic equilibrium point
Number of species on island
(a) Immigration and extinction rates. The equilibrium number of species on anisland represents a balance between the immigration of new species and theextinction of species already there.
(b) Effect of island size. Large islands may ultimately have a larger equilibrium num-ber of species than small islands because immigration rates tend to be higher and extinction rates lower on large islands.
Number of species on island Number of species on island
(c) Effect of distance from mainland. Near islands tend to have largerequilibrium numbers of species thanfar islands because immigration ratesto near islands are higher and extinctionrates lower.
Equilibrium number Small island Large island Far island Near island
Imm
igration
Extin
ctio
n
Extin
ctio
n
Imm
igration
Extin
ctio
n
Imm
igration
(small island)
(larg
e is
land)
(large island)
(sm
all
isla
nd) Imm
igration
Extin
ctio
n
Imm
igration
(far island)
(near i
sland)
(near island) (far i
slan
d)
Extinctio
n
Rat
e of
imm
igra
tion
or e
xtin
ctio
n
Rat
e of
imm
igra
tion
or e
xtin
ctio
n
Rat
e of
imm
igra
tion
or e
xtin
ctio
n
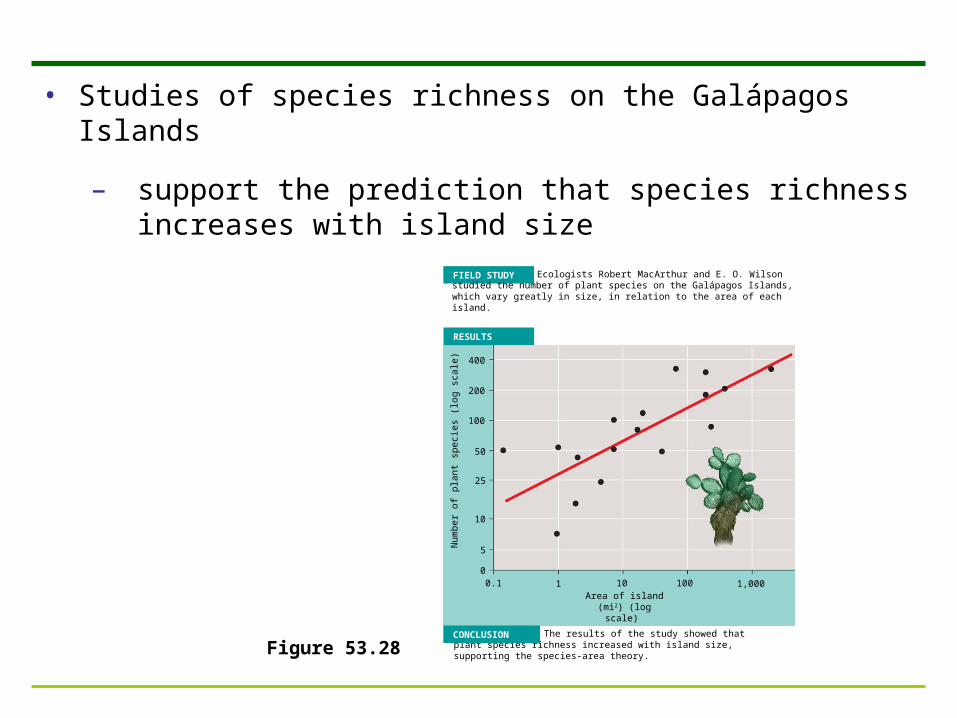
• Studies of species richness on the Galápagos Islands
– support the prediction that species richness increases with island size
The results of the study showed that plant species richness increased with island size, supporting the species-area theory.
FIELD STUDY
RESULTS
Ecologists Robert MacArthur and E. O. Wilson studied the number of plant species on the Galápagos Islands, which vary greatly in size, in relation to the area of each island.
CONCLUSION
200
100
50
25
10
0
Area of island (mi2) (log scale)
Num
ber
of p
lant
spe
cies
(lo
g sc
ale)
0.1 1 10 100 1,000
5
400
Figure 53.28