(reviewed) 1983-nguyen and boger-yield stress measurements conc susp
DESCRIPTION
paper about RheologyTRANSCRIPT

Yield Stress Measurement for Concentrated Suspensions*
NGUYEN QUOC DZUY and D. V. BOGER, Department of Chemical Engineering, The University of Melbourne, Parkville,
Victoria, 3052 Australia
Synopsis
The measurement and use of the flow properties of highly concentrated solid-liquid suspensions is a topic of considerable practical interest in a broad spectrum of indus- tries. The yield stress is a rheological property that all highly concentrated suspensions may have in common. In this work four established methods for determining the yield stress are compared with a fifth and new method based on a vane test developed in soil mechanics. It is clearly shown that a single-point measurement with the vane device is sufficient to determine accurately the yield stress in a region of high concentration where the four conventional methods are extremely tedious or not applicable. Fur- thermore, the vane method does not rely on any previous shearing of a suspension and hence is applicable for study of the kinetics of thixotropic systems. The work has been motivated by the need to know the yield stress of highly concentrated bauxite residue suspensions in order to establish a waste disposal strategy for the residue which is a waste product in the production of alumina from bauxite.
INTRODUCTION
Concentrated solid-liquid suspension systems having strong in- terparticle interactions often exhibit a unique plastic flow behavior and the presence of a yield stress. Under the application of small stress these systems deform elastically with finite rigidity, but when the applied stress exceeds the yield value continuous deformation occurs with the material flowing like a viscous fluid.lp2 The yield stress can thus be regarded as a material property denoting a transi- tion between solidlike and liquidlike behavior. The yield stress is then the minimum shear stress corresponding to the first evidence of flow, i.e., the value of the shear stress at zero velocity gradient.
* This work was completed while both workers were at the Department of Chemical Engineering, Monash University, Clayton, Victoria, Australia.
0 1983 by The Society of Rheology, Inc. Published by John Wiley & Sons, Inc. Journal of Rheology, 27(4), 321-349 (1983) CCC 0148s6055/83/040321-29$03.90

322 DZUY AND BOGER
Bingham and Green334 in 1920 first recognized and introduced the concept of a yield stress in fluidlike materials. In the past 60 years many suspension systems have been found to fall into this category. These systems represent a broad spectrum of real materials including paints, clays, foodstuffs, and mineral slurries. An exhaustive list of plastic fluids having a yield stress has been compiled recently in a review by Bird, Gance, and Yarusso.5
The yield stress usually is exhibited in flocculated suspensions and under conditions where interparticle interactions result in mutual attraction between the individual particles.612 The particles may aggregate to form floes which in turn interact with one another to create a continuous three-dimensional network structure extending throughout the whole volume. 6~13~14 On this basis the yield stress has been related to the strength of the coherent network structure as the force per unit area required to breakdown the structure, followed by a rupture of the network bonds or linkages connecting the flow units.‘5 Several paper&l7 have been devoted to analyzing the yield stress in terms of colloidal stability and surface characteristics of the solid particles. Empirical approaches have also been employed to study the influence of factors such as particle concentration, size, size dis- tribution and shape, concentration of surfactants, etc., on the mag- nitude of the yield value for a variety of systems.15-20
A precise quantitative knowledge of the yield stress is very im- portant in handling, storage, processing, and transport of concentrated suspensions in industry. For example, in slurry pipeline transport, knowledge of the yield value is essential for pump and pipeline de- sign.21 Furthermore, the presence of a high yield stress can be used to retard solid particles from gravity settling for long periods of time,22~23 as it is known that the yield stress provides an additional drag force on the particle.24-27 These concentrated suspensions of fine particles can be considered homogeneous, nonsettling suspensions even for transport in laminar flow. 22p23,28 Furthermore, it has been found economically viable to transport coarse solids by using a sus- pension of fine particles as an effective suspending medium.29 Ob- viously there must exist a limit of the yield value for the optimum and economical operating conditions in the transport of a particular type of slurry. Too high a yield stress may result in unnecessarily high power consumption and hence high operating costs.22,23 Also, in the disposal of mineral waste slurries through a pipeline, a selection of the yield value must be made to balance both the stability of the

YIELD STRESS OF SUSPENSIONS 323
flowing slurry and the spreadability of the slurry discharged into the disposal area.
Because of the important role of the yield stress in plastic suspen- sions, it is essential that the yield stress be determined or measured as accurately as possible. Both indirect and direct methods of mea- surement have been proposed and used. Indirect methods are based on interpretation of fundamental shear stress-shear rate data and attempt to obtain the shear stress in the limit of zero shear rate.30 In practice, with conventional viscometric instruments, this straight- forward and simple technique is not usually possible due to the lack of data at sufficiently low shear rates. Moreover, even if low shear rate data are available, instrumental defects such as slip flows may lead to unreliable results.31-34 It has been found convenient then to fit the experimental shear stress-shear rate data to one or more of the constitutive equations developed for plastic flow behavior, and ex- trapolate graphically the resulting fitted curve to zero shear rate.“5 The accuracy of this yield stress is obviously dependent on the ap- plicability of the postulated model to the observed behavior of the suspension of interest. Most workers1e1eJs-27Js~37 have a tendency to use the Bingham plastic model, which uses a linear relationship between shear stress and shear rate to obtain the yield stress value. In a large number of concentrated suspensions, however, the flow curves do not follow Bingham behavior and the use of this model can result in serious overestimate of the yield value,38-40 and in some cases a yield stress is predicted when not present. The yield stress of sus- pensions exhibiting nonlinear plastic behavior can be determined by assuming nonlinear constitutive equations such as those proposed by Herschel and Bulkleti2 and Casson.8 These models have been found to correlate experimental data for some systems over a signif- icant range of shear rate.43-4s However, it is clear that the Bingham yield value can be a factor of 4-5 higher than the value obtained with the nonlinear extrapolation.34,41 Nevertheless, the yield stress de- termined by the nonlinear extrapolation methods, although identi- fiable as a rheological parameter, cannot be regarded necessarily as an absolute material property since its accuracy depends on the as- sumed model, the accuracy and reliability of the experimental flow data, and the type of viscometric instrument used. It is therefore necessary to measure the yield stress directly by independent and more direct techniques whenever possible.
One of the direct methods for yield stress measurement relies on

324 DZUY AND BOGER
measurement of the shear stress at which flow first begins. This experiment can be carried out under shear stress-controlled or shear rate-controlled conditions. In the constant shear stress technique, a constant shear stress is applied and the deformation of the material is observed as function of time, ~47-49 while the constant shear rate experiment involves shearing the material at a low and constant shear rate to measure the stress-time response of the system.33,5e-53 From either of these tests, the shear stress corresponding to the first evi- dence of plastic flow can be interpreted as a yield stress.
In another technique sometimes referred to as the stress relaxation method, the suspension is first sheared at constant shear rate in an instrument with a rotating body. The speed of rotation is then re- duced either gradually or suddenly to zero and the value of shear stress exerted by the suspension on the stationary suspended body is called the yield value.6,15,36,41,54-58
The yield stress of highly concentrated suspensions (or pastes) can also be measured by using several specially designed techniques and apparatus. These include compression of a cylindrical specimen between two parallel plates under constant load1e,5s,so; penetration of a solid object such as cone, plate, needle, or sphere into an initially horizontal surface of the test materia110,59-63; application of a constant torsional moment to one end of a rod or hollow cylinder made of the material whose yield stress is to be measured5ss1s4; or measuring the drag force acting on a stationary plate submerged in a moving test material.3~6 The success of these techniques for measurement of the yield stress depends on the capability of the test material to exhibit well-defined yielding under a selected experimental condition. Moreover, it is not certain that the quantity obtained by such tests can be related to or identified with the true rheological yield stress.
From the various techniques available, it is clear that the yield stress can be assessed by a number of different methods. However, with a few exceptions,30,35*41*65 no direct comparison has been made of the yield value obtained by the different techniques.
Motivated by our interest in the pipeline transport and ultimate disposal of highly concentrated mineral suspensions, and the need to be able to measure an accurate yield stress in a system of this type, this article examines and compares different techniques for the measurement of the yield stress in highly concentrated suspensions. These techniques are (a) direct extrapolation of the rheological shear stress-shear rate data, (b) extrapolation of the flow curves assuming

YIELD STRESS OF SUSPENSIONS 325
the Bingham flow model,’ (c) extrapolation of the flow curves as- suming two nonlinear plastic flow models: Herschel and BulkleyQ and Casson,s (d) shear stress relaxation method, and (e) vane method.
Methods (a), (b), and (c) may be classified as indirect techniques since they rely on the rheological data, whereas methods (d) and (e) are direct techniques for yield stress measurements. Particular emphasis is placed on the use of the simple vane technique used in soil mechanics. It will be demonstrated that the vane method pro- vides a powerful tool for the direct measurement of the yield stress in highly concentrated systems.
THE VANE METHOD
Previous Work
The observation of slip effects in yield stress measurement with rotating cylinder viscometers has led several investigators to search for another geometry. One of the possible substitutes for the cylinder is the vane which generally consists of a small number (usually 2-8) of thin blades arranged at equal angles around a small cylindrical shaft [see Fig. l(a)]. In add’t’ 1 ion to the elimination of wall slip, this ge- ometry has the advantage that any disturbance caused by the intro- duction of the vane into the sample can be kept to a minimum. To the authors’ knowledge, very few workers in suspension rheology have fully exploited the potential of the vane in the study of concentrated suspensions, especially when the suspension shows significant thix- otropy. The vane has been used as a relative measurement of the yield value with the stress relaxation method by Russell,55 and by Hobson33 in the constant shear rate experiment. No direct rela- tionship between the quantity measured and the true rheological yield stress has been obtained or suggested by these workers. Keentok,56 following our work reported at the Second National Conference on Rheology in Australia, 57 has confirmed the idea that a vane device can be used for yield stress measurement.
The vane method has been widely used by workers in soil mechanics as a simple technique for in situ measurements of the shear strength of cohesive soi1s.5s,ss4s Standard procedures for this technique have been devised and published by the American Society for Testing

326 DZUY AND BOGER
I W
Fig. 1. Schematic diagram of (a) the vane, (b) the vane apparatus: (A) vane, (B) motor, (C) torsion head, (D) instrument console, (E) recorder.
Material&j9 while Carlson and Cadling and Odenstades have de- veloped an analytical treatment for data interpretation. Reasonably good agreement has been observed between the shear strength ob- tained with the vane and the values obtained with other soil mechanics techniques.66*67
In the present study the applicability of the vane method is inves- tigated for yield stress measurements in concentrated suspension systems.

YIELD STRESS OF SUSPENSIONS 327
Principle
The vane method provides a means for direct measurement of the true yield stress of concentrated suspensions under virtually static conditions. It applies the fundamental concept of the yield stress as a true material property associated with the strength of a continuous network structure found in flocculated suspensions.eJs-l5
A vane test is carried out by gently introducing the vane spindle into a sample of the suspension held in a container until the vane is fully immersed. The depth of the suspension and the diameter of the container should be at least twice as large as the length and diameter of the vane to minimize any effects caused by the rigid boundaries. The vane is then rotated very slowly at a constant rotational speed, and the torsional moment required to maintain the constant motion of the vane is measured as a function of time (or angle of rotation). For materials having a yield stress, a typical torque-time curve would assume a shape like that shown in Figure 2. As the vane rotates from rest, the region of the suspension close to the edges of the vane blades would deform elastically, as shown by the linear part of the torque- time response. (Note that the material between the blades moves along with the vane.) Such linear behavior may be attributed to the mere stretching of the “network bonds” interconnecting the structural elements7JlJ4+53 (particles or aggregates or both). Since more bonds would be stretched and the resistance to more deformation increases as the vane’s rotation continues, the torque required to keep the motion constant must also rise. Breaking of the already stretched bonds would eventually occur7T53 even though in a gradual manner, as shown by the curved part following the linear region in the torque-time response. Finally, when all (or a majority of) the network
I 2 3 4 5 6
Fig. 2. A typical torque-time response curve observed with the vane method.

328 DZUY AND BOGER
bonds have been broken the network would collapse and microscop- ically the material may be said to yield. Furthermore, since hydro- dynamic forces at extremely low shear are not strong enough to bring the separated structural elements close together for a reformation of the network bonds, the material would yield in an irreversible manner with “cracks” (visible or invisible) formed in a localized yield area.53 This explains the existence of a maximum torque value followed by a rapid falloff in torque with time on the torque-time response.
Based on the above hypothesis it may be said that the presence of a distinctive peak on the torque-time curve obtained with the vane method is a true characteristic of suspensions with a yield stress and that the maximum torque can be related to the true yield stress. Experimental evidence@ has demonstrated that, at the maximum torsional moment, yielding of the material takes place along a localized cylindrical surface defined by the dimensions of the vane. Thus, the yield stress can be calculated from the measured maximum torque and the known surface area of the cylindrical surface of yielding. The method for yield stress calculation will be given in the next section.
The special geometry of the vane offers two advantages in the measurement of the yield stress. First, the vane allows the material to yield under static conditions and within the material itself. Sec- ond, the introduction of the vane into the suspension does not cause any significant disturbance to the sample prior to measurement. This is most appreciated when using thixotropic materials thatare sensitive to past shear history. Also, by means of the vane method it may be possible to study quantitatively the structural recovery of previously sheared thixotropic suspensions.
Analysis
To calculate the material yield stress from the measured maximum torsional moment and known vane dimensions, several assumptions are necessary. First, the vane is replaced by a cylinder whose di- mensions are equal to those of the vane, as shown by the dotted lines in Figure l(a). The total torque measured is thus composed of one component due to shearing on the cylindrical wall and another to shearing at the two end surfaces. The torque balance is given by
T = (2rR,H)r,R, + 2 27r I s
R”T,(r) rdrr , 1 (1) 0

YIELD STRESS OF SUSPENSIONS 329
where T is the measured torque; R, (= DJ2) and H are radius and length of the vane, respectively; 7, (= T,.O Ir=&,) is the shear stress at the cylindrical wall; and 7, (r) is the shear stress at the end surface, which is a function of radial position r.
Since T,(r) is unknown, it is not possible to integrate the second term in Eq. (1). However, as a first approximation for small-diameter vanes, it is reasonable to assume that 7, is uniformly distributed over both end surfaces and that 7, is equal to 7, at the cylindrical wall. Furthermore, at the maximum torsional moment (T,) it is assumed that the material yields instantaneously along the cylindrical surface and that the shear stress 7, is equal to the material yield stress 7Y Equation (1) therefore reduces to:
or
(2)
rr = T,,JK,
where K is the vane parameter which depends on the vane dimensions only:
(3)
Thus, the material yield stress can be calculated readily from the measured maximum torque (T,) and vane dimensions (D,,H).
As would be expected, the assumption of uniform shear stress distribution over the end surfaces is valid only for extremely small vanes, i.e., D, + 0. For vanes with a finite diameter inevitably used in practice, the above assumption and hence the yield value calculated by means of Eq. (2) will result in some error. The error involved may be estimated either by empirical techniques where several vanes having the same length but different diameters are used and the re- sults are extrapolated to zero vane diameter, or by an approximate method as follows. Let us assume a simple yet possible function for 7, (r):
T,(r) = (r/R,)PT,, 0 d r 6 R,, P z 0,
which satisfies the boundary conditions: at, r = 0, T, = 0, and at r = R,, r, = -r,. Equation (1) can be solved and reduced to:

330 DZUY AND BOGER
or in terms of T,,, and ry:
(4)
It may be seen that Eq. (4) is different from Eq. (2) by the second term in the parentheses. In fact, by letting P = 0, we arrive at the uniform shear stress distribution and Eq. (4) reduces to Eq. (1). For P > 1 the errors involved in using Eq. (2) have been estimated as a function of P and HID, and shown in Table I. It is clear then for HJD > 2 that the error associated with the use of Eq. (2) for calculation of the yield stress should not be excessive. Experimental data will confirm this observation.
EXPERIMENTAL
Materials
The test fluids used in this work were bauxite residue suspensions (red mud). Red mud is a waste product in the Bayer process for ex- tracting alumina from bauxite and consists of large quantities of FepOs, SiOs, and A1203 with various other metallic oxides. The suspending liquid in red mud contains a large amount of soluble salts (mainly Na+) and, owing to high caustic content, the pH can be as high as 12. The solid particles in red mud have a wide size distribution, the characterization of which depends very much on the quality of the bauxite used and the processing conditions. With the red mud samples used in this work (all provided by Alcoa of Australia Limited) about 70-80% by weight of the solids particles were less than 10 pm. Red mud particles are generally porous in nature, irregular in shape with a high specific surface area. Owing to these physical and chemical characteristics, the rheological behavior of red mud is quite
TABLE I
Errors Involved in Using Eq. (2)a
H”D” P=l P=2 P=3
1 +6.67 +11.11 t14.29 2 +3.70 +6.06 +749 4 +1.96 +3.17 +4.00
a Percent errors compared with P = 0.

YIELD STRESS OF SUSPENSIONS 331
complex. Concentrated red mud suspensions have been found to be highly thixotropic, plastic, and shear thinning.70*71 Their rheological behavior depends very much on the colloidal and surface character- istics of the solid particles and the chemical nature of the liquid me- dium.
Rheological Characterization
Flow property measurements for all samples were made with a capillary rheometer specially designed for concentrated suspen- sions.7c-72 A built-in agitator was used to break down the thixotropic structure of the red mud to its equilibrium state and to maintain this state during the course of measurement. Capillary tubes having different diameters and lengths were used to check and hence to correct for end and wall effects, if any. Flow data obtained with tubes having diameters from 3.4 to 5.3 mm and a length-to-diameter ratio from 100 to 200 have shown no significant dimension effects, provided the samples were at an equilibrium structural state.
Figure 3 shows the typical flow curves obtained for a red mud sample at different solids concentration (3667% on weight basis). The data were plotted in terms of wall shear stress (7, = DAP/4L) versus apparent shear rate (8V/D), where D and L are diameter and length, respectively, of the capillary tube, AP is the pressure drop across the tube, and V is the average velocity of the suspension. Apparent shear rate can be converted into true shear rate at the capillary wall (p,) using the Rabinowistch-Mooney relationship73 which is valid whether or not the fluid has a yield stress.
%=($)(y) (5)
where
d log(T,) n’ = d log(8VID) ’
Shear Stress Relaxation Method
A concentric cylinder viscometer (Haake Rotovisco model RV3) was used for direct measurement of the yield stress following the method of residual stress or stress relaxation.15T41B54 The measuring

332 DZUY AND BOGER
Y E z .
-I
g 100
so
60
40
20
0 0 1000 zoo0 3000 4M)O
8V/D, 6'
Fig. 3. Capillary rheometer data for a red mud sample at different solids concen- trations.
system consisted of a rotating inner cylinder (bob) and a stationary outer cylinder (cup) with a radius ratio of 1.048 and a gap width of 0.96 mm. As purchased from the suppliers, both cylinders were ribbed with vertical grooves to prevent slip at the cylinders’ surface in contact with the suspension. The procedure used for yield stress measure- ment is illustrated in Figure 4. After the sample was loaded into the gap between the cylinders, the bob was rotated at an arbitrarily chosen speed and the torque acting on the bob was measured as function of time. As soon as the equilibrium condition was established-when the measured torque remained constant with time-the driving motor was brought to a sudden stop and the shear stress still remaining on the bob in the relaxed state was taken as the yield stress. If the sus- pension possesses a true yield stress, the residual stress must be finite and continues to be constant, for a practically long time of relaxation, in preventing the bob from returning to ita original zero stress position. This method thus applies directly the definition of the true yield stress as the shear stress limit between a flow and nonflow condition.

YIELD STRESS OF SUSPENSIONS 333
8” L m 20
go
go !j 60
Q I- 4o 30
N =23 rpn
Fig. 4. Illustrated procedure of the stress relaxation method with rotating cylinder viscometer for direct yield stress measurement.
To ascertain reproducibility of the results and applicability of this technique, the procedure described above was repeated several times at other constant rotational speeds (see Fig. 4).
The Vane Method
Description
All the vanes used in the present study consisted of four identical blades welded symmetrically around a small cylindrical shaft, as shown schematically in Figure l(a). The blades were 0.55 mm thick and made of stainless steel. A list of vanes used and their dimensions is given in Table II as well as the values for the vane parameter K calculated by means of Eq. (3).
Figure 1 (b) shows the vane apparatus diagrammatically. The vane
TABLE II
Vanes and Their Dimensions [Symbols Defined in Fig. l(a)]
Vane D” x 103 H x 10” HID, K x lo6 No. (4 b-4 (-) (m3)
1 12.74 12.74 1 4.331 2 18.90 9.32 0.493 8.764 3 20.00 19.2 0.960 16.253 4 19.50 28.8 1.477 21.085 5 26.00 24.6 0.946 35.325 6 19.32 38.0 1.967 26.056 7 26.15 50.28 1.923 63.371

334 DZUY AND BOGER
(A) is driven by an electronically controlled dc motor (B) which is capable of providing constant speeds from 0.1 to 1000 rpm. The torsional moment acting on the vane is measured by means of the torsion head (C) located between the vane spindle and the driving motor. A control console (D) provides facilities for setting the motor speed and indication meters for speed and torque readings. The drive, torsion head, and instrument console are actually parts of the Haake viscometer. Moreover, torque values can also be recorded continuously with time by means of a strip chart recorder (E).
Procedure
The procedure for the vane technique is briefly described as follows. A 500-mL Pyrex beaker (id. = 79 mm) containing ca. 500 mL of the suspension was raised slowly, by means of a laboratory jack, until the vane was fully immersed in the sample. Care was taken to place the vane at approximately the center of the sample volume to minimize interference caused by the wall of the beaker. The vane was then rotated at a predetermined constant velocity and the resulting torque was recorded with time until the maximum torque value was obtained. Knowing the vane dimensions and from the measured maximum torque, the yield stress was calculated using Eq. (2).
Effect of Vane Rotational Speed
Since the principle of the vane method is centered on extremely slow shearing to detect the yielding of the material, satisfactory yield stress measurements can be achieved only if the vane is rotated at sufficiently low speeds. At too high a rotational speed, significant viscous resistance together with instrument inertia and insufficient damping may introduce errors to the measured maximum torque and hence to the calculated yield stress. The effect of rotational speed was studied in detail over a range of speeds from 0.1 to 256 rpm. Comparative results obtained for a 66% red mud sample are shown m Table III. The measured yield values were essentially constant over a range of from 0.1 to 8 rpm but increased with vane speed for rotation speeds greater than 8 rpm. This behavior was also observed with other samples and vanes as shown in Figure 5. On the basis of these results it was concluded that the suitable operating range of vane rotational speeds should be from 0.1 to 8 rpm. Nevertheless, to

YIELD STRESS OF SUSPENSIONS 335
TABLE III
Effect of Vane Rotational Speed on Yield Stress (66% Red Mud 5j8
Speed (rpm) Yield stress (N rne2)
0.1 168 0.2 169 0.4 163 0.8 154 2.0 159 8.0 165
16.0 183 32 172 64 190 90.5 225
128 281 181 337 256 351
a Vane 7: D, = 26.15 mm, HID, = 1.923.
minimize any unforeseen errors all vane measurements in this work were carried out at the lowest possible speed of 0.1 rpm.
Effect of Vane Dimensions
Although the vane length may not have any significant influence on the measured yield stress, the effect of the vane diameter might be important due to the assumption of uniform shear stress distri- bution over the ends of the cylindrical yield surfaces. Three vanes (Nos. 4,5, and 7) having different length-to-diameter ratios (1.48,0.95,
wt% solids
67. 5 b
*A----.
oy”” =
0 02 0.4 06 0.e I 2 4 6 a
ROTATIONAL SPEED, rpm Fig. 5. Effect of vane rotational speed on the yield value measured with the vane
method: (0) vane 4, (0) vane 5, (A) vane 6, (e) vane 7.

336 DZUY AND BOGER
and 1.92) were used to study the effect of vane dimensions. As seen in Table II, vanes 4 and 5 have almost equal lengths but different diameters whereas vanes 5 and 7 have the same diameter but different lengths. The results obtained with these three vanes (all rotated at 0.1 rpm) are shown in Table IV for red mud sample No. 2 at different concentrations. Over the sizes studied, since the difference in the yield values obtained with the three vanes is well within the experi- mental error, the effect due to vane dimensions can be neglected. This conclusion is further supported by the results shown in Figure 5 with four different vanes for red mud samples at various concen- trations. These results may be used to justify the assumption of uniform shear stress distribution at the end surfaces.
RESULTS AND DISCUSSION
Indirect Methods
The data presented in Figure 3 clearly show that red mud possesses a yield stress at all concentrations studied, since the flow curves if extended to zero shear rate will intersect the shear stress axis at finite values. The existence of the yield stress was apparent in the course of the capillary rheometer experiments as flow of the suspension did not commence until a certain critical pressure was exceeded. Due to the difficulty in measuring this critical pressure, from which yield stress can be calculated, it is a common practice to determine indi- rectly the yield stress by extrapolation of the shear stress-shear rate data to zero shear rate.
TABLE IV
Effect of Vane Dimensions on Yield Stress (Red Mud 2C)
Solids wt % Vane 7
Yield stress (N rne2) Vane 5 Vane 4
52.6 2.7 3.1 2.6 56.8 6.5 7.0 5.5 60.0 14.1 14.0 11.6 62.1 26.1 27.1 25.5 63.4 40 41 39 64.7 52 53 52 65.8 78 74 77 66.6 106 106 102 68.0 180 165 172

YIELD STRESS OF SUSPENSIONS 337
Direct Extrapolation
For the two least concentrated samples (36 and 43%), since straight lines could be reasonably drawn through the data points the yield stress values were simply taken as the stress intercepts of the lines of best fit (see Fig. 3). The yield stress of more concentrated red mud samples, however, was obtained by extrapolation of the low shear rate data since their flow curves are nonlinear at shear rates below ca. 500 s-l. Both graphical and statistical techniques of extrapolation used have produced essentially the same results for the set of data pre- sented in Figure 3.
Even if the extrapolation is performed carefully, the yield values obtained are somewhat uncertain especially with highly concentrated suspensions that exhibit a pronounced nonlinear shear stress-shear rate relationship. This is because the accuracy of the direct extrap- olation method is largely dependent on the availability and reliability of the experimental flow data at sufficiently low shear rates.
Model Fittings
For more accurate determination of the yield stress, the flow data have been fitted to each of the three models commonly used for fluids with yield stress. The constitutive equations involved are listed in Table V. Equation (i) is the simple Bingham relationship1 which predicts that shear stress is a linear function of shear rate with the stress intercept being the Bingham yield value (T:). Equation (iia), which is an alternative expression of the Bingham model, has been developed by Buckingham31 and Reiner72 for tube flow of Bingham fluids. It predicts that the relationship between shear stress and apparent shear rate (8V/D) is linear at high 8V/D i.e., for T,, >> T!
[see Eq. (iib)], b u nonlinear at low 8VID. t According to Eq. (iib) the stress intercept of the linear portion of the flow curve at high 8VID should be equal to 4/3 of the Bingham yield value. Thus, the Bing- ham yield stress can be obtained by using either Eq. (i) or Eq. (ii). With the latter, however, capillary rheometer data can be used directly without having to convert into true shear stress-shear rate (TV - Tw) data. Nevertheless, both approaches have been used for the data shown in Figure 3 to check not only the accuracy of the resulting yield values but also the validity of utilizing the Bingham model for red mud suspensions. The results obtained are compared in Table VI. As may be seen, with the flow data measured for the two least concen-

338 DZUY AND BOGER
TABLE V
List of Rheological Equations Used for Yield Stress Determination by Extrapolation Methods (All Applied for 7 > ry)
B&ham model’:
7 = Ty + 7Jpj
Buckingham-Reiner equation31,74:
(9
(iia)
(iib)
Herschel and Bulkley model%
T=T~+~?~
Casson models:
,112 = +2 + p7112.yl/2
(iii)
(iv)
trated samples, both Eqs. (i) and (ii) yield essentially the same results. For higher concentrations, however, the Buckingham-Reiner rela- tionship tends to result in lower yield values with this discrepancy increasing with increase in solids concentration. This is because not only are the r, vs. 8VID data nonlinear at low 8VID as would be ex- pected from Eq. (iia), but so are the T, vs. +, data [after conversion by means of Eq. (5)]. Values of the critical shear rates TWC below
TABLE VI
Values of the Bingham Yield Stress and Critical Shear Rates (Red Mud Sample 2)
Solids wt %
Bingham yield stress (N m-*)
w (2P
36 0.49 0.50 0 0 43 2.77 2.48 150 100 52 9.38 11.50 210 150 55 16.88 18.40 400 400 58 28.5 33.0 420 300 62 46.9 59.5 500 400 67 151.5 184.0 600 350
a (1) from TV vs. 8 V/D plot; (2) from TV vs. -rw plot.
YIELD STRESS OF SUSPENSIONS 339
which the linear behavior predicted by Bingham model tends to exist are also given in Table VI. These critical values appear to increase proportionally with concentration. Thus, from the above results, it may be deduced that the Bingham plastic model, although applicable to dilute suspensions, breaks down seriously with concentrated sys- tems. Furthermore, the Buckingham-Reiner expression with its fourth-power term, in an attempt to account for plug flow at low shear rates, is not adequate to describe the nonlinear behavior observed in these systems.
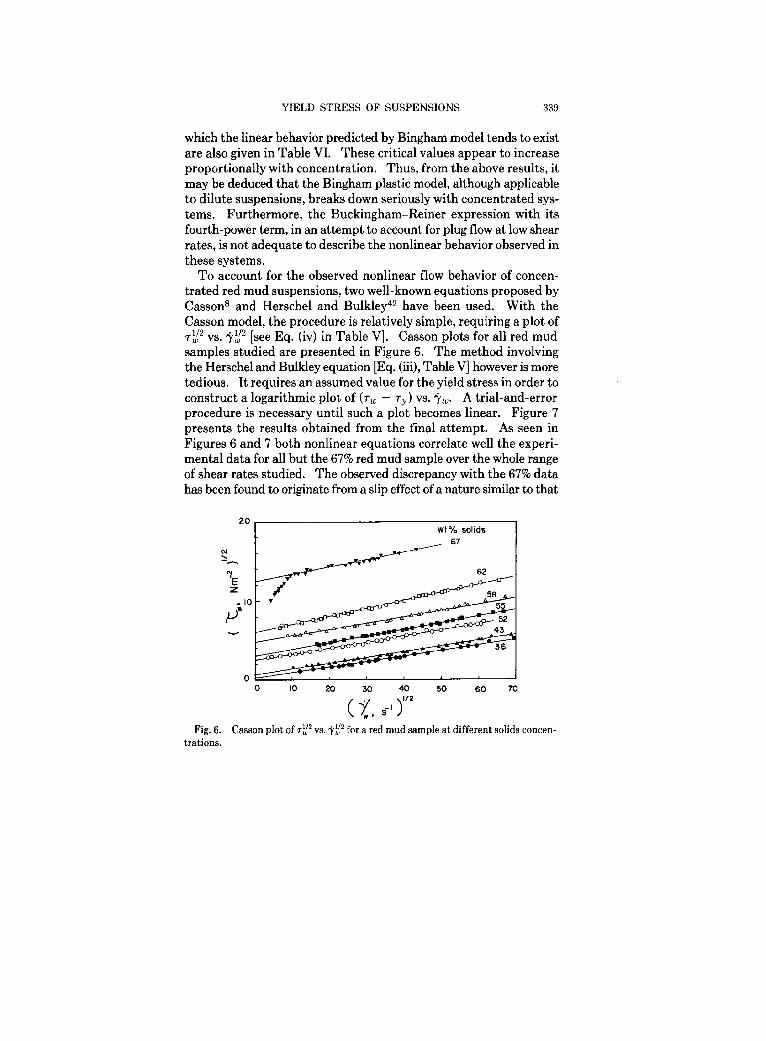
To account for the observed nonlinear flow behavior of concen- trated red mud suspensions, two well-known equations proposed by Casson8 and Herschel and Bulkley42 have been used. With the Casson model, the procedure is relatively simple, requiring a plot of 7:” vs. ;lfl” [see Eq. (iv) in Table V]. Casson plots for all red mud samples studied are presented in Figure 6. The method involving the Herschel and Bulkley equation [Eq. (iii), Table V] however is more tedious. It requires an assumed value for the yield stress in order to construct a logarithmic plot of (7, - 7Y) vs. Tw. A trial-and-error procedure is necessary until such a plot becomes linear. Figure 7 presents the results obtained from the final attempt. As seen in Figures 6 and 7 both nonlinear equations correlate well the experi- mental data for all but the 67% red mud sample over the whole range of shear rates studied. The observed discrepancy with the 67% data has been found to originate from a slip effect of a nature similar to that
20 wt% solids
67 ? ./--- x 7 5
$”
0
Fig. 6. Casson plot of T$ vs. q’,/’ for a red mud sample at different solids concen- trations.

340 DZUY AND BOGER
C-T
(Nm-*)
IO'
Fig. 7. Plots of In (TV - TV) vs. In (‘lw) to test the applicability of the Herschel and Bulkley model.
observed by Green4 and Scott Blair and Crowther3* with flow of highly concentrated suspensions in smooth tubes. To prove the presence of such a slip effect, capillary measurements have been made with a 70% red mud sample using two tubes of almost identical dimensions, but relatively different surface finish. The results are presented in Figure 8. Above a critical 8VID of about 30 s-r, the data points ob-
4 I I I 4 IO’ IO2 6
W/D , s-’
Fig. 8. Slip flow observed with capillary tubes: (0) smooth tube, (0) rough tube.

YIELD STRESS OF SUSPENSIONS 341
tained with both tubes coincide to form a single curve. At lower 8VID, however, the “smooth” tube produces a higher shear rate than does the “rough” tube at any given shear stress. Since it only occurs at low shear rates, this slip effect may be considered as different from the conventional wall effect observed with flow through small capillary tubes. Furthermore, the existence of such pronounced wall slip may be explained in terms of the high yield stress in highly concentrated and flocculated suspensions. At shear stress below the yield value, the suspensions may flow as an unsheared solid plug with a solid-free liquid layer acting as lubricant next to the smooth tube wall. As the shear stress is increased, this layer would become thinner and even- tually disappear when the yield stress is exceeded. Although the mechanism for the formation of this lubricating layer and its nature are not yet understood, its presence has been confirmed experimen- tally.4,32 Whatever the reason, the results shown in Figure 8 quali- tatively demonstrate that wall slip observed with highly concentrated suspensions may be reduced greatly by using tubes with a rough surface.
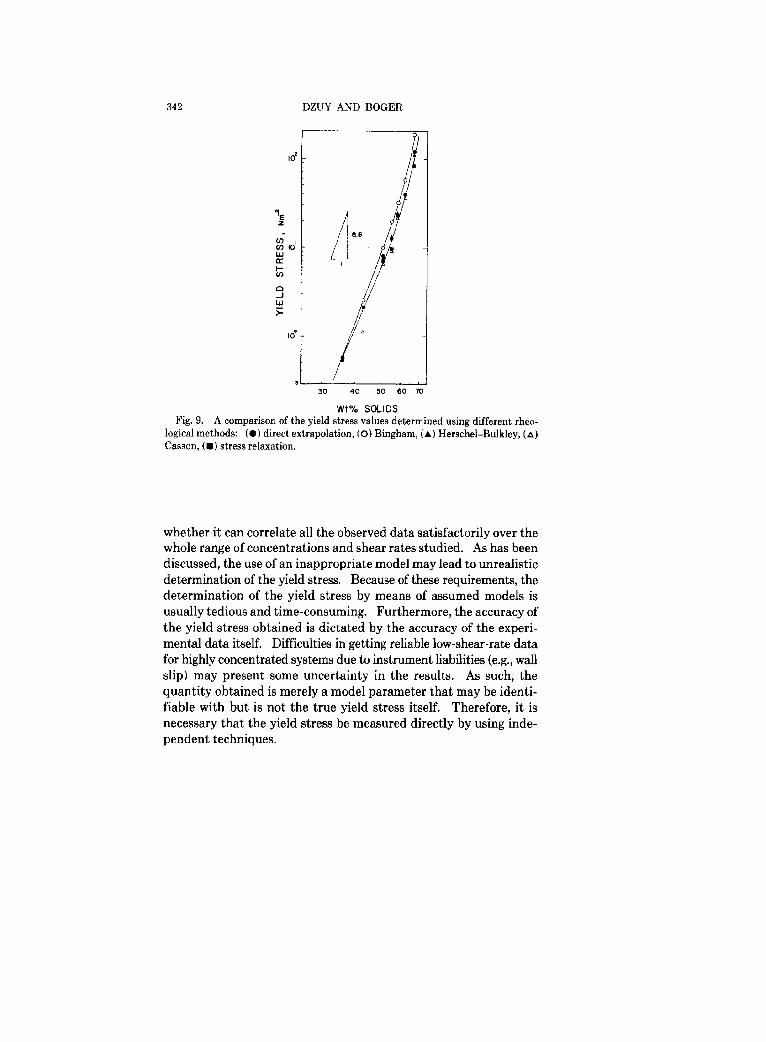
Yield stress results obtained by model fits are presented in Figure 9 for comparison. The yield stress values given by the nonlinear Casson and Herschel and Bulkley equations are in good agreement with each other and with the yield values directly extrapolated from shear stress-shear rate data. The use of the simple Bingham model, however, results in an overestimate of the yield stress by a factor of 1.5-2.0. Only with concentrations lower than about 40% are the Bingham yield values compatible with the yield stress obtained by other methods. Thus, it may be deduced from these results that the Bingham model is not applicable to concentrated red mud suspensions in general for correlating the flow data, and in particular for deter- mining the yield stress. The nonlinear constitutive equations pro- posed by Casson and Herschel and Bulkley seem satisfactory to de- scribe red mud rheological behavior (see Figs. 6 and 7) and hence produce realistic values for the yield stress.
The use of a model is practically convenient for the characterization of the flow behavior of an unknown material. If the purpose is to correlate experimental data for certain applications then the choice of a correct model is immaterial as long as it correlates the data well over the usually narrow range of shear rates of interest. However, if a model is used to determine a true material property like the yield stress then the model must be selected and tested carefully to see
342 DZUY AND BOGER
30 40 50 60 -n,
Wt% SOLIDS Fig. 9. A comparison of the yield stress values determined using different rheo-
logical methods: (0) direct extrapolation, (0) Bingham, (A) Herschel-Bulkley, (A)
Casson, (m) stress relaxation.
whether it can correlate all the observed data satisfactorily over the whole range of concentrations and shear rates studied. As has been discussed, the use of an inappropriate model may lead to unrealistic determination of the yield stress. Because of these requirements, the determination of the yield stress by means of assumed models is usually tedious and time-consuming. Furthermore, the accuracy of the yield stress obtained is dictated by the accuracy of the experi- mental data itself. Difficulties in getting reliable low-shear-rate data for highly concentrated systems due to instrument liabilities (e.g., wall slip) may present some uncertainty in the results. As such, the quantity obtained is merely a model parameter that may be identi- fiable with but is not the true yield stress itself. Therefore, it is necessary that the yield stress be measured directly by using inde- pendent techniques.

YIELD STRESS OF SUSPENSIONS 343
Stress Relaxation Method
The results obtained with the stress relaxation method are com- pared in Figures 9 and 10 with the yield values determined by other methods. Except for the Bingham yield value as would be expected, there is good agreement between the residual shear stress and the indirectly determined yield stress. This technique, despite its sim- plicity, suffers certain experimental difficulties. Reproducible results could only be obtained over a narrow intermediate range of solids concentration. With red mud suspensions at low solid content (<40 wt. ‘31) it was difficult to obtain a constant value of the residual stress, presumably due to the settling of the coarse fraction of the particles (because of the low yield stress) over a long period of time required by the experiment. At higher concentrations (>60 wt %), although ribbed cylinders were used, slip effects and a nonuniform shear dis- tribution were found to result in poor reproducibility. Nevertheless, the technique of stress relaxation, with its sound principle and sim- plicity, if properly utilized can be a very useful tool for the measure- ment of the yield stress of moderately concentrated suspensions, particularly since it is a direct method and is thus not affected by the accuracy of the measured flow data or by the applicability of an a priori assumed model as are the indirect methods.
60 70
Wt%SOLlDS Fig. 10. A comparison of the yield stress values obtained with the vane test to other
methods: (0) Bingham, (A) Herschel-Bulkley, (A) Casson, (m) stress relaxation, (0) vane method.

344 DZUY AND BOGER
The Vane Method
It has been established that the quantity measured with the vane method is a true material property that is independent of the vane dimensions and rotational speeds. To find out whether this quantity is related to the rheological yield stress, a direct comparison between the vane results and the yield stress obtained with other accepted techniques, discussed earlier, is shown in Figure 10. It should be noted that a different red mud sample from that used to obtain the data shown in Figure 9 was used for the yield stress measurements shown in Figure 10. It is encouraging to find that the critical shear stress corresponding to the maximum torque measured with the vane technique is comparable with the yield stress determined by rheo- logical methods. At solids concentration greater than about 64%, as seen in Figure 10 no distinction can be made between the vane results and the yield values given by other techniques. At lower concen- trations the vane results tend to become higher than the rheological yield stress. This discrepancy may be attributed to the breakdown of some of the assumptions discussed previously concerning the theory of the vane, for less concentrated systems in which the contribution of the viscous stress might become significant in comparison with the network stress and where the shear stress distribution at yielding might not be uniform as assumed. Another reason could well be due to the progressive failure of the material, i.e., the yielding takes place mostly in front of each blade of the vane instead of at the edges This observed difference at low concentrations was, however, not unex- pected since the vane device at the present development stage was originally designed to measure the mechanical strength of soils that are in fact highly concentrated suspensions. Furthermore, it must be noted that, with the red mud suspensions studied, the limiting solids concentration of 64% above which the vane technique is most applicable corresponds to the onset of the anomalous slip flow ob- served with capillary rheometer measurements and also to the upper concentration limit set by the stress relaxation technique. The above results and observation have thus signified a potential use of the vane as a simple yet accurate technique for measuring the yield stress of highly concentrated suspensions where conventional methods are either unsuccessful or impossible to use. In addition, the special geometry of the vane may enable effective measurements of the yield stress of thixotropic materials whose structure is either undisturbed or partly broken down by previous shear. Similarly, structural re-

YIELD STRESS OF SUSPENSIONS 345
growth as a function of aging time, in the absence of shear, can also be studied accurately by means of the vane.
Results with a Titanium Dioxide Suspension
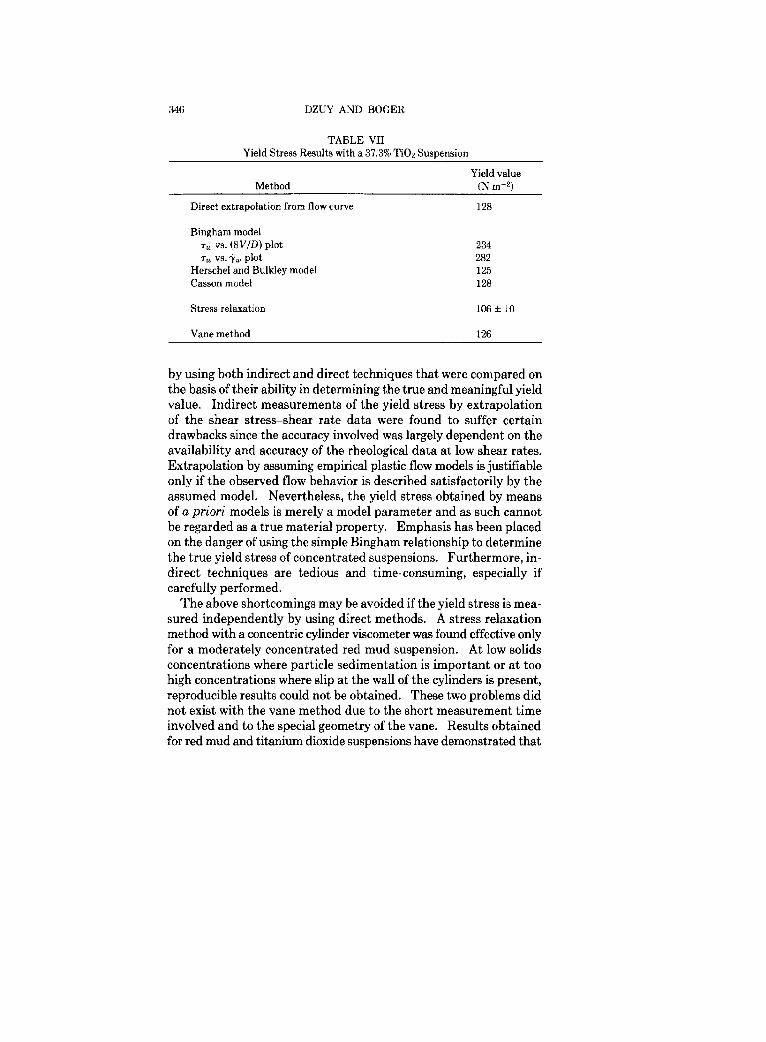
In order to confirm the applicability of the vane shear method for measuring the yield stress of other concentrated suspensions, for which a true yield value exists, measurements have also been made with a titanium dioxide suspension. In Figure 11 are shown the shear stress-shear rate data obtained for a 37.3 wt % titanium dioxide sus- pension. The presence of a yield stress is obvious as shown by a sharp intersection of the flow curve on the shear stress axis. The values of yield stress obtained by different methods are compared in Table VII for the titanium dioxide suspension. The agreement between the vane method and other techniques, except for the Bingham approach, is excellent. The calculated Bingham yield stress, which is about two times higher than the true yield value, again indicates the weakness of the Bingham approximation for the flow behavior of concentrated suspensions.
CONCLUDING REMARKS
Rheological characterization of red mud has shown that this typical industrial suspension has a true yield stress that increases rapidly with solids concentration. The yield stress of red mud has been assessed
I . n v loo 200 3Jo 400
8V/D. 5’
Fig. 11. Capillary rheometer data for a 37.3% solids suspension of titanium dioxide.
346 DZUY AND BOGER
TABLE VII Yield Stress Results with a 37.3% TiOz Suspension
Method
Direct extrapolation from flow curve
Bingham model T”, vs. @V/D) plot 7, vs. qW plot
Herschel and Bulkley model Casson model
Yield value (N m+)
128
234 282 125 128
Stress relaxation 106 f 10
Vane method 126
by using both indirect and direct techniques that were compared on the basis of their ability in determining the true and meaningful yield value. Indirect measurements of the yield stress by extrapolation of the shear stress-shear rate data were found to suffer certain drawbacks since the accuracy involved was largely dependent on the availability and accuracy of the rheological data at low shear rates. Extrapolation by assuming empirical plastic flow models is justifiable only if the observed flow behavior is described satisfactorily by the assumed model. Nevertheless, the yield stress obtained by means of a priori models is merely a model parameter and as such cannot be regarded as a true material property. Emphasis has been placed on the danger of using the simple Bingham relationship to determine the true yield stress of concentrated suspensions. Furthermore, in- direct techniques are tedious and time-consuming, especially if carefully performed.
The above shortcomings may be avoided if the yield stress is mea- sured independently by using direct methods. A stress relaxation method with a concentric cylinder viscometer was found effective only for a moderately concentrated red mud suspension. At low solids concentrations where particle sedimentation is important or at too high concentrations where slip at the wall of the cylinders is present, reproducible results could not be obtained. These two problems did not exist with the vane method due to the short measurement time involved and to the special geometry of the vane. Results obtained for red mud and titanium dioxide suspensions have demonstrated that

YIELD STRESS OF SUSPENSIONS 347
the quantity measured with the vane method is identifiable with the true yield stress especially in highly concentrated systems. The vane method may be considered superior to other available direct methods proposed for yield stress measurement since it is quick and simple to use with a low-cost apparatus. Furthermore, since the vane method operates under almost static conditions and the vane geometry does not significantly disturb the sample prior to measurement, it is an attractive method for the study of the kinetics of structural thixotropic materials. We have used the vane method for this purpose.
The authors’ work on the rheology of red mud suspensions has been supported by Alcoa of Australia Limited. They are grateful for this support and are very pleased by the cooperative and productive relationship that has developed between Alcoa and the Department of Chemical Engineering at Monash University.
References
1. E. C. Bingham, Fluidity and Plasticity, McGraw-Hill, New York, 1922, p. 215.
2. R. Houwink and H. K. de Decker, Elasticity, Plasticity and Structure ofMatter, 3rd ed., Cambridge, U. P., London, 1971, p. 1.
3. E. C. Bingham and H. Green, Proc. Am. Sac. Test. Mater., 20(H), 640 (1919). 4. H. Green, Proc. Am. Sot. Test. Mater., 20(H), 451 (1920). 5. R. B. Bird, D. Gance, and B. J. Yarusso, The Rheology and Flow of Viscoplastic
Materials, Research Report (RRC74), University of Wisconsin, Madison, WI, 1981. 6. C. M. McDowell and F. L. Usher, Proc. R. Sot. London Ser. A, 131,409, 564
(1931). 7. J. M. P. Papenhuijzen, Rheol. Acta, 11,73 (1972). 8. N. Casson, in Rheology of Disperse Systems, C. C. Mill, Ed., Pergamon, London,
1959, p. 84. 9. S. Thornton and D. Rae, Proc. Phys. Sot. B, 66,120 (1953).
10. P. S. Roller and K. Stoddard, J. Phys. Chem., 48,410 (1944). 11. R. Houwink and H. K. de Decker, Elasticity, Plasticity and Structure of Mutter,
3rd ed., Cambridge U. P., London, 1971, p. 130. 12. E. R. Lang and C. K. Rha, Proc. 8th Int. Congr. Rheol., Naples, 1980, Vol. 2, p.
659. 13. C. F. Goodeve, Trans. Faraday Sot., 35,342 (1939). 14. P. Rehbinder, Pure Appl. Chem., 10,337 (1965). 15. A. S. Michaels and J. C. Bolger, Ind. Eng. Chem. Fundam., l(3), 153 (1962). 16. R. J. Hunter and S. K. Nicol, J. Colloid Interface Sci., 28,250 (1968). 17. B. A. Firth and R. J. Hunter, J. Colloid Interface Sci., 57,257,266 (1976). 18. F. H. Norton, A. L. Johnson, and W. G. Lawrence, J. Am. Ceramic Sot., 27(5),
149 (1944). 19. D. G. Thomas, AIChEJ.,7,431 (1961). 20. N. P. Mishra, D. A. Severson, and T. C. Owens, Chem. Eng. Sci., 25, 653
(1970).

348 DZUY AND BOGER
21. A. G. Bain and S. T. Bonnington, The Hydraulic Transport of Solids by Pipe- line, Pergamon, Oxford, 1970, p. 37.
22. E. Condoliosand E. E. Chapus, Chem. Eng., 93,131,145 (1963). 23. A. D. Thomas, Chem. Eng. Aust., CE2,22 (1977). 24. R. W. Ansley and T. N. Smith, AIChE J,, 13,1193 (1967). 25. L. Valentik and R. L. Whitmore, BF. J. Appl. Phys., l&l197 (1965). 26. G. F. Brookes and R. L. Whitmore, Rh’eol. Acta, 8(4), 472 (1969). 27. H. Pazwash and J. M. Robertson, J. Hydraulic Res., 13(l), 35 (1975). 28. E. J. Wasp, J. P. Kenny, and R. L. Gandhi, Solid-Liquid Flow Slurry Pipeline
Transportation, Trans. Tech., Clausthal, 1977, p. 70. 29. M. E. Charles and R. A. Charles, in Advances in Solid-Liquid Flow in Pipes and
its Application, I. Zandi, Ed., Pergamon, New York, 1971, p. 187. 30. E. R. Lang and C. K. Rha, J. Text. Studies, 12,47 (1981). 31. E. Buckingham, Proc. Am. Sot. Test. Mater., 21(B), 1154 (1921). 32. G. W. Scott Blair and E. M. Crowther, J. Phys. Chem., 33,321 (1929). 33. G. D. Hobson, J.Lnst. Pet. Technol., 26,533 (1940). 34. S. Thornton, Proc. Phys. Sot. B, 66,115 (1953). 35. G. W. Scott Blair, Physics, 4,113 (1933). 36. E. W. Billington, Proc. Phys. Sot., 75,40 (1960): 76,127 (1960). 37. R. N. Weltmann, NACA Tech. Note, No. 3397,1955. 38. P. R. Crowley and A. S. Kitzes, Ind. Eng. Chem., 49(5), 888 (1957). 39. E. C. Gay, P. A. Nelson, and W. P. Armstrong, AIChE J., 15,815 (1969). 40. W. H. Herschel and C. Bergquist, Ind. Eng. Chem., 13(8), 703 (1921). 41. E. Bantoft, in Rheology ofDisperse Systems, C. C. Mill, Ed., Pergamon, London,
1959, p. 105. 42. H. Herschel and R. Bulkley, Proc. Am. Sot. Test. Mater., 26(B), 621 (1926). 43. G. W. Scott Blair, Rheol. Acta, 5(3), 184 (1966). 44. W. K. Asbeck, Off. Dig. Fed. Sot. Paint Technol., 33,65 (1961). 45. S. Onogi, T. Matsumoto, and Y. Warashina, Trans. Sot. Rheol., 17(l), 175
(1973). 46. I. M. Krieger and M. Eguiluz, Trans. Sot. Rheol., 20(l), 29 (1976). 47. P. Rehbinder, Proc. 5th Int. Congr. Rheol., Tokyo, 1970, Vol. 2, p. 375. 48. N. C. Petrellis and R. W. Flumerfelt, Can. J. Chem. Eng., 51,291 (1973). 49. J. J. Vocaldo and M. E. Charles, Can. J. Chem. Eng., 49,576 (1971). 50. V. P. Pavlov and G. V. Vinogradov, J. Am. Sot. Lubrication Eng., 21, 479
(1965). 51. G. V. Vilnogradov, Y. F. Deinega, and Y. A. Verbitsky, Rheol. Acta, 6(3), 252
(1967). 52. P. S. Roller and C. K. Stoddard, J. Phys. Chem., 48,410 (1944). 53. M. Van den Temple, Rheol. Acta, 1,115 (1958). 54. C. Tiu and D. V. Boger, J. Text. Studies, 5,329 (1974). 55. J. L. Russell, Proc. R. Sot. London Ser. A, 154,550 (1936). 56. M. Keentok, Rheol. Acta, 21,325 (1982). 57. Q. D. Nguyen and D. V. Boger, Proc. 2nd Natl. Con/. Rheol., Sydney, Australia,
1981, p. 19. 58. B. Brimhall and R. M. Hixon, Ind. Eng. Chem. Anal. Ed., 11(7), 358 (1939). 59. F. Moore, Rheology of Ceramic Systems, MacLaren, London, 1965, p. 45. 60. W. A. Dukes, Proc. 5th Int. Congr. Rheol., Tokyo, 1970, Vol. 2, p. 315. 61. W. G. Holtz, ASTM Sp. Tech. Publ., No. 361,1 (1964).

YIELD STRESS OF SUSPENSIONS 349
62. P. Meyer, J. Inst. Pet. Technol., 20,lO (1934). 63. P. Evans and A. Reid, Trans. Min. Geol. Inst. India, 32,1(1936). 64. E. C. W. A. Geuze and Tan Tjong-Kie, Proc. 2nd Znt. Congr. Rheol., Oxford, 1953,
p. 30. 65. D. De Kee, G. Turcotte, K. Fildey, and B. Harrison, J. Text. Studies, 10,281
(1980). 66. L. Cadling and S. Odenstad, Proc. R. Swed. Geotech. Inst., No. 2,7 (1950). 67. L. Carlson, Proc. 2nd Znt. Conf. Soil Mechanics and Foundation Engineering,
Rotterdam, 1948, Vol. 1, p. 265. 68. G. Aas, Proc. 6th Znt. Congr. Soil Mechanics, Montreal, 1965, p. 141. 69. American Society for Testing Materials, Standard Method for Field Vane Shear
Test in Cohesive Soil, Annual Book of ASTM Standards, 1975, Part 19, D2573-72, p. 321.
70. Q. D. Nguyen and D. V. Boger, Proc. Symp. Rheol. Conversion and Conservation of Energy, Br. Sot. Rheol. (Australian Branch), Melbourne, 1980, p. 55.
71. Q. D. Nguyen, D. V. Boger, F. M. Want, and P. M. Colombera, Proc. 8th Znt. Conf. Hydraulic Transport of Solids in Pipes, BHRA Fluid Eng., Johannesburg, 1982, p. 249.
72. C. Tiu, Q. D. Nguyen, P. H. T. Uhlherr, and D. V. Boger, Proc. 2nd APCChE Congr., Manila, 1981, p. 57.
73. A. H. P. Skelland, Non-Newtonian Flow and Heat Transfer, Wiley, New York, 1967.
74. M. Reiner, Kolloid Z., 39,80 (1926).
Received April 10,1982 Revised February 18,1983 Accepted March 3,1983