reviewing the structure and capacity of the nigerian
TRANSCRIPT

Reviewing the structure and capacity of
the Nigerian economy for improving
Government Revenue
Dr. Yemi Kale
Statistician General of the Federation/ CEO
National Bureau of Statistics
08/05/2015
BudgIT Symposium: Options and possibilities for government revenue growth and efficiency- Options, Opportunities and Possibilities

OUTLINE…
i. Introduction
ii. What is GDP?
iii. What GDP is not
iv. Structure of the
Economy: Output
approach
vii. Structure of
government
revenue
viii. Conclusions
v. Structure of the
Economy:
Expenditure
approach
vi. Opportunities for
further growth

A
A
A
A
INTRODUCTION
SECTION A

UEFA CHAMPIONS LEAGUE AND NIGERIA’S GDP
Q1: From these
statistics, can we tell
which team (left or
right) won the
match?
Q2: Does having a
higher ball possession
rate, or covering
more distance mean
that a team would
ALWAYS win the
match?

ENGLISH PREMIER LEAGUE AND NIGERIA’S GDP
Q1: From these
statistics, can we tell
which team (left or
right) won the
match?

B
B
B
B
What is GDP?
SECTION B
“Very few people indeed trully understand how the
regularly published GDP figures are constructed” Diane
Coyle

Domestic private savings
GDP Defined
Rest of world
Firms Households
Product
Markets
Factor
Markets
Government Save/Invest
Factor
cost
Sales
revenues
Wages
& rents
Private
cons.
Gov’t
exp.
Invest.
exp.
Transfers
Import payments
Export receipts Foreign savings
Taxes Gov’t savings
Domestic demand for final goods
Intermediate
demand Leakages and
withdrawals
Injections
Budget deficit
Current account
balance
Absorption
= C + I + G
GDP (market price)
= C + I + G + X – M
GDP (factor cost)
= L+K
Circular Flow of Income

The Gross Domestic Product (GDP) is the market value of all officially recognized final goods and services produced within
a country in a given period
Output/Production approach
Value of Sales of goods and services – Intermediate Consumption in producing those goods and services.
Expenditure Approach
GDP = C + I + G + (EX – IM)
Income Approach
Wages+Rent+Interests+ profits+ adjustments
What is GDP?

Methodology
Four major methodological pillars
The System of National Accounts (SNA 2008 version),
The International Standard Industrial Classification
(ISIC Revision 4),
The Central Product Classification (CPC version 2)
The development of a Supply and Use Table/matrix
(SUT)
Then NBS conducts sector surveys
Formal sector from company audited reports from FIrS,
SEC etc
Informal sector from HH surveys.
Data also collected from various MDAs, Federal
and States
9
Measuring GDP

Background and Key Milestones The SNA 2008: The SUTISIC 3.1 to 4
10
ISIC Rev.3.1
A Agriculture, hunting and forestry
B Fishing
C Mining and quarrying
D Manufacturing
E Electricity, gas and water supply
F Construction
G Wholesale and retail trade; …
H Hotels and restaurants
I Transport, storage and communications
J Financial intermediation
K Real estate, renting and business …
L Public administration …
M Education
N Health and social work
O Other community, social, personal …
P Activities of private households
Q Extraterritorial organizations and bodies
ISIC Rev.4
A Agriculture, forestry and fishing
B Mining and quarrying
C Manufacturing
D Electricity, gas, steam …
E Water supply; sewerage, waste …
F Construction
G Wholesale and retail trade; …
H Transportation and storage
I Accommodation and food service activities
J Information and communication
K Financial and insurance activities
L Real estate activities
M Professional, scientific and technical activities
N Administrative and support service activities
O Public administration …
P Education
Q Human health and social work activities
R Arts, entertainment and recreation
S Other service activities
T Activities of households …
U Activities of extraterritorial organizations …
10
C
C
C
C
What GDP is Not
SECTION C

UEFA CHAMPIONS LEAGUE AND NIGERIA’S GDP
Q1: From these
statistics, can we tell
which team (left or
right) won the
match?
Q2: Does having a
higher ball possession
rate, or covering
more distance mean
that a team would
ALWAYS win the
match?

UEFA CHAMPIONS LEAGUE AND NIGERIA’S GDP
Real Madrid qualified
for the Finals by
beating Bayern
Munich 4-0
Nearly all the stats
would indicate the
opposite
...the problem with
aggregates
...knowing what each
statistic measures
...focusing on data
not ideology!

ENGLISH PREMIER LEAGUE AND NIGERIA’S GDP
Q1: From these
statistics, can we tell
which team (left or
right) won the
match?
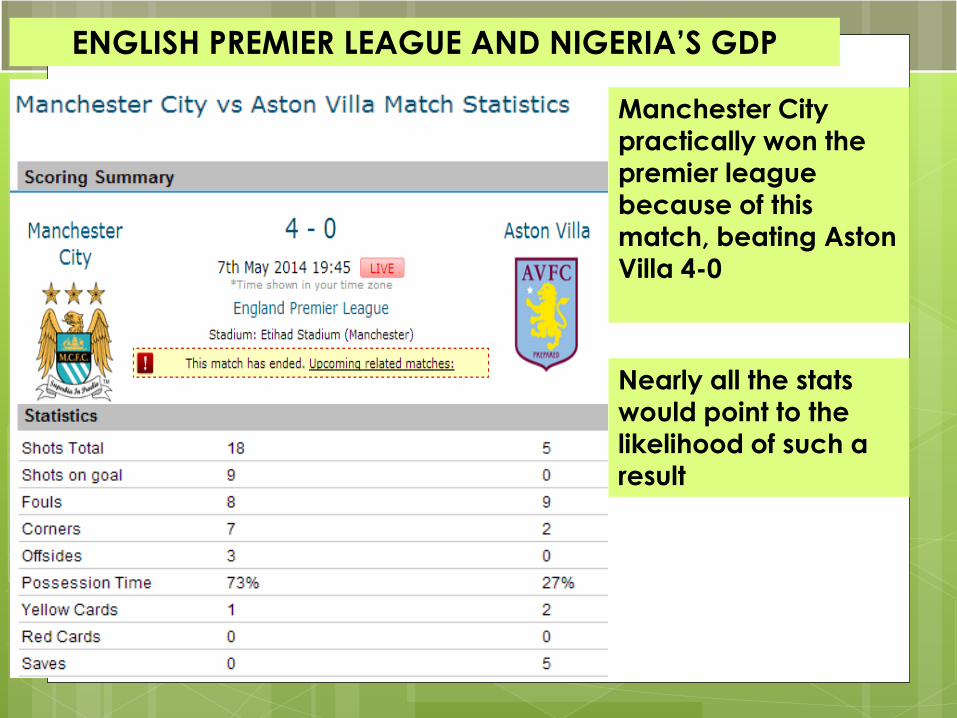
ENGLISH PREMIER LEAGUE AND NIGERIA’S GDP
Manchester City
practically won the premier league
because of this
match, beating Aston
Villa 4-0
Nearly all the stats
would point to the
likelihood of such a
result

GDP growth isn't synonymous with development
…but is required for Development
Rising output Increase in tax revenue development infrastructure (public goods) higher output
GDP not necessarily Significantly job creating Either
What is the nature of the growth?
In what sectors and are they high labor intensive sectors?
GDP Growth vs. Development vs Employment vs Poverty
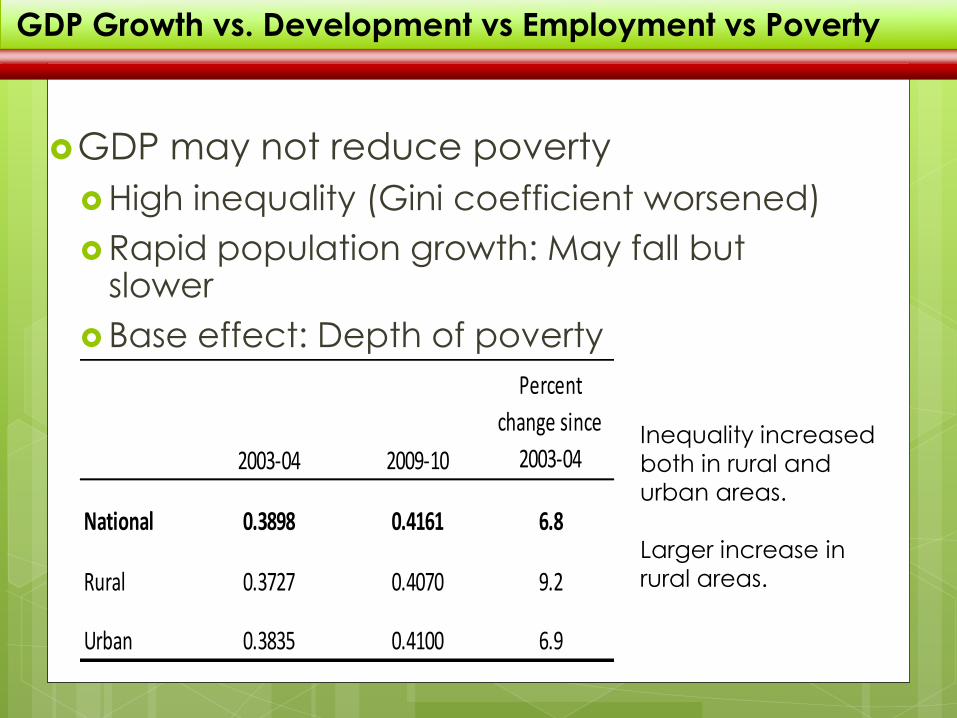
GDP may not reduce poverty
High inequality (Gini coefficient worsened)
Rapid population growth: May fall but slower
Base effect: Depth of poverty
2003-04 2009-10
Percent
change since
2003-04
National 0.3898 0.4161 6.8
Rural 0.3727 0.4070 9.2
Urban 0.3835 0.4100 6.9
Inequality increased
both in rural and
urban areas.
Larger increase in
rural areas.
GDP Growth vs. Development vs Employment vs Poverty

Socio Economic Ratios
5/9/2015 18
1419.54 1479.07 1517.41 1539.39
2281.14
2490.05
2683.98
2908.08
3,128
2010 2011 2012 2013 2014
Income per capita (US$)
Old Series (%) New Series (%)

19
Rebasing/Re-benchmarking of GDP
GDP and GDP per caita of top 10 economies, 2013, IMF
Rank Country GDP USD trn$ Rank Country GDP US$
1 United States 16.79 1 Qatar 98,814
2 China 9.18 2 Luxumbourg 78,670
3 Japan 4.9 3 Singaporre 64,584
4 Germany 3.63 4 Norway 54,947
5 France 2.73 5 Brunei 53,431
6 United Kingdom 2.53 6 Unites States 53,101
7 Brazil 2.24 7 Switzerland 46,430
8 Russia 2.11 8 Canada 43,472
9 Italy 2.07 9 Australia 43,073
10 India 1.87 10 Austria 42,597
26 Nigeria 0.5 121 Nigeria 2,689
Countries with the highest GDP are
not necessarily the same countries
with the highest per capita GDP ...Except for the US

D
D
D
D
Structure of the
Economy: Output
Approach
SECTION D

Macro Economic Summary
Real GDP Growth: Slower yet
strong
5/9/2015 21
0.00
1.00
2.00
3.00
4.00
5.00
6.00
7.00
8.00
2011 2012 2013 2014
Real GDP Growth (%)
Old Series (%)
New Series (%)

Old Series (N, Million, Current Prices) 2010 2011 2012 2013F
Agriculture 10,310,655.64 11,593,434.13 13,413,842.46 14,709,104.92
Industry 15,659,521.00 16,569,291.58 16,456,457.10 15,374,554.67
Services 8,014,577.50 9,247,134.90 10,673,800.38 12,313,106.11
TOTAL 33,984,754.13 37,409,860.61 40,544,099.94 42,396,765.71
Economic Structure by Output Approach
New Series (N, Million, Current Prices) 2010 2011 2012 2013
Agriculture 13,048,892.80 14,037,825.84 15,815,997.51 16,816,553.01
Industry 13,826,433.90 17,853,113.99 19,587,721.32 20,853,845.33
Services 27,736,937.48 31,089,457.4 36,310,216.23 42,422,165.04
TOTAL 54,612,264.18 62,980,397.22 71,713,935.06 80,092,563.38
Percentage change between Old and New Estimates (%)
2010 2011 2012 2013
Agriculture 27% 21% 18% 14%
Industry -12% 8% 19% 36%
Services 246% 236% 240% 245%
TOTAL 61% 68% 77% 89%
Largest
economy in
Africa;
26th largest in
the world
This
translates to
US$509.2
billion
Nominal GDP
(2013) est.:
N80.1trillion
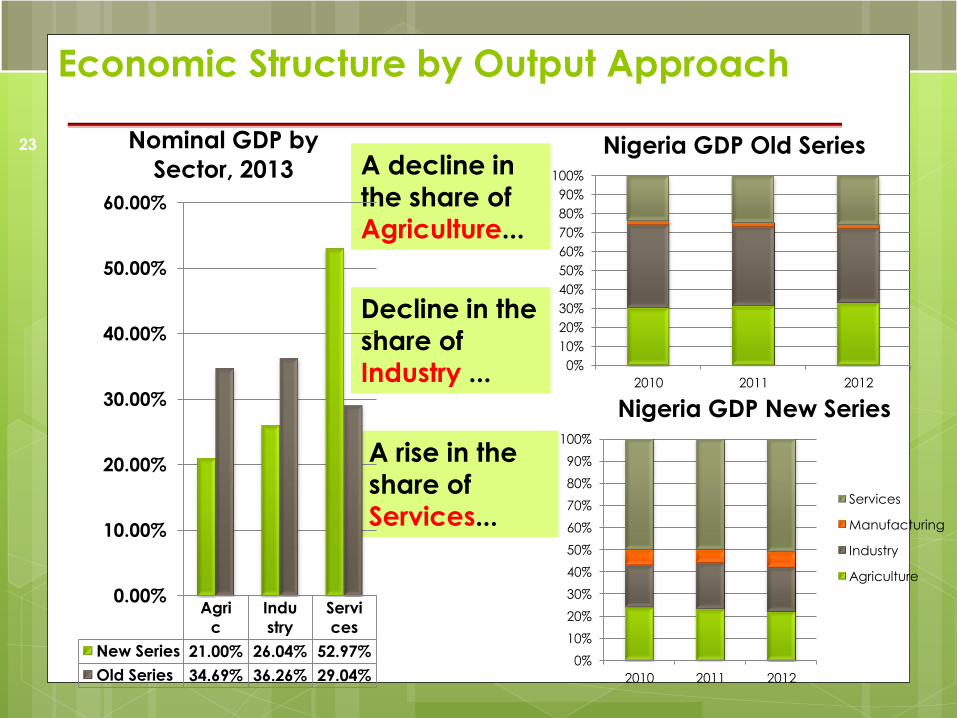
23
A decline in
the share of
Agriculture...
A rise in the
share of
Services...
Decline in the
share of
Industry ...
Agri
c
Indu
stry
Servi
ces
New Series 21.00% 26.04% 52.97%
Old Series 34.69% 36.26% 29.04%
0.00%
10.00%
20.00%
30.00%
40.00%
50.00%
60.00%
Nominal GDP by
Sector, 2013
0%
10%
20%
30%
40%
50%
60%
70%
80%
90%
100%
2010 2011 2012
Nigeria GDP Old Series
0%
10%
20%
30%
40%
50%
60%
70%
80%
90%
100%
2010 2011 2012
Nigeria GDP New Series
Services
Manufacturing
Industry
Agriculture
Economic Structure by Output Approach

24
Nigeria’s service sector (grey section) compares well to that of BRICS
countries, although agriculture (green section) remains larger than all
0%
10%
20%
30%
40%
50%
60%
70%
80%
90%
100%
Brazil Russia India China South
Africa
Nigeria
GDP by Sector: BRICS Comparison (2012)
Services
Manufacturing
Industry
Agriculture
Comparison with BRICS...
Sourc WDI
Economic Structure by Output Approach
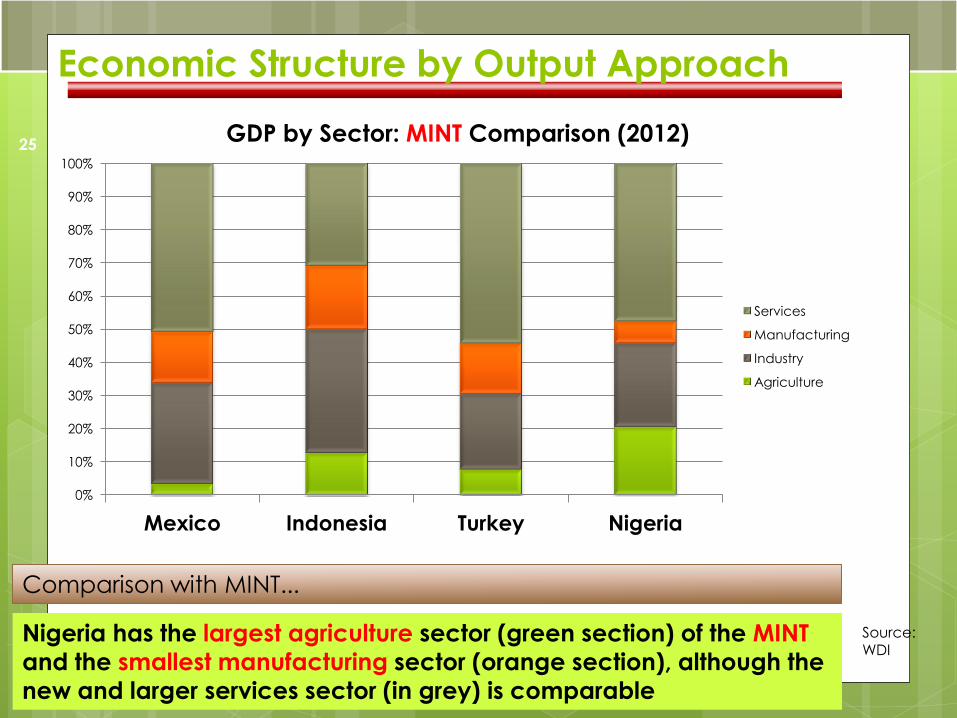
25
Comparison with MINT...
Nigeria has the largest agriculture sector (green section) of the MINT
and the smallest manufacturing sector (orange section), although the
new and larger services sector (in grey) is comparable
0%
10%
20%
30%
40%
50%
60%
70%
80%
90%
100%
Mexico Indonesia Turkey Nigeria
GDP by Sector: MINT Comparison (2012)
Services
Manufacturing
Industry
Agriculture
Source: WDI
Economic Structure by Output Approach

-6 -4 -2 0 2 4 6 8
Crude Petroleum and Natural Gas
Fishing
Rail Transport & Pipelines
Metal Ores
Water Transport
Coal Mining
ARTS, ENTERTAINMENT AND RECREATION
CONSTRUCTION
PUBLIC ADMINISTRATION
Crop Production
PROFESSIONAL, SCIENTIFIC AND TECHNICAL …
REAL ESTATE
MANUFACTURING
TRADE
Telecommunications and Information Services
Naira, Trillions
Change in GDP between old and new series for selected
Activities, 2010 Current Prices 26
Two activities
recorded
downward
revisions
Telecommunications
sector recorded the
largest positive
revisions
Economic Structure by Output Approach

27
...compared to only 3
activities in the old series
The number of economic activities that
constitute 70% of nominal GDP is now 6...
13.25
10.51
7.11
5.83
5.42
4.90
2.94
2.27
2.27
1.83
1.59
1.55
1.28
1.10
1.03
0.74
0.62
0.61
0.54
0.43
0.38
Crop …
Trade
Crude …
Manufacturi…
Telecommu…
Real Estate
Food, …
Construction
Professional, …
Public …
Financial …
Other Services
Education
Textile, …
Livestock
Broadcasting
Road …
Accommod…
Human …
Cement
New real GDP: 2013
Rebased Series, (N,
Trillion)
20.96%
16.62%
11.24%
9.22%
8.57%
7.76%
4.65%
3.59%
3.58%
2.89%
2.52%
2.45%
2.02%
1.73%
1.63%
1.17%
0.97%
0.97%
0.86%
0.68%
0.60%
Crop Production
Trade
Crude Petroleum …
Manufacturing
Telecommunicat…
Real Estate
Food, Beverage …
Construction
Professional, …
Public …
Financial …
Other Services
Education
Textile, Apparel …
Livestock
Broadcasting
Road Transport
Accommodation …
Human Health …
Cement
% of real GDP, 2013
Rebased 34.13%
20.33%
12.82%
8.10%
4.00%
3.12%
2.69%
2.52%
2.41%
2.35%
1.92%
1.30%
0.86%
0.61%
0.58%
0.50%
0.40%
0.22%
0.16%
0.16%
0.14%
Crop Production
Wholesale and Retail …
Crude Petroleum & …
Telecommunications
Other Manufacturing
Financial Institutions
Electricity
Livestock
Road Transport
Building & Construction
Real Estate
Fishing
Other Services
Public Administration
Hotel and Restaurants
Forestry
Quarrying & Other …
Education
Water
Insurance
Transport Services
% GDP 2013F, at 1990 prices
Economic Structure by Output Approach

GDP Activity
Average
Growth (2012-2014)
Average
Contributi
on to GDP
(2012-2014)
1 Chemical and Pharmaceutical Products 48.85% 0.15%
2 Textile, Apparel and Footwear 36.08% 1.75%
3 Accommodation and Food Services 36.01% 0.78%
4 Plastic and Rubber products 33.40% 0.22%
5 Other Manufacturing 31.49% 0.45%
6 Motor vehicles & assembly 28.55% 0.07%
7 Cement 27.48% 0.59%
8 Non-Metallic Products 26.55% 0.24%
9 Other Services 26.11% 2.50%
10
Water Supply, Sewerage,
Waste Management and Remediation 24.17% 0.10%
• All Activities but Three
(Accommodation and
Food Services, Other
Services and Water
Supply, Sewerage,
Waste Management
and Remediation) are
under the
Manufacturing Sector
• Many fast growing
sectors have small
contributions to GDP
• More potential for
investment and taxation
Economic Structure by Output Approach: Fastest growing

E
E
E
E
Structure of the
Economy:
Expenditure Approach
SECTION E

The Expenditure Approach Specifically, GDP is equal to the sum of the four
categories of expenditures.
GDP = C + I + G + (X - M)
C = Private consumption expenditure
I = Investment Expenditure
G= Government Consumption Expenditure
X = Value of Exports
M = Value of Imports
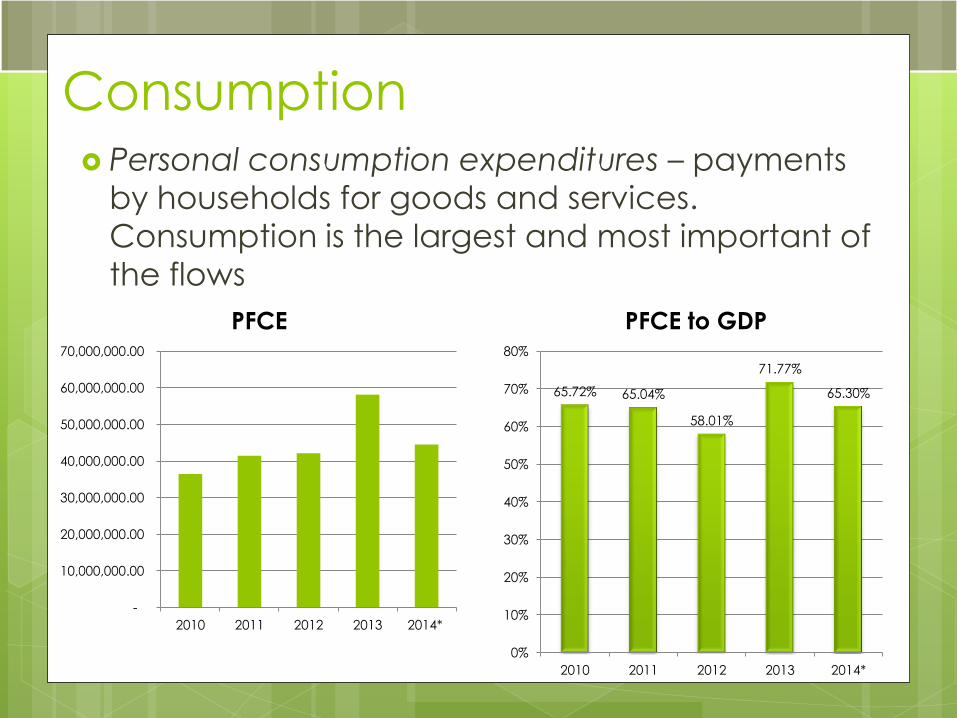
Consumption Personal consumption expenditures – payments
by households for goods and services.
Consumption is the largest and most important of
the flows
-
10,000,000.00
20,000,000.00
30,000,000.00
40,000,000.00
50,000,000.00
60,000,000.00
70,000,000.00
2010 2011 2012 2013 2014*
PFCE
65.72% 65.04%
58.01%
71.77%
65.30%
0%
10%
20%
30%
40%
50%
60%
70%
80%
2010 2011 2012 2013 2014*
PFCE to GDP

Investment This is business spending on equipment, structures, and
inventories.
16.99%
15.98%
14.63% 14.47%
15.38%
11.63%
10.28%
0%
2%
4%
6%
8%
10%
12%
14%
16%
18%
2010 2011 2012 2013 2014*
INVESTMENT TO GDP (%)
GFCF New Series
GFCF Old Series
-
2,000,000.00
4,000,000.00
6,000,000.00
8,000,000.00
10,000,000.00
12,000,000.00
14,000,000.00
2010 2011 2012 2013 2014*
GROSS FIXED CAPITAL
FORMATION

Financial and Monetary Ratios 5/9/2015 33
29.2 25.9
36.5
45.0
18.2 15.4
20.6 23.8
2010 2011 2012 2013
Market Capitalisation to GDP (%) NGR before
and after
Old Series New Series
0
50
100
150
200 Market Capitalisation as a percentage
of GDP various countries
Nigeria
South
Africa Brazil
Mexico
No of Firms
in NBS
Frame
No of
NSE-
Listed
firms
(equities)
Share of
nominal
GDP
(2013)
AGRICULTURE 1,116 6 21.97% MINING AND QUARRYING 971 21 14.50%
MANUFACTURING 76,656 67 6.83%
CONSTRUCTION 53,507 16 3.12%
TRADE 502,085 1 17.02% TRANSPORTATION AND STORAGE 5,902 4 1.24%
INFORMATION AND COMMUNICATION 1,719 22 10.94%
ARTS, ENTERTAINMENT AND RECREATION 805 0 0.08%
PROFESSIONAL, SCIENTIFIC AND TECHNICAL SERVICES 125,482 0 3.19%
ADMINISTRATIVE & SUPPORT SERVICES 2,048 0 0.02%
EDUCATION 34,974 0 1.65%
HUMAN HEALTH AND SOCIAL SERVICES 13,083 14 1.02%

Financial and Monetary Ratios
5/9/2015 34
32.47 32.54
34.27
35.76
0.00
20.21 19.33 19.38 18.93 18.63
2010 2011 2012 2013 2014
Financial Deepening (M2/GDP)
Old Series
New Series
29.89 28.50
36.13 37.22
23.96
16.93
20.43 19.70 19.28
2010 2011 2012 2013 2014
Credit to Private Sector as
% of GDP

Government Expenditures Government expenditures – government payments
for goods and services
-
2,000,000.00
4,000,000.00
6,000,000.00
8,000,000.00
2010 2011 2012 2013 2014*
FINAL CONSUMPTION EXPENDITURE OF GENERAL
GOVERNMENT
0.00
1.00
2.00
3.00
2010 2011 2012 2013 2014
FGN Budgeted Capital
Expenditure to GDP
FGN Budgeted
Capital Expenditure
to GDP
7.50
8.00
8.50
9.00
2010 2011 2012 2013 2014*
Government Expenditure (%) OF
GDP
SHARE OF GDP

Net Exports NX= Domestic Exports of goods + Re-exports of
goods + Exports of Services - Imports of Goods -
Imports of Services
-
5,000,000.00
10,000,000.00
15,000,000.00
20,000,000.00
25,000,000.00
2010 2011 2012 2013 2014*
NET EXPORTS
EXPORTS OF GOODS AND SERVICES
IMPORTS OF GOODS AND SERVICES
NET EXPORTS

External Sector Ratios
5/9/2015 37
38.28
51.97
55.36
33.60
23.82
30.87 31.30
17.79 19.30
2010 2011 2012 2013 2014*
Annual Exports to GDP
*Estimated Q4, 2014 Oil exports
5.80%
4.39%
6.75% 7.07%
-
3.61%
2.61%
3.82% 3.74%
0.23%
2010 2011 2012 2013 2014*
Current Account Surplus to
GDP (%)
Old Series
New Series
*Preliminary Estimate
Source: CBN

F
F
F
F
Opportunities for further
Growth
SECTION F

Growth and Job Opportunities - Fastest Growing Sectors
• Accommodation &
Food Services
• 74% Growth rate
(2013)
• Population is a huge
advantage
• Tourism potentials
• High propensity to
consume

Cement 39% growth rate (2013)
Nigeria is now a net exporter of
cement
huge housing deficit presents an
opportunity for growth
growing interest in investment in
public works towards NV20:2020
• Textile, apparel & footwear 34% growth rate (2013)
slowly re-emerging textile mills in
the Kano and Kaduna
rising number of prominent
Nigerian designers
World Fashion University to be
named after President Jonathan!
Growth and Job Opportunities - Fastest Growing Sectors

• Motion picture
24% growth rate
Sector evolved largely without any
intervention/support
Nollywood is 2nd largest film industry
in the world
ahead of US, behind India
Average cost per movie in Nigeria is
considerably lower
<$0.1million compared to Hollywood
($20million )
Significant opportunity for value
added
Challenges of piracy, informality
and non-registration with regulators
• Arts, entertainment and recreation
15% growth rate (2013)
Includes creative art, entertainment,
libraries, museum, sports and
amusement activities
Like Nollywood, high value-added
Challenge of piracy and non-formality
CIA WFB
Growth and Job Opportunities - Fastest Growing Sectors

Real estate - Contribution: 8%
- Growth: 12% - Estimated housing deficit of 17m,
mainly affordable housing
- Potential constraints: Financial (access to mortgages), cheap building supplies, skilled labour.
Food, beverage, tobacco - Contribution : 5%
- Growth: 12% - Great domestic demand
- Growing consumer market. Some of the biggest companies are investing more money into Nigeria - Nestle, Diageo (Guinness) and Dufil
Prima (Indomie)
36,000
26,000
50,000
South Africa India Nigeria
Average Cost of Building a House
(US$)
Source: World Bank
Growth and Job Opportunities - Fastest Growing Sectors

Telecomms and
information services - Contribution: 8%
- Market greater than at first glance Internet: 62million
devices connected, yet
many consumers own
multiple devices (phone,
laptop, ipad etc).
- Mobile Phones: Only 67
phones per 100 people,
again multiple devices
- Youthful population; largest
consumers of internet
83
114
67
127
125
70
131
Mexico
Indonesia
Nigeria
Thailand
Brazil
India
South Africa
Cell Phone subscriptions per 100
people
Source: WDI
Growth and Job Opportunities - Fastest Growing Sectors

G
G
G
G
Structure of Government
Revenue
SECTION G

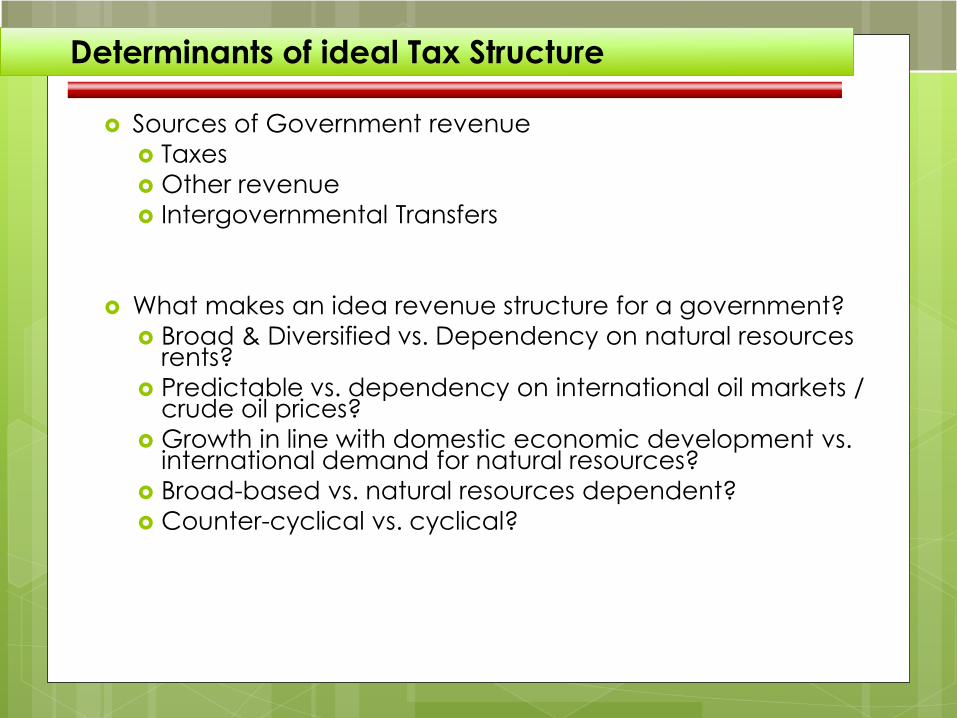
Sources of Government revenue
Taxes
Other revenue
Intergovernmental Transfers
What makes an idea revenue structure for a government?
Broad & Diversified vs. Dependency on natural resources rents?
Predictable vs. dependency on international oil markets / crude oil prices?
Growth in line with domestic economic development vs. international demand for natural resources?
Broad-based vs. natural resources dependent?
Counter-cyclical vs. cyclical?
Determinants of ideal Tax Structure

Government Revenue made up of
GOVERNMENT
REVENUE
OIL:
Crude oil/gas
exports, PPT
etc
Custom
duties/le
vies etc
NON OIL;
Corporate
tax, VAT
Nigeria revenue structure

Nigeria Revenue structure
0
10
20
30
40
50
60
70
80
90
1970 1972 1974 1976 1978 1980 1982 1984 1986 1988 1990 1998 2000 2002 2004 2006 2008 2010 2012
Contribution of oil and Non Oil revenue 1970-2013
Non Oil revenue % of total Oil revene % of total

Oil Revenue (Gross)
Crude Oil / Gas Exports
PPT and Royalties etc.
Domestic Crude Oil Sales
Other Oil Revenue
Less:
Deductions/
OIL Revenue

Oil Revenue & Distribution
5/9/2015 49
0.00 10.00 20.00 30.00 40.00 50.00 60.00
Distribution of Oil Revenues
2011
2012
2013
2014
-
1,000
2,000
3,000
4,000
5,000
6,000
Billio
ns
FGN OIL REVENUES
2011
2012
2013
2014

Crude Oil, Gas and PPT: a closer
look
5/9/2015 50
-
1,000,000,000,000.00
2,000,000,000,000.00
3,000,000,000,000.00
4,000,000,000,000.00
5,000,000,000,000.00
6,000,000,000,000.00
2011 2012 2013 2014
Crude Oil and Gas Revenue and PPT
Crude Oil And Gas Revenue Petroleum Profit Tax (PPT) Gas Revenue

Resource Curse
The Voracity Effect/ Institutional
Impact
Volatility in Commodity Prices
Dutch Disease
Hausman and Rigobon (2002) summarise what we know now: “The
concern that natural resource wealth may somehow be immiserating is
a recurring theme in both policy discussions and in empirical analysis.
The empirical regularity seems to be in the data but understanding its
causes has been a much harder task.”
Challenges of dependency on oil revenue
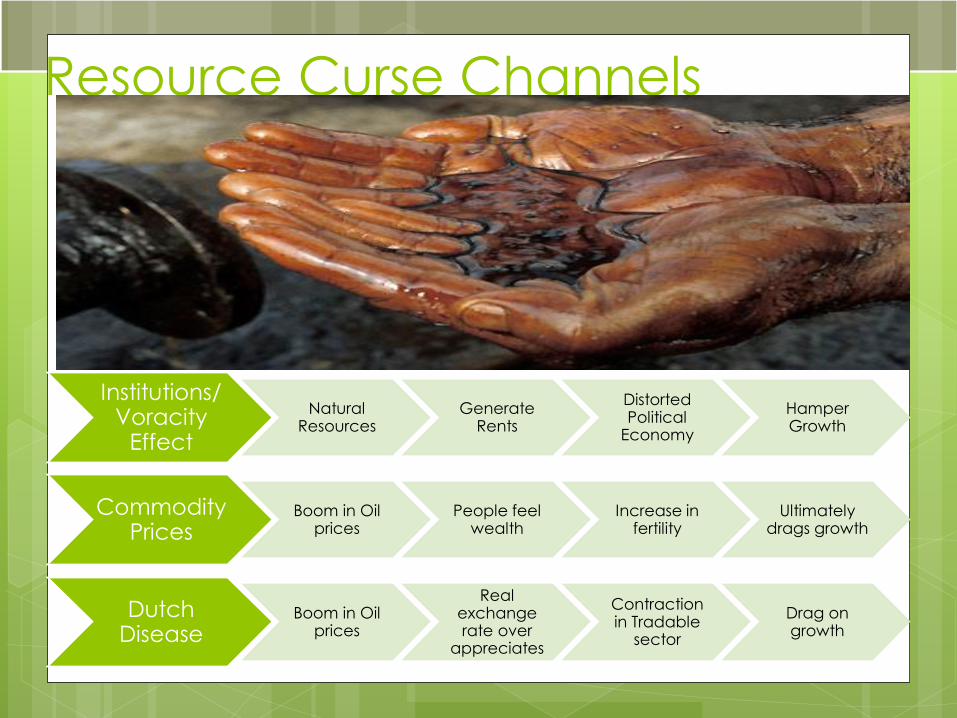
Resource Curse Channels
Institutions/ Voracity
Effect
Natural Resources
Generate Rents
Distorted Political
Economy
Hamper Growth
Commodity Prices
Boom in Oil prices
People feel wealth
Increase in fertility
Ultimately drags growth
Dutch Disease
Boom in Oil prices
Real exchange rate over
appreciates
Contraction in Tradable
sector
Drag on growth

Beyond Oil- What is the Hitch?
Its all about Incentives: Yes, Democracy Now, but :
balance of power between citizens and public officials, including those at state and local government levels, is inordinately skewed in favor of the latter by virtue of their easy access to oil revenues. This perpetuates politics, even democratic politics, as patronage
Thus there are no right incentives for governance, incentives that are now sorely missing, and would contribute to reduce corruption and the rest of the problems that affect the Nigerian institutions today.
For 2014, Oil Revenues accounted for Roughly 67.12% of all FGN revenues
As such, the government has little incentive to provide services efficiently because the discipline exerted by the need to tax the public is largely absent: oil revenues are manna from heaven and keep flowing regardless of what the public sector delivers.
The Nigerian experience provides telling confirmation of this aspect of natural resources. Waste and
corruption from oil rather than Dutch disease has been responsible for its poor long run economic
performance.

Beyond Oil- There is hope!
Natural resources appear to have negative
effect on growth by impairing institutional
quality.
But it could be Managed:
Once institutions are properly controlled, the
effect can even be positive!.
In particular, it is fuel and minerals—that typically
generate rents.
This effect is quantitatively significant, amounting
to lower growth of about 0.36 percent per year.
Other resources do not seem to adversely affect
institutional quality.

FGN Non-Oil Revenues & Distribution
5/9/2015 55
- 200 400 600 800
1,000 1,200 1,400 1,600 1,800
Billio
ns
FGN NON-OIL REVENUE
2011
2012
2013
2014
0.00
5.00
10.00
15.00
20.00
25.00
30.00
35.00
40.00
45.00
Company
Income
Tax
Import
Duty
Excise Duty Value
Added Tax
(VAT)
Fees Custom
Levies
2008-2012
CET
Education
Tax
PAYE NITDF
DISTRIBUTION OF FGN NON-OIL REVENUES
2011
2012
2013
2014

Tariffs on Imported Goods: Impact
of government revenue
• Customs Revenue has been
increasing, peaking at N342,808.52
million in 2012
• Growth in revenue greatest in 2011
at 36.13%
• Share of imports highest in 2012,
increasing by 2.94% points to 6.09%
of total imports for that year
Source: NCS
228,567.60
311,149.38
342,808.52
-
50,000
100,000
150,000
200,000
250,000
300,000
350,000
400,000
2010 2011 2012
Na
ira
, M
illio
ns
Total Customs Revenue
N ‘000,000 2010 2011 2012
% Growth in Revenue 36.13% 10.17%
Total Import 6,648,525.9 9,892,644.1 5,624,870.4
% Imports 3.44% 3.15% 6.09%

Sources of Customs Revenue
2011 7% Port Levy
20%
Sugar Levy 5% VAT 1% CISS 0.5% ETLS
20%
Rice Levy
10%
Steel Levy
20%
Wine Levy NESS
20%
Ceme
nt Levy
100%
Cigarette
2% NAC
9.26% 0.33% 53.56% 13.96% 7.96% 11.07% 0.14% 0.00% 0.19% 2.36% 1.16% 0.00%
2012
7%
Port Levy
20%
Sugar Levy
Wheat
Flour Levy
Wheat
Grain Levy 5% VAT
1% CISS
0.5% ETLS
Brown Rice
40%
Rice Levy
10%
Steel Levy
20%
Wine Levy
30%
Textil
e Levy NESS
20%
Cement Levy
100%
Cigarette
8.89% 0.39% 0.00% 0.93% 48.33% 12.43% 7.28% 1.09% 18.90%
0.32%
0.01% 0.04% 0.16% 0.59% 0.65%
2010:
- VAT is the largest source of revenue at 55.98%
- 15.02% for Comprehensive Import Scheme (CISS)
followed
- Third greatest was the Port Levy at 9.62%
2011:
- Textile levy removed
- VAT is the largest source of Revenue at 55.56%
- CISS follows at 12.96%
- 20% Rice Levy third at 11.07%
Source: NCS
2010 7% Port Levy
Sugar Levy 5% VAT 1% CISS
0.5% ETLS
20%
Rice Levy
10%
Steel Levy
Wine Levy NESS
Ceme
nt Levy
100%
Cigarette
2% NAC
30%
Textile Levy
9.62% 0.38% 55.98% 15.02% 8.68% 7.62% 0.49% 0.00% 0.20% 0.55% 1.47% 0.00% 0.00%
2012:
- Three new levies were added (circled)
- Rice levy was increased to 40%, which
increased revenue by N30,334.61 million and
% contribution by 7.83% points
- 2% NAC levy was dropped
- Largest contributor remained 5% VAT, now
followed by Rice

Major Non-Oil Revenues: a closer
look
5/9/2015 58
-
200,000,000,000.00
400,000,000,000.00
600,000,000,000.00
800,000,000,000.00
1,000,000,000,000.00
1,200,000,000,000.00
1,400,000,000,000.00
1,600,000,000,000.00
1,800,000,000,000.00
2011 2012 2013 2014
Evolution of CIT and VAT
Company Income Tax Value Added Tax (VAT)

Tax Revenue Agriculture collects the
lowest VAT relative to its economic contribution, contributing 0.11% to total VAT, yet 18.45% to GDP
Professional Services contributes the highest VAT relative to GDP, with 13.69% of total VAT, and 3.69 of total GDP
Hotel and Catering, Mining, publishing, automobile assembly and pharmaceutical production are taxed almost equally to their contributions to GDP
Higher VAT
collected relative
to GDP
Lower VAT
collected relative
to GDP
-15% -10% -5% 0% 5% 10% 15% 20%
Professionl Services
Transport and Haulage …
Banks and Financial Institutions
Breweries. Bottling and …
Pharmaceutical, soaps and …
Automobiles and Assemblies
Publishing,Printing,Paper …
Hotel and Catering
Mining
Building and construction
Textile and Garment industry
Properties and investments
Commercial and Trading
Agricultural and Plantations
Percentage point difference in % contribution
to GDP and % contribution to VAT, 2013

Fiscal Ratios
5/9/2015 60
22.31 22.69 22.02
13.88 13.47
12.45
2010 2011 2012
Government Revenue to GDP
(%)
Old Series New Series
8.35
12.37 12.35 11.33
5.20
7.35 6.98 6.00
2010 2011 2012 2013
Federal Tax Revenue to
GDP
Old Series New Series

Analysis of PFCE and VAT Receipts
0.00
5.00
10.00
15.00
20.00
5% of PFCE= N1.8 Trillion
VAT RECEIPTS BY FIRS CLASIFICATION 2010= N465 BILLION
2010
0.00 2.00 4.00 6.00 8.00
10.00 12.00 14.00 16.00 18.00 20.00
5% of PFCE = 2.9Trillion VAT RECEIPTS BY FIRS
CLASSIFICATION 2013 (N481.6B) - H1 2014 (N248.5B)
2013
h1 2014

Jobs and Income Tax
Job creation survey started in 2012
Jobs are divided into three categories:
Informal: Fewer than 10 employees
Formal: 10 or more employees and registered
professional services
Public Sector
Policy relevance:
• Employment is important for growth and social
wellbeing
• Taxation of income can only be achieved in the
formal sector

Jobs Created
- 369,585 jobs in Q4 2014, with 138,026 (37.36%) formal
- In all quarters informal jobs were greatest, reaching 67.78% of all new jobs in Q3, 2013
- Formal jobs followed, whilst jobs created in public sector were fewer
- Jobs created has been growing in 2014, yet has not reached 2012 levels
Policy Implication: need to both encourage growth of the formal sector, ( higher skilled and paying jobs)as well as formalize the existing informal sector in order that incomes can be taxed and regulated
0
50
100
150
200
250
300
350
400
450
500
Q3 Q4 Q1 Q2 Q3 Q4 Q1 Q2 Q3 Q4
2012 2013 2014
Jo
bs
cre
ate
d,
Tho
usa
nd
s
PUBLIC INSTITUTIONS
INFORMAL (Less than 10 employees)
FORMAL (10 persons above & Professional Services
employing less than 10)

Employee Compensation Vs Firm
Profitability
N’000,000 2010 2011 2012 2013 2014 Q1
COMPENSATION OF EMPLOYEES 14,626,616.12 16,068,305.93 16,630,297.15 17,124,049.41 4,266,455.09
OPERATING SURPLUS 37,238,661.09 38,237,852.10 39,484,104.24 42,344,736.11 10,213,241.91
GROSS DOMESTIC PRODUCT AT MARKET PRICES 55,469,350.31 58,180,351.90 60,670,050.46 63,942,845.56 15,601,048.05
Employee compensation depends on many factors. For instance:
- Composition of the firm (capital/labour/skills intensive)
- The size of the firm (economies of scale)
- Length of time in operation (learning effects)
- Among others
Tells policy makers about the condition of the labour market and the ability of
workers to bargain for higher compensation
Growth in COE: 5.44%
Growth in OS: 4.40%
Sources of Government revenue
Taxes
Other revenue
Intergovernmental Transfers
What makes an idea revenue structure for a government?
Broad & Diversified vs. Dependency on natural resources rents?
Predictable vs. dependency on international oil markets / crude oil prices?
Growth in line with domestic economic development vs. international demand for natural resources?
Broad-based vs. natural resources dependent?
Counter-cyclical vs. cyclical?
Determinants of ideal Tax Structure

Large Firm Case Studies
Compensation of Employees The Employee compensation component of value added:
- Varies from as low as 6.02% in Dangote Cement in 2013
- As high as 32.16% in Nestle in 2012
- Increasing in all firms, perhaps indicating increased bargaining power of employees
Corporate Profitability: Operating profit to value added:
- Ratios are generally high, reaching 77.29% in Dangote Cement Group in 2013
- Lowest proportion in Guinness in 2013 at 51.52%
- It is declining through time in all companies, perhaps indicating a squeezed profit margin
Guinness Nestle Dangote Cement Group
(N '000) 2012 2013 2012 2013 2013 2014
% Employee component of value added to value added 21.48% 23.04% 30.16% 32.16% 6.02% 7.38%
% operating Profit to Value added 56.40% 51.52% 59.17% 57.45% 77.29% 68.25%

H
H
H
H
CONCLUSION
SECTION H

Conclusion Nigeria is going through hard times Like the economists say…Never let a crisis go
to waste What we have been clamoring for since
1970s and 80s, we now have the opportunity to do…further diversify our economy
Government needs funding to do this, and this CAN be done, by expanding our tax base via incorporation of the informal sector and increasing the VAT (its is very low)
So use GDP which shows structure of the economy to compare with current tax receipts and bridge the gap by formalizing the sector
Companies currently paying taxes to pay more not by increasing tax rates but encouraging
them to expand output to meet local demand as well as export.
Intra African trade
Those outside tax system informal or formal
evading taxes or underreporting output
incentives to pay and disincentive not to pay(severe penalties).
FGN Share of VAT
FGN Independent Revenue
FGN Share of Fed. Acct. (Net)
-
50.000
100.000
150.000
200.000
250.000
300.000
350.000
JanuaryFebruary
MarchApril
MayJune
July
August
SeptemberOctober
November
December
FGN Share of VAT FGN Independent Revenue FGN Share of Fed. Acct. (Net)
Dependency on FAAC allocations vs. indirect taxes / IGR

Plot 762, Independence Avenue,
Central Business District, Abuja.
Email: [email protected]
Website :www.nigerianstat.gov.ng
5/9/2015 69
“@nigerianstat”
www.facebook.com/nigerianstatistics
THANK YOU FOR YOUR ATTENTION!
“@sgyemikale”