revised economic impacts of the pennsylvania marcellus … · pipe fitters ... provides an estimate...
TRANSCRIPT

ECONOMIC IMPACTS OF THE PENNSYLVANIA MARCELLUS Timothy J. Considine School of Energy Resources Dept. of Economics & Finance The University of Wyoming

OUTLINE OF TALK
What is the nature of shale energy production?
What is the shale energy supply chain?
What are the economic impacts?
What are environmental impacts & costs?
What are costs & benefits of shale energy?
What are the observable economic impacts of shale energy development?
Implications & strategies for economic development
2

1. NATURE OF SHALE ENERGY PRODUCTION
3

PA MARCELLUS DRILLING & PRODUCTION
4
Intensive drilling Increased from 97 wells in late
2009 to 405 in late 2010
Production increased 152 mmcf per day in late 2009
0ver 2 bcf per day in late 2010
In three years PA becomes an exporter of natural gas
Industry is getting very proficient at drilling
Production is increasing faster than anticipated
97
155 176
224 262
339
399 405
0
50
100
150
200
250
300
350
400
450
0
500
1,000
1,500
2,000
2,500
Num
ber
of W
ells
Dri
lled
to to
tal d
epth
Gas
equ
ival
ents
in m
illio
n c
ubic
feet
per
day
Wells Drilled to total Depth
Gas Equivalents

THE PRODUCTION DECLINE CURVE
5
Why is drilling so intensive? The steep production decline curve First example to right
Year 1: 511.9 mmcf
Year 2: 257 mmcf Year 10: 88 mmcf Year 30: 32 mmcf
To keep increasing output, need to keep drilling – treadmill effect
Multi-stage fracturing is increasing well productivity
More gas with fewer wells
0
100
200
300
400
500
600
700
800
1 3 5 7 9 11 13 15 17 19 21 23 25 27 29
mill
ion
cubi
c fe
et
Years after Initial Production
Marcellus Production Decline Curves
Horizontal pre 2008 EUR = 2.8 bcf
Stimulated Horizontal 2010 EUR = 4 bcf

2. THE SHALE ENERGY SUPPLY CHAIN
6

LEASING ACTIVITY
Goal is to obtain access to prospective properties for exploration
Must define land and mineral rights & ownership
People & businesses involved in leasing Land men
Clerks & legal assistants
Real estate brokers
Lawyers
7

EXPLORATION ACTIVITIES
Objective is to locate and define oil and gas deposits
Exploration activities Very advanced technology
Seismic survey crews
Affected businesses Local hotels
Restaurants
Coffee shops
Convenience stores
8
!

SITE PREPARATION Clearing land and building roads Providing access to water and utilities 5,000 tons of aggregate per well
Businesses involved Excavation equipment manufacturers
Contractors and dealers
Painters and haulers
Mulch and fertilizer suppliers
Safety equipment manufacturers and suppliers
Electrical equipment supplies & contractors
Surveying equipment suppliers and contractors
Surveying engineering companies
Aerial mapping services
9

WELL CONSTRUCTION Starts with a well “spudded”
when the bit hits the ground Drilling to total depth may take
anywhere from 2-4 weeks Businesses involved:
Crane manufacturers and leasing companies
Drill bit manufacturers Steel manufacturers Cement and concrete companies Chemical manufacturers Safety equipment companies
Many companies contract out drilling operations
125 tons of concrete per well
10
!

WELL STIMULATION
Hydraulic fracturing
Businesses involved: Hydraulic fracturing contractors
Trucking companies
Diesel fuel companies
Water management companies
Water and material intensive 25 rail cars of sand
Millions of gallons of water
11
!

MIDSTREAM DEVELOPMENT
Construction of compressor stations
Lower pressure gathering lines
High pressure steel pipelines
Businesses involved: Pipeline construction companies
Heavy equipment contractors
Steel pipe producers
Value and compressor manufacturers
12

NATURAL GAS PROCESSING
Strip out valuable liquids
Some products Propane, butane, ethane, etc.
Valuable feed stocks for petrochemical production
Businesses Pipe fitters
Steel pipe manufacturers
Equipment producers
Contractors
13
!

EXPANSION OF DOWNSTREAM INDUSTRIES Abundant, low cost shale energy attracts
additional industry Possible sectors:
Petro-chemical manufacturing Fertilizer production Metal and glass industries Electric power generation CNG use in transportation
These industries have their own supply chains and would generate additional economic impacts
It’s underway: Bloomberg, “Cheap Shale Gas Means Record U.S. Chemical Industry Growth,” August 10, 2011
14
3. ECONOMIC IMPACTS
15

WHAT IS ECONOMIC IMPACT ANALYSIS?
Quantitative model of the inter-industry transactions between economic sectors
Developed by Wassily Leontief who won Nobel Award for this in 1973
Provides an estimate for how spending in one sector affects Other sectors of the economy and
Household disposable income
Widely used for many types of projects, from sports stadiums, wind turbines to coal mines
16

IMPACT ANALYSIS SCHEMATIC
17
Increase in spending
Stimulate supply chain sales
Increase in income and employment
Induced increase in consumer spending
Feedback
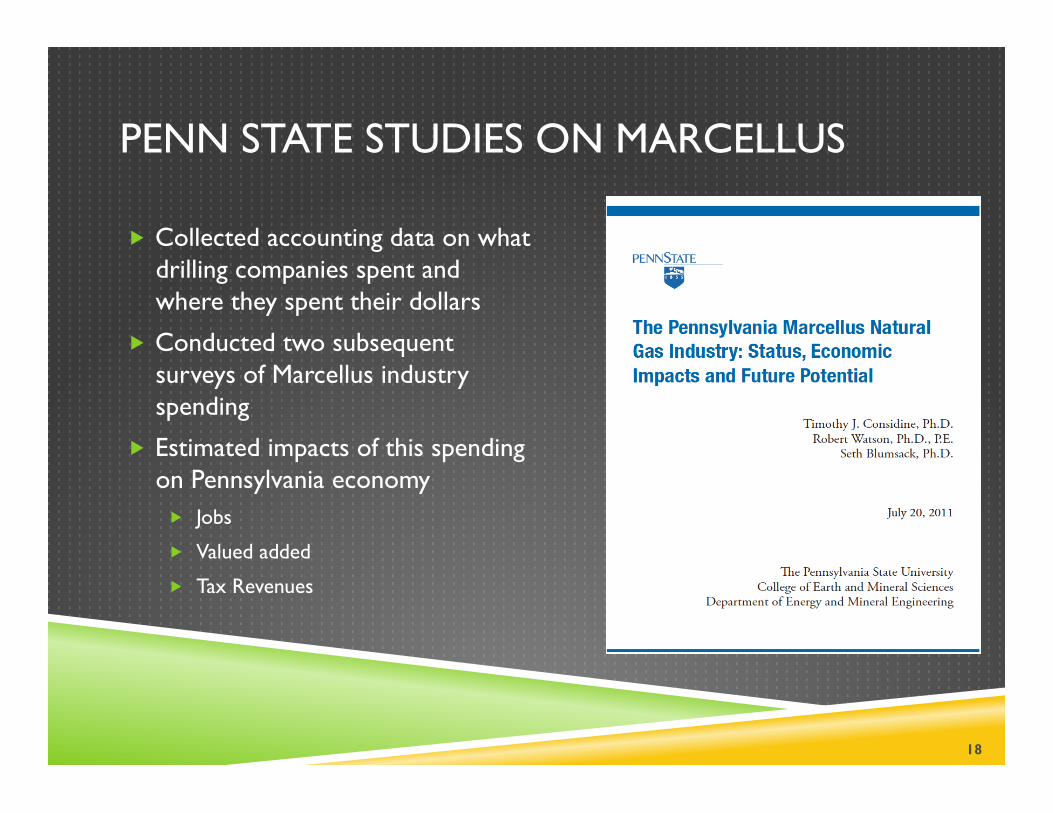
PENN STATE STUDIES ON MARCELLUS
Collected accounting data on what drilling companies spent and where they spent their dollars
Conducted two subsequent surveys of Marcellus industry spending
Estimated impacts of this spending on Pennsylvania economy Jobs
Valued added
Tax Revenues
18

PENNSYLVANIA MARCELLUS SPENDING IN MILLIONS OF CURRENT DOLLARS
19
2008 2009 2010
Total Spending 3,224.6 5,283.9 11,477.1
Lease & Bonus 1,837.7 2,172.4 2,068.5
Exploration 121.9 117.1 208.4
Upstream: Drilling & Completion 857.8 2,151.0 7,377.0
Midstream: Pipeline & Processing 329.4 698.6 1,303.9
Royalties 22.2 53.4 346.0
Other 55.5 91.4 173.3

COMPOSITION OF FIRST ROUND OF SUPPLY CHAIN SPENDING
20
Construction 30%
Oil & Gas Support 26%
Wholesale Trade 16%
Oil & Gas Drilling 12%
Services 7%
Retail Trade 3%
Transportation 2%
Stone & Quarrying 2%
Manufacturing, Utilites,
Agriculture 2%

JOBS & VALUE ADDED (MILLIONS) 2010
21
Sector
Jobs
Value Added
Sector
Jobs
Value Added
Ag, etc 780 22.2 Real estate & rental 5,360 1,192.30
Mining 14,886 1,411.00 ScientiOic & tech services 11,042 1,058.10
Utilities 478 194 Management of companies 1,318 195.2
Construction 23,730 1,431.80 Administrative & waste services 6,387 268.2
Manufacturing 2,936 370.7 Educational services 3,405 152.1
Wholesale Trade 9,974 1,338.80 Health & social services 12,815 736.1
Retail trade 16,581 839.3 Entertainment & recreation 2,641 91.6
Transportation 4,864 354 Hotel & food services 7,767 229.9
Information 1,729 274.6 Other services 6,634 254.5 Finance & Insurance 4,986 664.7 Government & Misc. 1,577 81.9
Total 139,889 11,160.80

4. ENVIRONMENTAL IMPACTS
22

ENVIRONMENTAL IMPACTS Unavoidable impacts
Clearing of land for well pads and pipelines Local congestion, noise, dust in rural
communities Emissions during drilling
Environmental hazards Stray gas – failures in casing & contamination of
water Containment pond breaches Spills from petroleum liquids handling Well blow-outs & resulting spills
Environmental risk – perceptions There have been problems What is there proper context? Can these problems result in widespread
contamination?
23

ENVIRONMENTAL VIOLATIONS
24
42.0
16.4
15.2
9.2
3.4
0.4
2.6
0.7 7.1
Environmental Violations per Hundred Wells Drilled in Pennsylvania Marcellus, 2008-2010
Administrative Erosion Other Spills Water Cement and Casing Blowouts and Venting
All Violations
Serious Violations

5. BENEFIT COST ANALYSIS
25

ECONOMIC BENEFITS & ENVIRONMENTAL COSTS
Benefits Gains in real output, jobs, and tax revenues
Environmental – avoided emissions from coal
Costs Air emissions from shale energy production
Water pollution
Forest disruption
Noise, traffic externalities, etc.
What level of benefits are necessary to accept environmental risks?
26

BENEFITS & COSTS IN DOLLARS PER WELL
27
Economic & Environmental Benefits Environmental costs:
Economic value added 3,957,746 Air impacts from upstream life-cycle emissions 2,796
Avoided air pollution 17,132 Air impacts from diesel use during hydraulic fracturing 7,245
Avoided community health impacts from coal 29,111 Water pollution using household
values 193
Subtotal 46,243 Forest disruption 3,943
Total Benefits 4,003,989 Total Costs 14,178

6. SHALE ENERGY, JOBS, AND TAX REVENUES
28

UNEMPLOYMENT RATE DIFFERENCES FROM STATE AVERAGE, 2007-2011
29
-2.5
-2
-1.5
-1
-0.5
0
0.5
1
1.5
2
2007 2008 2009 2010 2011
Perc
enta
ge p
oint
Greene 215 Wells Susquehana 227 Wells Lycoming 261 Wells Washington 363 Wells Tioga 481 Wells Bradford 691 Wells

CUMULATIVE DRILLING & UNEMPLOYMENT BY COUNTY 2011
30

DRILLING & SALES TAX REVENUES
31

7. ECONOMIC DEVELOPMENT STRATEGIES
32

STRATEGIES FOR DEVELOPMENT
Based upon cost-benefit analysis, environmental risks are acceptable Tough but flexible regulation is required
Determine the facts and encourage technological innovation
Infrastructure development is important Shale energy companies may be well positioned to contribute
Innovation again is key
Work force development will be important
Must realize competition between shale plays – taxation
Identify and nurture market opportunities for shale energy products
33

THANK YOU !!!
34