revision 1 experimental simulation of bubble nucleation ... · 103 stromboli is a basaltic volcano...
TRANSCRIPT

1
Revision 1 1
Experimental simulation of bubble nucleation and magma ascent 2
in basaltic systems: implications for Stromboli volcano 3
4
Nolwenn Le Gall 1, *, Michel Pichavant 1 5
6
1 Université d’Orléans, ISTO, UMR 7327, 45071, Orléans, France, and CNRS/INSU, ISTO, 7
UMR 7327, 45071, Orléans, France, and BRGM, ISTO, UMR 7327, BP 36009, 45060, 8
Orléans, France 9
10
* Corresponding author at: ISTO, UMR 7327, 1A rue de la Férollerie, 45071, Orléans Cedex 11
02, France 12
E-mail address: [email protected] (N. Le Gall) 13
14
Abstract 15
The ascent of H2O- and H2O-CO2-bearing basaltic melts from the deeper to the shallower part 16
of the Stromboli magmatic system and their vesiculation were simulated from decompression 17
experiments. A well-studied “golden” pumice produced during an intermediate to a large-18
scale paroxysm was used as starting material. Volatile-bearing glasses were synthesized at an 19
oxygen fugacity (fO2) ranging from NNO–1.4 to +0.9, 1200°C and 200 MPa. The resulting 20

2
crystal and bubble-free glasses were then isothermally (1200°C) decompressed to final 21
pressures Pf ranging between 200 and 25 MPa, at a linear ascent rate of 1.5 m/s (or 39 kPa/s) 22
prior to be rapidly quenched. Textures of post-decompression glasses which were 23
characterized by X-ray computed tomography result from different mechanisms of degassing 24
that include bubble nucleation, growth and coalescence, as well as fragmentation. 25
Homogeneous bubble nucleation occurs for supersaturation pressures (difference between 26
saturation pressure and pressure at which bubbles start to form homogeneously, ΔPHoN) ≤ 50 27
MPa. In the CO2-free melts, homogeneous nucleation occurs as two distinct events, the first 28
and most important at high Pf (200–150 MPa) and the second at low Pf (50–25 MPa) near the 29
fragmentation level. In contrast, in the CO2-bearing melts, multiple events of homogeneous 30
bubble nucleation occur over a substantial Pf interval along the decompression path. Bubble 31
coalescence occurs in both H2O- and H2O-CO2-bearing melts and is the more strongly marked 32
between 100 and 50 MPa Pf. The CO2-free melts follow equilibrium degassing until 100 MPa 33
Pf and are slightly supersaturated at 60 and 50 MPa Pf, thus providing the driving force for the 34
second bubble nucleation event. In comparison, disequilibrium degassing occurs 35
systematically in the CO2-bearing melts which retain high CO2 concentrations. Fragmentation 36
was observed in some CO2-free charges decompressed to 25 MPa Pf and is intimately 37
associated with the occurrence of the second bubble nucleation event. Textures of H2O-CO2-38
bearing glasses reproduce certain critical aspects of the Stromboli natural textures (bubble 39
number densities, shapes, sizes and distributions) and chemistries (residual volatile 40
concentrations). Average bubble sizes, bubble size distribution (BSD) and bubble number 41
density (BND) data are used together to estimate that the “golden” pumice magmas ascend 42
from their source region in 43 to 128 min. 43
Keywords: Basalt, Stromboli, Volatiles, Magma degassing, Magma ascent, Bubble 44
nucleation, Fragmentation 45

3
46
Introduction 47
Water and carbon dioxide, which are the two main volatile components dissolved in basalt 48
magmas, control the physical processes involved in volcanic eruptions (e.g., Cashman and 49
Sparks, 2013). As magma ascends to the Earth’s surface, pressure decreases and this causes 50
exsolution of the dissolved volatiles from the supersaturated melt. Accordingly, gas bubbles 51
nucleate, grow and coalesce as magma continues to ascend. The evolution of the gas phase 52
within the volcanic conduit is thought to govern the eruptive behavior. The gas phase can 53
either remain as bubbles within the melt (“closed-system” degassing) or escape from the 54
magma (“open-system” degassing). The former case would lead to explosive behavior and the 55
latter to effusive behavior (e.g., Gonnermann and Manga, 2005, 2007). As an illustration, 56
Stromboli volcano (Aeolian Islands, Italy) is, among other basaltic volcanoes, characterized 57
by a variety of eruptive styles ranging from lava flows to mild Strombolian explosions to 58
more violent explosions. Such a variety is thought to be controlled by the kinetics of magma 59
vesiculation (bubble nucleation, growth and coalescence) and fragmentation, as well as by 60
changes in magma ascent rate (Woods and Koyaguchi, 1994; Sparks, 2003; Edmonds, 2008). 61
Studies of when and how gas bubbles form and separate from magma are needed to better 62
understand whether a volcanic eruption is effusive or explosive (Edmonds, 2008). Volcanic 63
magma degassing, corresponding to the loss of dissolved volatiles, can be studied from 64
different approaches. The first, including petrological studies and phase equilibria 65
experiments, aims at determining the volatile compositions and concentrations in magma 66
prior to significant degassing (Edmonds, 2008) (e.g., Bertagnini et al., 2003; Métrich et al., 67
2005; Di Carlo et al., 2006; Métrich et al., 2010; Pichavant et al., 2009, 2011). Volatile 68
solubility models (e.g., Newman and Lowenstern, 2002; Papale et al., 2006; Iacono-Marziano 69

4
et al., 2012) play an important role. The second, including textural and geochemical studies, 70
deals with the exsolved, integrated products of degassing (Edmonds, 2008) (e.g., Mangan and 71
Cashman, 1996; Gaonac’h et al., 1996; Lautze and Houghton, 2007; Polacci et al., 2006, 72
2008, 2009; Burton et al., 2007; Allard, 2010; Aiuppa et al., 2010a, 2011). In addition, 73
numerical models are becoming available to simulate the physical (textures) and chemical 74
(volcanic gases, volatile solubilities) evolution of gas bubbles and melt during degassing (e.g., 75
Blower et al., 2001, 2002; Toramaru, 2006; Burgisser et al., 2015). However, none of these 76
two main approaches are completely satisfactory. Volatile solubility models as well as the 77
interpretation of volcanic gas data assume gas-melt equilibrium degassing of basaltic 78
magmas, while recent experiments (Pichavant et al., 2013; Le Gall and Pichavant, 2016) have 79
reported the possibility of disequilibrium degassing during ascent and decompression of CO2-80
bearing basaltic melts. There are also problems and disagreements associated with the 81
interpretation of textural and chemical data in natural eruption products (Gaonac’h et al., 82
1996; Blower et al., 2001, 2002; Edmonds, 2008). 83
In complement to these two main approaches, high pressure and temperature decompression 84
experiments (e.g., Hurwitz and Navon, 1994; Gardner et al., 1999; Mourtada-Bonnefoi and 85
Laporte, 1999; Mangan and Sisson, 2000; Mourtada-Bonnefoi and Laporte, 2002; 2004; 86
Mangan and Sisson, 2005; Iacono-Marziano et al., 2007; Cluzel et al., 2008; Gardner and 87
Ketcham, 2011) have the advantage to simulate the vesiculation process during magma 88
ascent. Therefore, in an attempt to assist in the interpretation of textural and chemical data 89
collected on basaltic eruptive products, we performed experimental simulations of the ascent 90
and degassing of H2O- and H2O-CO2-bearing Stromboli melts. The run products were 91
texturally and chemically characterized to model the behavior of the major volatiles (H2O, 92
CO2) during decompression, and in particular to assess the effect of ascent rate on the 93
degassing kinetics. Our results bring direct constraints on degassing processes at Stromboli 94

5
which is one representative example of explosive basaltic volcanoes (Rosi et al., 2013). It is 95
also a very well-studied system and melt inclusion data (e.g., Métrich et al., 2010; Bertagnini 96
et al., 2003; Métrich et al., 2005, 2010) and gas measurements (e.g., Burton et al., 2007; 97
Aiuppa et al., 2010a, b, 2011; La Spina et al., 2013) are available. In addition, H2O and CO2 98
solubility data (both models and experiments, Newman and Lowenstern, 2002; Shishkina et 99
al., 2010; Lesne et al., 2011a, b) allow detailed interpretation of natural products. 100
101
Volcanological background 102
Stromboli is a basaltic volcano located in the Aeolian Islands, Italy. It is well known for its 103
persistent explosive activity established 1300–1700 years ago (Rosi et al., 2000). This normal 104
activity, which consists of rhythmic, mild to moderate explosions lasting a few seconds (e.g., 105
Rosi et al., 2013) is associated with a continuous degassing dominated by H2O, CO2 and SO2 106
(Aiuppa et al., 2010a). Every 10–20 min, scoriaceous lapilli and bombs, ash and lithic blocks 107
are ejected to heights of a few tens to hundreds of meters above the summit craters (Rosi et 108
al., 2000; Bertagnini et al., 2003; Francalanci et al., 2004). According to Burton et al. (2007), 109
such explosions result from the buoyant rise of deep-sourced (< 3 km) gas slugs. This normal 110
Strombolian activity can be suddenly interrupted by lava flows, and by violent explosions of 111
variable scale defined as Strombolian paroxysms (Mercalli, 1907; Rosi et al., 2013). 112
Paroxysms range from small-scale (Métrich et al., 2005; Bertagnini et al., 2008; Rosi et al., 113
2013), also designated as “major explosions” (Barberi et al., 1993), to large-scale, the latter 114
often called paroxysms for simplicity (Bertagnini et al., 2011; Rosi et al., 2013). These more 115
violent explosions occur at a rate from 1.7 episodes per year (Rosi et al., 2013) to 1–10 116
episodes per century (Pichavant et al., 2009). During these highly energetic events, fallouts of 117

6
meter-sized bombs and blocks, gas and ash, are produced and ejected up to a few kilometers 118
from the vents. 119
These three types of eruptive activity at Stromboli are fed by two distinct magmas: a volatile-120
poor black scoria and a volatile-rich yellowish pumice (designated as “golden” pumice; 121
Métrich et al., 2001; Bertagnini et al., 2003, 2008). The former, that supplies normal 122
Strombolian activity and lava flows, is highly porphyritic (~50 vol% crystals of plagioclase, 123
clinopyroxene and olivine; Landi et al., 2004; Pichavant et al., 2011). In contrast, the latter, 124
commonly produced during the paroxysms, has low porphyricity (~10 vol% crystals of 125
clinopyroxene, olivine and plagioclase; e.g., Francalanci et al., 2004; Pichavant et al., 2011). 126
The present-day feeding system is thought to comprise a shallow reservoir hosting the black 127
scoria magmas, recharged with the periodic arrival of “golden” pumice magmas from a 128
deeper crustal reservoir (Pichavant et al., 2009; Métrich et al., 2010; Pichavant et al., 2011). 129
Both magmas are often intermingled, and crystals in the “golden” pumices mainly come from 130
the black scoria because of syn-eruptive mingling between the two magma types (e.g., Di 131
Carlo et al., 2006). 132
Strombolian paroxysms constitute a serious hazard for inhabitants and visitors, due to their 133
high intensity and potential to strike inhabited areas (Rosi et al., 2013). Development of the 134
monitoring system since the 2002–2003 crisis now allows to daily collect a large body of 135
geochemical and geophysical data (e.g., Ripepe and Harris, 2008; Rosi et al., 2013). 136
Continuous measurements of CO2 and SO2 emissions have evidenced significant changes in 137
the chemical composition of the gases between quiescent, passive degassing and eruptions 138
(Burton et al., 2007; Aiuppa et al., 2009, 2010a, b, 2011; La Spina et al., 2013). Concerning 139
Strombolian paroxysms, these appear systematically preceded by medium-term (days to 140
weeks) increases of CO2 fluxes (Aiuppa et al., 2010a, b, 2011). Two main models have been 141
proposed to explain these observations. According to Bertagnini et al. (2003) and Métrich et 142

7
al. (2001, 2005, 2010), the more violent explosions would be generated by the rapid ascent, 143
decompression and fragmentation of a volatile-rich, low-porphyritic magma (“golden” 144
pumice) batch. Alternatively, Allard (2010) suggests that such events would result from the 145
bursting of CO2-rich gas slugs generated at 8–10 km depth. In addition, Pichavant et al. 146
(2013) have proposed that Strombolian paroxysms would be driven by explosive degassing 147
and fragmentation of CO2-oversaturated melts produced as a result of disequilibrium 148
degassing during ascent. 149
150
Experimental methods 151
Two types of experiments were performed: synthesis and decompression. The synthesis 152
experiments were conducted to generate the bubble-free H2O- and H2O-CO2-bearing basaltic 153
melts to be used in the decompression experiments, in order to simulate their ascent. 154
155
Scaling of the decompression experiments 156
Experimental conditions (P, T, basaltic composition, dissolved H2O/CO2, ascent rate and fO2) 157
were scaled against Stromboli. In this way, the initial pressure (Pin = 200 MPa) chosen in the 158
decompression experiments is consistent with the depth of the storage region of “golden” 159
pumice melts (around 7.5 km, Di Carlo et al., 2006; Pichavant et al., 2009; Métrich et al., 160
2010). Final pressures (Pf = 200–25 MPa) correspond to different heights in the volcanic 161
conduit. The temperature (T = 1200°C and kept constant) was chosen to be above the liquidus 162
of “golden” pumice melts, on the basis of previous phase equilibrium experiments (Di Carlo 163
et al., 2006; Pichavant et al., 2009). All experiments were performed with the same basaltic 164
composition representative of “golden” pumice melts involved in the present-day activity at 165

8
Stromboli (Francalanci et al., 1989, 1993, 2004; Di Carlo et al., 2006). The pre-166
decompression ranges of volatile concentrations (0.71–4.94 wt% H2O, 818–1094 ppm CO2) 167
investigated overlap with the H2O and CO2 concentrations in Stromboli melt inclusions (e.g., 168
Métrich et al, 2010). Concerning the ascent rate, there is a large uncertainty on Stromboli. On 169
the one hand, an ascent rate of 3 mm/s (Calvari et al., 2011) implies that “golden” magmas 170
would ascend from 7–8 km depth in about 1 month. This seems much too slow since “golden” 171
pumices lack microlites which implies ascent durations of a maximum of 10 h (Di Carlo et al., 172
2006; Pichavant et al., 2011). On the other hand, an ascent velocity of 32 m/s has been 173
proposed from Stromboli melt viscosity data (Misiti et al., 2009), implying an ascent time of 174
only a few minutes from 7–8 km depth. In this study an average ascent rate value of 1.5 m/s 175
was investigated more in line with the petrological constraints (< 10 h). This value is in the 176
average of ascent rates determined for Vulcanello shoshonite magmas (0.27–3.2 m/s; Vetere 177
et al., 2007), a system closely similar to that of Stromboli (Pichavant et al., 2013). Concerning 178
the redox state, oxidizing redox conditions around ∆NNO = +0.5 (where NNO is the nickel-179
nickel oxide buffer) were determined for the near-liquidus evolution of “golden” pumice 180
melts (Di Carlo et al., 2006; Pichavant et al., 2009) and this fO2 range was imposed in our 181
decompression experiments. 182
183
Starting material 184
The starting material used for the experiments is a high-K basalt from a paroxysmal explosion 185
(PST-9 “golden” pumice, Di Carlo et al., 2006; Pichavant et al., 2009, 2011). The whole-rock 186
composition of this pumice sample is shown in Table 1. PST-9 is highly vesicular (~60 vol% 187
vesicles) and slightly porphyritic (~11 vol%; Pichavant et al., 2011), within the range of other 188
pumices. A homogeneous starting glass was obtained by crushing the PST-9 pumice and 189

9
melting the fine powder at 1400°C, 1 atm, during 3 hours, in a Pt crucible (Table 1). The 190
resulting crystal- and bubble-free glass was then cored to cylinders with a diameter of 2.5 and, 191
less frequently, 5 mm and typical lengths around 10 and 6 mm, respectively. The 5 mm 192
diameter was tested to explore the influence of sample size on bubble nucleation. 193
For the synthesis experiments (Table 2), the glass cylinders were loaded into capsules (1.5–3 194
cm length, 2.5 or 5 mm internal diameter, 0.2 wall thickness) made of Au80Pd20. Such a metal 195
composition was used to minimize iron loss during the experiments (Di Carlo et al., 2006; 196
Pichavant et al., 2009). Distilled water and carbon dioxide as silver oxalate (Ag2C2O4) were 197
used as volatile sources. Three different proportions of H2O and CO2 were introduced in the 198
capsules, corresponding to XH2Oin (molar H2O / (H2O + CO2)) = 1 (series #1: only H2O 199
dissolved in glass, no CO2 present), 0.25–0.56 (series #2: H2O and CO2 both dissolved in 200
glass, high dissolved H2O/CO2) and 0 (series #3: H2O and CO2 both dissolved in glass, low 201
dissolved H2O/CO2, see below for the origin of H2O). For the 5 mm diameter cores, only 202
XH2Oin = 1 conditions were investigated, because homogenization of melt CO2 concentrations 203
would have required a prohibitively long experimental duration (Zhang and Ni, 2010). In one 204
of the synthesis experiments (S5, Table 2), a separate Ni-NiPd sensor capsule was included 205
for the determination of the experimental fH2. It consisted of two pellets of NiPd metal 206
mixtures (with different Ni/Pd ratio) plus NiO, placed in a Pt capsule in the presence of excess 207
H2O (Taylor et al., 1992). 208
For the decompression experiments (Table 3), the synthesized volatile-bearing glass cores 209
(2.5 or 5 mm in diameter and about 4 mm long) were fitted into Au80Pd20 capsules without 210
further addition of volatiles. Capsules of identical internal diameter (2.5 and 5 mm) but 211
variable lengths (from 1 to 5 cm for the capsules decompressed to the lowest pressures) were 212
used to accommodate gas expansion during decompression. 213

10
Capsules were weighed before and after welding to ensure that no leaks occurred. 214
215
Equipment 216
All experiments were carried out in an internally heated pressure vessel (IHPV), working 217
vertically and equipped with a rapid-quench device. The vessel was pressurized with Ar-H2 218
mixtures obtained by sequential loading of H2 and Ar at room temperature (Scaillet et al., 219
1992). The synthesis and decompression experiments were performed with an initial H2 220
pressure of 1 bar and experimental fH2 measured in one run with a redox sensor (see above). 221
Then, Ar was pumped into the IHPV up to the pressure needed to attain the final target 222
conditions (Pichavant et al., 2013). Total pressure was recorded continuously by a transducer 223
calibrated against a Heise gauge with an accuracy of ± 20 bars. The capsules were placed 224
together in a sample holder made of an alumina tube and suspended by a thin Pt wire in a 225
molybdenum furnace having a 2–3 cm long hotspot. Temperature was measured using two S-226
type thermocouples placed along the length of the capsules and recorded continuously 227
(uncertainty ± 5°C) with a Eurotherm controller. Near-isothermal conditions (gradient < 2–228
3°C/cm) were maintained in the sample holder. At the end of the synthesis and decompression 229
experiments, the Pt suspension wire was fused electrically, allowing the sample holder to fall 230
into the cold part of the vessel, leading to a cooling rate of about 100°C/sec (Di Carlo et al., 231
2006). 232
233
Run procedure 234
All synthesis and decompression experiments were performed independently from each other. 235

11
The synthesis experiments were performed at 200 MPa and 1200°C (Table 2), which are 236
conditions known to be above the PST-9 liquidus on the basis of previous phase equilibrium 237
experiments (Di Carlo et al., 2006; Pichavant et al., 2009). Up to four capsules (one for each 238
series# plus the sensor capsule) were placed together in the IHPV for duration of about 40 239
hours. According to H2O and CO2 melt diffusion calculations (Zhang and Ni, 2010), initial 240
experiments have shown that such a duration is sufficient to attain an equilibrium distribution 241
of dissolved H2O and CO2 in the 2.5 mm diameter melt cores (Le Gall and Pichavant, 2016). 242
For the 5 mm diameter melt core, a run duration of 24 hours was long enough to dissolve 243
water and attain an equilibrium distribution. The synthesized crystal- and bubble-free glasses 244
were used as starting materials in the decompression experiments (Table 3). 245
Each decompression run included up to three capsules (one for each series#, Table 3). The 246
experiments were conducted at a constant temperature of 1200°C, from an initial pressure 247
(Pin) of 200 MPa to final pressures (Pf) ranging between 200 (no decompression) and 25 MPa. 248
The 5 mm diameter glass cylinder was decompressed to 60 MPa Pf. All runs began with a 249
step of approximately one hour at 200 MPa and 1200°C, to re-equilibrate the starting volatile-250
bearing glasses. Pressure was then released manually to Pf at a decompression rate of 39 kPa/s 251
(or 1.5 m/s taking a rock density of 2650 kg/m3), which leads to decompression durations of 252
20–75 min depending on Pf. Immediately after attainment of Pf, decompression charges were 253
rapid-quenched (within ~1–2 s) to freeze the glass textures and chemistries. 254
After the quench, capsules were weighted to check for leaks and then opened. 255
256
Analytical methods 257
Sample preparation 258

12
After each synthesis experiment, a part of the glass cylinder (one for each series#) was 259
analyzed by IR spectroscopy to check for the homogeneity of H2O and CO2 concentrations 260
and distributions. To do so, sections were cut perpendicularly to the long axis of the glass 261
cylinders, double-polished and analyzed. 262
After the decompression experiments, the glass cylinders were carefully removed from their 263
capsules. Their texture was studied by X-ray microtomography (the analysis is performed on 264
the entire charge). Then, the glasses were subdivided into several sections, again cut 265
perpendicularly to the cylinder long axis. One of these sections (or several sections when 266
numerous analyses were needed) was double-polished for the determination of volatile 267
concentrations dissolved in the glass, by IR spectroscopy. Another section was embedded into 268
epoxy resin and polished for scanning electron microscope (SEM) observations. 269
The metallic pellets in the sensor capsule were also recovered, mounted in epoxy resin, and 270
then analyzed by electron microprobe. 271
272
Textural analyses 273
We used the Phoenix Nanotom 180 at ISTO, Orléans to perform X-ray computed tomography 274
(X-ray CT) analyses of each post-decompression charge. Between 1000 and 1100 projection 275
images were collected from the 360° rotation of the samples, using a tungsten filament and 276
either a molybdenum (most of the time) or a tungsten (more rarely) target. During the 277
acquisition of the X-ray CT scans, the glass cylinders were mounted on carbon fiber rods with 278
thermoplastic adhesive. Operating voltages ranged from 90 to 110 kV, with filament currents 279
of 58–170 µA. Voxel edge lengths ranged between 2.78 and 6.77 µm, and they represent the 280
minimum bubble sizes that can be detected. Reconstruction of the projections into a stack of 281
grayscale images was performed with a Phoenix program (datos|x reconstruction). Then, a 282

13
complete three-dimensional reconstruction of the sample was produced using the ImageJ 283
software package (Abràmoff et al., 2004). This allows the determination of the textural 284
parameters (individual bubble volume, individual bubble size D calculated from volume 285
assuming a spherical shape, bubble number density BND defined as the number of bubbles 286
per unit volume of melt, average spacing between bubbles S and vesicularity V, Table 3), 287
following the procedure described in Le Gall and Pichavant (2016). Image analysis was 288
performed either on entire X-ray CT dataset (Vc determination, Table 3) or on four 289
representative sub-volumes of each sample (Vd determination, Table 3). For charge D24#1 290
(Fig. 1c), the population of very large interconnected voids opened toward the exterior of the 291
charge were counted as bubbles. Their sizes and number densities were estimated from two-292
dimensional tomographic slices. 293
For comparison with the vesicularities measured in our run products, theoretical vesicularities 294
generated from equilibrium degassing were computed for the PST-9 melt composition, as 295
detailed in Le Gall and Pichavant (2016). Two end-member cases were considered 296
corresponding to the equilibrium degassing of pure H2O and pure CO2 gas, respectively. 297
298
A limited number of samples were examined by scanning electron microscopy (SEM), to 299
check for the presence of bubbles which cannot be detected by X-ray CT because of their size 300
(< 4 µm). SEM images were collected using the MIRA3 TESCAN FEG instrument at ISTO, 301
Orléans. An accelerating voltage of 15–25 kV was applied. 302
303
Glass volatile concentrations 304

14
H2O and CO2 contents in the samples were determined by Fourier transform infrared 305
spectroscopy (FTIR). We used a Nicolet 6700 spectrometer and a Continuµm FT-IR 306
microscope, together with an IR source, a KBr beamsplitter and a MCT/A detector (mercury, 307
cadmium, tellurium). Punctual analyses and concentration profiles, to control the 308
homogeneity of the starting glass cores and the distribution of the volatiles, were performed 309
with a 50 µm diameter spot. FTIR spectra were acquired between 650 and 7000 cm-1 on 310
doubly polished samples (18–207 µm) from 128 scans collected at a resolution of 4 cm-1. H2O 311
and CO2 concentrations (C, wt%) were calculated from the Beer-Lambert law, as (e.g., 312
Métrich et al., 2004): 313
C = 100 · A · M
· ρ · e (1) 314
where A is the absorbance (measured at 3530 cm-1 for H2O and at 1515 cm-1
for CO2), M the 315
molar mass of the species (g/mol), the molar absorptivity (L/mol/cm), ρ the glass density 316
(g/cm3), and e the sample thickness (cm) measured with an optical microscope. 317
Absorbance of the 3530 cm-1 total H2O band was measured with a straight base line, and that 318
of the 1515 cm-1 carbonate ions band was determined by subtracting a spectrum obtained on a 319
glass with no dissolved volatiles. For H2O we considered a of 64 L.mol-1.cm-1 (Dixon et al., 320
1995) and for CO2, we calculated a of 363 L.mol-1.cm-1 from the equation of Dixon and Pan 321
(1995), as 1525=451-342 [Na/(Ca+Na)]. Densities of the experimental glasses were 322
calculated using the method of Richet et al. (2000), using the measured density of the 323
anhydrous starting glass (ρ = 2.747 ± 0.001). With this method we consider only the amount 324
of water dissolved in the glass and assume that the quantity of CO2 dissolved does not 325
significantly affect densities (Lange, 1994; Bourgue and Richet, 2001; Lesne et al., 2011a). 326
Analytical uncertainties on volatile concentrations in glasses are ± 0.1 wt% (H2O) and ± 100 327
ppm (CO2). 328

15
329
Equilibrium gas-melt computations (volatile solubilities as a function of P-T conditions, 330
isobaric solubility curves and closed-system degassing paths) were calculated with the 331
VolatileCalc model of Newman and Lowenstern (2002), for a basalt with 49 wt% SiO2. H2O 332
and CO2 contents in glasses from the synthesis experiments and from the series #1 333
decompression experiments (see in Fig. 5a) were also compared with the recent experimental 334
solubilities of Lesne et al. (2011a, b) and Shishkina et al. (2010), determined for a pressure of 335
200 MPa and temperatures of 1200–1250°C. 336
337
Electron microprobe analyses of metallic sensor phases were performed with the Cameca SX-338
50 at Orléans. Analyses were carried out under an acceleration voltage of 20 kV, counting 339
times of 10 s, and a sample current of 20 nA. 340
341
Experimental results 342
Redox conditions 343
The mole fraction of Ni in the alloy phase of the sensor capsule (XNi) indicated a fH2 of 9 bar. 344
This translates to fO2 conditions in the synthesis experiments ranging from NNO–1.4 (series 345
#3), NNO+0.1 (series #2) to NNO+0.9 (series #1) depending on the H2O concentrations (and 346
thus the fH2O) in the three experimental series (NNO is the fO2 of the Ni-NiO equilibrium at 347
the P-T of interest). The fO2 conditions determined for series #1 and #2 melts are close to the 348
fO2 around NNO+0.5 determined for the near-liquidus evolution of “golden” pumice melts 349
(Di Carlo et al., 2006). It is worth noting that the fO2 determined for series #3 melts is more 350

16
reduced, because of the lower melt H2O concentrations (and so lower fH2O) measured in this 351
series (see below). 352
353
H2O and CO2 concentrations in starting glasses 354
The volatile contents of the crystal- and bubble-free glasses from the synthesis experiments 355
(hereafter designated as pre-decompression glasses) are presented in Table 2. No 356
concentration gradients of either H2O or CO2 were observed on FTIR profiles from capsule 357
walls towards glass cores. If the standard deviations and analytical errors for the volatile 358
concentration measurements are considered, the pre-decompression glasses have 359
homogeneous H2O and CO2 concentrations. 360
Starting glasses divide into three compositional groups according to the synthesis conditions 361
(Table 2). Series #1 glasses contain about 4.92 ± 0.02 wt% dissolved H2O and no CO2. Water-362
saturated conditions were confirmed in series #1 charges by the presence of water bubbles 363
hissing out from the capsules during their opening (Lesne et al., 2011b). The H2O 364
concentration measured in sample S8#1 is clearly lower (2.53 ± 0.05 wt%, Table 2) and thus 365
appears anomalous, being excluded from the average. Actually, H2O loss occurred in this 366
charge during the experiment. Series #2 glasses have between 1.95 and 2.37 wt% H2O and 367
from 818 to 1011 ppm CO2 (Table 2). One synthesis charge has a clearly lower H2O content 368
(0.58 wt%, S4#2) than the others. This deviation is related to an analytical problem (in spite 369
of multiple checks, the analytical problem persisted). The glass decompressed from S4#2 to Pf 370
= Pin = 200 MPa (D3#2 charge) was found to contain a reasonable H2O concentration (2.45 371
wt%, Tables 3 and 5). Therefore, the H2O content of charge S4#2 is estimated to be around 372
2.5 wt%. Apart from S4#2, the series #2 volatile concentrations are within the range of melt 373
inclusions in Stromboli “golden” pumices (H2O = 1.8–3.4 wt%, CO2 = 894–1689 ppm; 374

17
Métrich et al., 2001; Bertagnini et al., 2003; Métrich et al., 2010). Although water was not 375
initially added in series #3 capsules (XH2Oin = 0, Table 2), this volatile component was found 376
dissolved in all series #3 pre-decompression glasses (concentration range: 0.71–1.12 wt%, 377
Table 2). Glass CO2 concentrations are of the order of 850–1100 ppm. H2O is generated 378
through the reduction of the Fe3+ of the melt during synthesis, because of the pressurization of 379
the vessel with H2. The reduction reaction can be written (e.g., Lesne et al., 2011a): 380
Fe2O3(melt) + H2(vap/melt) = 2FeO(melt) + H2O(melt) (2) 381
Part of the water may also come from the silver oxalate used as the CO2 source, as mentioned 382
by Lesne et al. (2011a), reaction (Eq. 2) being insufficient to account for the measured H2O 383
contents of series #3 glasses. 384
The dissolved H2O and CO2 concentrations in all compositional series are in agreement with 385
the experimental solubilities found in basaltic melts equilibrated at 200 MPa, 1200–1250°C 386
(Shishkina et al., 2010; Lesne et al., 2011a, b). 387
388
Textures of post-decompression glasses: qualitative observations 389
Charges from the decompression experiments (hereafter designated as post-decompression 390
glasses) were generally recovered as glassy blocks. Exceptions are provided by the series #1 391
charges decompressed to 25 MPa which yielded a range of textures totally different from all 392
the other charges from this paper. Bubbly glass fragments, foams (Fig. 1c) and in one case a 393
glass powder were observed in the 5 series #1 charges decompressed to 25 MPa Pf (Table 4). 394
All post-decompression glasses were crystal-free. The absence of crystals was checked by 395
optical microscopy on the doubly polished sections prepared for FTIR and also by SEM. Tiny 396
oxide crystals (Ti-bearing magnetite, Di Carlo et al., 2006; Pichavant et al., 2009; Pichavant et 397
18
al., 2013) occur in some charges but always in very small amounts. Some charges show 398
evidence for bubble nucleation on those Fe–Ti oxides (Le Gall, 2015). However, this was 399
observed only for a negligible proportion of nucleated bubbles (i.e., for less than 1.5% of total 400
bubbles in most charges and up to 6% in charge D5#2). 401
Two main types of post-decompression glasses were distinguished on the basis of textures 402
observed in the core of the samples. The first type corresponds to bubble-free glasses (Fig. 403
1a). It concerns the D3#1 and D3#3 samples (Table 3). Although the interior of these glasses 404
is completely devoid of bubbles, D3#1 charge exhibits a thin (< 50 µm, Fig. 1a) bubbly rim 405
resulting from heterogeneous nucleation on the inner wall of the capsule (e.g., Mourtada-406
Bonnefoi and Laporte, 2002). The second type of post-decompression glasses is characterized 407
by a nucleated core with a nearly homogeneous texture (Fig. 1b). Three distinct zones can be 408
identified in these glasses: (1) a bubbly rim (generally up to ~300 µm, e.g., in the order of 409
150–200 µm in D24#3 sample, Fig. 1b) at the glass-capsule interface, followed by (2) a 410
bubbly-free zone (depleted in volatiles), and (3) a core with uniformly spaced bubbles having 411
variable sizes, from a few micrometers up to 266 µm (range of bubble diameters, Table 3). 412
Given the almost uniform spatial distribution of bubbles and the absence of crystals (hence of 413
possible nucleation sites), we interpret the textures of type 2 post-decompression glasses to 414
result from homogeneous bubble nucleation. Charge D1#2 is characterized by a somewhat 415
heterogeneous distribution of relatively large bubbles (6–60 µm, Table 3). However, SEM 416
imaging revealed the presence of a large population of smaller (< 5 µm) bubbles, 417
homogeneously distributed within the charge. This seems to be the case of charges D1#3 and 418
D2#3 although no check of the presence of small bubbles could be performed by SEM 419
because no samples were left for analysis. 420
Bubbles are absent in series #1 and #3 experiments quenched at Pf = Pin = Psynthesis = 200 421
MPa. In series #2, in contrast, the sample quenched at Pf = 200 MPa (D3#2) contains a few 422

19
large bubbles (10 bubbles with an average size of 40 µm, Table 3). The presence of these 423
bubbles may reflect an excess of the fluid phase (early excess fluid-phase bubbles), as 424
observed by Lensky et al. (2006), or may correspond to trapped air bubbles. Consequently, 425
these bubbles are not considered below as products of homogeneous nucleation. 426
427
Textures of post-decompression glasses: quantitative observations 428
Textural information about the decompression experiments are given in Tables 3 and 4 and 429
depicted in Fig. 2–4. 430
Vesicularities range from 0 to 71.2 vol% (series #1), 0.01 to 13.8 vol% (series #2) and from 0 431
to 9.25 vol% (series #3). It is worth noting that the series #1 charge (D24#1) with a 71.2 vol% 432
vesicularity is part of the texturally specific 25 MPa Pf charges (Table 4). This charge yielded 433
a highly vesicular foam that was found extruded out of the capsule (Fig. 1c). However, this 434
unusual texture is not the result of capsule failure as detailed below, and is considered to be 435
representative of the degassing process between 50 to 25 MPa Pf in series #1 charges. 436
Consequently, the data from charge D24#1 will be given below full consideration. Another 437
series #1 charge (D8#1) is also worth being detailed since it was performed with a pre-438
decompression melt having a H2O concentration ~50% lower than all the other series #1 439
charges. D8#1 was decompressed to 25 MPa Pf and yielded a vesicularity of 1.45 vol% which 440
cannot be directly compared with the data for the other series #1 charges. For this reason, 441
D8#1 is plotted with a different symbol on Fig. 2. 442
In general, vesicularity increases with decreasing Pf from 200 to 25 MPa (Fig. 2a, Tables 3 443
and 4), especially between Pf = 50 and 25 MPa. Besides the dependence on Pf, vesicularities 444
are a function of the volatile series since the highest vesicularities are for the H2O-rich glasses 445
(series #1). For example, when decreasing the melt H2O content at constant Pf (25 MPa, Fig. 446
20
2a), V decreases from 71.2 (series #1) to 13.8 (series #2) to 9.7 (series #3) vol%. 447
Vesicularities for series #1 are lower than theoretical vesicularities calculated from 448
equilibrium degassing, except the point at 25 MPa Pf which plots on the theoretical curve. The 449
series #2 data plot intermediate between the two theoretical vesicularity curves whereas the 450
series #3 glasses plot close to the theoretical curve for CO2 degassing (Fig. 2a). 451
Average bubble diameters in series #1 range from 8 to 741 µm. Charge D24#1 (Pf = 25 MPa, 452
Fig. 1c) is characterized by two distinct bubble populations with sizes ranging from 9 µm to 453
1.8 mm. The first population has an average bubble size of 741 µm and the second of 17 µm 454
(Fig. 2b). The series #1 D24#1 charge is the only one hosting a bubble population (the first 455
one) with shapes that deviate significantly from spherical. In comparison with the other series 456
#1 glasses, sample D8#1 (Pf = 25 MPa) deviates from the general behavior since bubble sizes 457
are lower on average (28 µm) as a result of its lower pre-decompression melt H2O 458
concentration. For the series #2 samples, D ranges from 13 to 74 µm and from 6 to 18 µm for 459
the series #3. For the three series, bubble diameter generally increases with decreasing Pf 460
from 200 to 25 MPa (Fig. 2b, Table 3). The average bubble diameter is also dependent on the 461
concentration of dissolved volatiles. The larger bubble sizes are for the H2O-rich series #1 462
post-decompression glasses (741 µm at 25 MPa Pf), decreasing with lowering the melt H2O 463
content (69–74 µm for series #2 and 16–18 µm for series #3). 464
Bubble number densities (BNDmelt, Table 3 and Fig. 2c) range from about 100 to 102 mm-3 465
(series #2), 103 mm-3 (series #1) and 104 mm-3 (series #3). Upon decreasing Pf, BNDs of 466
series #1 glasses generally decrease, from 103 (150 MPa, D30#1) to 100 mm-3 (50 MPa, 467
D5#1). Nevertheless, two BND increases are observed along the decompression path, the first 468
and largest between 200 (0 mm-3, D3#1) and 150 MPa and the second from 50 to 25 (100–101 469
mm-3, D24#1) MPa. In contrast, the series #2 and #3 glasses have BNDs generally increasing 470
from 200 (100 and 0 mm-3, D3#2 and D3#3) to 25 (102 and 104 mm-3, D8#2 and D24#3) MPa. 471

21
Nevertheless, in both glass series there are a few exceptions characterized by BND decreases, 472
for example between Pf = 150 and 100 MPa for one series #3 charge and between Pf = 100 473
and 50 MPa for one series #2 and also one series #3 charges (Fig. 2c). 474
Bubble size distributions (BSDs) are analyzed from histograms based on the diameter of the 475
bubbles (Fig. 3) and from cumulative distributions of volumetric classes (Fig. 4), constructed 476
for each series. Two main types of distributions were distinguished in Fig. 4, exponential and 477
power law, although the two are mixed in most samples. Regressions were performed with 478
Excel software. Very good fits were generally obtained, yielding R2 > 0.99 for more than 50% 479
charges. Series #1 glasses are initially (at Pf = 150 MPa) characterized by bubbles sizes 480
ranging between 4 and 46 µm (D30#1, Fig. 3a, Table 3), leading to a power law bubble size 481
distribution with an exponent of 1.91 (Fig. 4a). Then, from Pf = 100 to 50 MPa bubbles 482
become larger (40–200 µm, D5#1) and multiple peaks occur in the histogram (Fig. 3a), 483
corresponding to exponential distributions (Fig. 4a). It is worth mentioning that the bubble 484
size distribution in D5#1 is uncertain because of its low number of bubbles. At Pf = 25 MPa, 485
the two bubble populations in D24#1 charge have sizes of 400–1800 µm and 9–56 µm, 486
respectively (Fig. 3a). The former exhibits a power law and the latter a mixed power law–487
exponential distribution with exponents of 0.50 and 0.63, respectively (Fig. 4a). Series #2 488
glasses have bubble sizes from 6–60 µm at 150 MPa Pf (D1#2, Fig. 3b, Table 3) to 15–48 µm 489
at 100 MPa (D2#2, Table 3), both fitted by power law distributions with exponents of 0.49 490
and 2.22, respectively (Fig. 4b). Upon decreasing Pf, bubble sizes become larger (24–175 µm, 491
D8#2, Pf = 25 MPa, Fig. 3b and Table 3), yielding mixed power law–exponential distributions 492
(Fig. 4b). In fact, two types of distributions can be recognized in the charges decompressed to 493
Pf = 50 and 25 MPa: the small to medium sized bubbles can be fitted by an exponential 494
function whereas the larger bubbles are best described by a power law with an exponent of 495
0.78–1.96. Series #3 post-decompression glasses have numerous small bubbles (< 10 µm, Fig. 496

22
3c) at 150 MPa Pf (range: 7–57 µm, D1#3, Table 3). Upon lowering Pf to 25 MPa, the 497
bubbles become a little larger (8–135 µm, D24#3, Table 3), and the maximum is shifted to 498
10–20 µm (Fig. 3c). The BSDs are characterized by both power law and exponential shapes 499
(Fig. 4c). For example, glasses decompressed to Pf = 150 and 50 MPa (D1#3 and D5#3, Fig. 500
4c) are best described by exponential functions, while the three duplicated glasses 501
decompressed to 100 MPa Pf can be described by either power law functions (D2#3 and 502
D18#3, Fig. 4c) or a combination of both (D16#3, Fig. 4c) as the two samples decompressed 503
to 25 MPa Pf (D8#3 and D24#3, Fig. 4c). It is worth noting that two charges with exponential 504
distributions yielded relatively poor fits (Fig. 4c): D1#3 (Pf = 150 MPa, R2 = 0.88) and D24#3 505
(Pf = 25 MPa, R2 = 0.94 for the small-to-medium bubble sizes). 506
507
H2O and CO2 concentrations in post-decompression glasses 508
H2O and CO2 concentrations in post-decompression glasses are presented in Table 5 and 509
shown in Fig. 5. Series #1 glasses have H2O contents ranging from 4.91 wt% (D3#1, Pf = 200 510
MPa) to 1.52 wt% (D8#1, Pf = 25 MPa). Thus, a general decrease of the concentration of 511
dissolved H2O is observed when decreasing Pf (Fig. 5a). Considering the analytical 512
uncertainties (Fig. 5a, Table 5), the H2O contents of series #1 glasses are in good agreement 513
with H2O solubilities determined by Lesne et al. (2011b), with the exception of two glasses 514
decompressed to Pf = 60 (D22#1) and 50 (D5#1) MPa which have H2O concentrations 515
slightly exceeding solubilities (H2O supersaturations of 0.2–0.35 and 0.3 wt% absolute for 516
D22#1 and D5#1, respectively, Fig. 6). In addition, in these two series #1 charges, H2O 517
concentrations are close to solubilities near the glass-capsule interface and become higher in 518
the core of the glass cylinder (Fig. 6). The fact that the increase of the H2O concentration 519

23
toward the core is more progressive in the charge with the larger diameter (D22#1, 5 mm) is 520
consistent with a mechanism of diffusive motion of H2O inside the melt toward the gas phase. 521
Series #2 post-decompression glasses have H2O concentrations ranging between 2.45 and 522
0.82 wt% and CO2 concentrations ranging from 850 to 550 ppm (Table 5). Both their H2O 523
and CO2 contents progressively decrease with Pf (Fig. 5b). However, the drop in H2O and 524
CO2 concentrations is nonlinear with Pf. For example, the glass decompressed to 50 MPa has 525
a much lower H2O content (0.82 wt%, D5#2) than the glasses decompressed to 25 MPa (1.60 526
wt%, D6#2 and D8#2), and a higher CO2 content (775 ppm) than the two glasses 527
decompressed to 150 (754 ppm, D1#2) and 100 MPa (732 ppm, D2#2). Degassing trajectories 528
in our experiments are different from closed-system equilibrium decompression trends, in that 529
there is a marked drop of H2O content for a comparatively slight CO2 decrease. All post-530
decompression glasses retain elevated CO2 concentrations, since the data points plot well 531
above their respective gas-melt saturation isobars. For example, measured CO2 contents in the 532
glasses decompressed to 25 MPa (550–558 ± 62–76 ppm, D6#2 and D8#2) largely exceed the 533
calculated value (< 50 ppm). 534
Series #3 glasses have H2O contents ranging between 0.69 and 0.95 wt% and CO2 contents 535
ranging from 873 to 461 ppm (Table 5). Post-decompression glass CO2 concentrations 536
progressively decrease from 873 (D1#3, Pf = 150 MPa), 699–540 (D2#3, D16#3 and D18#3, 537
Pf = 100 MPa), 626 (D5#3, Pf = 50 MPa) to 513–461 ppm (D8#3 and D24#3, Pf = 25 MPa), 538
at approximately constant melt H2O contents (Table 5 and Fig. 5c). Taken globally, the data 539
points follow degassing trajectories that are nearly vertical, as are the theoretical equilibrium 540
closed-system decompression paths. However, the decompressed glasses retain CO2 contents 541
that are well above equilibrium values. For example, at Pf = 25 MPa the equilibrium CO2 542
concentration is < 100 ppm while our samples contain 461 ± 80 (D8#3) and 513 ± 94 ppm 543
CO2 (D24#3, Table 5). 544

24
545
Interpretation and discussion of experimental observations 546
547
Supersaturation pressures required for homogeneous bubble nucleation 548
The homogeneous nature of bubble nucleation in our experiments is supported by the lack of 549
crystals to serve as nucleation sites in the melts, and by the near textural homogeneity of our 550
post-decompression glasses, as shown by the quite homogeneous distribution of bubbles in 551
the total volume of the samples. Additional supporting arguments include the little spatial 552
variation of the bubble number density inside the glass and the small dispersion of bubble 553
sizes in a given sample. 554
From our decompression experiments, we can determine the supersaturation pressure required 555
to trigger homogeneous bubble nucleation ΔPHoN, which is defined as the difference between 556
the saturation pressure (Psat = Pin, except in charge D8#1 considered apart) and the final 557
pressure (Pf) at which bubbles begin to form homogeneously. In each post-decompression 558
glass series, we observed a transition from a bubble-free glass core (except for series #2, 559
where we noted the presence of heterogeneously nucleated bubbles at Pf = 200 MPa) at a high 560
Pf to a nucleated glass core at a lower Pf. As previously mentioned, in series #1 post-561
decompression glasses, bubbles are absent at Pf = 200 MPa (D3#1, Table 3 and Fig. 1a). They 562
appear uniformly distributed in the melts from Pf = 150 MPa (D30#1, Table 3), suggesting 563
that homogeneous bubble nucleation takes place between 200 and 150 MPa Pf, hence a ΔPHoN 564
≤ 50 MPa. The series #1 D8#1 sample made from a pre-decompression melt with a low H2O 565
concentration yields a ΔPHoN of 40–45 MPa by taking a Psat of 65–70 MPa (Lesne et al., 566
2011b). Overall a critical supersaturation pressure of 45 MPa maximum is determined for the 567
series #1 melts. This ΔPHoN value is consistent with that found by Le Gall and Pichavant 568

25
(ΔPHoN << 50 MPa, 2016) in their faster decompression rate experiments. This range of 569
ΔPHoN value is less than recorded for more evolved melts (60–150 MPa; Mangan and Sisson, 570
2000; Mourtada-Bonnefoi and Laporte, 2004; Mangan and Sisson, 2005; Iacono-Marziano et 571
al., 2007; Gardner and Ketcham, 2011), reinforcing the idea that bubble nucleation takes place 572
at low supersaturations in hydrous basaltic melts (Le Gall and Pichavant, 2016). 573
The series #2 melts contain a few heterogeneously nucleated bubbles at Pf = 200 MPa (D3#2, 574
Table 3). At Pf = 150 MPa, the D1#2 glass contain small (main peak diameter of 6–7 µm) 575
bubbles. Only 15 bubbles were detected by X-ray CT because their size is hardly higher than 576
the instrumental spatial resolution. Yet, SEM imaging revealed the presence of a population 577
of small (< 6 µm) uniformly distributed bubbles, suggesting that an event of homogenous 578
nucleation takes place between 200 and 150 MPa Pf. Therefore, a ΔPHoN of 50 MPa maximum 579
is inferred for the series #2 melts. This value is less than found for similar compositions in the 580
study of Le Gall and Pichavant (ΔPHoN < 100 MPa, 2016) performed at a faster 581
decompression rate. Pichavant et al. (2013) found a supersaturation pressure of 150 MPa 582
maximum in their experiments performed on compositions similar to our series #2 melts. 583
However, no data were given for Pf > 50 MPa, and so it cannot be excluded that, in their 584
decompression experiments, homogeneous bubble nucleation would start at pressures > 50 585
MPa, leading to ∆PHoN << 150 MPa. 586
Series #3 post-decompression glasses are bubble-free at Pf = 200 MPa (D3#3, Table 3). We 587
observed small (main peak diameter of 8 µm) bubbles in the glass core decompressed to Pf = 588
150 MPa (D1#3, Table 3). The number of bubbles analyzed by X-ray CT is very small (8 589
bubbles) presumably because of their small size. However, they indicate an event of 590
homogenous bubble nucleation between 200 and 150 MPa Pf. From this observation, a ΔPHoN 591
of 50 MPa maximum is also inferred for the series #3 melts. This ΔPHoN value is the same as 592
found for similar compositions in the study of Le Gall and Pichavant (2016) performed at a 593

26
faster decompression rate. For comparison, a critical supersaturation pressure of 200 ± 100 594
MPa was found by Lensky et al. (2006) for CO2 bubbles in a synthetic mafic melt 595
decompressed from 1.5 GPa, larger than determined here for series #2 and #3 melts. 596
However, it is worth specifying that Lensky et al. (2006) worked on nominally H2O-free 597
melts. The range of supersaturations (ΔPHoN ≤ 50 MPa) found in our series #2 and #3 melts is 598
less than recorded for the nucleation of H2O-CO2 bubbles in more evolved melts (160–350 599
MPa, Mourtada-Bonnefoi and Laporte, 2002). 600
Because the range of supersaturation pressures required for homogeneous nucleation is 601
essentially the same (ΔPHoN ≤ 50 MPa) for each glass series, it is difficult from our data to 602
quantify the effects of H2O and CO2 on ΔPHoN, as proposed for melts more evolved than 603
basalts (Mourtada-Bonnefoi and Laporte, 2002; Gardner et al., 2016). In addition, our 604
experimental results confirm previous observations and conclusions on the fact that ΔPHoN 605
values ≤ 50 MPa are specific to basaltic compositions, and that bubble nucleation takes place 606
at low supersaturations in H2O- and H2O-CO2-bearing basaltic melts (Le Gall and Pichavant, 607
2016). 608
Surface tensions (σ) have been calculated (Appendix) by taking the supersaturation pressures 609
determined for each series and our measured experimental nucleation rates. The 610
supersaturation pressures are given as maxima, hence the calculated surface tensions are 611
upper limits. Computations give maximum σ values ranging from 0.054 (series #1) to 0.059 612
N/m (series #2 and #3). For comparison, Le Gall and Pichavant (2016) obtained maximum 613
surfaces tensions of 0.058 (series #1), 0.059 (series #3) and 0.091 (series #2) N/m for the 614
same melt compositions and volatile concentrations. The differences observed (mostly for 615
series #2 melts) are related to differences in supersaturation pressures between the two studies 616
since the decompression rate is not expected to have a significant influence on the bubble 617
nucleation pressure (Mourtada-Bonnefoi and Laporte, 2004). Note that the apparently large 618

27
difference between supersaturation pressures in the two studies (series #2) is probably in part 619
due to the large intervals between our experimental Pf. Le Gall and Pichavant (2016) observed 620
bubbles homogeneously nucleated from 100 MPa (from 150 MPa in this study), but these 621
could have started to form at pressures below than but close to 150 MPa. In the same way, 622
Pichavant et al. (2013) found a σ of 0.18 N/m maximum for compositions as our series #2 623
melts. This maximum is higher than determined here, but again consistent with their higher 624
supersaturation pressures (ΔPHoN < 150 MPa). Surface tensions from this study are lower than 625
the values found by Khitarov et al. (1979): 0.1 to 0.4 N/m for basaltic melts at 1200°C and 626
100–500 MPa, the lowest end of the range corresponding to hydrous compositions. 627
628
Physical mechanisms of degassing and textures 629
In this section, we discuss the physical mechanisms of degassing occurring in our 630
decompression experiments, from nucleation, growth and coalescence of gas bubbles, up to 631
fragmentation. Emphasis is placed on textural differences between the three glass series. 632
Vesicularities. The three series of post-decompression glasses have vesicularities 633
which generally increase upon decompression (i.e., upon decreasing Pf). The general increase 634
in vesicularity observed upon decreasing Pf is consistent with a mechanism of progressive 635
melt vesiculation associated with decompression. It is worth remembering that, for all glass 636
series, the increase in vesicularity is the most strongly marked between Pf = 50 and 25 MPa 637
(Fig. 2a). Nevertheless, the series #2 measured vesicularities are lower than expected for a 638
closed-system degassing. It is also the case of the series #1 glasses decompressed up to 50 639
MPa Pf whose measured vesicularities remain very low (< 3%), well below equilibrium 640
values. It is recalled that the series #1 25 MPa Pf D24#1 charge has a very high vesicularity 641
(71.2%), slightly above the range of vesicularities for Strombolian pumices (47 and 67%, 642

28
Polacci et al., 2006). Apart from that charge, our experimental vesicularities are 643
systematically lower than equilibrium values. This is interpreted to result from the 644
combination of two processes: (i) diffusive volatile loss from the melts and (ii) bubble 645
outgassing. On the one hand, diffusive volatile loss is demonstrated by the H2O concentration 646
profiles in the series #1 60 and 50 MPa Pf samples (Fig. 6). Calculations of diffusion 647
distances for H2O and CO2 using the diffusion coefficients from Zhang and Ni (2010) show 648
that H2O can migrate out of the sample over lengths < 2 mm (for a duration of 4500 s which 649
corresponds to the longest experiments) whereas the mobility of CO2 is much lower. On the 650
other hand, bubble outgassing would account for the reduction in BNDs observed in particular 651
between 100 and 50 MPa (Fig. 2c). However, textures such as bubble accumulation on top of 652
the charges, systematically elongated bubble shapes, and charges totally devoid of bubbles 653
have not been observed. Calculations of the gravity-driven upward movement of the water 654
bubbles have been performed using the Hadamard-Rybcynski bubble velocity equation 655
(Bottinga and Javoy, 1990). In detail, results depend sensitively on the bubble diameter, the 656
gas density and the viscosity of the melt. For series #1 melts, calculated distances are ~2–3 657
mm for bubbles of 60 µm diameter (and ~9–14 mm for bubbles of 120 µm) and ascent 658
durations of 21 min (corresponding to the 100–50 MPa Pf interval), suggesting that 659
outgassing possibly takes place in our experiments and can contribute to the loss of the larger 660
bubbles and the reduction in vesicularity. 661
Nucleation events. The melt vesiculation mechanism observed in our experiments 662
results from different sub-processes that include bubble nucleation, growth, coalescence and 663
outgassing, as well as fragmentation. Textural evidence (bubble size distributions and bubble 664
number densities) can be used to distinguish between single vs. multiple bubble nucleation 665
events (or pulses) in our experiments. In series #1 post-decompression glasses, a large 666
increase of BND is first observed from Pf = 200 (BNDmelt = 0 mm-3) to 150 (BNDmelt = 1325 667

29
mm-3, Table 3, Fig. 2c) MPa, implying that an event of homogeneous bubble nucleation takes 668
place. Then, there is a general decrease of BND with decreasing Pf from 150 to 50 (BNDmelt = 669
1.33 mm-3) MPa. This trend reflects a mechanism of bubble coalescence combined with 670
bubble outgassing. This interpretation is supported by the small number (5) of bubbles in the 671
charge decompressed to 50 MPa (D5#1) and the very low (< 3%) vesicularities measured up 672
to 50 MPa Pf. In addition, textural differences exist between the two charges of different 673
diameter decompressed to Pf = 60 (D22#1) and 50 (D5#1) MPa. The 5 mm diameter charge 674
(D22#1) contains many more bubbles (149), and accordingly has a higher vesicularity (2.1%) 675
than the 2.5 mm diameter charge (5 bubbles and 0.3% vesicularity). This suggests that, with a 676
higher diameter charge, diffusive H2O loss and bubble outgassing from the melt are both 677
limited. Although we do not observe BND stabilization (which would be marked by a 678
horizontal line in Fig. 2c and would reflect the end of a nucleation event), the absence of 679
small (< 10 µm) newly formed bubbles from 100 to 50 MPa Pf testifies to the end of the first 680
nucleation event. This is also suggested by the exponential distributions of bubble sizes from 681
Pf = 100 to 50 MPa (Fig. 4a) which are indicative of an absence of small bubbles. Below 50 682
MPa, an additional increase of BND is observed, suggesting that a second nucleation event 683
takes place between 50 and 25 MPa Pf. This is supported by the small newly formed bubbles 684
in D24#1 as revealed both by X-ray CT and microscopic textural observations (2nd population 685
with main peak diameter 10 µm, Fig. 1c). It is also worth emphasizing that the 4 other charges 686
decompressed to 25 MPa Pf contain a population of small bubbles (Table 4). The mechanism 687
of bubble nucleation observed in series #1 melts is thus discontinuous and restricted to two 688
narrow Pf intervals (200–150 and 50–25 MPa). 689
In series #2 glasses, a general increase of the BND is observed from Pf = 200 (BNDmelt = 1.15 690
mm-3) to 100 (BNDmelt = 104 mm-3, Table 3, Fig. 2c) MPa which corresponds to the 691
beginning of a homogeneous bubble nucleation mechanism. It is worth noting that the early 692

30
event of heterogeneous bubble nucleation observed in charge D3#2 (Pf = 200 MPa) leads to a 693
small number (10) of bubbles and, accordingly, to a low but nonzero BND. Below 100 MPa, 694
we observe a decrease of BND (BNDmelt = 19.2 mm-3, D5#2, Pf = 50 MPa) which is 695
interpreted to reflect a mechanism of bubble coalescence, and possibly bubble outgassing. As 696
a result, the number of bubbles is reduced from 665 (D2#2, Pf = 100 MPa) to 114 (D5#2, Pf = 697
50 MPa). At the same time, bubble sizes give evidence for the appearance of small (< 10 µm) 698
newly formed bubbles, indicating the occurrence of secondary nucleation events. The 699
evolution below 50 MPa and down to 25 MPa Pf is marked by an increase of the BND which 700
is interpreted as the continuation of the same nucleation process. 701
In series #3 melts, an increase of BND is observed from Pf = 200 (BNDmelt = 0 mm-3) to 150 702
MPa (BNDmelt = 4.38 mm-3, Table 3, Fig. 2c) which corresponds to the beginning of a 703
homogeneous bubble nucleation mechanism. Below 150 MPa, three cases were observed, 704
either a continuous increase of the BND (D18#3), a decrease of the BND (D2#3) or a near-705
steady evolution of the BND (D16#3). The first case suggests the continuation of the same 706
nucleation process below 150 MPa. This interpretation is supported by an increase in the 707
number of bubbles from 8 (Pf = 150 MPa, D1#3) to 2042 (Pf = 100 MPa, D18#3), by the 708
appearance of small (main peak size of 6 µm, Table 3) newly formed bubbles and by the 709
power law distribution of the bubble sizes (Fig. 4c) which suggests that small bubbles are 710
continuously appearing. The second case is interpreted to reflect a mechanism of bubble 711
coalescence. However, numerous small (< 5 µm) bubbles could not be measured in D2#3 and, 712
so, its BND is underestimated. The third case corresponds to a BND stabilization which 713
reflects the end of a nucleation event and the beginning of bubble growth and coalescence. In 714
this sense, the BSD of charge D16#3 evolves to a mixed power law–exponential relation 715
which indicates a decrease in the number of small newly formed bubbles and an increase in 716
the number of larger bubbles (Fig. 4c). Below 100 MPa and down to 50 MPa Pf, two new 717

31
situations are possible, either an increase of the BND (continuous bubble nucleation) or a 718
decrease of the BND (bubble coalescence). In any case, the evolution below 50 MPa and 719
down to 25 MPa Pf is marked by an increase of BNDs which is interpreted as the continuation 720
of the same nucleation process and the occurrence of secondary nucleation events. 721
We conclude to a major difference in the mechanism of bubble nucleation between series #1, 722
on the one hand, and series #2 and #3, on the other hand, as observed in the experiments of Le 723
Gall and Pichavant (2016). In H2O-rich melts, two distinct events of bubble nucleation occur 724
in narrow Pf intervals (the first at high pressure and the second at low pressure). In contrast, in 725
CO2-bearing melts, a single mechanism of continuous bubble nucleation takes place over a 726
substantial Pf interval along the decompression path, leading to multiple bubble nucleation 727
events. 728
Bubble coalescence. Textural evidence (decrease of the BND and common 729
coalescence structures) can be used as indicators of bubble coalescence process in our 730
experiments. Common coalescence structures were generally not observed in the three glass 731
series. Therefore, evidence for coalescence mainly comes from decrease of BNDs and bubble 732
numbers and possibly from the increase in bubble sizes. It is worth mentioning that a decrease 733
of BND can also be due to bubble outgassing (see above). The series #1 post-decompression 734
glasses are characterized by a general decrease of the BND from Pf = 150 to 50 MPa (Fig. 735
2c). This decrease is associated with a reduction in the number of bubbles from 8350 (D30#1, 736
Pf = 150 MPa) to 5 (D5#1, Pf = 50 MPa) and with a large increase of the average bubble size 737
(Fig. 2b), suggesting that both bubble growth and coalescence take place in series #1 melts. In 738
fact, a few coalescence structures (dimpling, Castro et al., 2012) were observed in the charge 739
decompressed to Pf = 60 MPa (D22#1). In addition, the evolution of the bubble size 740
distribution from power law to exponential indicates the presence of larger bubbles 741
interpreted to result from coalescence (Figs. 3a and 4a). Therefore, as observed in the 742

32
experiments of Le Gall and Pichavant (2016), bubble coalescence starts very early along the 743
decompression path in series #1 glasses. It is worth mentioning that the charge decompressed 744
to 25 MPa Pf (D24#1) present numerous coalescence structures (dimpling, bending and 745
stretching; Castro et al., 2012; Martel and Iacono-Marziano, 2015; Le Gall and Pichavant, 746
2016) involving particularly large (up to 1.8 mm) bubbles (Fig. 1c) whose shape deviates 747
from spherical. This suggests that the mechanism of bubble coalescence continues below 50 748
MPa and until 25 MPa Pf. 749
In series #2 glasses, the decrease of BND observed between 100 and 50 MPa Pf (Fig. 2c) 750
provides evidence for the occurrence of a bubble coalescence mechanism. In this way, the 751
number of bubbles decreases from 665 (D2#2, Pf = 100 MPa) to 114 (D5#2, Pf = 50 MPa). 752
Increases in the average and the main bubble sizes are, however, hidden by the 753
superimposition of a bubble nucleation process which continuously generates small (< 10 µm) 754
bubbles and contributes to reduce bubble sizes. 755
In series #3 glasses, two decreases of BND are observed, the first between 150 and 100 MPa 756
Pf and the second between 100 and 50 MPa Pf, both interpreted as evidence for coalescence. 757
However, it is worth mentioning that the observed BND evolutions for the different charges at 758
100 and 50 MPa Pf indicate that coalescence is not systematic. We interpret these differences 759
from one charge to the other at a given Pf to reflect variations in distances between bubbles. 760
For example, the average distance between bubbles in charges D2#3 (734 µm) and D16#3 761
(385 µm) is larger than in charge D18#3 (101 µm), all at Pf = 100 MPa. This would make 762
bubble interactions upon further decompression progressively more difficult in charges such 763
as D2#3, D16#3 than in D18#3. 764
We conclude that, in series #2 and #3 glasses, coalescence occurs as bubbles continue to 765
nucleate and the space between neighboring bubbles is sufficiently small. For the three glass 766

33
series, bubble coalescence is the more strongly marked in the same pressure range (between 767
100 and 50 MPa Pf), as observed in faster decompression rate experiments (Le Gall and 768
Pichavant, 2016). 769
Bubble size distributions. Each of the three glass series shows a different evolution 770
of the bubble size distribution (Figs. 3 and 4). With decreasing Pf, the BSD of series #1 771
glasses evolve from a power law (D30#1, Pf = 150 MPa, Figs. 3a and 4a), exponential (D2#1, 772
D22#1 and D5#1, Pf = 100–50 MPa, Fig. 4a) and then to a mixed power law–exponential 773
distribution which is specific of the 25 MPa Pf D24#1 charge. The power law BSD (which 774
was not found in the faster decompression rate experiments, Le Gall and Pichavant, 2016) is 775
interpreted to reflect ongoing bubble nucleation and bubble growth. The fact that the small 776
(volumes < 200 µm3) bubbles are not fitted by the power law, suggests that the nucleation 777
process is close to its end. The exponential distributions are interpreted to indicate a 778
mechanism of bubble coalescence that goes along without further bubble nucleation. The 779
mixed power law–exponential BSD observed at 25 MPa is due to the occurrence of the 780
second bubble nucleation event. The increase in the number of bubbles and sizes when 781
compared to the 50 MPa charge requires either fast bubble growth or a combination of bubble 782
growth and coalescence, possibly promoted by rapid gas expansion between 50 and 25 MPa. 783
Series #2 glasses are characterized by a continuous evolution from a power law (D1#2 and 784
D2#2, Pf = 150 and 100 MPa, Figs. 3b and 4b) to mixed power law–exponential distributions 785
(D5#2, D6#2 and D8#2, Pf = 50 and 25 MPa, Fig. 4b) upon decreasing Pf. This transition is 786
consistent with a mechanism of bubble growth dominated by coalescence, taking place 787
between Pf = 100 and 50 MPa, as well as by a lowering in the bubble nucleation rate. 788
Series #3 glasses are characterized by power law, exponential and mixed power law–789
exponential bubble size distributions (Figs. 3c and 4c). Exponential distributions first were 790

34
not found in series #2 and second appear at different Pf in series #3 samples. We interpret this 791
type of BSD to reflect the pre-dominant influence of bubble growth, bubble nucleation 792
playing a relatively minor role. Bubble coalescence would become more important in the case 793
of mixed power law–exponential distributions. 794
We conclude that power law, exponential and mixed power law–exponential bubble size 795
distributions are observed in all glass series, with the exception of the series #2 glasses which 796
lack exponential BSDs. 797
Fragmentation. A process of magma fragmentation was observed in a total of three 798
series #1 charges decompressed to 25 MPa Pf (Table 4). D19#1 was recovered entirely as a 799
fine (< 500 µm) glass powder and S+D40#1 partially so. D12#1 yielded coarse (< 1.5 mm) 800
glass fragments. Two other 25 MPa Pf series #1 charges were unfragmented but yielded 801
strongly unusual textures (extruded foam for D24#1 and extruded dense block for D27#1). 802
Capsule failure was observed systematically in the series #1 charges decompressed to 25 803
MPa, occurring in four out of the five charges performed under these conditions, despite 804
capsules having lengths up to 5 cm to accommodate gas expansion during decompression. 805
However, capsule failure and fragmentation are not always associated since the capsule of the 806
fragmented D19#1 charge did not fail. When capsules failed, failures were systematically 807
found around the melt cylinders and never in void spaces. Both fragmented and unfragmented 808
charges contain a population of small bubbles (Table 4). Therefore, melt fragmentation in our 809
experiments is intimately associated with the occurrence of the second event of bubble 810
nucleation characterized for charge D24#1. Our experimental observations thus strengthen the 811
proposal (Massol and Koyaguchi, 2005) that late nucleation of gas bubbles in the conduit 812
triggers fragmentation. Although detailed discussion of the fragmentation mechanism is 813
outside the scope of this paper, our observations (presence of small bubbles, capsule failures) 814

35
are consistent with fragmentation being driven by high internal pressures inside the newly 815
formed bubbles (Zhang, 1999; Massol and Koyaguchi, 2005). 816
817
Equilibrium vs. disequilibrium degassing 818
Chemical equilibrium is reached or approached in the H2O-only melts (series #1). On the one 819
hand, glasses decompressed to Pf = 200, 150, 100 and 25 MPa have H2O concentrations in 820
agreement with their respective solubilities, and thus follow an equilibrium degassing trend 821
(Fig. 5a). On the other hand, deviation from equilibrium is encountered in glasses 822
decompressed to Pf = 60 and 50 MPa (D22#1 and D5#1) which have H2O concentrations in 823
excess compared to their respective equilibrium solubilities (Fig. 6). H2O supersaturations of 824
the order of 0.2–0.35 wt% absolute were found in these two glasses. This indicates the 825
possibility of near- or slight non-equilibrium degassing in the H2O-only melts, which would 826
provide the driving force for the nucleation of the second bubble population observed at 25 827
MPa. However, and despite chemical equilibrium being approached, textural equilibrium 828
(defined here as the texture which corresponds to an equilibrium vesicularity, the latter 829
theoretically generated by assuming degassing along the equilibrium vesicularity curves, see 830
Fig. 2a and Le Gall and Pichavant, 2016) is not attained in the series #1 melts which have 831
vesicularities lower than expected from equilibrium degassing (Fig. 2a). This demonstrates 832
that, in order to achieve chemical equilibrium, H2O can be lost diffusively from the melts 833
during decompression, either toward the gas-melt capsule interface, as suggested by the H2O 834
distribution profiles measured in D22#1 and D5#1 charges (Fig. 6), or toward the gas bubbles 835
present inside the glass cylinder. 836
In contrast, disequilibrium degassing occurs systematically in the CO2-bearing melts (series 837
#2 and #3). CO2 is retained within these melts at elevated concentration levels (Fig. 5b, c). In 838
36
parallel, H2O is lost in significant amounts, especially in series #2 glasses. The combination of 839
high melt CO2 concentrations and significant H2O losses generates a disequilibrium degassing 840
trend. Such a deviation from a closed-system equilibrium decompression trend was previously 841
observed in the experiments of Pichavant et al. (2013) and Le Gall and Pichavant (2016) and 842
modelled using a diffusive fractionation mechanism by Yoshimura (2015). For series #2, 843
glass CO2 concentrations are weakly negatively correlated with vesicularities and positively 844
correlated with BNDs. As discussed by Pichavant et al. (2013) and Le Gall and Pichavant 845
(2016), equilibrium degassing in CO2-bearing melts need both numerous and large bubbles, 846
i.e., high vesicularities, which is the case neither in our series #2 nor in our series #3 post-847
decompression glasses. 848
849
Effect of decompression rate on degassing mechanisms 850
Previous experiments on hydrated rhyolites and phonolites (Mangan and Sisson, 2000; 851
Mourtada-Bonnefoi and Laporte, 2004; Iacono-Marziano et al., 2007; Cluzel et al., 2008) 852
have demonstrated strong variations in bubble number density, bubble size and vesicularity 853
with decompression rates, as anticipated on the basis of numerical simulations (Toramaru, 854
1995, 2006). In line with these observations, below we compare our experimental products 855
with those from the experiments of Le Gall and Pichavant (2016) performed at a higher 856
decompression rate of 78 kPa/s (or 3 m/s), under the same conditions and on compositions 857
similar to those in this study. The comparison is focused on the series #2 glasses and it is 858
extended to the experimental products from the experiments of Pichavant et al. (2013) 859
performed at lower decompression rates (17 and 27 kPa/s, or 0.64 and 1.03 m/s) under similar 860
conditions and compositions. 861

37
First, a positive correlation between bubble number density and decompression rate (dP/dt) is 862
generally observed. For a given Pf, the experiments decompressed the most rapidly have the 863
highest BNDs (Fig. 7a). Note that the data points for the two slowest decompression rates (17 864
and 27 kPa/s) are for 1150°C experiments, whereas experiments for the two fastest 865
decompression rates (39 and 78 kPa/s) are performed at 1200°C. The positive correlation 866
between decompression rate and BND results from timescales for bubble growth and 867
coalescence becoming shorter and volatile supersaturations larger when dP/dt is increased. 868
Both effects would promote the nucleation of new bubbles and, so, increase the BNDs. The 869
general positive correlation found in this study is consistent with previous results on rhyolitic 870
systems (e.g., Mourtada-Bonnefoi and Laporte, 2004; Cluzel et al., 2008). However, our 871
experimental results show more variability. For a given decompression rate, no stationary 872
BND value is reached and BND depends in a complex way on Pf (Fig. 2c; Le Gall and 873
Pichavant, 2016) and on the combination between nucleation (marked by 2 events for the 874
CO2-free melts and continuous for the CO2-bearing melts), growth (coalescence) processes 875
and outgassing. Therefore, application of BNDs to infer magma ascent rates (Toramaru, 2006) 876
needs caution in the case of basaltic melts. 877
Average bubble diameters for the series #2 glasses show little variations with dP/dt > 25 878
kPa/s (Fig. 7b). The 25 MPa Pf data points have D slightly negatively correlated with dP/dt 879
whereas the trends for the 50 MPa Pf range from negative to slightly positive. Below 25 880
kPa/s, significant variations in bubble diameters are observed at 1150°C (Fig. 7b). This is 881
interpreted to reflect the predominant role of bubble growth since bubble growth and maybe 882
coalescence would be favored by lowering dP/dt (e.g., Mangan and Sisson, 2000). 883
Vesicularities are constant or generally slightly decrease with decreasing dP/dt (Fig. 7c). 884
These variations reflect the combined influences of the bubble diameter (whose increase 885

38
below 25 kPa/s contributes to a vesicularity increase) and of the BND (whose decrease with 886
decreasing dP/dt contributes to lowering the number of bubbles). 887
Previous works in rhyolitic systems have suggested a very small effect of decompression rate 888
on nucleation pressure (Mourtada-Bonnefoi and Laporte, 2004; Cluzel et al., 2008). In our 889
experiments on basaltic compositions, a significant difference in nucleation pressure is found 890
in the case of our series #2 glasses, ΔPHoN being lower (≤ 50 MPa, this study) at 39 than at 78 891
(< 100 MPa, Le Gall and Pichavant, 2016) kPa/s. This difference in nucleation pressure 892
cannot be attributed to heterogeneous bubble nucleation since D1#2 (Table 3), one of the 893
charges examined by SEM, showed a large population of homogeneously distributed bubbles. 894
It is possible that the higher ΔPHoN measured at 78 kPa/s results from a higher glass CO2 895
concentration (901 ± 104 ppm, Le Gall and Pichavant, 2016) than in D1#2 (818 ± 111 ppm, 896
Table 3). However, as mentioned above, bubbles in the 39 kPa/s charge could have started to 897
nucleate at pressures below than but close to 150 MPa, which would lead to similar 898
supersaturation pressures in the two studies (ΔPHoN ≈ 50 MPa). 899
900
Volcanological implications 901
Comparison between experimental and Strombolian textural parameters 902
Despite the fact that our experimental products do not simulate the last stages of degassing 903
near the surface and post-fragmentation processes, the comparison of bubble textures in our 904
H2O-CO2-bearing melts decompressed at 39 kPa/s (or 1.5 m/s, series #2 from this study) and 905
in Strombolian explosive samples can provide insights on degassing processes occurring in 906
the Stromboli volcanic conduit. The comparison focuses on pumices from paroxysmal 907
explosive activity, as well as on scoriae from normal explosive activity (Polacci et al., 2006, 908
2009) although it is clear that the two systems correspond to two contrasted degassing 909

39
regimes. At Pf = 25 MPa (i.e., at the pressure corresponding to the shallower depth in our 910
experiments), the series #2 charges show a narrow range of bubble sizes ranging from 21–24 911
µm to 175–179 µm (Table 3). For comparison, the pumice samples have a similar minimum 912
bubble size (21–23 µm) but a larger maximum bubble size around 1 mm (Polacci et al., 913
2009). From our results, the smaller bubbles would result from a mechanism of continuous 914
nucleation. The absence of bubbles < 10 µm in pumices suggests that nucleation ended before 915
magma fragmentation. The large bubble sizes in pumices would result from a combination of 916
growth and coalescence processes in the conduit. These large bubbles have spherical to 917
subspherical shapes. Coalescence is limited during paroxysmal activity as shown by the lack 918
of connected bubbles in both our series #2 melts and in pumice samples. In contrast, 919
connected bubbles occur in scoriae in the form of large coalescing bubbles from 0.5 up to 1.2 920
mm (Polacci et al., 2009). 921
The series #2 glasses have vesicularities which extend up to 13.8%, i.e., well below the 922
vesicularities measured in Strombolian eruptive products. For comparison, vesicularities of 923
pumices range from 47 to 67% (Polacci et al., 2006; Fig. 2a) and those of scoriae range 924
between 24 and 78% (Polacci et al., 2006, 2008, 2009). Nevertheless, because a rapid 925
vesicularity increase is observed between 50 and 25 MPa Pf, it is reasonable to expect that 926
vesicularities typical of Strombolian explosive products can be attained by extrapolating the 927
data to Pf << 25 MPa, i.e., by postulating a fragmentation level shallower than ~1 km. 928
Strombolian pumices have bubble number densities (6–9 × 102 mm-3, Polacci et al., 2009; Fig. 929
2c) higher by 0.5 order of magnitude than the series #2 melts at 25 MPa Pf (up to 2 × 102 mm-930
3, Fig. 2c). Nevertheless, the BNDs measured in series #2 are in the same range as the BNDs 931
measured in scoriae (1–4.6 × 102 mm-3, Polacci et al., 2009). It is reminded here that the 932
bubble nucleation process is continuous in our series #2 melts and that CO2-supersaturated 933
melt compositions are obtained at 25 MPa Pf. This suggests the possibility that additional 934

40
bubble nucleation can take place below 25 MPa, which would result in experimental BND 935
becoming closer to the range found in pumices. 936
BSDs in both our series #2 melts and pumice samples (Fig. 4b) can be fitted by mixed power 937
law–exponential distribution, with power law exponents of 1.51 and 1.96 (this study) and up 938
to 1.4 (Polacci et al., 2009). In contrast, the BSDs of scoriae follow power law trends with 939
exponents of 1 ± 0.2 (Bai et al., 2008; Polacci et al., 2009). From our results, the mixed power 940
law–exponential distributions found in Strombolian pumices would be indicative of a system 941
where growth and coalescence are superimposed on a continuous bubble nucleation 942
mechanism, as the system evolves toward equilibrium (compare with Polacci et al., 2009). 943
The power law distributions found in scoriae would also result from a combination of 944
continuous bubble nucleation and coalescence, in agreement with previous interpretation 945
(Polacci et al., 2009). The decrease in the power law exponent between pumices and scoriae 946
reflects the pre-dominant influence of coalescence in the latter. 947
Series #2 melts decompressed between 200 and 25 MPa have CO2 and H2O concentrations 948
both in the range of Stromboli embayments and melt inclusions data (Fig. 8). Series #2 melts 949
from this study and decompressed at a faster rate (Le Gall and Pichavant, 2016) overlap. The 950
agreement between the experimental and analytical data strongly suggests that the natural 951
Stromboli degassing trend is simulated (Pichavant et al., 2013). 952
We conclude that our decompression experiments on series #2 melts either reproduce or 953
approach certain critical aspects of the natural textures (BNDs, bubble sizes, shapes and 954
distributions) and chemistries (residual volatile concentrations) of Stromboli explosive 955
basaltic eruptions. The main differences between experimental and natural products concern 956
the maximum bubble sizes and the vesicularities (both lower in the experiments), but the 957

41
range of natural characteristics is expected to be approached in experiments at Pf below 25 958
MPa. 959
960
Implications for the dynamics of magma ascent at Stromboli volcano 961
Timescales of magma ascent at Stromboli are poorly constrained yet this is critical 962
information for volcanic risk mitigation. On the one hand, slow geophysically derived ascent 963
rates (3 mm/s, Calvari et al., 2011) have been proposed, leading to unrealistically large 964
timescales of magma transport to the surface (~30 days). On the other hand, the petrologic 965
constraints lead to timescales for ascent of volatile-rich magmas at the origin of paroxysms 966
(Bertagnini et al., 2003, Métrich et al., 2005) that are much shorter, of the order of minutes to 967
hours (< 10 h, equivalent to ascent rates > 0.21 m/s). In this context, Polacci et al. (2009) used 968
the experimental data of Baker et al. (2006) and Bai et al. (2008) to suggest timescales from 969
“minutes to hours” for bubble size distributions to evolve from power law to mixed power 970
law–exponential. In our experiments, such a transition was observed to take place at a 971
minimum pressure of 50 MPa both for a decompression rate of 1.5 (this study) and 3 m/s (Le 972
Gall and Pichavant, 2016). This implies that timescales of 32 (3 m/s) to 64 (1.5 m/s) minutes 973
maximum would be needed to start producing mixed power law–exponential BSDs. These 974
texturally based constraints are in the lower range of timescales estimated from petrological 975
studies. 976
Additional constraints are provided by the D and BND data (Fig. 9). The range of natural 977
average bubble sizes and BNDs in Strombolian pumices is bracketed by experiments from 978
this study, Le Gall and Pichavant (2016) and Pichavant et al. (2013). In detail, the 3 m/s 979
experiments on series #2 melts produce BNDs that exceed the natural values. Note, however, 980
that the associated bubble sizes are far too small compared to the natural pumices. Taking 3 981

42
m/s as an upper range of ascent rates, timescales of 43 min for “golden” pumice magma to 982
ascend from their source region at 7–8 km depth to the surface are obtained. The 1.5 m/s 983
experiments do not yield BNDs as high as the natural values, although higher experimental 984
BNDs would be expected for Pf below 25 MPa. Therefore, an ascent rate of 1.5 m/s, 985
corresponding to a timescale of 86 min for “golden” pumice magma ascent, also seems 986
plausible. The 1 m/s experiments produce BNDs very close to the natural range both at 25 and 987
50 MPa Pf. For this decompression rate and below, we observe a decrease of BND with 988
decreasing Pf, interpreted to reflect the pre-dominant influences of bubble growth and 989
coalescence. Below 1 m/s (0.64 m/s), experimental BNDs are lower than natural values. Both 990
the 1 and 0.64 m/s 25 MPa Pf samples are characterized by equilibrium degassing, implying 991
that the driving force for increasing BNDs has been lost. We therefore propose 1 m/s as the 992
lower end of the range of ascent rates at Stromboli, corresponding to ascent timescales of 128 993
min. In conclusion, use of our experimental D-BND systematics enable the ascent rate of the 994
“golden” pumice magma emitted during paroxysms to be constrained between 1 and 3 m/s. 995
996
Conclusions 997
We have performed high pressure and temperature (1200°C) experiments to simulate the 998
ascent and degassing of H2O- and H2O-CO2-bearing basaltic melts from 200 to 25 MPa, at a 999
decompression rate of 1.5 m/s. Pre-decompression melts with three volatile compositions 1000
were investigated: pure H2O (series #1), H2O/CO2 (series #2) and H2O poor/CO2 (series #3). 1001
Experimental products were characterized texturally and chemically and compared with 1002
natural products from Stromboli. The main conclusions are the following: 1003
(1) Bubbles begin to form homogeneously for supersaturation pressures (ΔPHoN) ≤ 50 MPa in 1004
the three series. 1005

43
(2) For series #1 melts, the mechanism of bubble nucleation is discontinuous taking place in 1006
two narrow Pf intervals (200–150 MPa and 50–25 MPa) and leading to two distinct 1007
bubble nucleation events. 1008
(3) For the CO2-bearing melts, the mechanism of bubble nucleation is continuous and takes 1009
place over a substantial Pf interval along the decompression path. This leads to 1010
multiple bubble nucleation events. 1011
(4) Post-nucleation mechanisms, including growth and coalescence, lead to larger bubble 1012
sizes and vesicularities, and lower BNDs. Bubble coalescence is the most strongly 1013
marked between 100 and 50 MPa Pf. 1014
(5) Bubble size distributions in experimental products yield power law, exponential and 1015
mixed power law–exponential patterns. Differences in BSD between melt series and Pf 1016
reflect to different extents the influence of bubble nucleation, growth and coalescence. 1017
(6) Melt fragmentation occurred in a total of three H2O-rich charges decompressed to 25 MPa 1018
Pf and is intimately associated with the occurrence of the second event of bubble 1019
nucleation. 1020
(7) The series #1 melts degas at equilibrium until 100 MPa Pf and show slight 1021
supersaturations at 60 and 50 MPa Pf. Disequilibrium degassing is systematic in the 1022
CO2-bearing melts which are highly CO2-supersaturated. The trend of CO2-rich and 1023
H2O-poor melts recorded in Stromboli natural glasses is reproduced upon 1024
decompression of series #2 melts. 1025
(8) Series #2 decompression textures (BNDs, bubble sizes, shapes and distributions) and 1026
chemistries (residual volatile concentrations) approach certain critical characteristics 1027
of the natural products from Stromboli. 1028

44
(9) Average bubble sizes, BSD and BND data are combined to constrain the timescales of 1029
“golden” pumice magma ascent from their source region. Results range from 43 to 128 1030
min, which emphasizes the short time spans of signals precursory to paroxysms at 1031
Stromboli. 1032
1033
Acknowledgments 1034
This project has been financially supported by the VUELCO (EC FP7) and DEGAZMAG 1035
(ANR 2011 Blanc SIMI 5-6 003-02) projects. Ida Di Carlo is acknowledged for SEM 1036
analyses. Discussions with Don R. Baker, Didier Laporte, Bruno Scaillet, Massimo Pompilio, 1037
Alain Burgisser and Caroline Martel have been helpful. We thank Renat Almeev for the 1038
editorial work, as well as Michael R. Carroll and Didier Laporte for their comments and 1039
suggestions on the manuscript. 1040
1041
References cited 1042
Abràmoff, M.D., Magalhães, P.J., and Ram, S.J. (2004) Image processing with ImageJ. 1043
Biophotonics international, 11, 36–43. 1044
Aiuppa, A., Bertagnini, A., Métrich, N., Moretti, R., Di Muro, A., Liuzzo, M., and 1045
Tamburello, G. (2010a) A model of degassing for Stromboli volcano. Earth and 1046
Planetary Science Letters, 295, 195–204 (DOI:10.1016/j.epsl.2010.03.040). 1047
Aiuppa, A., Burton, M., Caltabiano, T., Giudice, G., Guerrieri, S., Liuzzo, M., Murè, F., and 1048
Salerno, G. (2010b) Unusually large magmatic CO2 gas emissions prior to a basaltic 1049
paroxysm: CO2 gas emissions prior to a paroxysm. Geophysical Research Letters, 37, 1050
L17303 (DOI:10.1029/2010GL043837). 1051

45
Aiuppa, A., Burton, M., Allard, P., Caltabiano, T., Giudice, G., Gurrieri, S., Liuzzo, M., and 1052
Salerno, G. (2011) First observational evidence for the CO2-driven origin of 1053
Stromboli’s major explosions. Solid Earth, 2, 135–142 (DOI:10.5194/se-2-135-2011). 1054
Aiuppa, A., Federico, C., Giudice, G., Giuffrida, G., Guida, R., Gurrieri, S., Liuzzo, M., 1055
Moretti, R., and Papale, P. (2009) The 2007 eruption of Stromboli volcano: Insights 1056
from real-time measurement of the volcanic gas plume CO2/SO2 ratio. Journal of 1057
Volcanology and Geothermal Research, 182, 221–230 1058
(DOI:10.1016/j.jvolgeores.2008.09.013). 1059
Allard, P. (2010) A CO2-rich gas trigger of explosive paroxysms at Stromboli basaltic 1060
volcano, Italy. Journal of Volcanology and Geothermal Research, 189, 363–374 1061
(DOI:10.1016/j.jvolgeores.2009.11.018). 1062
Bai, L., Baker, D.R., and Rivers, M. (2008) Experimental study of bubble growth in 1063
Stromboli basalt melts at 1 atm. Earth and Planetary Science Letters, 267, 533–547 1064
(DOI:10.1016/j.epsl.2007.11.063). 1065
Baker, D.R., Lang, P., Robert, G., Bergevin, J.-F., Allard, E., and Bai, L. (2006) Bubble 1066
growth in slightly supersaturated albite melt at constant pressure. Geochimica et 1067
cosmochimica acta, 70, 1821–1838. 1068
Barberi, F., Rosi, M., and Sodi, A. (1993) Volcanic hazard assessment at Stromboli based on 1069
review of historical data. Acta Vulcanologica, 3, 173–187. 1070
Bertagnini, A., Roberto, A., and Pompilio, M. (2011) Paroxysmal activity at Stromboli: 1071
lessons from the past. Bulletin of Volcanology, 73, 1229–1243 (DOI:10.1007/s00445-1072
011-0470-3). 1073
Bertagnini, A., Métrich, N., Landi, P., and Rosi, M. (2003) Stromboli volcano (Aeolian 1074
Archipelago, Italy): An open window on the deep-feeding system of a steady state 1075
basaltic volcano. Journal of Geophysical Research, 108 (B7), 2336 1076

46
(DOI:10.1029/2002JB002146). 1077
Bertagnini, A., Métrich, N., Francalanci, L., Landi, P., Tommasini, S., and Conticelli, S. 1078
(2008) Volcanology and magma geochemistry of the present-day activity: constraints 1079
on the feeding system. In: Calvari, S., Inguaggiato, S., Puglisi, G., Ripepe, M., Rosi, 1080
M. (eds) Learning from Stromboli. American Geophysical Union, Washington, 1081
Geophysical Monograph, 182, 19–38. 1082
Blower, J.D., Keating, J.P., Mader, H.M., and Phillips, J.C. (2001) Inferring volcanic 1083
degassing processes from vesicle size distributions. Geophysical Research Letters, 28, 1084
347–350. 1085
Blower, J.D., Keating, J.P., Mader, H.M., and Phillips, J.C. (2002) The evolution of bubble 1086
size distributions in volcanic eruptions. Journal of Volcanology and Geothermal 1087
Research, 120, 1–23. 1088
Bottinga, Y., and Javoy, M. (1990) MORB degassing: Bubble growth and ascent. Chemical 1089
Geology, 81, 255–270. 1090
Bourgue, E., and Richet, P. (2001) The effects of dissolved CO2 on the density and viscosity 1091
of silicate melts: a preliminary study. Earth and Planetary Science Letters, 193, 57–68. 1092
Burgisser, A., Alletti, M., and Scaillet, B. (2015) Simulating the behavior of volatiles 1093
belonging to the C–O–H–S system in silicate melts under magmatic conditions with 1094
the software D-Compress. Computers & Geosciences, 79, 1–14. 1095
Burton, M., Allard, P., Mure, F., and La Spina, A. (2007) Magmatic Gas Composition 1096
Reveals the Source Depth of Slug-Driven Strombolian Explosive Activity. Science, 1097
317, 227–230 (DOI:10.1126/science.1141900). 1098
Calvari, S., Spampinato, L., Bonaccorso, A., Oppenheimer, C., Rivalta, E., and Boschi, E. 1099
(2011) Lava effusion–A slow fuse for paroxysms at Stromboli volcano? Earth and 1100
Planetary Science Letters, 301, 317–323. 1101

47
Cashman, K.V., and Sparks, R.S.J. (2013). How volcanoes work: A 25 year perspective. 1102
Geological Society of America Bulletin, 125, 664–690. 1103
Castro, J.M., Burgisser, A., Schipper, C.I., and Mancini, S. (2012) Mechanisms of bubble 1104
coalescence in silicic magmas. Bulletin of volcanology, 74, 2339–2352. 1105
Cluzel, N., Laporte, D., Provost, A., and Kannewischer, I. (2008) Kinetics of heterogeneous 1106
bubble nucleation in rhyolitic melts: implications for the number density of bubbles in 1107
volcanic conduits and for pumice textures. Contributions to Mineralogy and Petrology, 1108
156, 745–763 (DOI:10.1007/s00410-008-0313-1). 1109
Di Carlo, I., Pichavant, M., Rotolo, S.G., and Scaillet, B. (2006). Experimental Crystallization 1110
of a High-K Arc Basalt: the Golden Pumice, Stromboli Volcano (Italy). Journal of 1111
Petrology, 47, 1317–1343 (DOI:10.1093/petrology/egl011). 1112
Dixon, J.E., and Pan, V. (1995) Determination of the molar absorptivity of dissolved 1113
carbonate in basanitic glass. American Mineralogist, 80, 1339–1342. 1114
Dixon, J.E., Stolper, E.M., and Holloway, J.R. (1995). An experimental study of water and 1115
carbon dioxide solubilities in mid-ocean ridge basaltic liquids. Part I: calibration and 1116
solubility models. Journal of Petrology, 36, 1607–1631. 1117
Edmonds, M. (2008) New geochemical insights into volcanic degassing. Philosophical 1118
Transactions of the Royal Society A: Mathematical, Physical and Engineering 1119
Sciences, 366, 4559–4579 (DOI:10.1098/rsta.2008.0185). 1120
Francalanci, L., Manetti, P., and Peccerillo, A. (1989) Volcanological and magmatological 1121
evolution of Stromboli volcano (Aeolian Islands): the roles of fractional 1122
crystallization, magma mixing, crustal contamination and source heterogeneity. 1123
Bulletin of Volcanology, 51, 355–378. 1124
Francalanci, L., Tommasini, S., and Conticelli, S. (2004) The volcanic activity of Stromboli in 1125
the 1906–1998 AD period: mineralogical, geochemical and isotope data relevant to the 1126

48
understanding of the plumbing system. Journal of Volcanology and Geothermal 1127
Research, 131, 179–211 (DOI:10.1016/S0377-0273(03)00362-7). 1128
Francalanci, L., Taylor, S.R., McCulloch, M.T., and Woodhead, J.D. (1993) Geochemical and 1129
isotopic variations in the calc-alkaline rocks of Aeolian arc, southern Tyrrhenian Sea, 1130
Italy: constraints on magma genesis. Contributions to Mineralogy and Petrology, 113, 1131
300–313. 1132
Gaonac’h, H., Stix, J., and Lovejoy, S. (1996) Scaling effects on vesicle shape, size and 1133
heterogeneity of lavas from Mount Etna. Journal of Volcanology and Geothermal 1134
Research, 74, 131–153. 1135
Gardner, J.E., and Ketcham, R.A. (2011) Bubble nucleation in rhyolite and dacite melts: 1136
temperature dependence of surface tension. Contributions to Mineralogy and 1137
Petrology, 162, 929–943 (DOI:10.1007/s00410-011-0632-5). 1138
Gardner, J.E., and Webster, J.D. (2016) The impact of dissolved CO2 on bubble nucleation in 1139
water-poor rhyolite melts. Chemical Geology, 420, 180–185. 1140
Gardner, J.E., Hilton, M., and Carroll, M.R. (1999) Experimental constraints on degassing of 1141
magma: isothermal bubble growth during continuous decompression from high 1142
pressure. Earth and Planetary Science Letters, 168, 201–218. 1143
Gonnermann, H., and Manga, M. (2005) Nonequilibrium magma degassing: Results from 1144
modeling of the ca. 1340 A.D. eruption of Mono Craters, California. Earth and 1145
Planetary Science Letters, 238, 1–16 (DOI:10.1016/j.epsl.2005.07.021). 1146
Gonnermann, H.M., and Manga, M. (2007) The fluid mechanics inside a volcano. Annual 1147
Review of Fluid Mechanics, 39, 321–356. 1148
Hurwitz, S., and Navon, O. (1994) Bubble nucleation in rhyolitic melts: Experiments at high 1149
pressure, temperature, and water content. Earth and Planetary Science Letters, 122, 1150
267–280. 1151
Iacono-Marziano, G., Schmidt, B.C., and Dolfi, D. (2007) Equilibrium and disequilibrium 1152

49
degassing of a phonolitic melt (Vesuvius AD 79 “white pumice”) simulated by 1153
decompression experiments. Journal of Volcanology and Geothermal Research, 161, 1154
151–164 (DOI:10.1016/j.jvolgeores.2006.12.001). 1155
Iacono-Marziano, G., Morizet, Y., Le Trong, E., and Gaillard, F. (2012) New experimental 1156
data and semi-empirical parameterization of H2O–CO2 solubility in mafic melts. 1157
Geochimica et Cosmochimica Acta, 97, 1–23 (DOI:10.1016/j.gca.2012.08.035). 1158
Khitarov, N.I., Lebedev, E.B., Dorfman, A.M., Bagdasarov, N.S., 1979. Effect of 1159
temperature, pressure and volatiles on the surface tension of molten basalt. 1160
Geochemistry International 16, 78–86. 1161
La Spina, A., Burton, M.R., Harig, R., Mure, F., Rusch, P., Jordan, M., and Caltabiano, T. 1162
(2013) New insights into volcanic processes at Stromboli from Cerberus, a remote-1163
controlled open-path FTIR scanner system. Journal of Volcanology and Geothermal 1164
Research, 249, 66–76. 1165
Le Gall, N., and Pichavant, M. (2016) Homogeneous bubble nucleation in H2O- and H2O-1166
CO2-bearing basaltic melts: results of high temperature decompression experiments. 1167
Journal of Volcanology and Geothermal Research, waiting for moderate revision. 1168
Le Gall, N. (2015) Basaltic magma ascent and degassing – Experimental approach, 318 p. 1169
Ph.D. thesis, University of Orléans. 1170
Landi, P., Métrich, N., Bertagnini, A., and Rosi, M. (2004) Dynamics of magma mixing and 1171
degassing recorded in plagioclase at Stromboli (Aeolian Archipelago, Italy). 1172
Contributions to Mineralogy and Petrology, 147, 213–227 (DOI:10.1007/s00410-004-1173
0555-5). 1174
Lange, R.A. (1994) The effect of H2O, CO2, and F on the density and viscosity of silicate 1175
melts. In Mineralogical Society of America Reviews in Mineralogy, 30, 331–369. 1176
Lautze, N.C., and Houghton, B.F. (2007) Linking variable explosion style and magma 1177
50
textures during 2002 at Stromboli volcano, Italy. Bulletin of Volcanology, 69, 445–1178
460. 1179
Lensky, N.G., Niebo, R.W., Holloway, J.R., Lyakhovsky, V., and Navon, O. (2006) Bubble 1180
nucleation as a trigger for xenolith entrapment in mantle melts. Earth and Planetary 1181
Science Letters, 245, 278–288. 1182
Lesne, P., Scaillet, B., Pichavant, M., and Beny, J.-M. (2011a). The carbon dioxide solubility 1183
in alkali basalts: an experimental study. Contributions to Mineralogy and Petrology, 1184
162, 153–168. 1185
Lesne, P., Scaillet, B., Pichavant, M., Iacono-Marziano, G., and Beny, J.-M. (2011b) The H2O 1186
solubility of alkali basaltic melts: an experimental study. Contributions to Mineralogy 1187
and Petrology, 162, 133–151. 1188
Lyakhovsky, V., Hurwitz, S., and Navon, O. (1996) Bubble growth in rhyolitic melts: 1189
experimental and numerical investigation. Bulletin of Volcanology, 58,19–32. 1190
Mangan, M.T., and Cashman, K.V. (1996) The structure of basaltic scoria and reticulite and 1191
inferences for vesiculation, foam formation, and fragmentation in lava fountains. 1192
Journal of Volcanology and Geothermal Research, 73, 1–18. 1193
Mangan, M., and Sisson, T. (2000) Delayed, disequilibrium degassing in rhyolite magma: 1194
decompression experiments and implications for explosive volcanism. Earth and 1195
Planetary Science Letters, 183, 441–455. 1196
Mangan, M., and Sisson, T. (2005) Evolution of melt-vapor surface tension in silicic volcanic 1197
systems: Experiments with hydrous melts. Journal of Geophysical Research, 110, 1198
B01202. 1199
Martel, C., and Iacono-Marziano, G. (2015) Timescales of bubble coalescence, outgassing, 1200
and foam collapse in decompressed rhyolitic melts. Earth and Planetary Science 1201
Letters, 412, 173–185. 1202

51
Massol, H., and Koyaguchi, T. (2005) The effect of magma flow on nucleation of gas bubbles 1203
in a volcanic conduit. Journal of volcanology and geothermal research, 143, 69–88. 1204
Mercalli, G. (1907) Vulcani attivi della Terra. Ulrico Hoepli. 1205
Métrich, N., Bertagnini, A., and Di Muro, A. (2010) Conditions of magma storage, degassing 1206
and ascent at Stromboli: new insights into the volcano plumbing system with 1207
inferences on the eruptive dynamics. Journal of Petrology, 51, 603–626. 1208
Métrich, N., Bertagnini, A., Landi, P., and Rosi, M. (2001) Crystallization driven by 1209
decompression and water loss at Stromboli volcano (Aeolian Islands, Italy). Journal of 1210
Petrology, 42, 1471–1490. 1211
Métrich, N., Allard, P., Spilliaert, N., Andronico, D., and Burton, M. (2004) 2001 flank 1212
eruption of the alkali-and volatile-rich primitive basalt responsible for Mount Etna’s 1213
evolution in the last three decades. Earth and Planetary Science Letters, 228, 1–17. 1214
Métrich, N., Bertagnini, A., Landi, P., Rosi, M., and Belhadj, O. (2005) Triggering 1215
mechanism at the origin of paroxysms at Stromboli (Aeolian Archipelago, Italy): the 5 1216
April 2003 eruption. Geophysical Research Letters, 32, L103056 (DOI:10.1029). 1217
Misiti, V., Vetere, F., Mangiacapra, A., Behrens, H., Cavallo, A., Scarlato, P., and Dingwell, 1218
D.B. (2009) Viscosity of high-K basalt from the 5th April 2003 Stromboli paroxysmal 1219
explosion. Chemical Geology, 260, 278–285. 1220
Mourtada-Bonnefoi, C.C., and Laporte, D. (1999) Experimental study of homogeneous 1221
bubble nucleation in rhyolitic magmas. Geophysical Research Letters, 26, 3505–3508. 1222
Mourtada-Bonnefoi, C.C., and Laporte, D. (2002) Homogeneous bubble nucleation in 1223
rhyolitic magmas: an experimental study of the effect of H2O and CO2. Journal of 1224
Geophysical Research, 107, ECV 2-1–EVC 2-19 (DOI:10.1029/2001JB000290). 1225
Mourtada-Bonnefoi, C.C., and Laporte, D. (2004) Kinetics of bubble nucleation in a rhyolitic 1226
melt: an experimental study of the effect of ascent rate. Earth and Planetary Science 1227
Letters, 218, 521–537. 1228

52
Newman, S., and Lowenstern, J.B. (2002) VolatileCalc: a silicate melt–H2O–CO2 solution 1229
model written in Visual Basic for Excel. Computers & Geosciences, 28, 597–604. 1230
Papale, P., Moretti, R., and Barbato, D. (2006) The compositional dependence of the 1231
saturation surface of H2O+CO2 fluids in silicate melts. Chemical Geology, 229, 78–1232
95. 1233
Pichavant, M., Pompilio, M., D’Oriano, C., and Di Carlo, I. (2011) Petrography, mineralogy 1234
and geochemistry of a primitive pumice from Stromboli: implications for the deep 1235
feeding system. European Journal of Mineralogy, 23, 499–517. 1236
Pichavant, M., Di Carlo, I., Le Gac, Y., Rotolo, S.G., and Scaillet, B. (2009) Experimental 1237
constraints on the deep magma feeding system at Stromboli volcano, Italy. Journal of 1238
Petrology, 50, 601–624. 1239
Pichavant, M., Di Carlo, I., Rotolo, S.G., Scaillet, B., Burgisser, A., Le Gall, N., and Martel, 1240
C., 2013. Generation of CO2-rich melts during basalt magma ascent and degassing. 1241
Contributions to Mineralogy and Petrology, 166, 545–561. 1242
Polacci, M., Baker, D.R., Bai, L., and Mancini, L. (2008) Large vesicles record pathways of 1243
degassing at basaltic volcanoes. Bulletin of Volcanology, 70, 1023–1029. 1244
Polacci, M., Baker, D.R., Mancini, L., Tromba, G., and Zanini, F. (2006) Three-dimensional 1245
investigation of volcanic textures by X-ray microtomography and implications for 1246
conduit processes. Geophysical Research Letters, 33, L13312 1247
(DOI:10.1029/2006GL026241). 1248
Polacci, M., Baker, D.R., Mancini, L., Favretto, S., and Hill, R.J. (2009) Vesiculation in 1249
magmas from Stromboli and implications for normal Strombolian activity and 1250
paroxysmal explosions in basaltic systems. Journal of Geophysical Research, 114, 1251
B01206 (DOI:10.1029/2008JB005672). 1252
Proussevitch, A.A., Sahagian, D.L., and Tsentalovich, E.P. (2007) Statistical analysis of 1253
53
bubble and crystal size distributions: Formulations and procedures. Journal of 1254
Volcanology and Geothermal Research, 164, 95–111. 1255
Richet, P., Whittington, A., Holtz, F., Behrens, H., Ohlhorst, S., and Wilke, M. (2000) Water 1256
and the density of silicate glasses. Contributions to Mineralogy and Petrology, 138, 1257
337–347. 1258
Ripepe, M., and Harris, A.J. (2008) Dynamics of the 5 April 2003 explosive paroxysm 1259
observed at Stromboli by a near-vent thermal, seismic and infrasonic array. 1260
Geophysical Research Letters, 35, L07306 (DOI:10.1029/2007GL032533). 1261
Rosi, M., Bertagnini, A., and Landi, P. (2000) Onset of the persistent activity at Stromboli 1262
volcano (Italy). Bulletin of Volcanology, 62, 294–300. 1263
Rosi, M., Pistolesi, M., Bertagnini, A., Landi, P., Pompilio, M., and Di Roberto, A. (2013) 1264
Stromboli volcano, Aeolian Islands (Italy): present eruptive activity and hazards. 1265
Geological Society, London, Memoirs 37, 473–490. 1266
Scaillet, B., Pichavant, M., Roux, J., Humbert, G., and Lefèvre, A. (1992) Improvements of 1267
the Shaw membrane technique for measurement and control of fH2 at high 1268
temperatures and pressures. American Mineralogist, 77, 647–655. 1269
Shishkina, T.A., Botcharnikov, R.E., Holtz, F., Almeev, R.R., and Portnyagin, M.V. (2010) 1270
Solubility of H2O-and CO2-bearing fluids in tholeiitic basalts at pressures up to 1271
500MPa. Chemical Geology, 277, 115–125. 1272
Sparks, R.S.J. (2003) Dynamics of magma degassing. Geological Society, London, Special 1273
Publications, 213, 5–22. 1274
Taylor, J.R., Wall, V.J., and Pownceby, M.I. (1992) The calibration and application of 1275
accurate redox sensors. American Mineralogist, 77, 284–295. 1276
Toramaru, A. (1995) Numerical study of nucleation and growth of bubbles in viscous 1277
magmas. Journal of Geophysical Research, 100, 1913–1931. 1278

54
Toramaru, A. (2006) BND (bubble number density) decompression rate meter for explosive 1279
volcanic eruptions. Journal of Volcanology and Geothermal Research, 154, 303–316. 1280
Vetere, F., Behrens, H., Misiti, V., Ventura, G., Holtz, F., De Rosa, R., and Deubener, J. 1281
(2007) The viscosity of shoshonitic melts (Vulcanello Peninsula, Aeolian Islands, 1282
Italy): insight on the magma ascent in dikes. Chemical Geology, 245, 89–102. 1283
Woods, A.W., and Koyaguchi, T. (1994) Transitions between explosive and effusive 1284
eruptions of silicic magmas. Nature 370, 641–644. 1285
Yoshimura, S. (2015) Diffusive fractionation of H2O and CO2 during magma degassing. 1286
Chemical Geology, 411, 172–181. 1287
Zhang, Y. (1999) A criterion for the fragmentation of bubbly magma based on brittle failure 1288
theory. Nature, 402, 648–650. 1289
Zhang, Y., and Ni, H. (2010) Diffusion of H, C, and O components in silicate melts. Reviews 1290
in Mineralogy and Geochemistry, 72, 171–225. 1291
1292
Figure captions 1293
Figure 1. Representative types of textures of post-decompression glass samples. (a) 1294
Tomographic slice of sample D3#1 quenched at Pf = Pin = 200 MPa, showing a 1295
bubble-free core and a thin (< 50 µm) bubbly rim indicated by black arrows. (b) 1296
Tomographic slice of sample D24#3 decompressed to 25 MPa Pf, showing three 1297
distinct zones: (1) a thick (150–200 µm) bubbly rim indicated by a black arrow, (2) a 1298
bubble-free zone depleted in volatiles delimited by a double black arrow and (3) a core 1299
with numerous nearly homogeneously distributed bubbles. (c) Tomographic slice of 1300
sample D24#1 decompressed to 25 MPa Pf, characterized by two distinct bubble 1301
populations. The inset gives a close-up view of the small bubbles which correspond to 1302

55
the second bubble population. See Table 3 for details about the experimental 1303
conditions and textural results. 1304
Figure 2. (a) Vesicularity V, (b) average bubble diameter D and (c) bubble number density 1305
per unit volume of melt BNDmelt plotted as a function of final pressure Pf for the post-1306
decompression glasses of this study. Experimental data in Tables 3. The three glass 1307
series are distinguished, series #1: black circles; series #2; gray circles; series #3: 1308
white circles. The series #1 charge D8#1 is plotted with a different symbol (black 1309
diamond) since it started from a pre-decompression melt with a H2O concentration 1310
~50% lower than all the other series #1 charges. In (a), equilibrium vesicularities 1311
(thick black and gray lines) calculated for pure H2O and CO2 degassing respectively 1312
(see text) are shown for comparison with the experimental data. Both the first and the 1313
second bubble populations of sample D24#1 (Table 3) are plotted in (b) and (c). In (a) 1314
and (b), error bars (standard deviations, Table 3) are indicated on the data points. The 1315
V, D and BNDmelt values for Strombolian pumices (data from Polacci et al., 2006, 1316
2009) are shown for comparison with the experimental data points. 1317
Figure 3. Evolution of the bubble size distribution (BSD) during decompression within each 1318
glass series. (a) Series #1, (b) series #2, (c) series #3 post-decompression glasses. For 1319
each glass series, two post-decompression glass samples are detailed, one 1320
representative of the early and the other of the late stage of the nucleation process. 1321
Note that for series #1 glasses, the D24#1 charge is also detailed. For each post-1322
decompression glass sample, histograms show frequencies (normalized to 100%) of 1323
diameters of individual bubbles in the population (or the two populations for charge 1324
D24#1) using size classes of 10 µm each. The range of bubble diameters of each 1325
population is given in Table 3. The number of bubbles within each population is 1326

56
specified (n, Table 3). Details about experimental conditions and other textural data in 1327
Table 3. 1328
Figure 4. Bubble size distributions (BSD) expressed as log-log plots of bubble number 1329
density (BNDmelt, in mm-3) vs. bubble volume for all post-decompression glasses from 1330
this study. For each glass sample, the bubble population is characterized by a range of 1331
bubble size (expressed as diameters in Table 3) and a bubble number density value 1332
(Table 3). Each point along the distribution curve corresponds to the number of 1333
bubbles with a volume strictly larger than indicated. (a) Series #1 glasses, (b) series #2 1334
glasses and (c) series #3 glasses. Rectangles: glasses decompressed to 150 MPa Pf 1335
(final pressure); triangles: glasses decompressed to 100 MPa Pf; crosses: glass 1336
decompressed to 60 MPa Pf; squares: glasses decompressed to 50 MPa Pf; diamonds: 1337
glasses decompressed to 25 MPa Pf. The inset in (a) shows the bubble size 1338
distributions of the two bubble populations in charge D24#1. The blue continuous 1339
lines are power law fits and the red continuous curves are exponential fits, both 1340
regressed with Excel software. α is the power law exponent. The bubble volume 1341
distribution (black continuous line and curve) of a pumice sample from Polacci et al. 1342
(2009, Str50403 from a paroxysmal explosion at Stromboli) is given in (b) for 1343
comparison with the experimental BSDs. 1344
Figure 5. H2O and CO2 concentrations in pre- and post-decompression glasses. (a) Plot of 1345
series #1 H2O concentrations as a function of final pressure Pf. H2O solubilities are 1346
computed using the Lesne et al. (2011b) regression equation. They define the closed-1347
system equilibrium decompression path (black continuous line). H2O vs. CO2 1348
concentrations in series #2 and #3 glasses are shown in (b) and (c) respectively. 1349
Circles: pre-decompression glasses synthesized at 200 MPa Pin (initial pressure); 1350
crosses: glasses decompressed to 200 MPa Pf (final pressure); rectangles: glasses 1351

57
decompressed to 150 MPa Pf; triangles: glasses decompressed to 100 MPa Pf; squares: 1352
glasses decompressed to 50 MPa Pf; diamonds: glasses decompressed to 25 MPa Pf. In 1353
(b) the symbol color refers to the synthesis experiments, either S3 (black), S6 (gray) or 1354
S4 (white, Table 2). Error bars (standard deviations, Table 5) are indicated on the data 1355
points. The thin continuous lines are fluid-melt equilibrium saturation isobars (25–250 1356
MPa) and the dashed curves are equilibrium decompression paths calculated for some 1357
series #2 and series #3 glasses assuming closed-system behavior. Equilibrium fluid-1358
melt calculations were performed with VolatileCalc (Newman and Lowenstern, 2002). 1359
Figure 6. FTIR profiles of H2O concentrations across the cylinder starting from the sample 1360
edge toward the core for series #1 glasses decompressed to different Pf from 150 to 25 1361
MPa (note that the 25 MPa data points are for the D8#1 charge performed with a low 1362
H2O concentration pre-decompression melt). The 150, 100, 50 and 25 MPa Pf 1363
cylinders have diameters ~2.5 mm; the 60 MPa Pf cylinder has a diameter of ~5 mm. 1364
Average H2O concentration data are given in Table 5. H2O solubilities (at pressures of 1365
150–25 MPa, dashed horizontal lines) come from Lesne et al. (2011b). 1366
Figure 7. (a) Bubble number density per unit volume of melt BNDmelt, (b) average bubble 1367
diameter D and (c) vesicularity V plotted as a function of decompression rate for the 1368
series #2 glasses. Textural data from this study (dP/dt = 39 kPa/s, Table 3) are 1369
compared with data from Le Gall and Pichavant (2016a, dP/dt = 78 kPa/s) and from 1370
Pichavant et al. (2013, dP/dt = 17 and 27 kPa/s). The BND, D and V values for 1371
Strombolian pumices (data come from Polacci et al., 2006, 2009) are shown for 1372
comparison. The gray continuous lines are Pf isobars drawn for Pf = 100, 50 and 25 1373
MPa. 1374

58
Figure 8. H2O and CO2 contents in natural glasses from Stromboli (data from Métrich et al., 1375
2010) and comparison with experimental series #2 glasses from this study (39 kPa/s, 1376
Table 5) and from Le Gall and Pichavant (2016a, 78 kPa/s). Stromboli glasses plotted 1377
include melt inclusions (MI) and embayments (Emb.) from pumices and scoriae. 1378
Experimental glasses include pre- (circles) and post-decompression glasses (squares). 1379
The closed system equilibrium degassing trend (dashed curve) is calculated using 1380
VolatileCalc (Newman and Lowenstern, 2002). 1381
Figure 9. Comparison between textural parameters for natural (Stromboli basaltic pumices) 1382
and experimental samples decompressed at various ascent rates. Source of data: 1383
natural samples, Polacci et al. (2006, 2009); experimental samples, this study (series 1384
#2 glasses, 1.5 m/s, circles, Table 3), Le Gall and Pichavant (2016a, 3 m/s, crosses), 1385
Pichavant et al. (2013, 0.64 and 1 m/s, squares and triangles, respectively). Average 1386
bubble diameters D are plotted as a function of bubble number densities BNDs. The 1387
arrows indicate the direction of evolution of the textural parameters from 50 (gray 1388
symbols) to 25 MPa Pf (black symbols). Notice that for ascent rates of 1.5 and 3 m/s, 1389
the evolution is positive (D increases along with BND from 50 to 25 MPa) whereas for 1390
ascent rates < 1.5 m/s the evolution is negative. The arrow with a question mark 1391
extending the 1.5 m/s trend illustrates the possible evolution of textural parameters at 1392
Pf below 25 MPa. The respective influences of the different possible degassing 1393
mechanisms (bubble nucleation, growth, coalescence and outgassing) on textural 1394
parameters are indicated. Ascent rates of 1, 1.5 and 3 m/s yield experimental samples 1395
with bubble sizes lower than in Strombolian pumices. However, for the 1.5 and 3 m/s 1396
data points further evolution (either bubble nucleation, growth and coalescence, or 1397
their combination) below 25 MPa Pf would make it possible to approach the textural 1398
characteristics of the pumices. In contrast, volatile supersaturation is absent in both the 1399

59
1 and 0.64 m/s 25 MPa Pf samples, and so there is no longer a driving force for further 1400
nucleation and BND to reach the natural values. In addition, the 0.64 m/s 25 MPa Pf 1401
charges have bubble sizes higher than in Strombolian pumices. Consequently, ascent 1402
rates > 1 m/s are necessary to approach the characteristics of the Strombolian pumices. 1403
1404
Appendix 1405
Surface tensions (σ) have been calculated from our experimentally-determined 1406
supersaturation pressures (∆PHoN) and nucleation rates (J) computed from our measured 1407
bubble number densities and decompression timescales. Strictly speaking our calculations 1408
consider only water as the sole dissolved volatile and, so, are applicable only to series #1 1409
melts. The expression of the critical degree of supersaturation ∆PHoN is given by (e.g., 1410
Hurwitz and Navon, 1994, Mourtada-Bonnefoi and Laporte, 2002): 1411
∆PHoN = 16 · π · σ3
3 · k · T · ln ( JJ0
) 1412
where k is the Boltzmann constant (1.38.10-23 J.K-1), T is the temperature (in K) and J0 is the 1413
preexponential nucleation rate (in m-3.s-1). 1414
The parameter J0 which is given by (e.g., Mourtada-Bonnefoi and Laporte, 2004): 1415
J0 = ( 2 · ΩL · n0
2 · D )a0 · ( σ
k · T )12
1416
where ΩL is the volume of water molecules in the liquid (ΩL = 3 × 10-29 m3), n0 is the number 1417
of water molecules per unit volume of liquid, a0 is the mean distance between water 1418
molecules (a0 ≈ n0-1/3) and D is the water diffusivity in the liquid, has been estimated. D is 1419

60
taken from the equation of Zhang and Ni (2010) which takes into consideration the effects of 1420
H2O content and temperature. n0 is defined as 6.02 × 10²³ · Xm · ρliq / M, where 6.02 × 10²³ is 1421
the Avogadro number, Xm is the mass fraction of molecular water in the liquid, ρliq is the 1422
liquid density (2650 kg/m3), and M is the molar mass of water (0.018 kg/mol). ΩL and Xm 1423
parameters are poorly constrained in basalt melts and we have used the values given by 1424
Mourtada-Bonnefoi and Laporte (2004), determined for rhyolitic liquids. Checks were 1425
performed to evaluate their influence on the calculated results and found to be small (< 0.001 1426
N/m). In the same way, the choice of the D equation leads to very small (< 0.001 N/m) 1427
differences in σ. 1428

61
Table 1. Composition of PST-9 golden pumice and starting glass 1429
Label PST-9a Glassb (n = 54) SiO2 49.4 50.9 (3)c TiO2 0.79 0.81 (8) Al2O3 15.75 15.99 (28) Fe2O3 1.3 nd FeO 6.5 7.7 (6)d MnO 0.15 0.16 (8) MgO 7.96 7.21 (41) CaO 12.73 12.34 (24) Na2O 2.27 2.39 (9) K2O 1.85 1.90 (12) P2O5 0.43 0.55 (17) Cr2O3 – 0.03 (4) NiO – 0.05 (6) Total 99.1 97.4 (10) Notes: Oxides are in wt%. 1430 a Whole-rock analysis performed at CRPG, Nancy, France (from Di Carlo et al., 2006). 1431 b Electron microprobe analysis (normalized to 100%) of PST-9 glass (from Le Gall and 1432 Pichavant, 2016), n: number of analyses. 1433 c One standard deviation in terms of last digit. 1434 d Total Fe as FeO. 1435 nd: not determined. 1436
1437

62
Table 2. Synthesis experiments
Run XH2Oin T (°C) P (MPa) t (min) H2O glass (wt%) CO2 glass (ppm) Volatile: H2O (#1) S3#1 1 1200 202.2 2793 4.91 (3) 0 (0) S4#1 1 1200 203.1 2509 4.93 (5) 0 (0) S5#1 1 1200 202.8 2985 4.94 (4) 0 (0) S6#1 1 1200 202.2 2760 4.90 (1) 0 (0) S8#1 1 1200 203.8 4198 2.53 (5) 0 (0) S11#1 1 1200 202.1 2900 4.90 (3) 0 (0) S14#1 1 1200 201.9 1465 4.91 (1) 0 (0) S16#1 1 1200 201.8 2873 4.90 (2) 0 (0) Volatile: H2O+CO2 (#2) S3#2 0.25 1200 202.2 2793 1.95 (1) 818 (111) S4#2 0.55 1200 203.1 2509 *0.58 (1) 864 (17) S6#2 0.56 1200 202.2 2760 2.37 (1) 1011 (106) Volatile: H2O+CO2 (#3) S3#3 0 1200 202.2 2793 1.12 (1) 840 (92) S4#3 0 1200 203.1 2509 0.71 (1) 860 (78) S5#3 0 1200 202.8 2985 0.84 (4) 1063 (109) S6#3 0 1200 202.2 2760 0.80 (3) 852 (57) S8#3 0 1200 203.8 4198 0.79 (1) 1094 (56) S13#3 0 1200 201.5 2878 1.09 (3) 923 (132) Notes: S11 synthesis from Le Gall (2015) XH2Oin = initial molar H2O / (H2O + CO2) in the charge. T: run temperature; P: run pressure; t: duration of the synthesis experiment. *~ 2.50 wt% H2O (see text for explanations). 1438

63
Table 3. Decompression experiments: run conditions and textural information
Sample Starting glass
Pin (MPa)
Pf (MPa)
tramp (s)
|dP/dt|(kPa/s)
Bubble 3D characteristics
n pk. size (µm)
range (µm) D (µm) BNDa (mm-3)
BNDmeltb
(mm-3)S (µm)
Vc (vol%)
Vd (vol%) VEqui. H2O (vol%)
VEqui. CO2 (vol%)
Volatile: H2O (#1) D3#1 S5#1 200 200 0 39 0 0 (0)g 0.00 0.00 0.00 0.00 (0) 0.00 D30#1 S16#1 200 150 1284 39 8350 6 446 8 (3) 1324 1325 56 0.06 0.05 (0) 9.22 D2#1 S3#1 200 99.8 2568 39 42 29 9120 58 (28) 7.97 7.98 310 0.14 0.28 (0.1) 24.1 D22#1 S14#1 200 60 3649 39 149 15266 121 (67) 2.51 2.52 456 0.45 2.10 (1.5) 44.3 D5#1 S4#1 200 50 3840 39 5 40200 113 (58) 1.33 1.33 564 0.17 0.31 (0.3) 51.0 D8#1 S8#1 200 25 4488 39 567 27 773 28 (11) 397 400 84 0.64 1.45 (0.2) 72.5 D19#1 S6#1 200 25 4488 39 nd nd nd nd nd nd nd nd nd 72.5 D24#1e S11#1 200 25 4488 39 > 28 nd 4001800 741 0.65 0.76 680 0.00 71.2 (1.8) 72.5 D24#1f S11#1 200 25 4488 39 58 10 956 17 (10) 6.89 6.89 326 0.00 71.2 (1.8) 72.5 Volatile: H2O+CO2 (#2) D3#2 S4#2 200 200 0 39 10 19 6141 40 (43) 1.15 1.15 592 0.02 0.05 (0) 0.00 0.00 D1#2 S3#2 200 149.9 1284 39 15 67 660 13 (14) 1.95 1.95 497 0.00 0.01 (0) 9.22 0.17 D2#2 S3#2 200 99.8 2568 39 665 15 1548 19 (4) 104 105 132 0.04 0.10 (0) 24.1 0.47 D5#2 S4#2 200 50 3840 39 114 15 673 17 (11) 19.2 19.2 232 0.01 0.04 (0) 51.0 1.48 D6#2 S6#2 200 25 4488 39 179 53 21179 69 (33) 152 159 115 4.70 12.6 (2.7) 72.5 3.47 D8#2 S6#2 200 25 4488 39 171 61, 97 24175 74 (28) 186 198 107 5.82 13.8 (2) 72.5 3.47 Volatile: H2O+CO2 (#3) D3#3 S4#3 200 200 0 39 0 0 (0) 0.00 0.00 0.00 0.00 (0) 0.00 0.00 D1#3 S3#3 200 149.9 1284 39 8 8 757 15 (17) 4.38 4.38 379 0.01 0.00 (0) 9.22 0.17 D2#3 S3#3 200 99.8 2568 39 5 5 58 6 (4) 0.60 0.60 734 0.00 0.04 (0) 24.1 0.47 D16#3 S6#3 200 100 2568 39 27 13 839 17 (7) 4.18 4.18 385 0.00 0.02 (0) 24.1 0.47 D18#3 S13#3 200 100 2568 39 2042 6 628 7 (2) 231 231 101 0.01 0.01 (0) 24.1 0.47 D5#3 S5#3 200 50 3840 39 270 13 731 16 (6) 25.1 25.1 212 0.01 0.01 (0) 51.0 1.48

64
D8#3 S8#3 200 25 4488 39 4029 9 759 16 (7) 3183 3220 42 1.15 3.87 (1.1) 72.5 3.47 D24#3 S13#3 200 25 4488 39 91765 12 8135 18 (9) 9016 9549 29 5.59 9.65 (0.3) 72.5 3.47 Notes: Pin (initial pressure): pressure at the beginning of decompression ramp; Pf (final pressure): pressure at which the experiment was quenched; tramp: duration of the ramp; |dP/dt|: decompression/ascent rate (=106(Pin-Pf)/(gdtramp)), with g = 9.81 m/s2 and d = 2650 kg/m3 (d: average density of crustal rocks). nd: not determined 1439 X-ray microtomographic data acquired on entire charges (except Vd). n: number of bubbles counted in the analyzed volume. pk. size: main peak diameter in bubble size distribution histograms. range: total range of bubble diameters. D: average bubble diameter. a BND: bubble number density expressed in number of bubbles per mm3 of the total sample (glass + bubbles). b BNDmelt: bubble number density per melt volume (without bubbles, following Proussevitch et al., 2007). S: average spacing between bubbles calculated from BNDmelt (S = (3/4πBNDmelt)1/3; Lyakhovsky et al., 1996; Baker et al., 2006). c V: vesicularity (volume fraction of bubbles, vol%) measured from the total sample. 1440 d V: vesicularity measured from representative sub-volumes. 1441 e Textural data on the first bubble population of D24#1 charge. 1442 f Textural data on the second bubble population of D24#1 charge. 1443 g Standard deviation. 1444 VEqui.H2O and VEqui.CO2: equilibrium vesicularities computed for the PST-9 composition considering the degassing of pure H2O and pure CO2, 1445 respectively (see text for details). 1446 1447
1448

65
Table 4. Texture range of the 25 MPa Pf series #1 charges
Charge PST-9 starting material
Capsule length (cm)
Capsule after experiment Glass after experiment Bubble texture Interpretation capsule Interpretation charge
Bubbles (vol%)
D12#1 Cylinder 3.5 Swollen around sample, weight gain, perforated around sample
Large blocks inside and outside the capsule
Bubbles (< 2– > 100 µm)
Sample causes capsule failure
Coarsely fragmented
nd
D19#1 Cylinder 4 Unswollen, no weight change, unperforated
Glass powder inside the capsule
Bubbles (< 4 – > 200 µm)
No capsule failure Finely fragmented
nd
D24#1 Cylinder 4 Entirely swollen, weight gain, perforated around sample
Foam leaked outside the capsule (3–4 mm diameter)
Highly vesicular
Sample causes capsule failure
Unfragmented 71.2
D27#1 Cylinder 5 Unswollen, weight ?, perforated around sample
Dense block flown outside the capsule
Bubbles (< 11 – 46 µm)
Sample causes capsule failure
Unfragmented 0.00
S+D40#1 Powder 4.5 Swollen around sample, weight gain Foam and powder inside the capsule
Highly vesicular, slug
Sample causes capsule failure
Partially fragmented
High
Notes: Experimental conditions: T = 1200°C; Pin = 200 MPa; Pf = 25 MPa; tramp = 4488 s; |dP/dt| = 39 kPa/s. nd: not determined.
1449

66
Table 5. FTIR data
Glass na Thickness (µm) Absorbance 3530 cm-1 H2O (wt%) Absorbance 1515 cm-1 CO2 (ppm) Synthesis experiments Volatile: H2O (#1) S3#1 4 37 (2)b 1.697 (92) 4.91 (3) S4#1 4 38 (3) 1.776 (155) 4.93 (5) S5#1 5 22 (2) 1.038 (86) 4.94 (4) S6#1 5 37 (1) 1.707 (46) 4.90 (1) S8#1 8 21 (3) 0.512 (76) 2.53 (5) S14#1 10 31 (1) 1.437 (61) 4.91 (1) S16#1 7 31 (5) 1.429 (225) 4.90 (2) Volatile: H2O+CO2 (#2) S3#2 5 65 (7) 1.209 (142) 1.95 (1) 0.123 (28) 818 (111) S4#2 7 161 (2) 0.913 (23) *0.58 (1) 0.316 (5) 864 (17) S6#2 5 31 (1) 0.698 (34) 2.37 (1) 0.070 (9) 1011 (106)Volatile: H2O+CO2 (#3) S3#3 5 33 (4) 0.351 (45) 1.12 (1) 0.065 (8) 840 (92) S4#3 5 149 (1) 1.022 (23) 0.71 (1) 0.289 (26) 860 (78) S5#3 10 34 (3) 0.274 (38) 0.84 (4) 0.082 (15) 1063 (109)S6#3 7 149 (1) 1.147 (48) 0.80 (3) 0.287 (18) 852 (57) S8#3 8 128 (11) 0.975 (84) 0.79 (1) 0.317 (39) 1094 (56) S13#3 8 111 (5) 1.168 (75) 1.09 (3) 0.129 (21) 923 (132) Decompression experiments Volatile: H2O (#1) D3#1 4 38 (6) 1.738 (276) 4.91 (2) D30#1 14 18 (3) 0.718 (121) 4.23 (7) D2#1 6 41 (4) 1.294 (136) 3.31 (5) D22#1 17 59 (6) 1.534 (130) 2.72 (19)
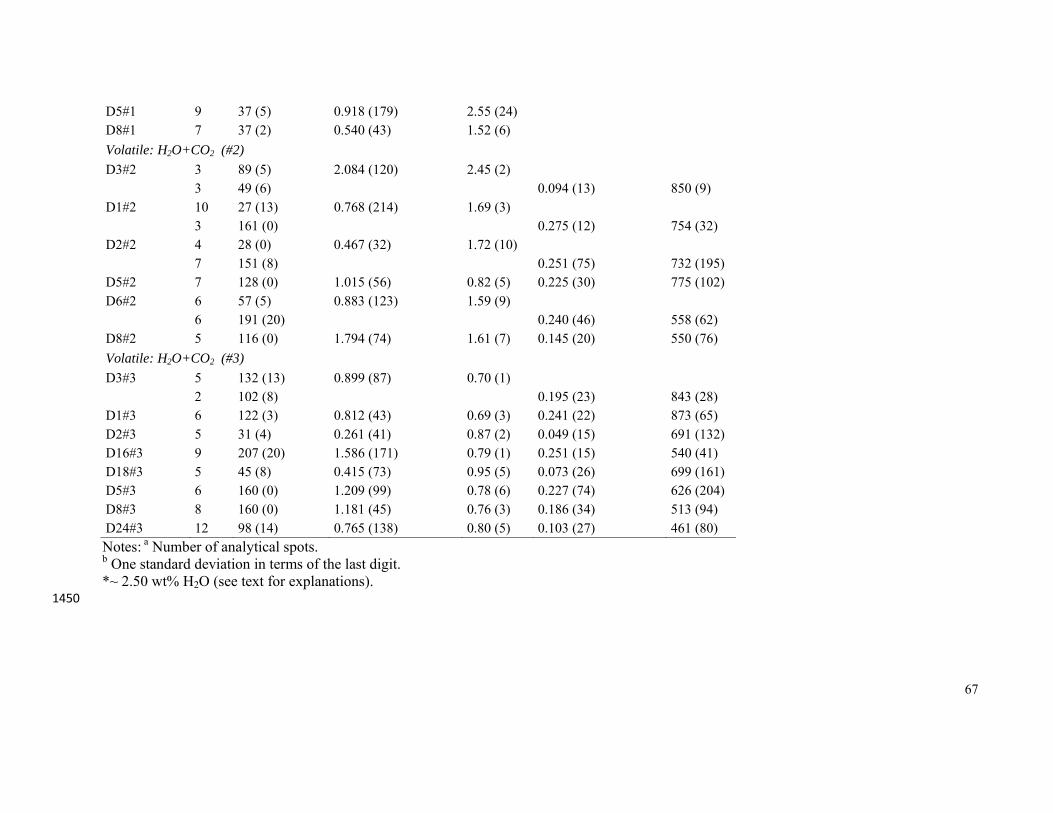
67
D5#1 9 37 (5) 0.918 (179) 2.55 (24) D8#1 7 37 (2) 0.540 (43) 1.52 (6) Volatile: H2O+CO2 (#2) D3#2 3 89 (5) 2.084 (120) 2.45 (2)
3 49 (6) 0.094 (13) 850 (9) D1#2 10 27 (13) 0.768 (214) 1.69 (3)
3 161 (0) 0.275 (12) 754 (32) D2#2 4 28 (0) 0.467 (32) 1.72 (10)
7 151 (8) 0.251 (75) 732 (195) D5#2 7 128 (0) 1.015 (56) 0.82 (5) 0.225 (30) 775 (102) D6#2 6 57 (5) 0.883 (123) 1.59 (9)
6 191 (20) 0.240 (46) 558 (62) D8#2 5 116 (0) 1.794 (74) 1.61 (7) 0.145 (20) 550 (76) Volatile: H2O+CO2 (#3) D3#3 5 132 (13) 0.899 (87) 0.70 (1)
2 102 (8) 0.195 (23) 843 (28) D1#3 6 122 (3) 0.812 (43) 0.69 (3) 0.241 (22) 873 (65) D2#3 5 31 (4) 0.261 (41) 0.87 (2) 0.049 (15) 691 (132) D16#3 9 207 (20) 1.586 (171) 0.79 (1) 0.251 (15) 540 (41) D18#3 5 45 (8) 0.415 (73) 0.95 (5) 0.073 (26) 699 (161) D5#3 6 160 (0) 1.209 (99) 0.78 (6) 0.227 (74) 626 (204) D8#3 8 160 (0) 1.181 (45) 0.76 (3) 0.186 (34) 513 (94) D24#3 12 98 (14) 0.765 (138) 0.80 (5) 0.103 (27) 461 (80) Notes: a Number of analytical spots. b One standard deviation in terms of the last digit. *~ 2.50 wt% H2O (see text for explanations). 1450

Le Gall and Pichavant. Fig. 1
300 µm
a
Pf = 200 MPa D3#1
250 µm
b
Pf = 25 MPa D24#3
(1)
(2)
(3)
c
Pf = 25 MPa D24#1
400 µm
2nd bubble population
1st bubble population

Le Gall and Pichavant. Fig. 2
0
20
40
60
80
100
0 50 100 150 200
V (v
ol.%
)
Series #1D8#1Series #2Series #3Equi. H2OEqui. CO2
0
40
80
120
160
200
0 50 100 150 200
D (µ
m)
Pf (MPa)
D8#1
Strombolian pumices
a
1E-1
1E+0
1E+1
1E+2
1E+3
1E+4
1E+5
0 50 100 150 200
BN
Dm
elt (
mm
-3)
Pf (MPa)
Strombolian pumices
c
D8#1
D24#1 2nd pop.
D24#1 1st pop.
b
D8#1 D24#1
2nd pop.
D24#1 1st population
Strombolian pumices 1 population
Strombolian pumices

Le Gall and Pichavant. Fig. 3
0
20
40
60
80
100Fr
eque
ncy
(%)
Bubble Diameter (µm)
D30#1_150 MPa (n=8350)D5#1_50 MPa (n=5)D24#1_25 MPa (1st: n>28, 2nd: n=58)
D24#1 1st pop.
400 1800 µm
D24#1 2nd pop.
a. Series #1
0
20
40
60
80
100
Freq
uenc
y (%
)
Bubble Diameter (µm)
D1#2_150 MPa (n=15)D8#2_25 MPa (n=171)
b. Series #2
0
0
20
40
60
80
100
Freq
uenc
y (%
)
Bubble Diameter (µm)
D1#3_150 MPa (n=8)D24#3_25 MPa (n=91765)
40 80
c. Series #3
120 160 200
40 0 80 120 160 200
0 40 80 120 160 200

Le Gall and Pichavant. Fig. 4
1E-2
1E-1
1E+0
1E+1
1E+2
1E+3
1E+4
1E+5
1E+1 1E+2 1E+3 1E+4 1E+5 1E+6 1E+7 1E+8 1E+9
BN
Dm
elt (
mm
-3)
150 MPa 100 MPa 60 MPa50 MPa 25 MPa
a
Series #1
D30#1
D2#1
D22#1 (5 mm) D5#1
D24#1
1E-2
1E-1
1E+0
1E+1
1E+2
1E+3
1E+4
1E+5
1E+1 1E+2 1E+3 1E+4 1E+5 1E+6 1E+7 1E+8 1E+9
BN
Dm
elt (
mm
-3)
Bubble volume (µm3)
150 MPa 100 MPa 50 MPa 25 MPac
Series #3
D24#3
D8#3
D18#3
D2#3
D5#3
D16#3
D1#3
1E-2
1E-1
1E+0
1E+1
1E+2 1E+4 1E+6 1E+8 1E+10
1st pop.2nd pop.
D24#1
D24#1
Pf = 25 MPa
1E-2
1E-1
1E+0
1E+1
1E+2
1E+3
1E+4
1E+5
1E+1 1E+2 1E+3 1E+4 1E+5 1E+6 1E+7 1E+8 1E+9
BN
Dm
elt (
mm
-3)
150 MPa100 MPa50 MPa25 MPaPolacci et al. (2009)
b
Series #2
D8#2
D6#2
D2#2 2.22
D5#2
D1#2
Str50403 1.4

Le Gall and Pichavant. Fig. 5
0
200
400
600
800
1000
1200
1400
0 1 2 3 4 5
ppm
CO
2 diss
olve
d in
gla
ss
wt.% H2O dissolved in glass
S3#2S6#2S4#2Pf = 200 MPaPf = 150 MPaPf = 100 MPaPf = 50 MPaPf = 25 MPa
0
50
100
150
200
0 1 2 3 4 5
P f (M
Pa)
wt.% H2O dissolved in glass
Pre-decompression glassesPost-decompression glassesLesne et al. (2011)
0
200
400
600
800
1000
1200
1400
0 1 2 3 4 5
ppm
CO
2 diss
olve
d in
gla
ss
wt.% H2O dissolved in glass
Pin = 200 MPaPf = 200 MPaPf = 150 MPaPf = 100 MPaPf = 50 MPaPf = 25 MPa
S8#1
D8#1
250 MPa
250 MPa
200
200
150
150
100
100
50
50
25
25
a
Series #1
b
Series #2
Closed-system equilibrium decompression
c
Series #3
Closed-system equilibrium decompression
Closed-system equilibrium decompression

Le Gall and Pichavant. Fig. 6
0
1
2
3
4
5
0 500 1000 1500 2000 2500
wt.%
H2O
diss
olve
d in
gla
ss
Distance from the sample edge (µm)
150 MPa 100 MPa 60 MPa 50 MPa 25 MPa
25
50
Solubility at 150 MPa
60
100

Le Gall and Pichavant. Fig. 7
1E-1
1E+0
1E+1
1E+2
1E+3
1E+4
1E+5
0 25 50 75 100
BN
Dm
elt (
mm
-3)
#2_78 kPa/s#2_39 kPa/sPichavant et al. (2013)_27 kPa/sPichavant et al. (2013)_17 kPa/s
Strombolian pumices
a
0
100
200
300
0 25 50 75 100
D (µ
m)
25
50 MPa
b
Strombolian pumices
0
10
20
30
40
50
60
70
0 25 50 75 100
V (v
ol.%
)
dP/dt (kPa/s)
25
50 MPa
c c
Strombolian pumices

Le Gall and Pichavant. Fig. 8
0
400
800
1200
1600
2000
2400
0 1 2 3 4
CO
2 (p
pm)
H2O (wt.%)
Pumice-MIPumice-Emb.Scoria-MIPre-decompression glassesPost-decompression glasses_39 kPa/sPost-decompression glasses_78 kPa/s
Closed-system equilibrium degassing

Le Gall and Pichavant. Fig. 9
0
50
100
150
200
250
300
1E+1 1E+2 1E+3 1E+4
D (µ
m)
BND (mm-3)
0.64 m/s1 m/s1.5 m/s3 m/sNucleation
Growth Coalescence
25 MPa
50 MPa
Strombolian pumices
?
Bubble outgassing