revisiting effectively maintained inequality in
TRANSCRIPT

The Pennsylvania State University
The Graduate School
REVISITING EFFECTIVELY MAINTAINED INEQUALITY
IN EDUCATIONAL TRANSITIONS: THE CASE OF SOUTH KOREA
A Dissertation in
Educational Theory and Policy
and
Comparative and International Education
by
Ji Hye Kim
Ó 2021 Ji Hye Kim
Submitted in Partial Fulfillment of the Requirements
for the Degree of
Doctor of Philosophy
August 2021

The dissertation of Ji Hye Kim was reviewed and approved by the following:
Soo-yong Byun Associate Professor of Education (Educational Theory & Policy) Dissertation Advisor Chair of Committee
David P. Baker Professor of Education (Educational Theory & Policy) and Sociology
Kelly Rosinger Assistant Professor of Education (Higher Education) Research Associate of Center for the Study of Higher Education
Liying Luo Assistant Professor of Sociology and Demography
Kevin Kinser Professor of Education Head of Department of Education Policy Studies

iii
ABSTRACT
The expansion and universalization of educational opportunities in many parts of the
world raised expectations that education inequality could be alleviated. Contrary to expectations,
however, empirical evidence on educational inequality has been revealed. This is because
qualitative differentiation of education programs at a certain level of education differentiates
students' educational experiences, despite expanding access to the education opportunities at the
given level of education, according to the effectively maintained inequality (EMI) hypothesis
proposed by Lucas (2001). The EMI hypothesis assumes a situation in which education at a
certain level has become universal, resulting in quantitative differences being replaced with
qualitative differences (Lucas, 2001). In this regard, South Korea is an excellent case for testing
the EMI hypothesis at both secondary and higher education levels because of its almost universal
enrollment rates even at the postsecondary level and highly differentiated systems, especially at
the upper secondary and postsecondary levels. Thus, this study examined socioeconomic
disparities in educational transitions from the upper secondary level to higher education,
intending to test the EMI hypothesis's relevance in the Korean context. In specific, this study
delved into three research questions: 1) How do students' educational transitions from middle
schools to high schools vary by parental socioeconomic status (SES)? 2) How do students'
educational transitions from high schools to higher education vary by parental SES? For this
purpose, this study considered three different types of high schools (i.e., selective academic high
schools, non-selective academic high schools, and vocational high schools) and four different
types of college enrollment (i.e., 4-year university in the capital area, 4-year university in the non-
capital area, 2-year junior colleges, and no college enrollment), considering the horizontal
diversification in the upper secondary and higher education in South Korea.

iv
Using nationally representative data of 7th-grade students in South Korea, this study
showed several mixed findings as follows. First, in terms of the transition from middle schools to
high schools, results from the regression models showed significant socioeconomic disparities in
attending more selective high schools (i.e., selective academic > non-selective academic >
vocational high schools), even after controlling for students’ academic achievement. However,
EMI testing based on the predicted probabilities showed that even the disadvantaged students in
Korea typically went to non-selective academic high schools rather than vocational high schools,
questioning the relevance of EMI in Korea. Second, in terms of the transition from high schools
to higher education, parental SES was significant in predicting college entry, but became
marginally significant after considering high school type in the regression models. Vocational
high school students were less likely to go to a college, although even the disadvantaged students
typically went to a college rather than not going to a college. Interestingly, the differences in the
predicted probabilities of college entry by high school type were greater than those by SES.
Third, considering the different types of college enrollment, results from the regression models
showed significant socioeconomic disparities in attending more selective higher education
institutions (i.e., 4-year universities in the capital area > 4-year universities in the non-capital area
> 2-year junior colleges), even after controlling for students’ academic achievement and high
school type attended. However, academic high school students typically went to 4-year
universities in the non-capital area, while vocational high school students typically went to 2-year
junior colleges, regardless of their SES, again questioning the EMI in Korea. These findings
highlight the importance of considering the organizational structures in the earlier stages of
education when applying the EMI hypothesis in nations like South Korea as it plays a substantial
role in shaping the outcomes in later educational transition.
Keywords: effectively maintained inequality (EMI), educational transition, tracking,
South Korea
v
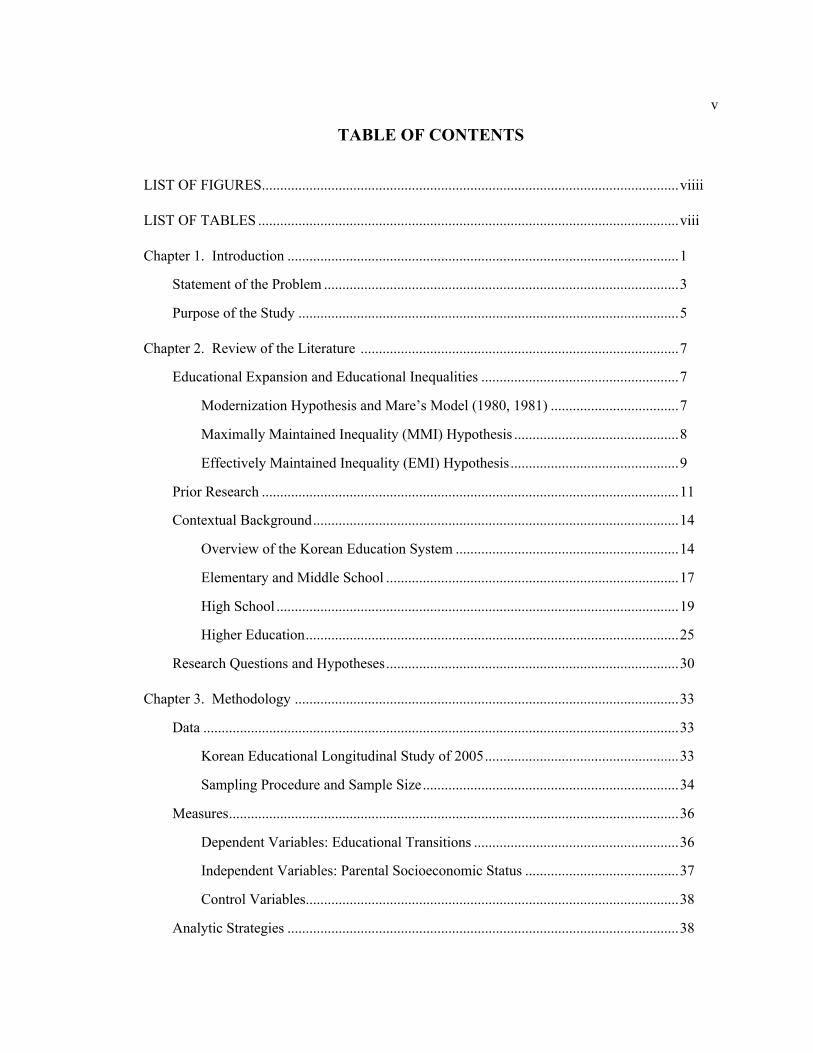
TABLE OF CONTENTS
LIST OF FIGURES .................................................................................................................. viiii
LIST OF TABLES ................................................................................................................... viii
Chapter 1. Introduction ........................................................................................................... 1
Statement of the Problem ................................................................................................. 3
Purpose of the Study ........................................................................................................ 5
Chapter 2. Review of the Literature ....................................................................................... 7
Educational Expansion and Educational Inequalities ...................................................... 7
Modernization Hypothesis and Mare’s Model (1980, 1981) ................................... 7
Maximally Maintained Inequality (MMI) Hypothesis ............................................. 8
Effectively Maintained Inequality (EMI) Hypothesis .............................................. 9
Prior Research .................................................................................................................. 11
Contextual Background .................................................................................................... 14
Overview of the Korean Education System ............................................................. 14
Elementary and Middle School ................................................................................ 17
High School .............................................................................................................. 19
Higher Education ...................................................................................................... 25
Research Questions and Hypotheses ................................................................................ 30
Chapter 3. Methodology ......................................................................................................... 33
Data .................................................................................................................................. 33
Korean Educational Longitudinal Study of 2005 ..................................................... 33
Sampling Procedure and Sample Size ...................................................................... 34
Measures ........................................................................................................................... 36
Dependent Variables: Educational Transitions ........................................................ 36
Independent Variables: Parental Socioeconomic Status .......................................... 37
Control Variables ...................................................................................................... 38
Analytic Strategies ........................................................................................................... 38

vi
Chapter 4. Results ................................................................................................................... 41
Descriptive Findings ........................................................................................................ 41
Educational Pathways by School Type .................................................................... 41
Background Characteristics by Different Types of High School and College Enrollment ........................................................................................................ 43
Socioeconomic Differences in the Transition to High School ......................................... 47
Socioeconomic Differences in the Transition to Higher Education ................................. 49
College Entry ........................................................................................................... 49
Type of College Enrollment ..................................................................................... 50
Predicted Probabilities of Attending Different Type of High School and College .......... 53
Chapter 5. Discussion .............................................................................................................. 57
Summary of Findings ....................................................................................................... 57
Transition from Middle Schools to High Schools .................................................... 58
Transition from High Schools to Higher Education ................................................. 59
Limitations and Suggetions for Future Research ............................................................. 62
Appendices ............................................................................................................................... 64
References ................................................................................................................................ 66

vii
LIST OF FIGURES
Figure 2-1: Mainstream education system in Korea. ............................................................... 15
Figure 2-2: Enrollment rates by school level in Korea from 1980 to 2019 ............................. 18
Figure 2-3: Transition rates by school level in Korea from 1980 to 2019 ............................... 19
Figure 2-4: Number of entrants, applicants, and acceptance rates by high school type (2019) .... 22
Figure 2-5: Number of higher education institutions by type and location (2019) .................. 26
Figure 4-1: Flowchart showing educational pathways for cohorts who were seventh graders in 2005 with percentages and the number of students who enrolled in each type of institution ........................................................................................... 42

viii
LIST OF TABLES
Table 2-1: Number of schools, students, and teachers in Korea by school type (2019). ........ 16
Table 2-2: Korean high school types by law and selectivity. ................................................. 24
Table 2-3: Number of entrants, applicants, and acceptance rates by college type (2019) ........... 29
Table 3-1: Number of sampled schools and students of KELS:05 ......................................... 35
Table 3-2: Changes in the number of sample and attrition rate by survey year ...................... 36
Table 4-1: Descriptive statistics for the independent variables by the type of high school and college enrollment ........................................................................................... 46
Table 4-2: Multinomial logistic regression models predicting transition to high school ....... 48
Table 4-3: Logistic regression models predicting transition to higher education: College entrty ...................................................................................................................... 50
Table 4-4: Multinomial logistic regression models predicting transition to higher education: Type of college enrollment .................................................................. 52
Table 4-4: Multinomial logistic regression models predicting transition to higher education: Type of college enrollment (continued) ............................................... 53
Table 4-5: Predicted probabilities of attending different type of high school and college between advantaged and disadvantaged students .................................................. 56

ix
ACKNOWLEDGEMENTS
“Many are the plans in a man’s heart, but it is the LORD’s purpose that prevails”
(Proverbs 19:21). Praise and thank my dear Lord, the source of knowledge and wisdom, for
always being there for me and His blessing throughout my work to complete my dissertation
successfully.
He helped me through many other people in my time of need. First, I would like to thank
my advisor, Professor Soo-yong Byun, for his patience and extensive support, from technical
advice to heartfelt encouragement. Whenever I face a challenge, he has helped me take it to the
next level, and I have been able to complete my dissertation. He is not only a great researcher, but
also a great teacher.
I would also like to express my gratitude to Dr. David Baker for his insightful feedback
that pushed me to sharpen my thinking and brought my work to a higher level, and Dr. Kelly
Rosinger and Dr. Lying Luo whose expertise was invaluable in developing my dissertation. I
would also like to thank Dr. Maryellen Schaub for her kind support and showing a great model of
enthusiastic teacher, and Dr. Ee-gyeong Kim at Chung-Ang University who made me dream of
becoming an education researcher as my first academic advisor. I received a great deal of support
from my friends and colleagues as well. They provided inspiring discussions as well as happy
distractions to rest my mind outside of my research.
This dissertation could not be completed without the support of my beloved family.
Always thank my parents, Jae Kyeong Kim and Mi Young Chung, for being my shield with
countless love, emotional and financial support. I am also grateful to my other family members
for their generous love and support. Lastly, my special appreciation goes to my new family, Dong
Chun (Enoch) Kim and Bon Bon, my relievers. Dong Chun, thank you for being my best friend,
lover, and husband.

1
Chapter 1
Introduction
With increasing educational opportunities in many parts of the world, numerous studies
have examined whether educational expansion reduces inequality by investigating the association
between parental socioeconomic status (SES) and children’s educational opportunity. Earlier
studies in the 1970s, for example, showed that educational expansion reduced inequality by
comparing the association between family background and children’s years of schooling of
different age cohorts (Boudon, 1974). However, Mare’s educational transition model (1980,
1981) refuted the earlier studies by showing different patterns of changes in educational
inequality. Specifically, Mare (1981) found that inequality in educational opportunity, as
measured by the association between family background and children’s grade progression, was
generally stable over different age cohorts, but more prominent in the early stage of education
within a particular cohort. This decline in inequality in the later stage of education was explained
by a decline in heterogeneity in the family background among students (Mare, 1981). Many
subsequent studies (e.g., Blossfeld & Shavit, 1993) extended Mare’s model using alternative
measures (i.e., the odds of educational transition) for educational opportunity, rather than using
total years of schooling.
However, not all studies supported Mare’s model. Several studies found that educational
inequality decreased in the lower education level with universalization, while inequality
maintained in the higher education level (Raftery & Hout, 1993). One notable explanation was a
maximally maintained inequality (MMI) hypothesis proposed by Raftery and Hout (1993). They
found that, in the context of Ireland, inequality in educational attainment did decrease but only at

2
the lower levels of education which were saturated by the advantaged classes. Despite its
significant influence on following studies, the MMI hypothesis has a limitation because it focuses
only on the quantitative inequality in educational attainment and ignores the qualitative inequality
across different educational programs at the same education level.
In this regard, Lucas (2001) proposed an alternative explanation named effectively
maintained inequality (EMI). According to EMI, educational inequality among social classes at a
certain level of education persists with respect to the type of education, even though access to the
given level of education is nearly universal (Lucas, 2001). Lucas (2001) presented not only a
theoretical alternative to the MMI but also a methodological alternative to Mare’s model. Mare’s
model received criticism for the use of time-invariant variables, excluding age-related and time-
varying variables from the analytical model (Cameron & Heckman, 1998). In other words,
examining the effect of family background on educational transition requires including
independent variables that change with progression from one educational level to another.
Considering this criticism of Mare’s model, Lucas (2001) proposed an analytic model that
includes academic achievement and educational programs or tracks enrolled.
As such, the EMI hypothesis is useful for explaining persistent educational inequality
where a certain level of education is universal while being qualitatively differentiated across
different tracks. In other words, the EMI hypothesis assumes a situation in which education at a
certain level has become universal, resulting in quantitative differences being replaced with
qualitative differences (Lucas, 2001). In this regard, South Korea (hereafter ‘Korea’) is an
excellent case for testing the EMI hypothesis at both secondary and higher education levels
because of its almost universal enrollment rates even at the postsecondary level (middle school
96.7%, high school 91.3%, and higher education 67.8%) (Korean Ministry of Education [MOE]
& Korean Educational Development Institute [KEDI], 2019a) and highly differentiated systems
especially at the upper secondary and postsecondary levels (Byun & Park, 2017; Kim, 2004; Kim

3
& Kim, 2013). Taking advantage of this context, the current study examines socioeconomic
disparities in educational transitions from the upper secondary level to higher education and
tested the relevance of EMI hypothesis in the Korean context by examining whether the
prediction of students' educational destination varied by their SES. In particular, considering the
recent qualitative differences in upper secondary and higher education systems in Korea, this
study considers three different type of high schools (i.e., selective academic high schools, non-
selective academic high schools, and vocational high schools) and four different types of college
enrollment (i.e., 4-year university in the capital area, 4-year university in the non-capital area, 2-
year junior colleges, and no college enrollment). The findings of this study may provide
important insights into how students’ educational pathways vary by their SES in the Korean
society and theoretical implications in applying the EMI hypothesis to various societies.
Statement of the Problem
Lucas’s proposal of the EMI hypothesis (2001) has motivated many researchers to pay
attention to socioeconomic disparities in access to qualitatively differentiated education programs
around the world. Thus, research applying the EMI hypothesis has prospered not only in the
United States (Alon, 2009; Andrew, 2017; Engberg, 2012), but also in other countries including
but not limited to Australia (Chesters, 2015; Marks, 2013), Germany (Becker, 2003), Israel
(Ayalon & Shavit, 2004), Italy (Guetto & Vergolini, 2017), Republic of Ireland (Byrne &
McCoy, 2017), United Kingdom (Boliver, 2011; 2016), and Korea (Byun & Park, 2017). These
studies supported the EMI hypothesis by showing that students’ educational experience at
secondary school differed by their social background, even though secondary education was
nearly universal in those countries (Avalon & Shavit, 2004; Becker, 2003; Byrne & McCoy,
2017; Byun & Park, 2017; Guetto & Vergolini, 2017). In addition to secondary education,
4
research also found that educational inequality at the postsecondary level was maintained along
with qualitative differences across institutions or programs (Alon, 2009; Andrew, 2017; Boliver,
2011; Byrne & McCoy, 2017; Byun & Park, 2017; Chesters, 2015; Engberg, 2012; Jerrim,
Chmielewski, & Parker, 2015).
However, many of the prior studies (e.g., Alon, 2009; Ayalon & Shavit, 2004; Becker,
2003; Chesters, 2015) presented their findings only from various regression models, not
estimating the predicted probabilities of attending different types of education programs and
schools between socioeconomically advantaged and disadvantaged students, although Lucas
suggested “regression-type coefficients by themselves cannot reveal whether social background
moves people over threshold (Lucas, 2001: 1671).” Along with the regression models, Lucas
emphasized using predicted probabilities in order to assess the EMI hypothesis, because
socioeconomic advantages are considered as sufficient and effective if it can move people over
thresholds (Lucas, 2001). Previous studies applying the EMI hypothesis in Korea also had same
limitations. Although many studies paid attention to the horizontal differences among different
types of schools and its relation to the concerns of educational inequality (Chang, 2007; Kim,
2004; Kim, 2008; Kim & Kim, 2013; Ku & Kim, 2015; Moon, 2016), the majority of them did
not follow Lucas (2001)’s methodological suggestions to test the EMI hypothesis in Korea.
As one of the exceptions, Byun and Park (2017) tested the validity of the EMI hypothesis
in Korea by estimating the predicted probabilities of making transitions into different types of
high schools and colleges between the advantaged and disadvantaged students, following Lucas
(2001)’s suggestions. However, they presented several mixed findings which did not fully support
the EMI hypothesis in the Korean context, which warrants further research regarding the
relevance of EMI in Korean context. Also, Byun and Park’s work (2017) had several limitations.
First, they focused on only two types of secondary (i.e., academic vs. vocational) and higher
education (i.e., 4-year universities vs. 2-year junior colleges) institutions, without considering

5
recent qualitative differentiation within academic high schools and 4-year universities (Kim &
Kim, 2013; Kim & Ryu, 2008; Park & Min, 2009). Recently, Korean studies have shown
significant socioeconomic disparities in access even within academic high schools and 4-year
universities. Students with higher family SES are more likely to make the transition to more
selective academic high schools (Kim & Kim, 2013; Kim & Ryu, 2008; Park & Min, 2009) and
selective 4-year universities located in the capital area rather than non-selective academic high
schools and universities located in the non-capital area in Korea (Kim & Kim, 2013). This strand
of research implies that it is necessary to consider more detailed horizontal diversification in
secondary and higher education in Korea in order to better test the EMI hypothesis in Korean
context. Second, Byun and Park (2017) used data with extended period of time for college
enrollment, including up to two years after high school graduation. However, given that many
Korean students repeated a college entrance exam more than three times if they were not satisfied
with their scores, it is crucial to use data with a longer period of time.
Purpose of the Study
To address the limitations in prior studies, the current study examines socioeconomic
disparities in education transitions from middle school to higher education, considering more
recent qualitative differentiation among high schools and colleges in Korea. Using more recent
nationally representative data than that used by Byun and Park (2017), this study considers more
complicated types of high schools (i.e., selective academic high schools, non-selective academic
high schools, and vocational high schools) and college enrollment (i.e., 4-year university in the
capital area, 4-year university in the non-capital area, 2-year junior colleges, and no college
enrollment). Also, with a goal of testing the validity of EMI hypothesis in Korea, this study
examines and compares the predicted probabilities of attending different types of high schools
6
and colleges between socioeconomically advantaged and disadvantaged students. In specific, this
study seeks to answer the following two research questions: 1) How do students' educational
transitions from middle schools to high schools vary by parental socioeconomic status (SES)? 2)
How do students' educational transitions from high schools to higher education vary by parental
SES?
In the following chapters, I begin with the review of literature on educational expansion
and inequality including prior studies that have tested the EMI hypothesis in various societies. I
also describe the contextual background of the Korean education system with a focus on the
upper secondary and higher education systems. And I propose two guiding research questions and
corresponding hypotheses of what I expect to observe based on prior studies. Next, I explain data
and methods I use in this study. Subsequently, I present the results, and finally discuss them along
with theoretical implications and suggestions for future research.

7
Chapter 2
Review of the Literature
Educational Expansion and Educational Inequalities
Modernization Hypothesis and Mare’s Model (1980, 1981)
In recent decades since the 1970s, many studies have examined the relationship between
educational expansion and inequality. In the 1970s, while modernization theorists dealt with
decreasing educational inequality as a beneficial side-effect of educational expansion, many
sociologists have focused on the direct relationship between educational expansion and inequality
(Haim & Shavit, 2013). Modernization theorists posed that increasing demand for skilled labor
due to industrial development resulted in the expansion of schooling, which unexpectedly led to
educational equalization. As employers preferred more educated workers, all social classes
participated in schooling more. Early studies directly focusing on the relationship between
educational expansion and inequality supported the modernization hypothesis (Haim & Shavit,
2013). They were interested in how the effect of family background on children’s years of
schooling changed in response to the expansion of schooling by age cohorts and showed the
regression coefficient decreased with the recent cohort. They interpreted it as evidence showing
decreased educational inequality (Boudon, 1974).
Early studies supporting the modernization hypothesis were criticized for their measures
of educational opportunity. For instance, Mare (1980, 1981) argued that the effect of family
background on educational attainment varies depending on the level of education. In this regard,
Mare (1981) proposed an alternative measure of educational inequality with the association
8
between family background and the odds of grade progression, not the total years of schooling. In
other words, Mare’s model led to a major methodological change in measuring educational
attainment from using a continuous variable (i.e., the years of schooling) to a categorical variable
(i.e., the odds of educational transitions). In his empirical study, Mare (1981) refuted the
modernization hypothesis by showing that the effect of family background on the odds of
educational transitions has been stable rather than decreasing despite the expansion of schooling.
Also, Mare (1981) found that educational inequality was decreasing within the cohort
while it was persistent across cohorts. The effect of family background on children’s educational
attainment declined as they progressed to a higher level of education. This decline in educational
inequality within the cohort, as Mare (1981) stated, resulted from decline in heterogeneity of
family background among students. Mare’s model has been employed and supported by
numerous studies (e.g., Blossfeld & Shavit, 1993; Stolzenberg, 1994). For example, Blossfeld &
Shavit (1993) supported and expanded Mare’s model by comparing the educational inequalities
of thirteen European countries with different social, political, and economic contexts. In twelve
European countries except for Switzerland, the effect of family background on children's
educational continuation decreased as children progressed to a higher level of education.
Maximally Maintained Inequality (MMI) Hypothesis
However, with the universalization of primary and secondary education in many societies
since the late twentieth century, Mare’s model has been refuted by later studies. These studies
argued that educational inequality decreased in a lower education level with universalization,
while inequality maintained in a higher education level (Raftery & Hout, 1993). As one of the
most influential studies, Raftery and Hout (1993) examined the effects of education reform in
1967, which introduced free secondary education in Ireland and proposed a maximally
9
maintained inequality (MMI) hypothesis. In their work, inequality in educational attainment did
decrease only in a lower level of education attained universally by the advantaged classes. Taking
rational-choice approaches, MMI hypothesis explains that parents have a great interest in their
children’s achievement and utilize their resources to advance children's achievement as fully as
possible (Hout, 2006). Upper-class parents have the upper hand over the use of resources for their
children, so privileged children have selective educational opportunities first. Therefore, only
when the educational opportunities of the privileged class are saturated, educational opportunities
at the given level open to the lower classes as a downfall effect, thereby reducing inequality
(Raftery & Hout, 1993).
Although Raftery and Hout (1993) provided empirical evidence on MMI hypothesis with
the Irish case, the study has limitations in that it considered only the entry and completion of
secondary education, representing a quantitative dimension of educational opportunities. Raftery
and Hout (1993) acknowledged that they ignored qualitative differences among secondary
schools because Ireland had a national curriculum with no within- and between school tracking.
Yet, they noted that some selective schools with more resources and advantages in access to the
universities exist, and those horizontal differences in the same level of schooling could be related
to another dimension of educational inequality.
Effectively Maintained Inequality (EMI) Hypothesis
In this regard, Lucas (2001) proposed an alternative explanation named effectively
maintained inequality (EMI). According to the EMI hypothesis, groups with higher SES use their
socioeconomic resources to pursue higher quality educational opportunities to differentiate
themselves from others with lower SES. Therefore, educational inequality among social classes in

10
a certain level of education persists with respect to the type of education of educational
opportunity, even though access to the given level of education is nearly universal (Lucas, 2001).
As such, MMI and EMI propose different explanations on the relationship between
educational expansion and inequality, while two perspectives commonly state that inequality is
largely maintained. MMI argues that the association between family background and children’s
educational attainment can be alleviated when the given level of education is saturated among
privileged groups and educational opportunities open to the lower classes. By contrast, EMI
explains that the association between family background and children’s educational experiences
at a certain level of education persists with respect to the type of education, despite the
universalization of educational opportunities.
The difference between MMI and EMI stems from the difference in which dimension of
educational opportunity is considered. Educational opportunity is divided into two dimensions:
(a) quantitative and (2) qualitative. While the quantitative dimension of educational opportunity
includes the years of schooling or completion of a certain level of education, the qualitative
dimension can be measured by the type of program or tracking at the same level of education
(Lucas & Byrne, 2017). In other words, quantitative differences in educational outcomes result
from vertical hierarchies between different levels of education, while qualitative differences result
from horizontal hierarchies within the same level of education. In this regard, Mare’s model and
MMI hypothesis have limitations in that they did not include the qualitative measure of
educational opportunity (i.e., program or track), although they employed an alternative measure
(i.e., the odds of educational transition) compared to earlier studies’ measure (i.e., total years of
schooling).
In addition to a theoretical alternative to the MMI, Lucas (2001) also presented a
methodological alternative to the Mare’s model. Considering this criticism of Mare’s model,
Lucas proposed an analytic model including students’ academic achievement and educational

11
program or track each student experienced. This is because it is necessary to include independent
variables that change with progressing from one educational level to another in order to examine
the effect of family background on educational transition. Mare’s model was criticized for the use
of time-invariant variables only, excluding age-related and time-varying variables in its analytical
model (Cameron & Heckman, 1998).
In sum, the theoretical development described above provides important insights into the
relationship between educational expansion and inequality. Building on EMI, the current study
examined socioeconomic disparities in the educational transition from secondary education to
high education in Korea. The following section described prior studies testing EMI in various
societies and their limitations.
Prior Research
In his study examining socioeconomic disparities in students’ track placement through a
stratified curriculum in the US high school, Lucas (2001) found that students from higher SES
families were more likely to take college-preparatory courses than their counterparts from lower
SES families. Building on Lucas’s seminal work, a number of scholars have tested the relevance
of EMI in different countries, such as Israel (Ayalon & Shavit, 2004), Italy (Guetto & Vergolini,
2017), Ireland (Byrne & McCoy, 2017) and Korea (Byun & Park, 2017). They commonly found
the significant effect of family SES on students’ educational experiences at secondary education,
although the way by which horizontal differentiation in secondary education was measured was
different. Most studies focused on the tracking system of secondary education. Comparing
academic and vocational tracks, these studies found that students from higher SES families were
more likely than students from lower SES families to enter or complete the academic track in
12
relative to the vocational track (Byrne & McCoy, 2017; Byun & Park, 2017; Guetto & Vergolini,
2017).
Other studies used within-school tracking in the curriculum such as subject-level
differentiation and different types of high school diplomas. For example, Byrne & McCoy (2017)
showed that high SES students were more likely to take higher-level (advanced) mathematics
courses, while lower SES students did lower-level courses in Ireland. Ayalon & Shavit (2004)
also found decreasing inequality in pursuing a less competitive diploma program (plain diploma)
and increasing inequality in pursuing a more competitive diploma program (university-qualifying
diploma) in Israel.
Recent studies have expanded the application of EMI to higher education (Andrew, 2017;
Alon, 2009; Boliver, 2011; Byrne & McCoy, 2017; Byun & Park, 2017; Chesters, 2015; Engberg,
2012; Jerrim, Chmielewski, & Parker, 2015; Thomsen, 2015). Those studies generally confirmed
the EMI hypothesis, reporting that students from higher SES families were more likely to
matriculate and graduate from more selective higher education institutions than students from
lower SES families. Selectivity in higher education was measured by different ways. Several
studies considered technically different types of higher education institutions. For example, Byrne
and McCoy (2017) considered three different types of higher education institutions, such as
universities, institutes of technology, and other institutions in Ireland. Chesters (2015) considered
eight research-intensive universities and others. Other studies divided universities into several
groups by their status in their countries, considering their stratified postsecondary education
system in more detail. For example, Andrew (2017) considered community colleges and
universities, and then divided the universities into two different groups: regular and non-selective
colleges and universities and selective colleges and universities. Engberg (2012) divided US
colleges and universities into three groups, including inclusive, moderate- and high-selectivity
institutions based on the Carnegie Classification of 2005. Boliver (2011) also found

13
socioeconomic disparities in the likelihood of enrolling more traditional and higher status degree
programs at ‘Old’ universities in the United Kingdom. Together, these different ways of
categorizing institutions are part of an effort better to reflect the qualitative hierarchies among
higher education institutions.
EMI hypothesis has a good fit to explain educational inequality in a society with
universal access to a certain level of education but the qualitatively differentiated system at a
given level of education. In this regard, although Korea is an interesting case to apply the EMI
hypothesis, only a handful of studies have tested EMI in Korean context. For example, Byun and
Park (2017) examined socioeconomic disparities in the likelihood of making transitions into
different types of high school (academic vs. vocational) and college (4-year university vs. 2-year
junior college). They found that in general, higher-SES students were more likely to attend
academic high schools and 4-year universities, while lower-SES students were more likely to
attend vocational high schools and 2-year junior colleges. However, their testing of EMI found
mixed results supporting and questioning EMI hypothesis in the Korean context. In particular,
they found that even disadvantaged groups of students were typically going to academic high
schools rather than vocational high schools. Also, disadvantaged students who attended academic
high schools were typically going to 4-year universities rather than 2-year junior colleges. These
results did not fully support EMI, implying the need of more studies about the relevance of EMI
hypothesis in the Korean context. In addition, Byun and Park (2017) acknowledged several
limitations which need to be addressed in the future research, as described in the previous
chapter. First, they suggested considering more than two types of high school (e.g., academic vs.
vocational) and college (e.g., 4-year universities vs. 2-year junior colleges) to capture more
nuanced qualitative differences at the upper secondary and postsecondary levels. Second, they
suggested using data with longer period of time, more than two years after high school

14
graduation, given that many Korean students repeated a college entrance exam more than three
times if they were not satisfied with their scores.
Contextual Background
Overview of the Korean Education System
Korean mainstream education is typically provided by five levels of schools based on
Basic Education Act (BEA) of 1998: (a) kindergartens, (b) elementary schools (Grades 1-6), (c)
middle schools (lower secondary, Grades 7-9), (d) high schools (upper secondary, Grades 10-12),
and (e) higher education institutions. Following the pattern of age-graded schooling found in
many parts of the world, Korean students typically enter elementary schools at age 7 with only a
few exceptions. Each level of education is managed and supported by the three different laws.
The Early Childhood Education Act (ECEA) of 2004 covers early education for young children
aged from three to six which is provided by kindergartens in Korea. The Primary and Secondary
Education Act (PSEA) of 1998 covers education issues dealing with primary and secondary
education provided by elementary, middle, and high schools. Higher Education Act (HEA) of
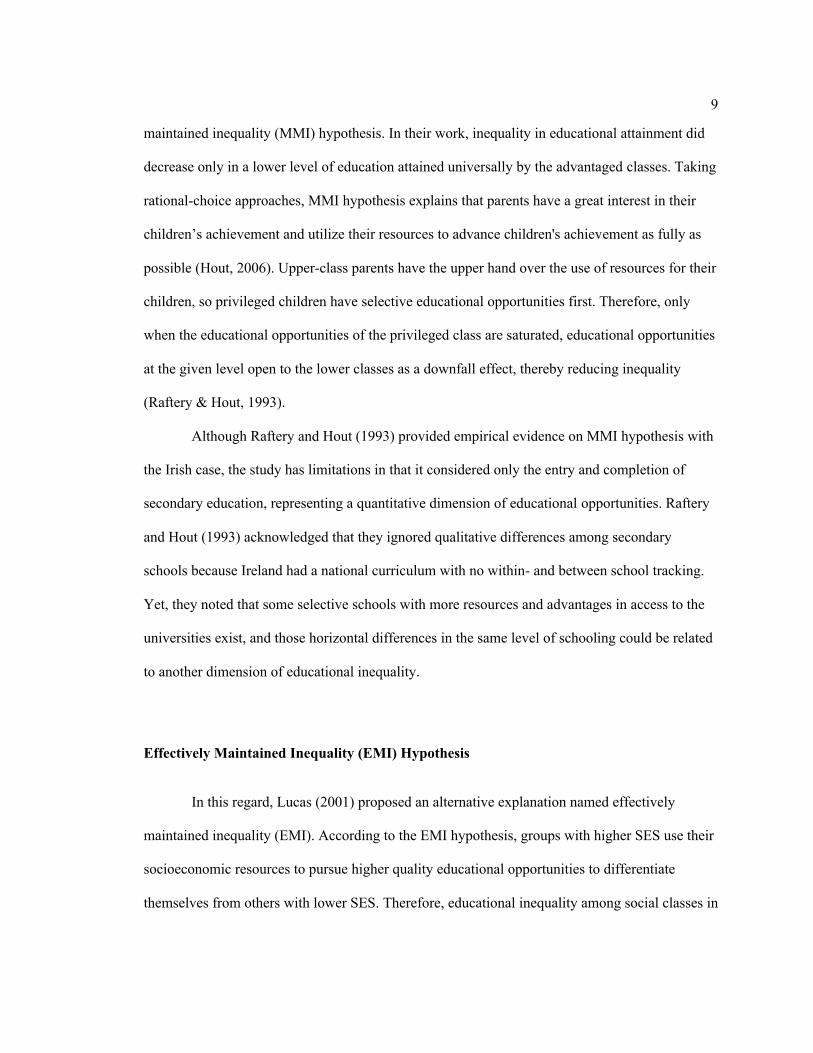
1998 is applied to higher education provided by universities and colleges. Figure 2-1 shows the
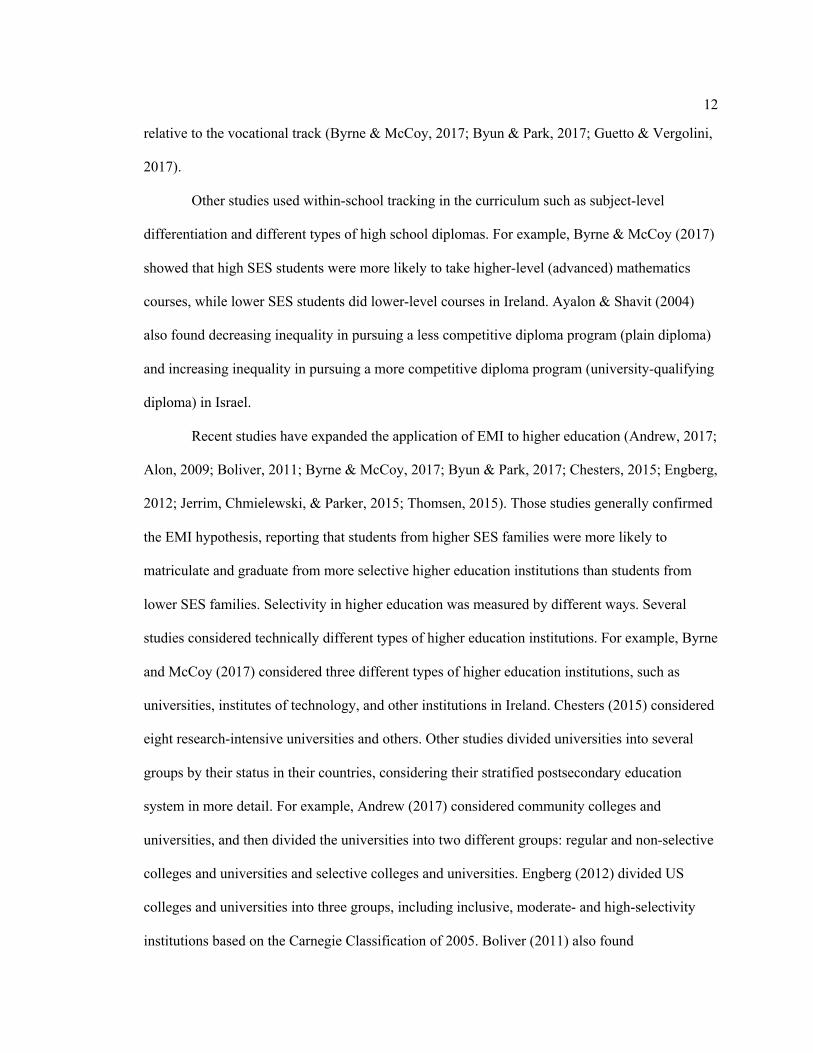
mainstream school system in Korea from preschool education to higher education. Table 2-1
presents the number of institutions, students, and teachers by school level and type. Each school
level and type in Korea will be described in more detail in the following sections.
15
Preschool Education
Kindergartens Aged 3-6
Primary Education
Elementary Schools
(6 years)
Grades 1-6 (Aged 7-12)
Secondary Education
Middle Schools
(3 years)
Grades 7-9 (Aged 13-15)
High Schools (3 years)
General high schools
Grades 10-12 (Aged 16-18)
Autonomous high schools
Special-purposed high schools
Specialized high schools
Higher Education
Higher Education Institutions (2-4 years)
Four-year universities
Two-year junior colleges
Graduate Schools
Figure 2-1. Mainstream education system in Korea
16
Table 2-1. Number of schools, students, and teachers in Korea by school type (2019)
School Type Schools Students Teachers
Total 21,194 9,131,053 578,042
Kindergarten 8,837 633,913 53,362
Elementary School 6,087 2,747,219 188,582
Middle School 3,214 1,294,559 110,556
High School (HS) 2,671 100.0% 1,461,312 100.0% 144,049 100.0%
General HS2) 1,555 58.2% 1,001,756 68.6% 89,975 62.5%
Autonomous HS 154 5.8% 113,929 7.8% 9,879 6.9%
Public Autonomous HS2) 112 4.2% 75,093 5.1% 7,122 4.9%
Private Autonomous HS1) 42 1.6% 38,836 2.7% 2,757 1.9%
Special-Purposed HS 158 5.9% 65,244 4.5% 7,886 5.5%
Science HS1) 20 0.7% 4,396 0.3% 867 0.6%
Gifted HS1) 8 0.3% 2,515 0.2% 537 0.4%
Foreign Language HS1) 30 1.1% 17,036 1.2% 1,682 1.2%
International HS1) 7 0.3% 3,173 0.2% 425 0.3%
Arts HS 29 1.1% 16,443 1.1% 1,109 0.8%
Physical Education HS 17 0.6% 3,927 0.3% 503 0.3%
Meister HS3) 47 1.8% 17,754 1.2% 2,763 1.9%
Specialized HS3) 489 18.3% 230,098 15.7% 25,387 17.6%
Others 315 11.8% 50,285 3.4% 10,922 7.6%
Higher Education Institution 385 100.0% 2,994,050 100.0% 81,493 100.0%
University 201 52.2% 2,004,155 66.9% 66,743 81.9%
University 191 49.6% 1,988,458 66.4% 65,909 80.9%
Univ. of Education 10 2.6% 15,697 0.5% 834 1.0%
Junior College 137 35.6% 643,560 21.5% 12,327 15.1%
Others 47 12.2% 346,335 11.6% 2,423 3.0% 1) Selective academic high schools allowed to select students first through their own admission policy 3) Non-selective academic high schools where students are randomly assigned within the school district 3) Vocational high schools Source: Korean MOE & KEDI (2019b)
17
Elementary and Middle school
Korean elementary and middle school education is free and compulsory for all Korean
students, which leads to a universal enrollment of students in elementary and middle schools,
since 1959 and 2004,1) respectively. At the elementary school level, almost every child at the age
group had enrolled in elementary schools since 1980, when the data began to be collected (97.7%
in 1980 and 98.7% in 2019). The enrollment rate in middle school has increased from 73.3% in
1980 to 96.7% in 2019, which reaches an almost universal level (Korean MOE & KEDI, 2019a;
see Figure 2-2). This means that almost every child in the age group is attending elementary and
middle schools in Korea.
Elementary and middle school students in Korea are receiving uniform education with no
between school tracking. Although there are private schools at the elementary and middle school
level, there are only small variations among schools in their curriculum, teachers, and other
resources. This is largely the result of Korea’s egalitarian approach to elementary and middle
school education with national curriculum and teacher policies. Especially, only 1.2% of
elementary schools are private, which means that almost all elementary school students are
attending public schools. At the middle school level, approximately 19.7% of schools are private
(Korean MOE & KEDI, 2019b). Yet, even private elementary and middle schools are required to
basically adopt a national curriculum with few variations as these levels of schooling are
compulsory education. Besides, private middle schools are financially subsidized by the
government for much of their operating costs and are therefore largely controlled by the
government as public schools.
1) The legislation on free compulsory education in middle school was enacted in 1985, but it did not expand
for all students until 2004 due to lack of governmental budget.

18
In terms of an educational transition from primary to secondary education, nearly all
elementary school graduates are entering middle schools. The transition rate from elementary
school to middle school is 100% in 2019, which was 95.8% even in 1980 (Korean MOE & KEDI,
2019a; see Figure 2-3). This results from the abolishment of middle school entrance exams in
1968. Since then, elementary school graduates have been randomly assigned to middle schools by
lottery based on their place of residence, even when students apply to the private middle schools.
Figure 2-2. Enrollment rates by school level in Korea from 1980 to 2019
Note. Enrollment rate for elementary schools in 1985 is based on the statistics of 1983.
Source: Korean MOE & KEDI (2019a)
97.7% 98.7% 100.0% 98.2% 97.2% 98.8% 99.1% 99.1% 98.7%
73.3%
82.0%
91.6% 93.5% 95.0% 94.6% 96.5% 95.3% 96.7%
48.8%
64.2%
79.4%82.9%
89.4% 91.0% 91.7% 92.5% 91.3%
11.4%
22.9% 23.6%
36.0%
52.5%
65.2%70.1%
67.5% 67.8%
0%
10%
20%
30%
40%
50%
60%
70%
80%
90%
100%
1980 1985 1990 1995 2000 2005 2010 2015 2019
Elementary school Middle schoolHigh school Higher education institutions

19
Figure 2-3. Transition rates by school level in Korea from 1980 to 2019
Source: Korean MOE & KEDI (2019a)
High School
In contrast to elementary and middle schools, high school education in Korea has been
neither free nor compulsory until 2020. Although the Korean government started to provide free
education for all students in public-funded high schools in 2021, it is not compulsory education
yet (Article 10 of PSEA). Accordingly, parents and students have been charged some amount of
tuition and fees for high school education. However, the recent enrollment rate for high schools
and the transition rate from middle schools to high schools in Korea are nearly universal. In 2019,
more than 90% of students at the age enrolled in high school, and 99.7% of middle school
graduates are entering high schools in Korea (Korean MOE & KEDI, 2019a; see Figure 2-2 and
2-3). Also, high school dropout rate in Korea is extremely low. As of 2019, 1.6% of high school
students in Korea dropped out of schools (Korean MOE & KEDI, 2019b).
95.8%99.2% 99.8% 99.9% 99.9% 99.9% 100.0% 100.0% 100.0%
84.5%90.7%
95.7% 98.5% 99.6% 99.7% 99.7% 99.7% 99.7%
27.2%
36.4%33.2%
51.4%
68.0%
82.1%79.0%
70.8% 70.4%
0%
10%
20%
30%
40%
50%
60%
70%
80%
90%
100%
1980 1985 1990 1995 2000 2005 2010 2015 2019
Elementary school to Middle schoolMiddle school to High schoolHigh school to Higher education institutions
20
Types of high school
Korean high school education has a diversified system with between-school tracking,
unlike the uniform system in elementary and middle schools. High schools in Korea are officially
divided into four types: (a) general high schools, (b) autonomous high schools, (c) special-
purposed high schools, and (d) specialized high schools (see Table 2-1). This distinction of high
schools was confirmed through the revision of the enforcement degree of PSEA of 1998 in 2010.
Before 2010, high schools in Korea were mainly divided into two tracks including academic and
vocational tracks. Currently, general high schools, autonomous high schools, and most of the
special-purposed high schools2) are providing academic track education, while specialized high
schools are serving students in the vocational track.
General high schools provide general upper secondary education across a range of
disciplines, not just specific fields for students in academic track (Article 76 of PSEA, 1998).
General high schools account for approximately 58.2% of high schools and 68.6% of high school
students in Korea, which is the most popular type of high school (Korean MOE & KEDI, 2019b;
see Table 2-1s). Autonomous high schools are authorized to operate a school and curriculum with
a relatively wide range of autonomy, compared to other types of high schools (Article 91 of
PSEA, 1998). Autonomous high schools account for 5.8% of high schools and 7.8% of high
school students in Korea (Korean MOE & KEDI, 2019b; see Table 2-1). Special-purposed high
schools provide professional and focused education to foster talented students who are skilled in
specialized fields such as science and foreign language, arts, and physical education. Special-
purposed high schools account for 5.9% of high schools, serving only 4.5% of high school
2) In general, most special-purposed high schools are serving students in the academic track, except for one
sub-type of specialized high school, named as 'Meister High School' accounting for only 1.8% of high
schools for 1.2% of high school students (see Table 2-1). Meister High School provides tailored vocational
curriculum directly linked to industrial demand as a selective vocational school (Article 90 of PSEA, 1998).

21
students in Korea (Korean MOE & KEDI, 2019b; see Table 2-1). Specialized high schools are
typical vocational high schools in Korea, focusing on job training and practices in particular
fields such as agriculture, manufacturing, maritime affairs, and Fisheries (Article 76 of PSEA,
1998). Specialized high schools are serving 15.7% of high school students from 18.3% of high
schools in Korea (Korean MOE & KEDI, 2019b; see Table 2-1).
Education transition to high school
Educational transition to high schools in Korea is based on different admission processes
depending on the school type. Basically, Korean high schools are divided into two categories
based on whether the schools are allowed to select students through their own admission policies
or not. Selective high schools having their own admission policies include autonomous private
high schools, special-purposed high schools, and specialized high schools. Students can apply to
only one of the selective high schools. Students who are not accepted by those selective schools
can apply to non-selective schools later. For non-selective high schools such as general high
schools and autonomous public high schools, students are randomly assigned within their school
district based on their place of residence.
In general, non-selective high schools require students' minimum academic abilities
based on their middle school GPA. In comparison, selective high schools evaluate students in
more complex ways using teacher recommendations, interviews, and other performance data
considering their purpose of the school. Especially, selective academic high schools (e.g., science
high schools, foreign high schools, and international high schools) require higher academic
abilities of students, compared to non-selective academic high schools (e.g., general high school).
As a result, selective high schools show a lower acceptance rate than non-selective schools. To be
specific, in 2019, only 47.4% of applicants were accepted by special-purposed high schools,
22
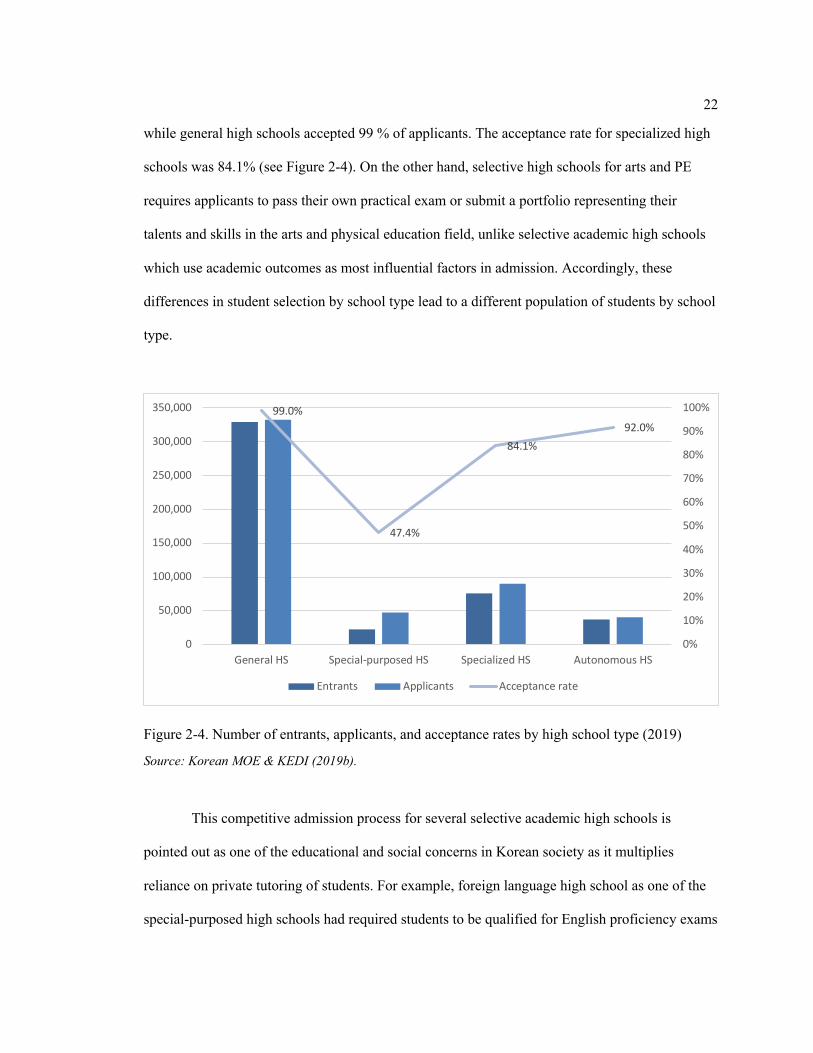
while general high schools accepted 99 % of applicants. The acceptance rate for specialized high
schools was 84.1% (see Figure 2-4). On the other hand, selective high schools for arts and PE
requires applicants to pass their own practical exam or submit a portfolio representing their
talents and skills in the arts and physical education field, unlike selective academic high schools
which use academic outcomes as most influential factors in admission. Accordingly, these
differences in student selection by school type lead to a different population of students by school
type.
Figure 2-4. Number of entrants, applicants, and acceptance rates by high school type (2019)
Source: Korean MOE & KEDI (2019b).
This competitive admission process for several selective academic high schools is
pointed out as one of the educational and social concerns in Korean society as it multiplies
reliance on private tutoring of students. For example, foreign language high school as one of the
special-purposed high schools had required students to be qualified for English proficiency exams
99.0%
47.4%
84.1%92.0%
0%
10%
20%
30%
40%
50%
60%
70%
80%
90%
100%
0
50,000
100,000
150,000
200,000
250,000
300,000
350,000
General HS Special-purposed HS Specialized HS Autonomous HS
Entrants Applicants Acceptance rate
23
such as Test of English as a Foreign Language (TOEFL). This requirement was beyond the
regular middle school curriculum, which encourages students to use private tutoring to apply to
those types of high schools. With the national debate on the admission policies causing excessive
use of private tutoring, the government banned entrance exams of selective high schools, which is
beyond the middle school curriculum (Shim & Paik, 2018).
This issue with the competitive student selection process of selective academic high
schools, accordingly, is related to the concerns about socioeconomic inequalities in educational
transitions to selective academic high schools in Korean society. This is because generally
selective academic high schools not only charge more expensive tuition and fees but also require
students to spend money on private tutoring for preparing their admission processes, compared to
non-selective schools. For example, according to the related data, foreign language high schools,
one of the selective academic high schools in Korea, charge about eight times more tuition fees
on average, compared to general high schools. This is why those selective academic high schools
are criticized as limited opportunities for disadvantaged students (Hwang, 2015).
In sum, Korean high school education is much more differentiated and stratified
compared to the elementary and middle school education, due to its diversification in school type
as well as its different selectivity. Notably, even within an academic track, schools have different
levels of selectivity depending on whether schools are allowed to select students using their own
admission policies or not. Also, because high school education in Korea is not compulsory yet,
parents must pay different levels of tuition depending on school type. These differences in school
selectivity and cost may limit educational opportunities for a particular type of high school. In
this regard, the differentiated and stratified system in Korean high school education is needed to
be considered for a better understanding of inequality in educational transitions to high school in
Korea.
24
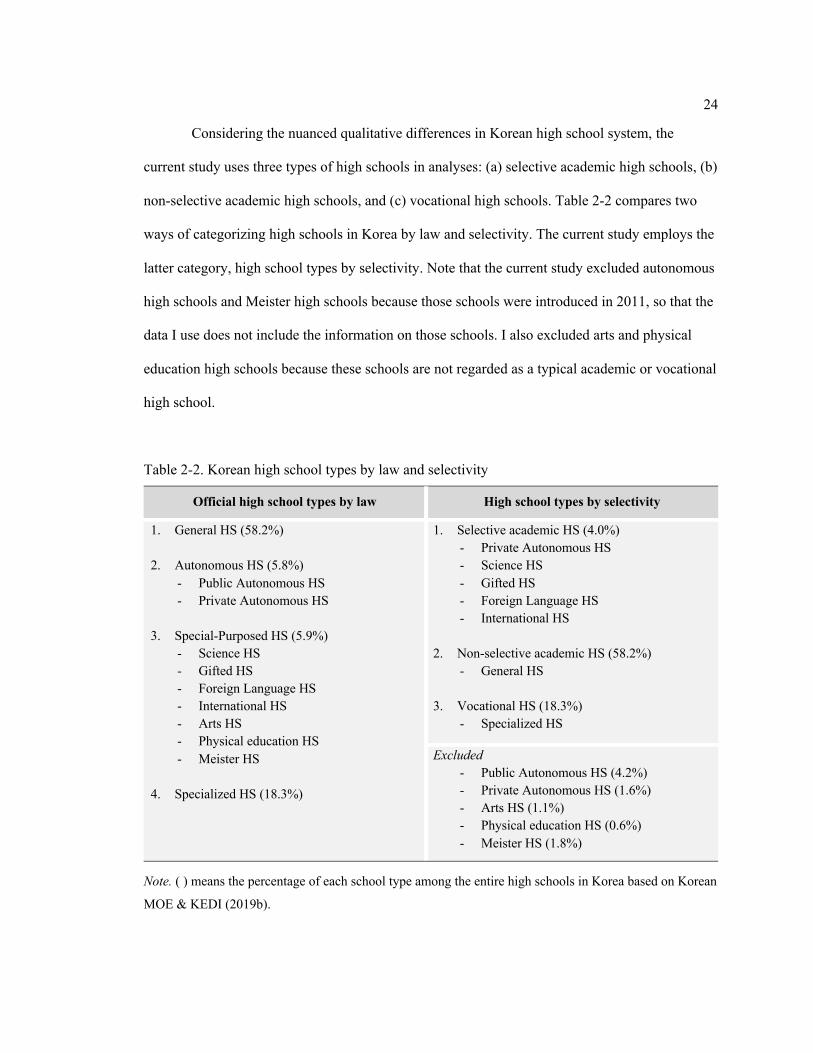
Considering the nuanced qualitative differences in Korean high school system, the
current study uses three types of high schools in analyses: (a) selective academic high schools, (b)
non-selective academic high schools, and (c) vocational high schools. Table 2-2 compares two
ways of categorizing high schools in Korea by law and selectivity. The current study employs the
latter category, high school types by selectivity. Note that the current study excluded autonomous
high schools and Meister high schools because those schools were introduced in 2011, so that the
data I use does not include the information on those schools. I also excluded arts and physical
education high schools because these schools are not regarded as a typical academic or vocational
high school.
Table 2-2. Korean high school types by law and selectivity
Official high school types by law High school types by selectivity
1. General HS (58.2%)
2. Autonomous HS (5.8%) - Public Autonomous HS - Private Autonomous HS
3. Special-Purposed HS (5.9%)
- Science HS - Gifted HS - Foreign Language HS - International HS - Arts HS - Physical education HS - Meister HS
4. Specialized HS (18.3%)
1. Selective academic HS (4.0%) - Private Autonomous HS - Science HS - Gifted HS - Foreign Language HS - International HS
2. Non-selective academic HS (58.2%)
- General HS
3. Vocational HS (18.3%) - Specialized HS
Excluded - Public Autonomous HS (4.2%) - Private Autonomous HS (1.6%) - Arts HS (1.1%) - Physical education HS (0.6%) - Meister HS (1.8%)
Note. ( ) means the percentage of each school type among the entire high schools in Korea based on Korean
MOE & KEDI (2019b).

25
Higher Education
Higher education opportunities in Korea have dramatically increased over the past
decades. In 2019, approximately 67.8% of students in the age group was attending higher
education institutions, while it was only 11.4% in 1980 (see Figure 2-2). Especially, between the
1990s and 2000s, the enrollment rate in higher education had increased rapidly, reaching its peak
in 2008 (70.5%). During the same period, the transition rate from high school to universities and
colleges also increased dramatically from 33.2% in 1990 to 82.5% in 2005. This means that
82.5% of high school graduates were going to universities and colleges in 2005. Although the
transition rate has decreased slightly since then, currently 70.4% of high school graduates entered
higher education institutions in 2019 (Korean MOE & KEDI, 2019a; see Figure 2-3).
Types of higher education institutions
Higher education institutions in Korea are basically divided into two types of institutions:
(a) 4-year universities and (b) 2-year junior colleges. 4-year universities focus on teaching and
researching academic theories and its application (Article 28 of HEA, 1998), while 2-year junior
colleges focus more on vocational training to cultivate professionals in specific industries (Article
47 of HEA, 1998). In 2019, 4-year universities account for 52.2% of higher education institutions
and 66.9% of students. Two-year junior colleges are serving 21.5% of students in higher
education from 35.6% of higher education institutions (Korean MOE & KEDI, 2019b).
Figure 2-5 presents the number of higher education institutions in Korea by its type and
location. The total number of 4-year universities is 201 (59.5%), while the corresponding number
is 137 for 2-year junior colleges (40.5%) in 2019. 4-year universities are serving 2,004,155
students who account for 75.7% of students in higher education. 2-year junior colleges are

26
serving 643,560, accounting for 24.3% of students in higher education. In terms of location, more
institutions are located in the non-capital area (66%) rather than the capital area (34%). Higher
education institutions in the capital area are serving approximately 40% of students in higher
education, while institutions in the non-capital area are serving 60% of students in higher
education. Also, the majority of the higher education institutions in Korea are private universities
and colleges. 77.6% of 4-year universities and 98% of 2-year junior colleges are private.
Accordingly, Korean students and parents are charged a large amount of tuition and fees for
attending higher education institutions. This financial burden may amplify socioeconomic
disparities in attending higher education institutions in Korea (Korean MOE & KEDI, 2019b).
Figure 2-5. Number of higher education institutions by type and location (2019)
Source: Korean MOE & KEDI (2019b)
0
200000
400000
600000
800000
1000000
1200000
1400000
0
20
40
60
80
100
120
140
4-year in Capital area 4-year in Non-capitalarea
2-year in Capital area 2-year in Non-capitalarea
Public institusions Private institutions Public students Private students

27
Educational transition to higher education
As described earlier, currently 70.4% of high school graduates entered higher education
institutions in 2019 (Korean MOE & KEDI, 2019a; see Figure 2-3). Basically, educational
transition to higher education in Korea is based on different admission processes by institutions.
Although each institution may use various measures including essay, interview,
recommendations, and extracurricular portfolios, most institutions consider a student’s score on
the College Scholastic Ability Test (CSAT) as the most important factor in their admission
process. CSAT is a standardized test assessing students’ academic performance, administered
nationally only once a year in Korea. Because CSAT score is the most important factor in college
admissions, most high school graduates are taking CSAT in their senior year, and many of them
spend more years retaking the exam if they are not satisfied with their scores. For example,
among 4,616,291 college applicants in 2019, approximately 22% were repeating examinees, not
high school seniors (Korean MOE & KEDI, 2019b).
Generally speaking, 4-year universities enjoy higher prestige and reputation compared to
2-year junior colleges in Korean society (Byun & Park, 2017). As shown in Byun and Park
(2017)’s work, socioeconomically advantaged groups of students are more likely to attend 4-year
universities rather than 2-year junior colleges. However, many prior studies have pointed out
qualitative differences even within 4-year universities (Byun & Kim, 2010; Kim, 2008; Kim &
Kim, 2013; Lee & Koh, 2003; Phang & Kim, 2002). Byun and Kim (2010) showed that family
SES had significant relations to not only whether students attend 4-year universities but also the
selectivity of the universities they attend.
In particular, universities located in Seoul, the capital city of Korea, are considered as the
most prestigious and selective higher education institutions. According to the comprehensive
university ranking of JoongAng Ilbo (2015), a major media company in Korea, majority (17) of
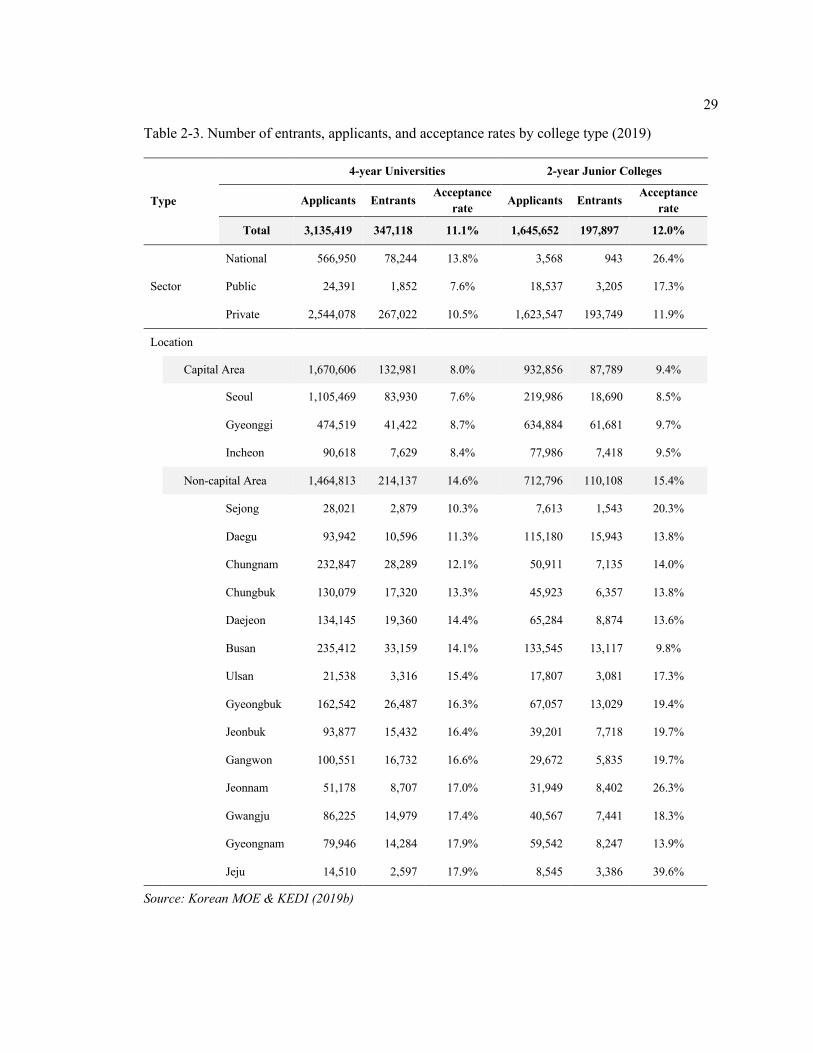
28
top 30 universities in Korea are located in the capital city (i.e., Seoul). This is due to differences
in industrial and economic development between the capital city and other cities in Korean
society. Due to this regional imbalance, the demand for education in Seoul and its suburbs (i.e.,
Gyeonggi and Incheon) is much higher than that in other cities (Lee & Koh, 2003). In 2019, more
than half of all college applicants applied to universities and colleges in the capital area and the
acceptance rate for those institutions (8% for 4-year universities and 9.4% for 2-year colleges)
were lower than that of other institutions in the non-capital area (14.6% for 4-year universities
and 15.4% for 2-year colleges) (Korean MOE & KEDI, 2019b, see Table 2-3). This shows higher
competition rate and selectivity of higher education institutions in the capital area in Korea,
compared to other institutions in the non-capital area. Table 2-3 presents the number of college
applicants and entrants and the acceptance rate by college sector and location.
This stratification in the higher education system in Korea is related to the concerns of
inequality in educational opportunity. Prior studies have empirically shown that higher SES
students are more likely to enter 4-year universities in the capital area rather than other 4-year
universities in the non-capital area, compared to lower SES students (Kim, 2008; Kim & Kim,
20133)). These socioeconomic disparities in entering more selective universities in the capital area
are also related to adult outcomes. According to Park (2015), the income level of students
graduating from more selective 4-year universities located in Seoul was much higher than other
students graduating from other 4-year universities outside Seoul and 2-year junior colleges. This
line of studies showing gaps in family background and future outcomes within 4-year universities
by its location implies the need for considering the location of the institutions when we discuss
stratification in higher education in Korea.
3) In Kim and Kim (2013)’s work, family SES had a positive but indirect effect on entering colleges in the
capital area through high school type.
29
Table 2-3. Number of entrants, applicants, and acceptance rates by college type (2019)
Type
4-year Universities 2-year Junior Colleges
Applicants Entrants Acceptance rate Applicants Entrants Acceptance
rate
Total 3,135,419 347,118 11.1% 1,645,652 197,897 12.0%
Sector
National 566,950 78,244 13.8% 3,568 943 26.4%
Public 24,391 1,852 7.6% 18,537 3,205 17.3%
Private 2,544,078 267,022 10.5% 1,623,547 193,749 11.9%
Location
Capital Area 1,670,606 132,981 8.0% 932,856 87,789 9.4%
Seoul 1,105,469 83,930 7.6% 219,986 18,690 8.5%
Gyeonggi 474,519 41,422 8.7% 634,884 61,681 9.7%
Incheon 90,618 7,629 8.4% 77,986 7,418 9.5%
Non-capital Area 1,464,813 214,137 14.6% 712,796 110,108 15.4%
Sejong 28,021 2,879 10.3% 7,613 1,543 20.3%
Daegu 93,942 10,596 11.3% 115,180 15,943 13.8%
Chungnam 232,847 28,289 12.1% 50,911 7,135 14.0%
Chungbuk 130,079 17,320 13.3% 45,923 6,357 13.8%
Daejeon 134,145 19,360 14.4% 65,284 8,874 13.6%
Busan 235,412 33,159 14.1% 133,545 13,117 9.8%
Ulsan 21,538 3,316 15.4% 17,807 3,081 17.3%
Gyeongbuk 162,542 26,487 16.3% 67,057 13,029 19.4%
Jeonbuk 93,877 15,432 16.4% 39,201 7,718 19.7%
Gangwon 100,551 16,732 16.6% 29,672 5,835 19.7%
Jeonnam 51,178 8,707 17.0% 31,949 8,402 26.3%
Gwangju 86,225 14,979 17.4% 40,567 7,441 18.3%
Gyeongnam 79,946 14,284 17.9% 59,542 8,247 13.9%
Jeju 14,510 2,597 17.9% 8,545 3,386 39.6%
Source: Korean MOE & KEDI (2019b)
30
In sum, higher education in Korea has experienced rapid quantitative expansion and
qualitative differentiation over the past decades. Currently, more than 70% of high school
graduates entered higher education institutions in 2019 (Korean MOE & KEDI, 2019a). Despite
increasing educational opportunities, Korean higher education system raises concerns about
inequality for several reasons. First, high reliance on private institutions increases the cost of
education for parents and students. Second, Korean higher education system is highly stratified
by institution’s type and location. Generally, 4-year universities have higher reputation and
prestige compared to 2-year junior colleges. Regional imbalance in education demand also leads
to higher competition rates in admission to colleges in the capital area in Korea, compared to
other colleges in the non-capital area. Limited educational opportunities for selective college
education are largely occupied by students from high SES families. Considering this stratified
system of higher education in Korea, the current study examines socioeconomic disparities in
educational transition to different types of college enrollment: 4-year universities in the capital
area, 4-year universities in the non-capital area, 2-year junior colleges, and no college enrollment.
Research Questions and Hypotheses
As described above, this study deals with the following two research questions: 1) How
do students' educational transitions from middle schools to high schools vary by parental SES? 2)
How do students' educational transitions from high schools to higher education by parental SES?
To answer the research questions, this study considers three different types of high schools (i.e.,
selective academic high schools, non-selective academic high schools, and vocational high
schools) and four different types of college enrollment (i.e., 4-year university in the capital area,
4-year university in the non-capital area, 2-year junior colleges, and no college enrollment),
considering the horizontal diversification in the upper secondary and higher education in South

31
Korea. Also, this study does not include high school dropout cases, because high school dropout
rate in Korea is extremely low (i.e., 1.6% as of 2019) (Korean MOE & KEDI, 2019b). Based on
the prior studies and contextual background of Korea described above, I pose corresponding
hypotheses of what I expected to observe based on prior studies for each research question,
Research Question 1. How do students' educational transitions from middle schools to
high schools vary by parental SES?
Hypothesis 1. Considering socioeconomic disparities between high school students by
school type in Korea revealed by a large body of Korean prior studies (Chang, 2007; Kim, 2004;
Kim & Ryu, 2008; Moon, 2016; Park & Min, 2009), the regression models will show significant
socioeconomic disparities in attending more selective high schools (i.e., selective academic >
non-selective academic > vocational). Also, EMI testing based on the predicted probabilities will
show that students’ modal destination in the transition from middle school to different types of
high school will be different by their parental SES, supporting EMI hypothesis. Students from
socioeconomically advantaged families will typically attend more selective high schools,
compared to their counterparts from socioeconomically disadvantaged families.
Research Question 2. How do students' educational transitions from high schools to
higher education vary by parental SES?
Hypothesis 2-1. Considering the quantitative expansion and qualitative differentiation in
Korean higher education, students’ educational transitions from high schools to higher education
will be different depending on the outcome variable. First, given that more than 70% of Korean
high school graduates entered higher education institutions in 2019 (Korean MOE & KEDI,
2019a), socioeconomic disparities in college entry will not be significant in the regression
models. EMI testing based on the predicted probabilities will also show that most high school
graduates will typically enter colleges regardless of their parental SES, supporting MMI.

32
Hypothesis 2-2. In contrast, in terms of different types of college enrollment,
socioeconomic disparities will be significant in attending more selective universities in the
regression models, reflecting on the stratified higher education system in Korea (Byun & Kim,
2010; Kim, 2008; Kim & Kim, 2013; Park, 2015). EMI testing based on the predicted
probabilities will also show that students’ modal destination in the transition from high schools to
higher education will be different by their parental SES, supporting EMI hypothesis. Students
from socioeconomically advantaged families will typically attend more selective institutions,
compared to their counterparts from socioeconomically disadvantaged families.
33
Chapter 3
Methodology
Data
Korean Educational Longitudinal Study of 2005
This study used nationally representative data for middle school students from the Korean
Educational Longitudinal Study of 2005 (KELS: 05) conducted by the Korean Educational
Development Institute (KEDI), a government-funded educational research institute in Korea.
KELS:05 provides information on students’ educational pathways from lower secondary
education to higher education with different types of institutions, as well as their demographic
characteristics, academic performance, family background, and school characteristics. I chose
KELS:05 because it provides the information on more differentiated types of high schools where
the sampled students had attended, while most other nationally representative data in Korea
consider only two general types of high schools (i.e., academic vs. vocational). Besides, KELS:05
provides students’ CSAT levels for four years after high school graduation, which is the most
influential factor determining college admissions. As described earlier, many Korean students
spend another year or more to retake the CSAT when they are not satisfied with their scores.
Accordingly, it is necessary to use the information on students’ college enrollment for at least
several years after graduating from high school to understand the intricate patterns of
matriculation in Korea. In this regard, KELS:05 allows researchers to examine how students’
college matriculation is related to their family background using data for an extended period as
well as student’s CSAT score as an important control variable.

34
Sampling Procedure and Sample Size
KELS:05 began in 2005 with a nationally representative sample of approximately 6,908
seventh graders (i.e., the first year in middle school) in 150 middle schools in Korea. The sampled
students accounted for approximately 1% of 703,914 students who were in the first year of 2,929
middle schools, which accounted for about 5% of 2,929 middle schools in Korea in 2005. Using
stratified cluster random sampling, KELS:05 considered city sizes as a first-stage stratum and
sampled schools as a cluster within each stratum. After that, KELS:05 randomly sampled
approximately 50 students for each sampled school as well as their parents and teachers, resulting
in 6,908 seventh graders and their parents participating in the first survey in 2005. Table 3-1
shows the number of population and samples for KELS:05 by the size of cities, sixteen provinces
across Korea, and school types.
KELS:05 had followed the sampled students every year by 2012 (i.e., two years after
high school), and since 2012 it has followed students every two years. In every survey year, the
number of sampled students had changed because some portion of sampled students withdrew or
deferred their participation in the survey. Table 3-2 presents the number and percentage of
sampled students who participated in and withdrew the survey from 2005 through 2014. The
attrition rate in 2006 was 0.7%, which means that 49 students among 6,908 sampled students did
not participate in the second year of the survey in 2006. The attrition rate slightly increased to
2.5% in 2009 and 2.2% in 2010, while the rate largely increased after 2010. This is because the
status of sampled students became more diverse after 2010, as most sampled students graduated
from high school. The current study used the data from the base year (2005) through the ninth
follow-up survey (2014, four years after high school), because KELS:05 provides information on
students’ CSAT scores until 2014. In conclusion, among 6,908 sampled students, this study used
data of 5,025 students whose information about their educational pathways was identified.

35
Table 3-1. Number of sampled schools and students of KELS:05
Schools Students
Population Sample % Population Sample %
Total 2,929 150 5.12% 703,914 6,908 0.98%
City size
Capital city (Seoul) 362 26 7.18% 130,012 1,237 0.95%
Large cities 558 38 6.81% 191,116 1,942 1.02%
Medium cities 1,233 66 5.35% 330,000 3,094 0.94%
Small cities 776 20 2.58% 52,786 635 1.20%
Province
Seoul 362 26 7.18% 130,012 1237 0.95%
Busan 166 10 6.02% 50,648 523 1.03%
Daegu 118 7 5.93% 39,026 350 0.90%
Incheon 114 8 7.02% 42,020 401 0.95%
Gwangju 74 5 6.76% 23,871 261 1.09%
Daejeon 75 5 6.67% 22,747 256 1.13%
Ulsan 51 3 5.88% 18,808 151 0.80%
Gyeonggi 472 34 7.20% 165,398 1,659 1.00%
Kangwon 160 5 3.13% 20,558 160 0.78%
Chungbuk 123 7 5.69% 21,570 278 1.29%
Chungnam 187 7 3.74% 26,126 243 0.93%
Jeonbuk 201 5 2.49% 26,659 229 0.86%
Jeonnam 247 7 2.83% 26,173 271 1.04%
Kyungbuk 282 9 3.19% 34,966 372 1.06%
Kyungnam 255 10 3.92% 46,745 443 0.95%
Jeju 42 2 4.76% 8,587 74 0.86%
School Type
Public 2,270 122 5.37% 574,169 5,497 0.96%
Private 659 28 4.25% 129,745 1,411 1.09%
Source: Namgung, Kim, Park, Song, & Kim (2018:47).
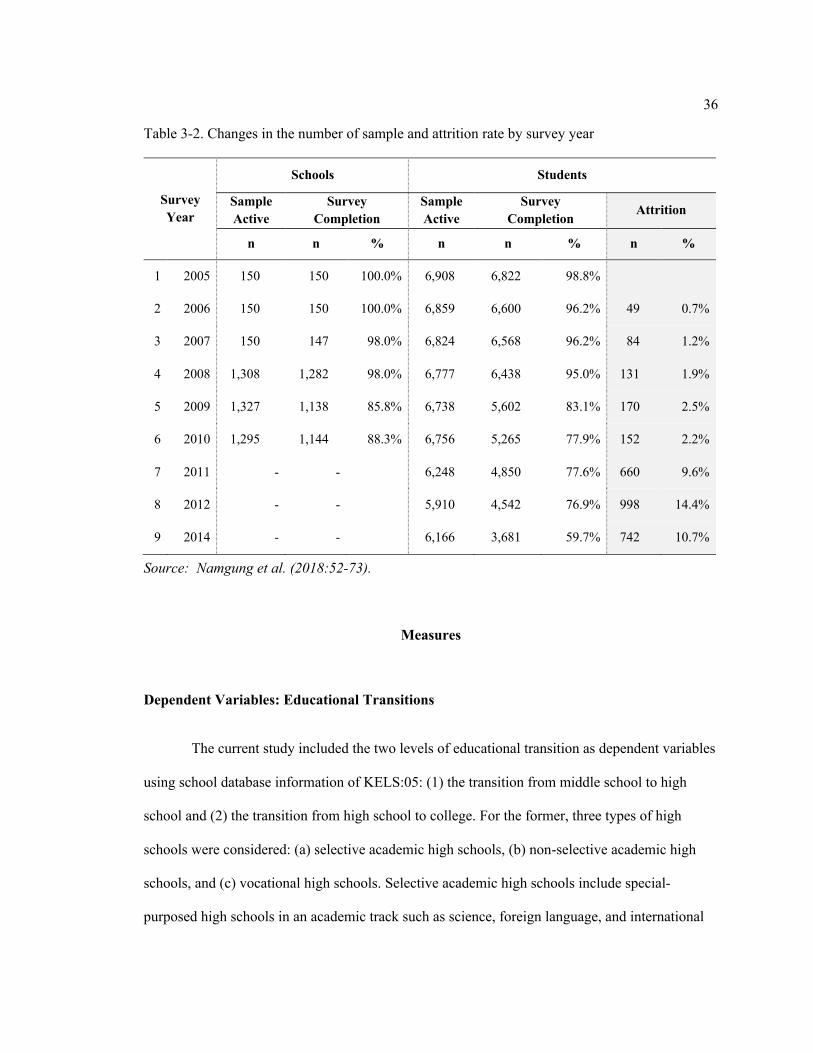
36
Table 3-2. Changes in the number of sample and attrition rate by survey year
Survey Year
Schools Students
Sample Active
Survey Completion
Sample Active
Survey Completion
Attrition
n n % n n % n %
1 2005 150 150 100.0% 6,908 6,822 98.8%
2 2006 150 150 100.0% 6,859 6,600 96.2% 49 0.7%
3 2007 150 147 98.0% 6,824 6,568 96.2% 84 1.2%
4 2008 1,308 1,282 98.0% 6,777 6,438 95.0% 131 1.9%
5 2009 1,327 1,138 85.8% 6,738 5,602 83.1% 170 2.5%
6 2010 1,295 1,144 88.3% 6,756 5,265 77.9% 152 2.2%
7 2011 - - 6,248 4,850 77.6% 660 9.6%
8 2012 - - 5,910 4,542 76.9% 998 14.4%
9 2014 - - 6,166 3,681 59.7% 742 10.7%
Source: Namgung et al. (2018:52-73).
Measures
Dependent Variables: Educational Transitions
The current study included the two levels of educational transition as dependent variables
using school database information of KELS:05: (1) the transition from middle school to high
school and (2) the transition from high school to college. For the former, three types of high
schools were considered: (a) selective academic high schools, (b) non-selective academic high
schools, and (c) vocational high schools. Selective academic high schools include special-
purposed high schools in an academic track such as science, foreign language, and international
37
high schools. These selective academic high schools are allowed to select students using their
own admission policies. Contrary, non-selective academic high schools (i.e., general high schools
in Korea) are not allowed to select students, and students are randomly assigned to this type of
high school. Vocational high schools include specialized high schools in Korea. For the second
transition, I included four different types of college enrollment considering college type and
location: (a) 4-year university in the capital area, (b) 4-year university in the non-capital area, (c)
2-year junior college, and (d) no college enrollment.4)
Independent Variables: Parental Socioeconomic Status
For parental socioeconomic status (SES), as a key independent variable of this study, I
included (a) parental occupation, (b) parental income, and (c) parental education based on
parental responses in the base year of survey in 2005. Parental occupation was measured as a
dichotomous variable indicating whether parents were working in high-ranking management or
professional occupations (= 1) or not (= 0), using parents' responses to the question about their
occupation. For family income, I logged the average monthly family income reported by parents
to resemble the normal distribution. For parental education, I recoded parents’ response about
their educational attainment into the years of schooling: middle school or less (= 9), high school
(= 12), two-year junior college (= 14), four-year university (= 16), and an advanced degree (=
18). If parents had different levels of occupation and education, I used the response of the person
with a higher level of occupation and education for the analyses.
4) I excluded students who attended foreign colleges (0.1%) and remote colleges (1.3%) because it was not
available to distinguish the type and location of institutions.

38
Control Variables
I also controlled for students’ other family characteristics (i.e., family structure and the
number of siblings), gender, and prior academic achievement. Family structure was measured by
a dichotomous variable indicating whether parents were married and living together (= 1) or not
(= 0), based on parental report. The number of siblings was measured by the total number of
children reported by parents. Student’s gender was measured by a dichotomous variable using
students’ reports on their sex (female = 1, male = 0). Student’s prior academic achievement was
measured by two different types of achievement test scores. First, for the transition from middle
school to high school, I controlled for students’ test scores at the last year of middle school (i.e.,
ninth grade) measured by the average score of three subjects including Korean, foreign language,
and mathematics. Second, for the transition from high school to college, I controlled for students’
CSAT levels, as measured by the sum of three subjects including Korean, foreign language, and
mathematics. CSAT level of each subject had a range of 1 (= lowest level) to 9 (= highest level).
When a student participated in CSAT for more than two years, I used the student’s score in the
most recent year in the analyses.
Analytic Strategies
For analyses, first, I conducted descriptive statistics to investigate the background
characteristics of students by three types of high schools and four types of college enrollment.
Second, I conducted multinomial logistic regression analyses to examine socioeconomic
differences in the first educational transition from middle schools to three different types of high
schools: (a) selective academic high schools, (b) non-selective academic high schools, and (c)
vocational high schools. Given that students' prior academic achievement is an important factor in

39
entering selective academic high schools in Korea (Kim & Kim, 2013; Park & Min, 2009), I
estimated two separate analytical models. The first model included all independent and control
variables except for students’ academic achievement in the last year of middle school. And the
second model additionally included students' achievement as one of the control variables.
Third, for the second transition from high schools to colleges, I examined socioeconomic
disparities in the likelihood of enrolling in any kind of college using logistic regression. And then,
using multinomial logistic regression, I examined socioeconomic differences in the second
transitions from high schools to four different types of college enrollment: (a) 4-year university in
the capital area, (b) 4-year university in the non-capital area, (c) 2-year college, and (d) no college
enrollment. Given that high school type and students’ prior academic achievement are important
factors in college admission in Korea (Byun & Park, 2017; Kim & Kim, 2013), I estimated three
analytical models. The first model included all independent and control variables except for
students' CSAT levels and high school types. Subsequently, I added students’ CSAT levels and
high school types to the second and the final models, respectively, to examine whether parental
SES has a significant relation to college transition after controlling those critical factors.
Finally, following Lucas (2001), based on the logistic and multinomial coefficients
estimated above, I calculated the predicted probabilities of different educational transitions for
students from the “advantaged” families and their counterparts from “disadvantaged” families.
Lucas emphasized using predicted probabilities rather than regression coefficient in order to
assess EMI. This was because EMI posed that the socioeconomic advantages are sufficient and
effective if it can move people over thresholds. Yet, “regression-type coefficients by themselves
cannot reveal whether social background moves people over threshold (Lucas, 2001: 1671).”
To replace missing data for the independent and control variables, I employed multiple
imputation using the ICE module in Stata. In order to enhance the stability of the estimates, I
generated 25 imputed datasets. Specifically, following recommendations set forth by Johnson and

40
Young (2011), I included all dependent and independent variables in the imputed model to
predict missing values. Then, I pooled estimates from the 25 imputed datasets to report the
findings.
41
Chapter 4
Results
Descriptive Findings
Educational Pathways by School Type
Figure 4-1 shows educational pathways among the 5,025 students. For the first
educational transition from middle school to high school, among 5,025 middle school students,
the majority of students (74%) went to non-selective high schools, while 23.8% went to
vocational high schools. Only 1.5% of sampled students went to selective high schools. For the
second educational transition from high school to college, the majority of students (89.9%)
enrolled in a college, while only 11.1% of students did not enroll in any kind of college. Among
the students who enrolled in a college, 28.5% attended 2-year junior colleges, 39.2% attended 4-
year universities in the non-capital area, and 21.2% attended 4-year universities in the capital
area.
Considering the type of high school, among students who attended selective academic
high schools, the majority (73.3%) went to 4-year universities in the capital area and 18.7% went
to 4-year universities in the non-capital area. Only 2.7% of them went to 2-year colleges and
5.3% of them did not enroll in any kind of college. This means that more than 90% of students
from selective academic high school entered 4-year universities in Korea. For non-selective
academic high schools, 23.7% and 45.6% entered 4-year universities in the capital and non-
capital areas, respectively. 23.8% went to 2-year colleges. Remaining 6.9% of students from non-
selective academic high schools did not enroll in any kind of college. Students from vocational

42
high schools showed a different pattern. The majority of them (44.7%) entered 2-year colleges.
10.1% and 20.7% of them entered 4-year universities in the capital and non-capital areas,
respectively. Students with no college enrollment was 24.5% for students from vocational high
schools, which was much higher than other students from selective (5.3%) and non-selective
(6.9%) academic high schools. These findings descriptively show different patterns of
educational pathways of students by school type. In other words, students from selective
academic high schools typically went to 4-year universities in the capital area, and students from
non-selective academic high schools typically went to 4-year universities in the non-capital area,
while students from vocational high schools typically went to 2-year colleges in Korea, without
controlling for other factors.
Figure 4-1. Flowchart showing educational pathways for cohorts who were seventh graders in 2005 with percentages and the number of students who enrolled in each type of institution. Note. t1 = transition from middle school to high school; t2 = transition from high school to higher education. Source: KELS:05
43
Background Characteristics by Different Types of High School and College Enrollment5)
Background characteristics of students were also different by the type of high school and
college enrollment. Table 4-1 shows the descriptive statistics for the independent variables
included in the analyses by the type of high school and college enrollment. Considering the type
of high school, students attending selective academic high schools showed the highest level of
parental SES, followed by students from non-selective academic and vocational high schools. The
differences in parental SES by high school type were statistically significant, without controlling
for other factors. In specific, 37.3% of students from selective academic high schools had parents
with high-ranking management or professional jobs, while 19.6% of students from non-selective
academic high schools had parents with those high-status jobs. Among students from vocational
students, only 5.6% had parents with those high-status jobs. The average years of parental
education were 15.4, 13.8, and 12.4 for students from selective academic, non-selective
academic, and vocational high schools, respectively. The level of family income (i.e., logged
monthly family income) was also higher among students from selective academic high schools
(6.1) than students from non-selective academic (5.8) and vocational (5.4) high schools.
In terms of other family characteristics, students who attended selective academic high
schools showed advantaged positions compared to their counterparts. The percentage of students
from two-parent families was 94.7% and 93.8% for selective and non-selective academic high
school students, respectively. In contrast, the corresponding number was 82.8% for vocational
high school students, which was significantly less than that of academic high school students. The
average number of siblings was 2.1, 2.2, and 2.3 for selective academic, non-selective academic,
and vocational high school students, respectively, which was statistically significant differences
5) See the Appendix A for the descriptive statistics of all variables used in the analyses.

44
among the three groups of students. In addition, as expected, students who attended selective
academic high schools showed the highest level of academic achievement. The average test
scores at the last year of middle school (i.e., ninth grade) measured by the average score of three
subjects including Korean, English, and mathematics were 79.9 for students who entered
selective academic high schools. The corresponding scores were 61.2 and 40.2 for students who
entered non-selective academic and vocational high schools, respectively. Students’ CSAT level,
measured by the sum of three subjects including Korean, English, and mathematics, was also the
highest among students from selective academic high schools. The average level of CSAT of
selective academic high school students was 7.8, which was much higher than that of non-
academic (5.7) and vocational (4.4) high school students.
The second panel of Table 4-1 shows descriptive statistics for the family and individual
student’s characteristics by different types of college enrollment. Students attending 4-year
universities in the capital area in Korea showed the highest level of parental SES compared to
other students. The percentage of parents having high-ranking management or professional
occupations was 27.6% for students attending 4-year universities in the capital area, followed by
students attending 4-year universities in the non-capital area (17.4%), 2-year junior colleges
(9.6%), and students with no college enrollment (9.8%). The difference between students
attending 2-year junior colleges and non-college students was not statistically significant. The
average years of parental education was 14.4 among students attending 4-year universities in the
capital area, which was higher than those of other students from 4-year universities in the non-
capital area (13.7), 2-year junior colleges (12.8) and non-college students (12.7). Family income
was also higher among students from 4-year universities in the capital area (5.9), compared to
those of other students from 4-year universities in the non-capital area (5.7), 2-year junior
colleges (5.5) and non-college students (5.4).
45
Regarding other family characteristics, the percentages of students from two-parent
families were 95.2% and 93.4% for students attending 4-year universities in the capital area and
non-capita area, respectively. The corresponding percentages were 89.4% and 80.0% for students
attending 2-year colleges and non-college students. Students attending 4-year universities in the
capital area had the lowest number of siblings on average (2.1), followed by students from 4-year
universities in the non-capital area (2.2), 2-year junior colleges (2.3), and students with no college
enrollment (2.3). In terms of academic achievement, as expected, students entering 4-year
universities in the capital area showed the highest level of academic achievement at 9th grade
(70.3) and CSAT (6.6) compared to other students. Finally, the percentage of female students was
highest among 2-year college students (53.0%), followed by students entering 4-year universities
in the capital area (50.8%) and non-capital areas (44.4%), and non-college students (42.0%).

46 Table 4-1. Descriptive statistics for the independent variables by the type of high school and college enrollment
Type of High School Type of College Enrollment
Total % Imputed Vocational Non-selective
academic Selective academic
No college 2-Year 4-Year in Non-capital
4-Year in Capital
Variable M/% SD M/% SD M/% SD M/% SD M/% SD M/% SD M/% SD M/% SD Range
Parental occupation***c 5.6% - 19.6% - 37.3% 0.5 9.8% - 9.6% - 17.4% - 27.6% - 16.5% - 0-1 2.5%
Parental education*** 12.4 2.0 13.8 2.3 15.4 2.1 12.7 2.3 12.8 2.1 13.7 2.2 14.4 2.3 13.5 2.3 9-18 2.2%
Family income (logged)*** 5.4 0.7 5.8 0.6 6.1 0.5 5.4 0.8 5.5 0.7 5.7 0.6 5.9 0.5 5.7 0.6 0-7.8 8.8%
Two-parents family***b 82.8% - 93.8% - 94.7% 0.2 80.0% - 89.4% - 93.4% - 95.2% - 91.2% - 0-1 4.1%
Number of siblings***c 2.3 0.8 2.2 0.7 2.1 0.6 2.3 0.9 2.3 0.7 2.2 0.7 2.1 0.6 2.2 0.7 1-9 4.7%
Female***a 48.2% - 47.3% - 56.0% 0.5 39.2% - 53.0% - 44.4% - 50.8% - 47.6% - 0-1 0.0%
Academic achievement at 9th grade*** 40.2 16.7 61.2 20.2 79.9 20.0 42.0 18.7 46.6 17.9 60.1 19.7 70.3 20.1 56.4 21.6 5-100 1.7%
CSAT level*** 4.4 1.4 5.7 1.5 7.8 1.2 4.6 1.5 4.7 1.3 5.6 1.4 6.6 1.5 5.4 1.6 1-9 23.5%
N (%) 1,206
(24.0%) 3,744
(74.5%) 75
(1.5%) 558
(11.1%) 1,433
(28.5%) 1,970
(39.2%) 1,064
(21.2%) 5,025
(100.0%)
a indicates non-significant differences by high school type.
b indicates non-significant differences between non-selective academic and selective academic high school students.
c indicates non-significant differences between non-college and 2-year junior college students.
d indicates non-significant differences across 2-year junior college students.
*** p < .001

47
Socioeconomic Differences in the Transition to High School
Table 4-2 presents findings of multinomial logistic regression models predicting the
likelihood of attending three different types of high school. The first two panels of Model 1 show
that students from higher SES families were more likely to attend academic high schools relative
to vocational high schools, compared to students from lower SES families. In particular, in Model
1, having parents with more years of education was associated with attending selective (e.47 =
1.60) or non-selective (e.19 = 1.20) academic high schools rather than vocational high schools.
Having parents with higher income was also associated with attending selective (e1.12 = 3.06) or
non-selective (e.48 = 1.61) academic high schools rather than vocational high schools. The first
two panels of Model 2, which additionally controlled for students’ academic achievement at 9th
grade, also show similar findings. In Model 2, the effects of parental education and income were
slightly reduced but still significant. Having parents with more years of education was still
associated with attending selective (e.32 = 1.38) or non-selective (e.12 = 1.12) academic high
schools rather than vocational high schools. Having parents with higher income was also
associated with attending selective (e.95 = 2.60) or non-selective (e.39 = 1.47) academic high
schools rather than vocational high schools, even after controlling for academic achievement.
The third panels of Model 1 and 2 show that, among academic high schools, students
from higher SES families were more likely to attend selective academic high schools rather than
non-selective academic high schools, compared to lower SES students. In Model 1, the odds of
attending selective academic high schools were higher among students whose parents had more
years of education (e.29 = 1.33) or higher income (e.64 = 1.90) than the odds of their counterparts
whose parents had less years of education or lower income. Model 2 shows that the odds of
attending selective academic high schools were still higher among students whose parents had
more years of education (e.21 = 1.12) or higher income (e.57 = 1.76) than the odds of their
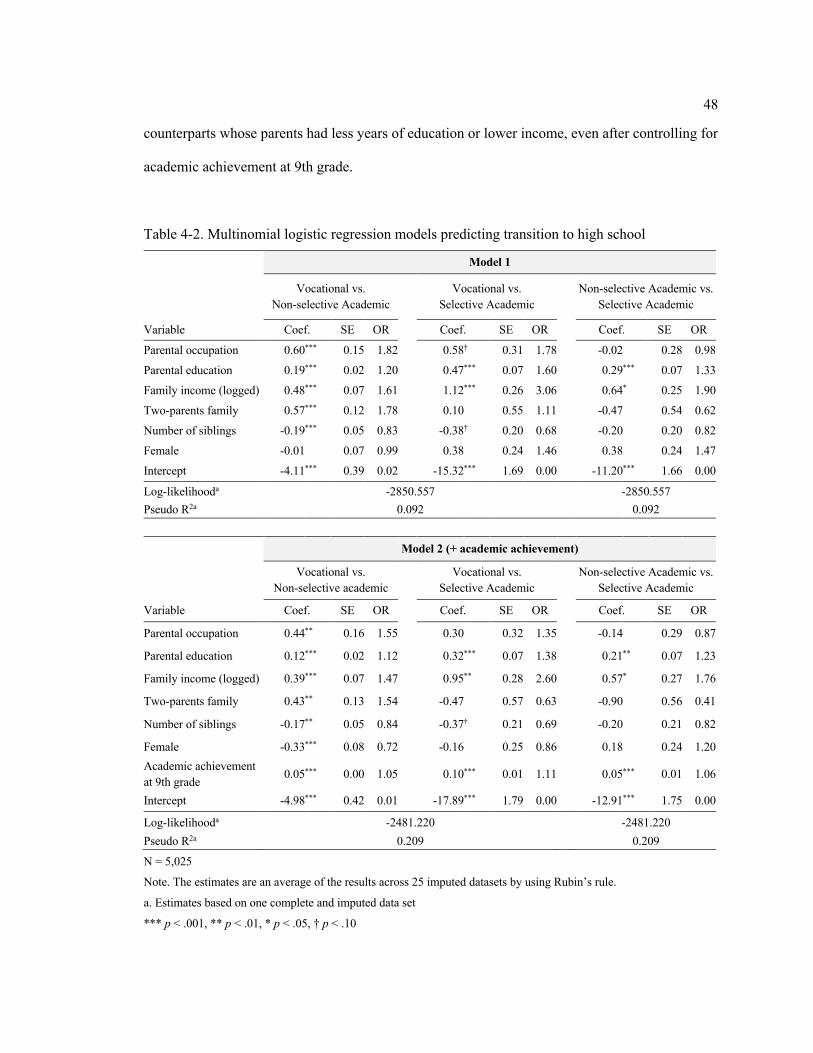
48
counterparts whose parents had less years of education or lower income, even after controlling for
academic achievement at 9th grade.
Table 4-2. Multinomial logistic regression models predicting transition to high school
Model 1
Vocational vs. Non-selective Academic Vocational vs.
Selective Academic Non-selective Academic vs.
Selective Academic
Variable Coef. SE OR Coef. SE OR Coef. SE OR
Parental occupation 0.60 *** 0.15 1.82 0.58 † 0.31 1.78 -0.02 0.28 0.98
Parental education 0.19 *** 0.02 1.20 0.47 *** 0.07 1.60 0.29 *** 0.07 1.33
Family income (logged) 0.48 *** 0.07 1.61 1.12 *** 0.26 3.06 0.64 * 0.25 1.90
Two-parents family 0.57 *** 0.12 1.78 0.10 0.55 1.11 -0.47 0.54 0.62
Number of siblings -0.19 *** 0.05 0.83 -0.38 † 0.20 0.68 -0.20 0.20 0.82
Female -0.01 0.07 0.99 0.38 0.24 1.46 0.38 0.24 1.47
Intercept -4.11 *** 0.39 0.02 -15.32 *** 1.69 0.00 -11.20 *** 1.66 0.00
Log-likelihooda -2850.557 -2850.557 Pseudo R2a 0.092 0.092
Model 2 (+ academic achievement)
Vocational vs. Non-selective academic
Vocational vs. Selective Academic
Non-selective Academic vs. Selective Academic
Variable Coef. SE OR Coef. SE OR Coef. SE OR
Parental occupation 0.44 ** 0.16 1.55 0.30 0.32 1.35 -0.14 0.29 0.87
Parental education 0.12 *** 0.02 1.12 0.32 *** 0.07 1.38 0.21 ** 0.07 1.23
Family income (logged) 0.39 *** 0.07 1.47 0.95 ** 0.28 2.60 0.57 * 0.27 1.76
Two-parents family 0.43 ** 0.13 1.54 -0.47 0.57 0.63 -0.90 0.56 0.41
Number of siblings -0.17 ** 0.05 0.84 -0.37 † 0.21 0.69 -0.20 0.21 0.82
Female -0.33 *** 0.08 0.72 -0.16 0.25 0.86 0.18 0.24 1.20 Academic achievement at 9th grade 0.05 *** 0.00 1.05 0.10 *** 0.01 1.11 0.05 *** 0.01 1.06
Intercept -4.98 *** 0.42 0.01 -17.89 *** 1.79 0.00 -12.91 *** 1.75 0.00
Log-likelihooda -2481.220 -2481.220 Pseudo R2a 0.209 0.209
N = 5,025
Note. The estimates are an average of the results across 25 imputed datasets by using Rubin’s rule.
a. Estimates based on one complete and imputed data set
*** p < .001, ** p < .01, * p < .05, † p < .10
49
Socioeconomic Differences in the Transition to Higher Education
College Entry
Table 4-3 presents the findings of logistic regression models predicting the likelihood of
college entry. In Model 1, having parents with more years of education (e.11 = 1.12) and higher
income (e.30 = 1.35) were associated with higher odds of enrolling in college relative to no college
enrollment. Model 2 additionally controlled for students’ academic achievement level, measured
by the CSAT level. As expected, students’ CSAT level was significant relation to their college
entry. In Model 2, parental education and income had reduced but still significant relations to
students’ college entry. In contrast, in Model 3, which additionally included high school type
attended, parental education and family income were no longer significant. Instead, high school
type had a significant effect on students’ college entry. Attending vocational high schools rather
than non-selective academic high schools was associated with lower likelihood of college entry
(e-1.05 = 0.35).

50
Table 4-3. Logistic regression models predicting transition to higher education: College entry
Model 1 Model 2 Model 3
Variable Coef. SE OR Coef. SE OR Coef. SE OR
Parental occupation 0.10 0.17 1.10 -0.01 0.17 0.99 -0.07 0.17 0.93
Parental education 0.11 *** 0.02 1.12 0.07 ** 0.03 1.07 0.04 † 0.03 1.04
Family income (logged) 0.30 *** 0.08 1.35 0.23 ** 0.08 1.26 0.16 † 0.08 1.17
Two-parents family 0.76 *** 0.14 2.13 0.73 *** 0.14 2.07 0.62 *** 0.15 1.86
Number of siblings -0.09 0.06 0.91 -0.08 0.06 0.92 -0.04 0.06 0.96
Female 0.41 *** 0.09 1.50 0.36 *** 0.09 1.43 0.39 *** 0.10 1.47
CSAT level 0.31 *** 0.04 1.37 0.22 *** 0.04 1.25
High school typea
Vocational -1.05 *** 0.11 0.35
Selective academic -0.36 0.53 0.70
Intercept -1.71 *** 0.45 0.18 -2.28 *** 0.47 0.10 -0.73 0.51 0.48
Log-likelihoodb -1669.890 -1612.644 -1561.933
Pseudo R2b 0.047 0.080 0.109
N = 5,025
Note. The estimates are an average of the results across 25 imputed datasets by using Rubin’s rule.
a. The reference group was non-selective academic high school.
b. Estimates based on one complete and imputed data set
*** p < .001, ** p < .01, † p < .10
Type of College Enrollment
Table 4-4 presents results of multinomial logistic regression models predicting the
likelihood of four different types of college enrollment. The results show socioeconomic
disparities in entering 4-year universities in the capital area. In Model 1, higher levels of parental
education (e.07 = 1.08) and income (e.38 = 1.47) were associated with higher likelihood of
attending 4-year universities in the capital area, relative to 4-year universities in the non-capital
area. Having parents with high-ranking management or professional jobs was also related to
higher odds of attending 4-year universities in the capital area relative to 4-year universities in the
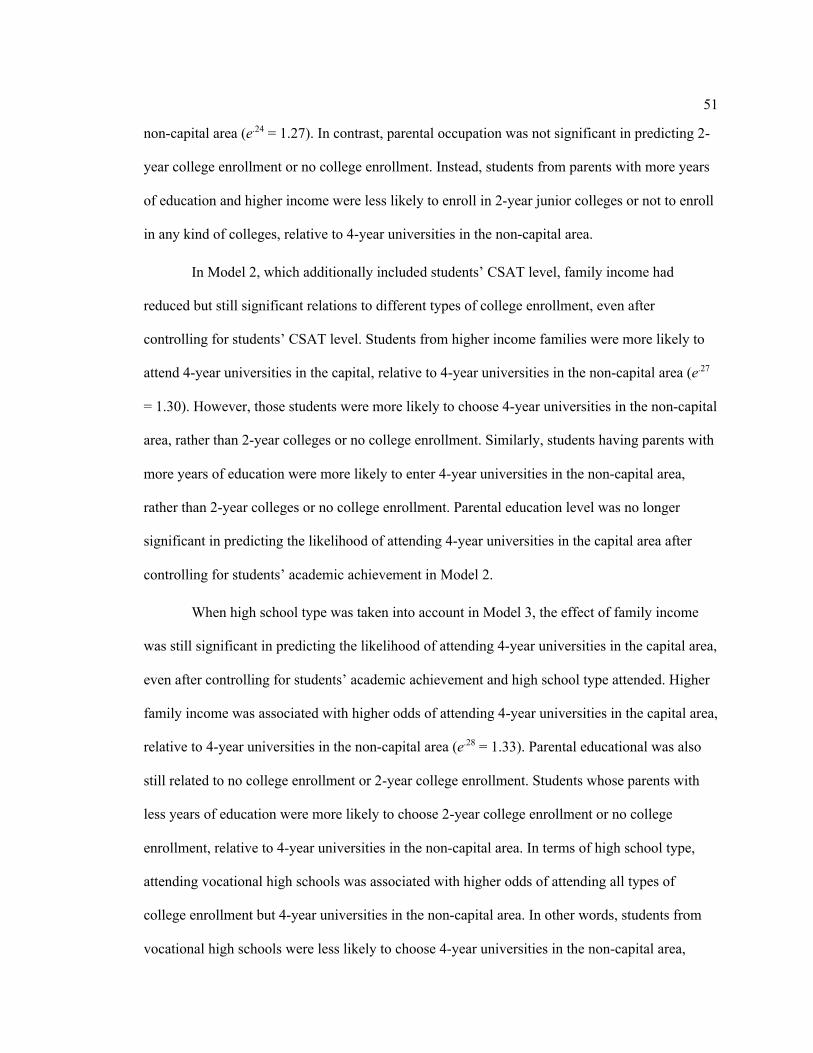
51
non-capital area (e.24 = 1.27). In contrast, parental occupation was not significant in predicting 2-
year college enrollment or no college enrollment. Instead, students from parents with more years
of education and higher income were less likely to enroll in 2-year junior colleges or not to enroll
in any kind of colleges, relative to 4-year universities in the non-capital area.
In Model 2, which additionally included students’ CSAT level, family income had
reduced but still significant relations to different types of college enrollment, even after
controlling for students’ CSAT level. Students from higher income families were more likely to
attend 4-year universities in the capital, relative to 4-year universities in the non-capital area (e.27
= 1.30). However, those students were more likely to choose 4-year universities in the non-capital
area, rather than 2-year colleges or no college enrollment. Similarly, students having parents with
more years of education were more likely to enter 4-year universities in the non-capital area,
rather than 2-year colleges or no college enrollment. Parental education level was no longer
significant in predicting the likelihood of attending 4-year universities in the capital area after
controlling for students’ academic achievement in Model 2.
When high school type was taken into account in Model 3, the effect of family income
was still significant in predicting the likelihood of attending 4-year universities in the capital area,
even after controlling for students’ academic achievement and high school type attended. Higher
family income was associated with higher odds of attending 4-year universities in the capital area,
relative to 4-year universities in the non-capital area (e.28 = 1.33). Parental educational was also
still related to no college enrollment or 2-year college enrollment. Students whose parents with
less years of education were more likely to choose 2-year college enrollment or no college
enrollment, relative to 4-year universities in the non-capital area. In terms of high school type,
attending vocational high schools was associated with higher odds of attending all types of
college enrollment but 4-year universities in the non-capital area. In other words, students from
vocational high schools were less likely to choose 4-year universities in the non-capital area,

52
relative to 4-year universities in the capital area, 2-year college, and no college enrollment,
compared to students from non-selective academic high schools. In contrast, students from
selective academic high schools were more likely to enter 4-year universities in the capital area or
not to enroll in any kind of college relative to 4-year universities in the non-capital area,
compared to students from non-selective academic high schools.
Table 4-4. Multinomial logistic regression models predicting transition to higher education: Type
of college enrollment
Model 1a
No College Enrollment 2-year Junior College 4-year Universities in Capital area
Variable Coef. SE OR Coef. SE OR Coef. SE OR
Parental occupation 0.00 0.17 1.00 -0.12 0.12 0.88 0.24 * 0.11 1.27
Parental education -0.15 *** 0.03 0.86 -0.16 *** 0.02 0.86 0.07 *** 0.02 1.08
Family income (logged) -0.35 *** 0.09 0.71 -0.23 ** 0.07 0.80 0.38 *** 0.09 1.47
Two-parents family -0.84 *** 0.16 0.43 -0.18 0.14 0.83 -0.05 0.18 0.96
Number of siblings 0.10 0.07 1.10 0.06 0.05 1.06 -0.14 * 0.06 0.87
Female -0.22 * 0.10 0.80 0.33 *** 0.07 1.39 0.29 *** 0.08 1.34
Intercept 3.29 *** 0.51 26.75 2.90 *** 0.40 18.14 -3.71 *** 0.50 0.02
Log-likelihoodc -6220.28 Pseudo R2c 0.05
Model 2a (+ academic achievement)
No College Enrollment 2-year Junior College 4-year Universities in Capital area
Variable Coef. SE OR Coef. SE OR Coef. SE OR
Parental occupation 0.10 0.18 1.11 -0.03 0.13 0.97 0.13 0.11 1.14
Parental education -0.11 *** 0.03 0.90 -0.11 *** 0.02 0.89 0.01 0.02 1.01
Family income (logged) -0.28 ** 0.09 0.76 -0.15 * 0.07 0.86 0.27 ** 0.09 1.30
Two-parents family -0.81 *** 0.17 0.45 -0.15 0.15 0.86 -0.13 0.19 0.88
Number of siblings 0.08 0.07 1.09 0.05 0.05 1.05 -0.12 † 0.06 0.89
Female -0.16 0.10 0.85 0.40 *** 0.07 1.49 0.27 ** 0.08 1.31
CSAT level -0.42 *** 0.04 0.66 -0.42 *** 0.03 0.66 0.52 *** 0.03 1.68
Intercept 4.44 *** 0.55 84.67 4.01 *** 0.43 55.16 -5.33 *** 0.53 0.00
Log-likelihoodc -5767.84 Pseudo R2c 0.12
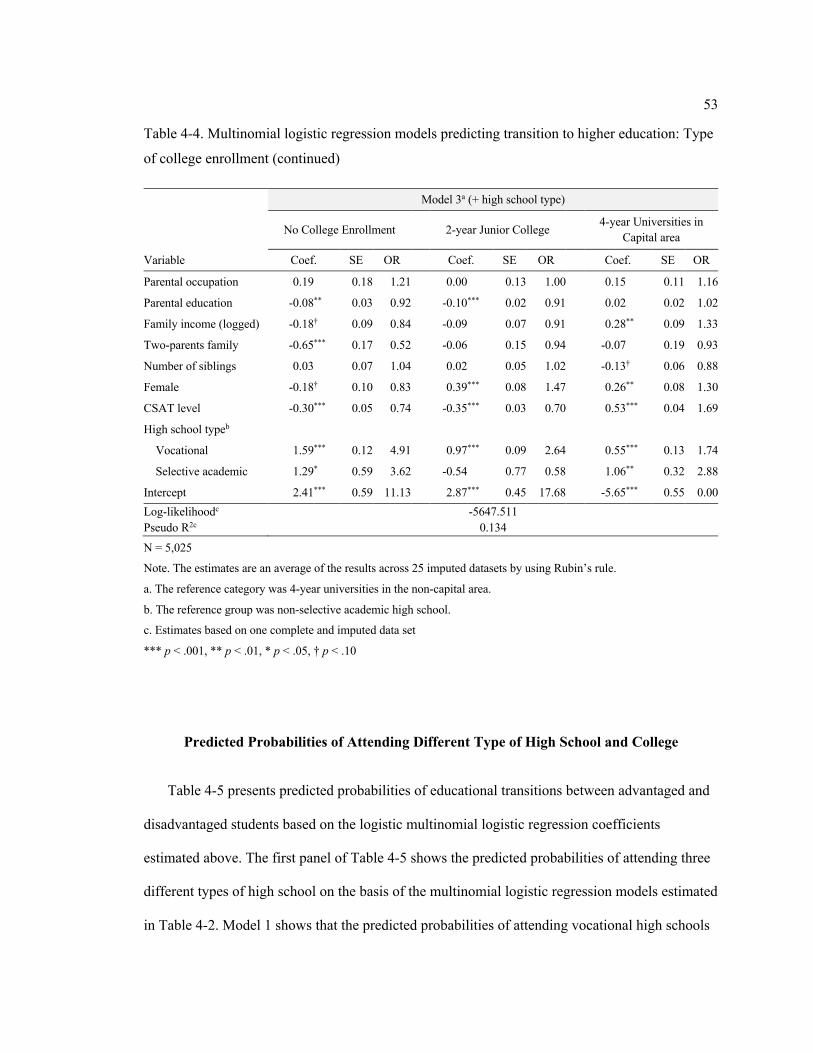
53
Table 4-4. Multinomial logistic regression models predicting transition to higher education: Type
of college enrollment (continued) Model 3a (+ high school type)
No College Enrollment 2-year Junior College 4-year Universities in Capital area
Variable Coef. SE OR Coef. SE OR Coef. SE OR
Parental occupation 0.19 0.18 1.21 0.00 0.13 1.00 0.15 0.11 1.16
Parental education -0.08 ** 0.03 0.92 -0.10 *** 0.02 0.91 0.02 0.02 1.02
Family income (logged) -0.18 † 0.09 0.84 -0.09 0.07 0.91 0.28 ** 0.09 1.33
Two-parents family -0.65 *** 0.17 0.52 -0.06 0.15 0.94 -0.07 0.19 0.93
Number of siblings 0.03 0.07 1.04 0.02 0.05 1.02 -0.13 † 0.06 0.88
Female -0.18 † 0.10 0.83 0.39 *** 0.08 1.47 0.26 ** 0.08 1.30
CSAT level -0.30 *** 0.05 0.74 -0.35 *** 0.03 0.70 0.53 *** 0.04 1.69
High school typeb
Vocational 1.59 *** 0.12 4.91 0.97 *** 0.09 2.64 0.55 *** 0.13 1.74
Selective academic 1.29 * 0.59 3.62 -0.54 0.77 0.58 1.06 ** 0.32 2.88
Intercept 2.41 *** 0.59 11.13 2.87 *** 0.45 17.68 -5.65 *** 0.55 0.00 Log-likelihoodc -5647.511 Pseudo R2c 0.134
N = 5,025
Note. The estimates are an average of the results across 25 imputed datasets by using Rubin’s rule.
a. The reference category was 4-year universities in the non-capital area.
b. The reference group was non-selective academic high school.
c. Estimates based on one complete and imputed data set
*** p < .001, ** p < .01, * p < .05, † p < .10
Predicted Probabilities of Attending Different Type of High School and College
Table 4-5 presents predicted probabilities of educational transitions between advantaged and
disadvantaged students based on the logistic multinomial logistic regression coefficients
estimated above. The first panel of Table 4-5 shows the predicted probabilities of attending three
different types of high school on the basis of the multinomial logistic regression models estimated
in Table 4-2. Model 1 shows that the predicted probabilities of attending vocational high schools
54
were 7.7% versus 28.6% for the advantaged and disadvantaged students, respectively. When
academic achievement at 9th grade was controlled for in Model 2, the difference in the
probabilities was reduced but still substantive (9.8% vs. 24.1%). Model 1 also estimated the
predicted probabilities of attending non-selective academic high schools, which was 89.2% and
70.8% for the advantaged and disadvantaged students, respectively. The difference in the
probabilities between two groups decreased in Model 2, but advantaged students (89.2%) still had
higher probabilities of attending non-selective high school than the disadvantaged group (75.6%).
In addition, in Model 1, 3.1% of the advantaged students were predicted to attend selective
academic high school, while only 0.6% of the disadvantaged students were predicted to do so.
When the academic achievement was taken into account in Model 2, the predicted probabilities of
attending selective academic high schools were reduced for both groups into 1% and 0.3% for the
advantaged and disadvantaged students, respectively. These results indicate that both the
advantaged and disadvantaged students typically attended non-selective academic high schools
rather than vocational high schools or selective high schools, questioning EMI in the Korean
context.
The second panel of Table 4-5 shows the predicted probabilities of enrolling in any kind
of college based on the logistic regression models estimated in Table 4-3. All models show that
both advantaged and disadvantaged students typically went to any kind of college regardless of
their academic achievement and high school type in the Korean context, supporting MMI. For
example, more than 90% of the advantaged and disadvantaged students went to college in Model
1 and 2. However, after controlling for the high school type they attended, the probabilities of not
enrolling in college were increased to 12.9% and 14.6% for vocational high school students from
5.0% and 9.5% for the advantaged and disadvantaged students, respectively. In contrast, the
probabilities of college entry were approached 98.1% and 97.8% for the advantaged and
disadvantaged students, respectively. These findings show that high school type has an important
55
role in students’ college entry, even though the majority of students went to any kind of college in
the Korean context.
The last panel of Table 4-5 shows the predicted probabilities of four different types of
college enrollment on the basis of the multinomial logistic regression models estimated in Table
4-4. Model 1 shows that the advantaged students typically attended 4-year universities in the
non-capital area (39.9%), while the disadvantaged students typically attended 2-year junior
colleges (38.9%), supporting EMI. However, when students’ academic achievement was taken
into account in Model 2, the disadvantaged students typically attended 4-year universities in the
non-capital area (39.8%), similar to the advantaged students (45.4%), questioning EMI.
Meanwhile, the difference in the predicted probabilities of attending 4-year universities in the
capital area between two groups (36.6% vs. 16.5% for the advantaged and disadvantaged
students) was much larger than that of 4-year universities in the non-capital area (39.9% vs.
35.7% for the advantaged and disadvantaged students) in Model 1.
When the high school type was additionally included in Model 3, vocational high school
students typically went to 2-year junior colleges, regardless of their SES. In contrast, selective
and non-selective academic school students typically went to 4-year universities in the non-
capital area, regardless of their SES. In particular, for selective academic high school students,
more than 60% of the students entered 4-year universities in the non-capital area. The
corresponding numbers were 47.2% and 44.8% for the advantaged and disadvantaged students in
the non-selective high schools, and 29.5% and 25.6% for the advantaged and disadvantaged
students in the vocational high schools, respectively. These findings from Model 3 imply that
high school type has an important role in shaping students' educational transition to different
types of college.
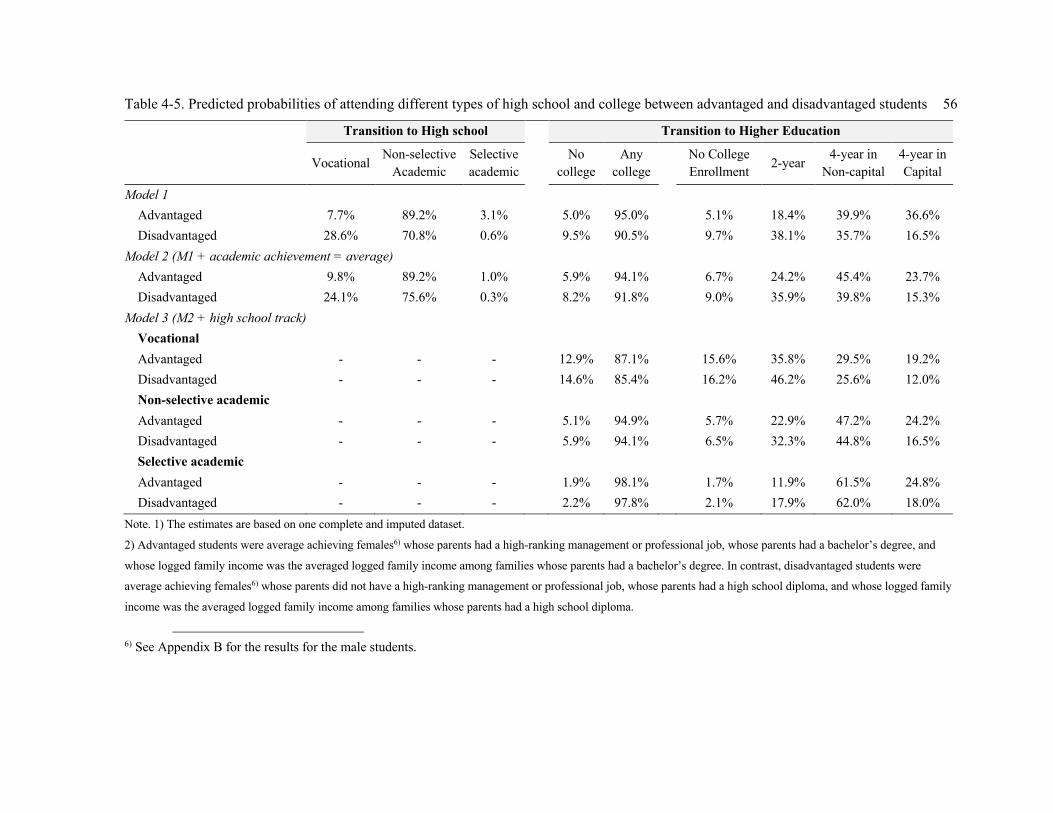
56 Table 4-5. Predicted probabilities of attending different types of high school and college between advantaged and disadvantaged students
Transition to High school Transition to Higher Education
Vocational Non-selective
Academic Selective academic
No college
Any college
No College Enrollment 2-year
4-year in Non-capital
4-year in Capital
Model 1
Advantaged 7.7% 89.2% 3.1% 5.0% 95.0% 5.1% 18.4% 39.9% 36.6% Disadvantaged 28.6% 70.8% 0.6% 9.5% 90.5% 9.7% 38.1% 35.7% 16.5%
Model 2 (M1 + academic achievement = average)
Advantaged 9.8% 89.2% 1.0% 5.9% 94.1% 6.7% 24.2% 45.4% 23.7% Disadvantaged 24.1% 75.6% 0.3% 8.2% 91.8% 9.0% 35.9% 39.8% 15.3%
Model 3 (M2 + high school track)
Vocational
Advantaged - - - 12.9% 87.1% 15.6% 35.8% 29.5% 19.2% Disadvantaged - - - 14.6% 85.4% 16.2% 46.2% 25.6% 12.0% Non-selective academic
Advantaged - - - 5.1% 94.9% 5.7% 22.9% 47.2% 24.2% Disadvantaged - - - 5.9% 94.1% 6.5% 32.3% 44.8% 16.5% Selective academic
Advantaged - - - 1.9% 98.1% 1.7% 11.9% 61.5% 24.8% Disadvantaged - - - 2.2% 97.8% 2.1% 17.9% 62.0% 18.0%
Note. 1) The estimates are based on one complete and imputed dataset.
2) Advantaged students were average achieving females6) whose parents had a high-ranking management or professional job, whose parents had a bachelor’s degree, and
whose logged family income was the averaged logged family income among families whose parents had a bachelor’s degree. In contrast, disadvantaged students were
average achieving females6) whose parents did not have a high-ranking management or professional job, whose parents had a high school diploma, and whose logged family
income was the averaged logged family income among families whose parents had a high school diploma.
6) See Appendix B for the results for the male students.
57
Chapter 5
Discussion
The current study examined socioeconomic disparities in education transitions from the
lower secondary to higher education, using a nationally representative data of 7th-grade students
in Korea. Also, this study tested the EMI hypothesis proposed by Lucas (2001) in the Korean
context by examining whether the prediction of students' educational destination varied by their
parental SES. This final chapter summarizes the main findings of this study and discusses the
meaning and significance of the findings. In addition, I explain the limitations of this study and
suggestions for the future research.
Summary of Findings
This study attempted to answer the following two research: 1) How do students'
educational transitions from middle schools to high schools vary by parental SES? 2) How do
students' educational transitions from high schools to higher education vary by parental SES? In
doing so, this study reflected more recent qualitative differences among high schools and
universities in Korea by considering three different type of high schools (i.e., selective academic
high schools, non-selective academic high schools, and vocational high schools) and four
different types of college enrollment (i.e., 4-year university in the capital area, 4-year university
in the non-capital area, 2-year junior colleges, and no college enrollment). To brief the result of
this study, the hypotheses of this study were partially supported.

58
Transition from Middle Schools to High Schools
In terms of the transition from middle schools to high schools, the result partially
supported my hypotheses. First, the result from the regression models supported my hypothesis
by showing significant socioeconomic disparities in attending more selective high schools (i.e.,
selective academic > non-selective academic > vocational), even after controlling for students’
academic achievement. However, the result did not support my hypothesis about EMI testing.
EMI testing based on the predicted probabilities showed that students’ modal destinations in the
transition from middle schools to different types of high schools were not different by their
parental SES. The majority of middle school graduates in Korea went to non-selective academic
high schools regardless of their SES, rather than vocational or selective academic high schools. In
other words, even the socioeconomically disadvantaged students typically attended non-selective
academic high schools rather than vocational high schools, similar to the socioeconomically
advantaged students. This finding aligns with Byun and Park (2017)’s work, but does not support
the relevance of EMI in Korean society.
Still, it needs to note that the probability of attending selective academic high schools
was higher for the advantaged group (3.1%) than the disadvantaged group (0.6%). Of course, the
difference in the probabilities between the advantaged and disadvantaged groups was not much
substantial. The probabilities of attending selective academic high schools were much lower than
those of attending non-selective academic schools for both of advantaged and disadvantaged
groups. This was possibly because, at that time (i.e., in 2010), there was only a limited number of
selective academic high schools in Korea. In other words, the degree of differentiation by SES
within academic high school track was not large until that time. Given that the number of
selective academic high schools has been continuously increasing (Korean MOE & KEDI,
2019b), however, a slightly different pattern would be found in the future.
59
Transition from High Schools to Higher Education
College Entry
In terms of transition from upper secondary (i.e., high schools) to higher education, my
hypotheses regarding college entry were supported. In the regression model, parental SES was
marginally significant in predicting college entry after considering high school type attended. The
high school type had a significant impact on college entry, instead of family SES. Vocational
high school students were less likely to go to a college. EMI testing based on the predicted
probabilities also showed that most high school graduates did typically enter colleges regardless
of their parental SES, supporting MMI in the Korean society. Specifically, more than 90% of high
school graduates in Korea enrolled in any kind of college within four years after high school
graduation, regardless of their SES. It suggests that even the disadvantaged students typically
went to a college rather than not going to a college in Korea.
This finding supports Byun and Park (2017)’s work, although the probability of college
entry for the disadvantaged students was much higher in this study (90.5%) compared to that of
Byun and Park (2017) (75%). This could be due the fact that the current study used data with
more extended period of time up to four years after high school graduation, compared to Byun
and Park (2017) who used data up to two years after high school graduation. This finding aligns
with the statistics by The World Bank showing that the gross enrollment ratio in tertiary
education, measured as a percentage of the total population of the five-year age group from
secondary school leaving, approached more than 95% in 2013 (Roser & Ortiz-Ospina, 2013).
One interesting finding was that the difference in the probabilities of college entry by
high school type was greater than those by parental SES. For example, the probabilities of college
entry were ranging from 97.8% to 98.1% by parental SES for the students from selective
60
academic high schools, while those for the vocational high school students were ranging from
85.4% to 87.1% by parental SES. The corresponding probabilities for the non-selective academic
high school students were ranging from 94.1% to 94.9% by parental SES. This shows that high
school experiences have an important role in shaping the outcome in college entry in the Korean
context.
Type of College Enrollment
Considering the different types of college, the result partially supported my hypotheses.
First, the result from the regression models supported my hypothesis, by showing significant
socioeconomic disparities in attending more selective colleges (i.e., 4-year universities in the
capital area > 4-year universities in the non-capital area, 2-year junior college), even after
controlling for students’ academic achievement and high school type attended. EMI testing
without controlling for students’ academic achievement and high school type also supported my
hypothesis. The result of EMI testing showed that the advantaged students typically attended 4-
year universities in the non-capital area, while the disadvantaged students typically attended 2-
year junior colleges. This finding supports EMI in the Korean context.
However, EMI testing results after controlling for students’ academic achievement did no
longer support my hypothesis. Students’ modal destination in the transition to higher education
was not different my parental SES. The majority of students went to 4-year universities in the
non-capital area, regardless of their parental SES. In other words, even the disadvantaged students
typically attended 4-year universities in the non-capital area, similar to the advantaged students,
questioning the EMI hypothesis. Furthermore, after controlling for high school type attended,
academic high school students typically went to 4-year universities in the non-capital area, while
vocational high school students typically went to 2-year junior colleges, regardless of their SES,

61
again questioning the relevance of EMI hypothesis in Korea. In other words, for vocational high
school students, even the advantaged students went to 2-year junior colleges typically rather than
4-year universities in the non-capital area. These findings support Byun & Park (2017), given that
they considered 4-year universities as one category unlike the current study dividing 4-year
universities into two groups by its location (i.e., 4-year universities in the capital area and the
non-capital area). These findings suggest the importance of high school track in determining
students’ educational transitions to different types of college in the Korean context.
In summary, this study extended the literature in that the regression models of this study
found significant socioeconomic disparities in attending selective academic high schools and 4-
year universities in the capital area, relative to non-selective academic high schools and 4-year
universities in the non-capital area. These findings imply that family SES has an important role in
differentiating students’ educational transitions even within the academic high school track
(Hwang, 2015) and 4-year universities (Byun & Kim, 2010; Kim, 2008; Kim & Kim, 2013; Lee
& Koh, 2003) in the Korean context, which was also pointed out by prior studies in Korea.
However, this study did not support the validity of EMI hypothesis in the Korean society.
For example, even the disadvantaged students in Korea typically went to non-selective academic
high schools and 4-year universities in the non-capital area rather than vocational high schools
and 2-year junior colleges, after controlling for academic achievement. Also, in terms of college
entrance, the differences in the predicted probabilities by high school type was greater than the
differences by SES. For example, more than 97% of the disadvantaged students (98.1% for the
advantaged students) from selective academic high schools were predicted to enroll in any kind of
college, while about 87 % of the advantaged students (85.4% for the disadvantaged students)
from vocational high schools were predicted to do so. Furthermore, even the disadvantaged
students from academic high schools typically went to 4-year universities in the non-capital area,
while even the advantaged students from vocational high schools went to 2-year junior colleges.

62
These findings suggest that earlier educational transition to high school has an important role in
shaping the later transition to college in the Korean context. Thus, the current study highlights the
importance of considering the different types of organizational structures of high schools when
applying the EMI hypothesis in nations like Korea as it plays a substantial role in shaping the
outcomes in transition to college.
Limitations and Suggestions for Future Research
The current study has a couple of limitations which need to be addressed in the future
research. First limitation is regarding the limited number of selective high schools in the sample.
As mentioned above, the number of selective academic high schools was extremely low when the
sampled students of KELS:05 were attending high schools (i.e., from 2008 to 2010) in Korea.
Given that the number of selective academic high schools has increased in recent years, future
studies do have the opportunity to consider more recent data, which could yield more
comprehensive results that reflect the nuanced qualitative differences within the academic high
school tracks. For example, the number of the selective academic high schools has increased by
about 17% during the past decade, from 171 in 2011 to 200 in 2019, while the number of other
types of high schools have been diminished or remained stagnant during the same period. As a
result, the proportion of selective academic high school students among the three types of high
school students has been increased (6.4% in 2011 to 7.8% in 2019), while those of students
attending vocational (18% in 2011 to 17.2% in 2019) and non-selective academic schools (75.5%
in 2011 to 75.0% in 2019) have been gradually decreased (Korean MOE & KEDI, 2019b). Given
that KEDI has been conducting a second longitudinal study tracking 5th graders in Korea since
2013 (i.e., KELS:13), more comprehensive results would be found if the data on high school
experiences is released to the public in the future.

63
Second, although this study tried to reflect the qualitative differences among 4-year
universities by additionally considering its location (e.g., the capital area vs. non-capital area), it
was still not enough to fully capture the differences among universities. Certainly, there are
prestigious universities in the non-capital area, not only in the capital area. However, it was not
possible to consider the qualitative status of individual institutions across the nation because
KELS:05 did not provide detailed information on individual universities (e.g., the name of
institution) except for its type and location. Thus, future study would reflect the qualitative
differences among universities better if it is possible to identify the characteristics of individual
institutions.

64
Appendices
Appendix A. Descriptive statistics for all variables used in the analyses
Imputed a Original
Variable M/% SD min max % of imputed
M/% SD min max N
High school
Vocational 24.0% - 0 1 0.0% 24.0% - 0 1 5,025
Non-selective academic 74.5% - 0 1 0.0% 74.5% - 0 1 5,025
Selective academic 1.5% - 0 1 0.0% 1.5% - 0 1 5,025
College
No college 11.1% - 0 1 0.0% 11.1% - 0 1 5,025
2-year college 28.5% - 0 1 0.0% 28.5% - 0 1 5,025
4-year univ in non-capital 39.2% - 0 1 0.0% 39.2% - 0 1 5,025
4-year univ in capital 21.2% - 0 1 0.0% 21.2% - 0 1 5,025
Parental occupation 16.5% - 0 1 2.5% 16.6% - 0 1 4,900
Parental education 13.5 2.3 9 18 2.2% 13.5 2.3 9 18 4,916
Family income (logged) 5.7 0.6 0 7.8 8.8% 5.7 0.6 0 7.8 4,584
Two-parents family 91.2% - 0 1 4.1% 91.3% - 0 1 4,818
Number of siblings 2.2 0.7 0.2 9 4.7% 2.2 0.7 1 9 4,789
Female 47.6% - 0 1 0.0% 47.6% - 0 1 5,025 Academic achievement at 9th grade 56.4 21.6 -0.3 112.9 1.7% 56.4 21.6 5 100 4,941
CSAT level 5.4 1.6 0.1 9.9 23.5% 5.6 1.5 1 9 3,842
a. The estimates are an average of the results across 25 imputed datasets by using Rubin’s rule.
Source: KELS:05
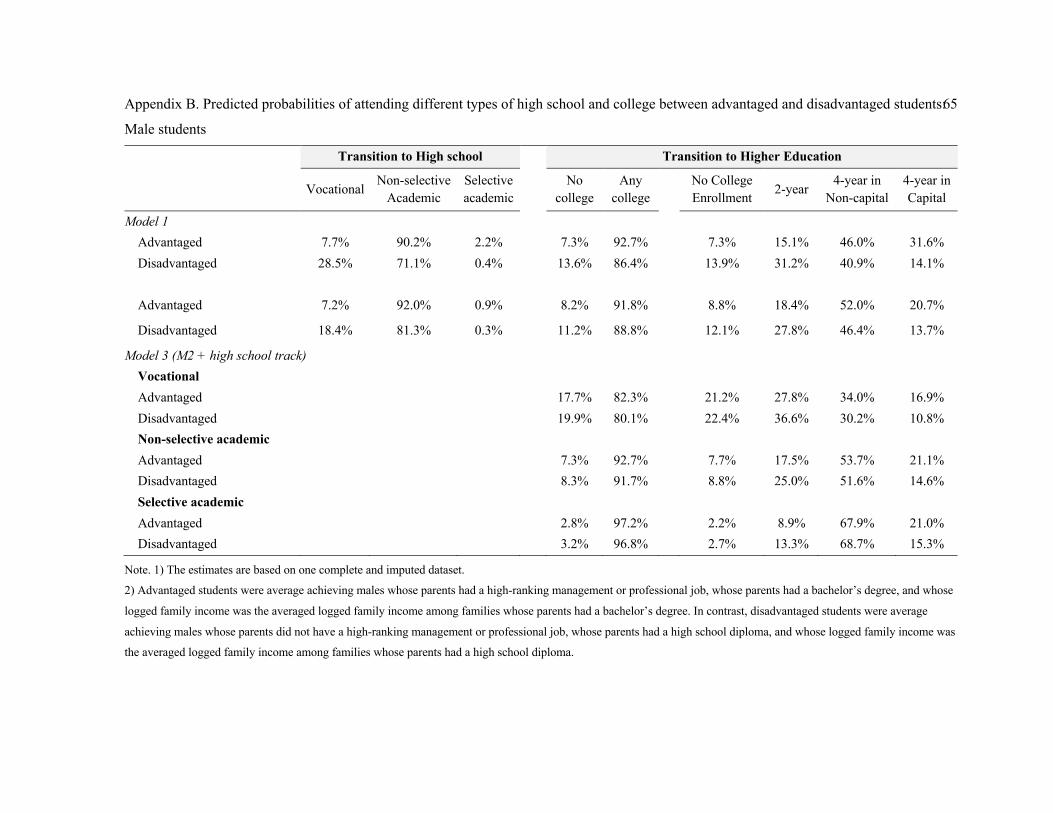
65 Appendix B. Predicted probabilities of attending different types of high school and college between advantaged and disadvantaged students:
Male students
Transition to High school Transition to Higher Education
Vocational Non-selective Academic
Selective academic
No college
Any college
No College Enrollment 2-year 4-year in
Non-capital 4-year in Capital
Model 1
Advantaged 7.7% 90.2% 2.2% 7.3% 92.7% 7.3% 15.1% 46.0% 31.6% Disadvantaged 28.5% 71.1% 0.4% 13.6% 86.4% 13.9% 31.2% 40.9% 14.1%
Advantaged 7.2% 92.0% 0.9% 8.2% 91.8% 8.8% 18.4% 52.0% 20.7%
Disadvantaged 18.4% 81.3% 0.3% 11.2% 88.8% 12.1% 27.8% 46.4% 13.7%
Model 3 (M2 + high school track) Vocational Advantaged 17.7% 82.3% 21.2% 27.8% 34.0% 16.9% Disadvantaged 19.9% 80.1% 22.4% 36.6% 30.2% 10.8% Non-selective academic Advantaged 7.3% 92.7% 7.7% 17.5% 53.7% 21.1% Disadvantaged 8.3% 91.7% 8.8% 25.0% 51.6% 14.6% Selective academic Advantaged 2.8% 97.2% 2.2% 8.9% 67.9% 21.0% Disadvantaged 3.2% 96.8% 2.7% 13.3% 68.7% 15.3%
Note. 1) The estimates are based on one complete and imputed dataset.
2) Advantaged students were average achieving males whose parents had a high-ranking management or professional job, whose parents had a bachelor’s degree, and whose
logged family income was the averaged logged family income among families whose parents had a bachelor’s degree. In contrast, disadvantaged students were average
achieving males whose parents did not have a high-ranking management or professional job, whose parents had a high school diploma, and whose logged family income was
the averaged logged family income among families whose parents had a high school diploma.

66
References
Alon, S. (2009). The evolution of class inequality in higher education: Competition, exclusion,
and adaption. American Sociological Review, 74, 731-755.
https://doi.org/10.1177/000312240907400503
Andrew, M. (2017). Effectively Maintained Inequality in US Postsecondary Progress: The
Importance of Institutional Reach. American Behavioral Scientist, 61(1), 30-48.
https://doi.org/10.1177/0002764216682809
Ayalon, H., & Shavit, Y. (2004). Educational reforms and inequalities in Israel: The MMI
hypothesis revisited. Sociology of Education, 77(2), 103-120.
https://doi.org/10.1177/003804070407700201
Becker, R. (2003). Educational expansion and persistent inequalities of education: Utilizing
subjective expected utility theory to explain increasing participation rates in upper
secondary school in the Federal Republic of Germany. European sociological review,
19(1), 1-24. https://doi.org/10.1093/esr/19.1.1
Blossfeld, H. & Shavit, Y. (1993). Persisting barriers: changes in educational opportunities in
thirteen countries. In Y. Shavit, & H. Blossfeld (Ed.) Persistent Inequality: Changing
Educational Attainment in Thirteen (pp. 1-23). San Francisco: Westview Press.
Boliver, V. (2011). Expansion, differentiation, and the persistence of social class inequalities in
British higher education. High Educ, 61, 229-242. https://doi.org/10.1007/s10734-010-
9374-y

67
Boliver, V. (2016). Critically Evaluating the Effectively Maintained Inequality Hypothesis.
Journal of Education, Society and Behavioural Science, 1-9.
https://doi.org/10.9734/BJESBS/2016/24563
Boudon, R. (1974). Education, opportunity, and social inequality: Changing prospects in western
society.
Byrne, D., & McCoy, S. (2017). Effectively maintained inequality in educational transitions in
the Republic of Ireland. American Behavioral Scientist, 61(1), 49-73.
https://doi.org/10.1177/0002764216682991
Byun, S., & Kim, K. (2010). Stratification in Korean higher education: Determinants of the
college destinations of general high school graduates (In Korean). Korean Journal of
Sociology of Education, 20(1), 73–102.
Byun, S., & Park, H. (2017). When different types of education matter: Effectively maintained
inequality of educational opportunity in Korea. American Behavioral Scientist, 61(1), 94-
113. https://doi.org/10.1177/0002764216682810
Cameron, S. V., & Heckman, J. J. (1998). Life cycle schooling and dynamic selection bias:
Models and evidence for five cohorts of American males. Journal of Political economy,
106(2), 262-333. https://doi.org/10.1086/250010
Chang, S. (2007). Family background and the choice of high school sector in Korea. Korean
Journal of Sociology, 41(2), 118-146. Retrieved from
http://www.dbpia.co.kr/journal/articleDetail?nodeId=NODE00892424
Chesters, J. (2015). Within-generation social mobility in Australia: The effect of returning to
education on occupational status and earnings. Journal of Sociology, 51(2), 385-400.
https://doi.org/10.1177/1440783314544995

68
Engberg, M. E. (2012). Pervasive inequality in the stratification of four-year college destinations,
Equity & Excellence in Education, 45(4), 575-595, doi:10.1080/10665684.2012.717486
Guetto, R., & Vergolini, L. (2017). Educational expansion without equalization: a reappraisal of
the ‘Effectively Maintained Inequality hypothesis in children’s choice of the upper
secondary track. European Societies, 19(1), 1-27.
https://doi.org/10.1080/14616696.2016.1236283
Hout, M. (2006). Maximally maintained inequality and essentially maintained inequality.
Sociological theory and methods, 21(2), 237-252.
Jerrim, J., Chmielewski, A. K., & Parker, P. (2015). Socioeconomic inequality in access to high-
status colleges: A cross-country comparison. Research in Social Stratification and
Mobility, 42, 20-32. https://doi.org/10.1016/j.rssm.2015.06.003
Johnson, D. R., & Young, R. (2011). Toward best practices in analyzing datasets with missing
data: comparisons and recommendations. Journal of Marriage and Family, 73(5), 926-
945. https://doi.org/10.1111/j.1741-3737.2011.00861.x
JoongAng Ilbo (2015). Comprehensive university ranking report. Retrieved from
http://univ.joongang.co.kr/university/totalRankingReport.asp
Kim, K. (2004). The impact of family background on educational continuation across school
transitions. Korean Journal of Sociology, 38(5), 109-142. (In Korean) Retrieved from
http://www.dbpia.co.kr/journal/articleDetail?nodeId=NODE00895248
Kim, S. (2008). A study on the influence of student backgrounds on opportunity of tertiary
education in South Korea. Asian Journal of Education, 9(2), 27-47. (In Korean)
http://hdl.handle.net/10371/89165

69
Kim, S., Kim, Y., Kang, S., Kim, H., Shin, J., Park, S., & Min, B. (2007). Overview of Korean
Educational Longitudinal Study of 2005 (III). Seoul, Korea: KEDI. (In Korean) Retrieved
from https://www.kedi.re.kr/khome/main/research/selectPubForm.do
Kim, S., & Ryu, B. (2008). Analysis on the effect of student’s background, effort, and school
experience on entering high school. Korean Journal of Sociology of Education, 18(2), 31-
51. (In Korean). Retrieved from
http://scholar.dkyobobook.co.kr/searchDetail.laf?barcode=4050026583162
Kim, W., & Kim, Y. (2013). Cumulative mediating effects of family background on the college
entrance. Korean Journal of Sociology, 47(4), 263-302. (In Korean)
http://www.dbpia.co.kr/Article/NODE02232634
Korean Ministry of Education [MOE] & Korean Educational Development Institute [KEDI]
(2019a). Educational Statistics Report (In Korean). Retrieved from
https://kess.kedi.re.kr/publ/view?survSeq=2019&publSeq=43&menuSeq=0&itemCode=0
2&language=
Korean MOE & KEDI (2019b). Statistical Yearbook of Education. (In Korean) Retrieved from
https://kess.kedi.re.kr/eng/publ/view?survSeq=2019&publSeq=2&menuSeq=0&itemCode
=02&language=en
Ku, I., & Kim, J. (2015). Gaps in college entrance: Role of family income. Social Welfare Policy,
42(3), 27-49. Retrieved from
http://m.riss.kr/search/detail/DetailView.do?p_mat_type=1a0202e37d52c72d&control_no
=47c0219eecbd57beb36097776a77e665
Lee, D., & Koh, H. (2003). University ranking and regional economic development. Korean
Journal of Sociology of Education, 13(1), 191-214. (In Korean) Retrieved from

70
https://www.kci.go.kr/kciportal/ci/sereArticleSearch/ciSereArtiView.kci?sereArticleSearc
hBean.artiId=ART000858894
Lucas, S. R. (2001). Effectively maintained inequality: Education transitions, track mobility, and
social background effects. American journal of sociology, 106(6), 1642-1690.
https://doi.org/10.1086/321300
Mare, R. D. (1980). Social background and school continuation decisions. Journal of the
American Statistical Association, 75(370), 295-305.
doi:10.1080/01621459.1980.10477466
Mare, R. D. (1981). Change and stability in educational stratification. American Sociological
Review, 72-87. doi:10.2307/2095027
Moon, S. (2016). Trend of educational inequality: Focusing on the middle class and birth cohorts
in South Korea. Korean Journal of Sociology, 50(5), 141-171. Retrieved from
http://www.dbpia.co.kr/journal/articleDetail?nodeId=NODE07047228
Namgung, J., Kim, H., Park, K., Song, S., & Kim, Y. (2018). Overview of Korean Educational
Longitudinal Study of 2005 (XI). Chungbuk, Korea: KEDI. (In Korean) Retrieved from
https://www.kedi.re.kr/khome/main/research/selectPubForm.do
Park, H. (2015). A study on the horizontal stratification of higher education in South Korea.
Asian Pacific Educ. Rev., 16, 63-78. doi:10.1007/s12564-015-9355-z
Park, S., & Min, B. (2009). Variables affecting specialized high school admission. The Journal of
Korean Education, 36(4), 29-48. (In Korean)
http://www.riss.kr.proxy.cau.ac.kr/link?id=A101742361

71
Phang, H., & Kim, K. (2002). Opportunity and inequality: Educational stratification in Korea.
Korean Journal of Sociology, 36(4), 193-222. (In Korean)
http://www.riss.kr.proxy.cau.ac.kr/link?id=A76242143
Raftery, A. E., & Hout, M. (1993). Maximally maintained inequality: Expansion, reform, and
opportunity in Irish education, 1921-75. Sociology of education, 41-62.
doi:10.2307/2112784
Roser, M., & Ortiz-Ospina, E. (2013). Tertiary education. Published online at
OurWorldInData.org. Retrieved from https://ourworldindata.org/tertiary-education
[Online Resource]
Stolzenberg, R. M. (1994). Educational continuation by college graduates. American Journal of
Sociology, 99(4), 1042-1077. https://doi.org/10.1086/230371

VITA
Ji Hye Kim
EDUCATION August 2021
February 2016
August 2013
Ph.D. in Education Theory and Policy Dual title in Comparative and International Education,
Department of Education Policy studies, Pennsylvania State University M.Ed., Educational Policy and Administration Department of Education, Chung-Ang University, South Korea (Korea)
B.A. in Education Department of Education, Chung-Ang University, Korea
WORKING EXPERIENCE
2018 – 2021
2016 – 2017
2014 – 2015
2014 – 2015
2014 – 2015
2013 – 2015
Research/Teaching Assistant, Pennsylvania State University
Researcher, Korean Educational Development Institute (KEDI), Korea
Research Assistant, Korean Ministry of Education (MOE), Korea
Research Assistant, National Research Council for Economics, Humanities and
Social Sciences (NRCS), Korea
Administrative Assistant, Institute for Curriculum Excellence, Chung-Ang
University, Korea
Research/Teaching Assistant, Chung-Ang University, Korea
AWARDS & SCHOLARSHIP February 2018
November 2015
August 2015
February 2013
Student Writing Group Award, Department of Education Policy Studies, Penn
State University
Poster Presentation Award, The Korean Society for the Study of Teacher
Education
Best Paper Award, Korean Educational Research Association
Department Honor Scholarship, Chung-Ang University, Korea
RECENT PUBLICATIONS
Kim, J., Byun, S., & Jon, J. (2020). Who will be likely to leave the teaching profession? Predictors of
middle school teachers’ turnover intentions in South Korea. Korean Journal of Sociology of Education, 30(4), 89-112.
Min, S., Park, H., Kim, H., Jeong, E., Kim, E., & Kim, J. (2019). The effects of teacher guidance
mediated by extra-curricular activities on the citizenship and global citizenship of Korean
higher school students. Journal of Competency Development & Learning, 14(4), 21-49.
Byun, S., Kim, J., & Woo, H. (2019). Changes in the characteristics of academic high school students
who want to be a teacher: Focusing on academic achievement. Korean Journal of Sociology of Education, 29(1), 27-51.