revisiting the mortality of france and italy with the … the mortality of france and italy with the...
TRANSCRIPT

Demographic Research a free, expedited, online journal
of peer-reviewed research and commentary in the population sciences published by the Max Planck Institute for Demographic Research Konrad-Zuse Str. 1, D-18057 Rostock · GERMANY www.demographic-research.orgDEMOGRAPHIC RESEARCH VOLUME 23, ARTICLE 28, PAGES 771-806 PUBLISHED 26 OCTOBER 2010 http://www.demographic-research.org/Volumes/Vol23/28/ DOI: 10.4054/DemRes.2010.23.28
Research Article
Revisiting the mortality of France and Italy with the multiple-cause-of-death approach
Aline Désesquelles
Michele Antonio Salvatore
Luisa Frova
Monica Pace
Marilena Pappagallo
France Meslé
Viviana Egidi
©2010 Aline Désesquelles et al.This open-access work is published under the terms of the Creative Commons Attribution NonCommercial License 2.0 Germany, which permits use, reproduction & distribution in any medium for non-commercial purposes, provided the original author(s) and source are given credit. See http:// creativecommons.org/licenses/by-nc/2.0/de/

Table of Contents
1 Introduction 772 2 Data and method 773 2.1 Data 773 2.2 List of causes of death 774 2.3 Indicators 775 3 Results 776 3.1 A varying number of causes per certificate 777 3.2 Stability of the leading causes of death 781 3.3 Three broad patterns of combination of causes 782 4 Discussion 785 4.1 Impact of the MCOD approach 785 4.2 Combination of causes 786 4.3 Limitations 787 4.4 Why compare countries? 789 5 Acknowledgement 790 References 791 Appendix 795

Demographic Research: Volume 23, Article 28 Research Article
http://www.demographic-research.org 771
Revisiting the mortality of France and Italy with the multiple-cause-of-death approach
Aline Désesquelles1
Michele Antonio Salvatore2
Luisa Frova3
Monica Pace4
Marilena Pappagallo5
France Meslé6
Viviana Egidi7
Abstract
In this paper we revisit the mortality profiles of France and Italy in 2003 using the multiple-cause-of-death approach. The method leads to a substantial upward reassessment of the role played by certain conditions – e.g. diseases of the blood and diseases of the skin - in overall mortality. Regarding the associations of causes, we distinguish three patterns of pairwise joint occurrence of causes that are common to both countries. The numerous similarities that emerge from the comparison of the two countries are a positive signal of the reliability of the multiple-cause-of-death data.
1 Institut national d'études démographiques, France. E-mail: [email protected]. 2 Dipartimento di Scienze Statistiche, "Sapienza" Università di Roma, Italy. E-mail: [email protected] 3 Istituto Nazionale di Statistica, Italy. E-mail: [email protected]. 4 Istituto Nazionale di Statistica, Italy. E-mail: [email protected]. 5 Istituto Nazionale di Statistica, Italy. E-mail: [email protected] 6 Institut national d'études démographiques, France. E-mail: [email protected] 7 Dipartimento di Scienze Statistiche, "Sapienza" Università di Roma, Italy. E-mail: [email protected]

Désesquelles et al.: Revisiting the mortality of France and Italy with the multiple-cause-of-death approach
772 http://www.demographic-research.org
1. Introduction
Although the monitoring of mortality trends is mostly based on the underlying cause of death – that is “the disease or injury which initiated the train of morbid events leading directly to death, or the circumstances of the accident or violence which produced the fatal injury” (WHO 1949), a growing number of studies use the entire set of causes listed on the death certificate, hereafter referred to as the multiple causes of death (MCOD), to portray the mortality profile of a country (Chamblee and Evans 1982; Manton and Stallard 1982; Manton 1986; Manton and Myers 1987; White, Selvin, and Merrill 1989; Mackenbach et al. 1995; Stallard 2002; Désesquelles and Meslé 2004; Redelings, Sorvillo, and Simon 2006; Redeling, Wise, and Sorvillo 2007; Frova et al. 2009) or to re-evaluate the contribution of a specific cause (Wing and Manton 1981; Israel, Rosenberg, and Curtin 1986; Nizard and Munoz-Pérez 1993; Coste and Jougla 1994; Mannino et al. 1998; Wise and Sorvillo 2005; Fuhrman et al. 2006; Romon et al. 2008). As the first advocates of the MCOD approach (Janssen 1940; Dorn and Moriyama 1964) have stressed, the underlying-cause-of-death approach misdirects attention away from conditions that tend to be reported as contributory causes. As a consequence their contribution to overall mortality is underestimated. The MCOD approach should be especially useful for describing the medical circumstances surrounding the death of older people. At old ages, death is indeed often the final stage of a long morbid process involving several conditions. Clearly the MCOD approach is a potentially valuable tool for demographers, who are necessarily concerned with portraying the mortality profiles of aging populations as accurately as possible.
Notwithstanding these developments, studies that use multiple causes of death in order to compare a set of countries are still very scarce. This situation may be partly due to the quite widely shared scepticism about the quality, and consequently the comparability, of the multiple-cause-of-death data. To our mind, apart from certification issues, recent technological innovations in the coding systems represent a major advance towards improved quality of cause-of-death data. In a growing number of countries the recording of information on death certificates and the coding of causes have been automated (optical recognition and automatic coding system). Human intervention is limited to problematic cases that cannot be processed automatically and, at least in theory, the World Health Organization coding rules can be applied systematically and uniformly, irrespective of the coding agent or the country. Another consequence of these automated systems is that the number of coded causes is no longer limited. Researchers often have access to all medical information reported on the certificate instead of a limited selection of causes.
In this paper we use the MCOD approach in order to revisit the mortality profiles of France and Italy in 2003. Our goals are both substantive and methodological. First

Demographic Research: Volume 23, Article 28
http://www.demographic-research.org 773
we re-evaluate the cause-specific mortality profiles of the two countries, taking into account all the conditions reported on the death certificates. We then measure the pairwise joint occurrence of any underlying and any contributory cause (i.e. any multiple cause other than the underlying cause) in order to identify unexpectedly frequent associations. Researchers using the MCOD data face the problem of handling the enormous amount of information at their disposal. We propose a graphical tool that facilitates the reading and interpretation of results. In the discussion section we put special emphasis on examining the specific contribution of cross-country comparison, both in terms of data quality assessment and in terms of expanding our knowledge of the morbid train of events leading to death.
2. Data and method
2.1 Data
Data are from the Italian National Vital Statistics Death Registry on causes of death managed by the Italian National Institute of Statistics (Istat), and from the statistics of the medical causes of death managed by the French National Institute for Health and Medical Research (Inserm). They are based on the information reported on death certificates, which, in both countries, are designed according to WHO recommendations. The certificate comprises two parts. Part I is for the diseases or conditions that led directly to death. The condition recorded in the last completed line of Part I is usually the underlying cause of death, but the WHO procedures include several exceptions to that rule. Part II is for any other significant condition that unfavourably influenced the course of the morbid process but is not related to the condition directly causing death. The instructions provided to fill in this part of the certificate are not identical in the two countries, which may lead to a somewhat different distribution of the information reported in parts I and II of the certificate in France and Italy. Since we use all the causes mentioned on the certificate this slight difference is not problematic for our study. More importantly, it is worth noting that up to 13 causes can be reported on the Italian death certificate as compared to a maximum of 6 in France. The order of reporting is also different in the two countries. Under the WHO guidelines the certifying physician should report the morbid process in reverse chronological order, from the immediate cause of the death down to the initial condition that started the sequence. While the French certificate follows this guideline, the order of reporting is reversed in Italy (ISTAT 2004a).
France adopted the 10th revision of the International Classification of Diseases (ICD-10) (WHO 2005) in 2000. This change coincided with the introduction of an

Désesquelles et al.: Revisiting the mortality of France and Italy with the multiple-cause-of-death approach
774 http://www.demographic-research.org
automated coding system (STYX) that is derived from the American system (ACME - Automated Classification of Medical Entities) (Israel et al. 1972; Pavillon et al. 2005). Since then all the conditions listed on the certificate have been coded. Two-thirds of the certificates are coded by STYX without any human intervention. For the remaining cases the coding problem is often due to faulty optical recognition. Only 8% of the certificates require the intervention of a trained nosologist to select the underlying cause. Even in these cases all the causes mentioned on the certificate are coded.
Italy adopted the ICD-10 in 2003 but an automated coding system (CODSAN II) was introduced as early as 1995. CODSAN II is an adaptation of both ACME (ISTAT 2004b) and the American MICAR system (Mortality Medical Indexing, Classification, and Retrieval). About 80% of death certificates are entirely coded by CODSAN II. The automated coding system assigns a specific code (“U00”) to every rejected term and returns the rejected records.8 These records are then manually coded by trained nosologists. Whenever possible the temporary “U00” code is replaced by a real ICD-10 code, and the record is re-submitted to the automated system in order to select the underlying cause of death (Pace and Grippo 2007). Otherwise the medical expert determines only the underlying cause and leaves the rest of the information as it is. At the end of the coding process about 4% of all deaths still have at least one “U00” code as a contributory cause; among these 87% have only one “U00” code.
In Italy information on the contributory causes is not available for deaths assigned to an external cause and for infant deaths. All these cases (2,134 infant deaths and 25,684 deaths from external causes for Italy, 3,054 infant deaths and 41,577 deaths from external causes for France) were therefore excluded from the analysis. In addition we excluded 8,267 natural deaths over the age of one that occurred in the Italian provinces of Trento and Bolzano: the corresponding death certificates are coded locally and for the underlying cause only. Finally, our analysis is conducted on a total number of 507,704 deaths for France and 550,835 deaths for Italy.
2.2 List of causes of death
The list of causes used in the present analysis is very similar to the European short-list recommended by Eurostat for European comparisons (Eurostat 1998). Our list comprises 15 large groups that generally correspond to the ICD-10 chapters, and 66 sub-groups that give more details on causes of death that are of particular interest to us because they are likely to be frequently mentioned as a contributory cause of death (see appendix). As an example, the group of the “Endocrine, nutritional and metabolic diseases” has been divided into several subgroups: “Diabetes mellitus”, “Malnutrition
8 Even for rejected records, all the causes that match with a medical term are coded.

Demographic Research: Volume 23, Article 28
http://www.demographic-research.org 775
and other nutritional deficiency”, “Obesity” and “Disorders of the thyroid gland”. “Hypertensive diseases” and “Renal failure” have been isolated too. As population aging leads to an increased prevalence of various neurodegenerative disorders, we decided to use more detailed subcategories of the “Mental and behavioural disorders” and the “Diseases of the nervous system”. “Alzheimer's disease”, “Dementias excluding Alzheimer's disease” and “Parkinson's disease” have thus been isolated. Some conditions classified under ICD-10 with diseases of the nervous system (codes G31.0, G31.2, G31.8, G31.9), have been classified with dementias in the “Mental and behavioural disorders”. The group of “Symptoms, signs, abnormal findings and ill-defined causes” has been divided into three subgroups: “Senility”, “Mechanisms of death” (codes I46, I49.0, R09.2, R40.2, R57 that describe the mode of dying, e.g. heart failure, respiratory failure), and a residual group (“Other symptoms, signs, abnormal findings and ill-defined causes”).
Finally, two adjustments have been made to achieve full comparability between the French and the Italian datasets: 1) all “Z” codes (“Factors influencing health status and contact with health services”), used in France only, have been removed from the French database; 2) all “U00” codes, used in Italy only, have been included in the group of “Other symptoms, signs, abnormal findings and ill-defined causes”.
2.3 Indicators
We first calculated age- and sex-standardized mortality rates for 1) a given cause reported as the underlying cause of death, 2) the same cause reported as a multiple (underlying or contributory) cause of death. The standard population is the WHO 2003 European population by sex and five-year age groups. The Standardized Ratio of Multiple to Underlying cause (SRMU) is defined as the ratio of the second to the first of these two rates. It measures the underestimation of the role played by a given condition in the overall mortality when the analysis is performed using the underlying cause only: the SRMU is low for conditions that are usually selected as the underlying cause and high for conditions that are rarely the underlying cause.
We developed an indicator of the frequency of the combinations of causes that can be used to compare various underlying causes within a country, or various countries for a given underlying cause. For each country separately, we first calculated the proportions by five-year age groups 1) of a given contributory cause among all deaths assigned to a specific underlying cause, 2) of the same contributory cause among all deaths of the country. We then applied these proportions to the same death counts (the average number of deaths in France and Italy in 2003 by five-year age groups) in order to remove the effect of the varying age structure of deaths by underlying cause. The

Désesquelles et al.: Revisiting the mortality of France and Italy with the multiple-cause-of-death approach
Cause-of-Death Association Indicator (CDAI) is defined as the ratio between these two quantities. It is thus given by the following formula:
100*.
.100*
.
.
,
,
,
,
,
∑
∑
∑∑
∑∑
=
⎟⎟⎠
⎞⎜⎜⎝
⎛
⎟⎟⎠
⎞⎜⎜⎝
⎛
=
x xx
xc
x xxu
xcu
x x
x xx
xc
x x
x xxu
xcu
cu
ddd
ddd
d
ddd
d
ddd
CDAI
xcu d ,
xu d
= number of deaths observed at age x with underlying cause u and contributory
cause c; = number of deaths observed at age x with cause u as underlying cause;
dc,,x = total number of deaths observed at age x with cause c as contributory cause (regardless of underlying cause);
dx = total number of deaths observed at age x (regardless of underlying cause); = average number of deaths at age x in France and Italy in 2003 xd
The CDAI measures the deviation from the mean – represented by the denominator of the above formula – of the frequency of occurrence of a specific association of causes. If the CDAI is significantly over 100, then the corresponding association is more frequent than expected. Assuming independence of causes, the CDAIs should not be significantly different from 100.
3. Results
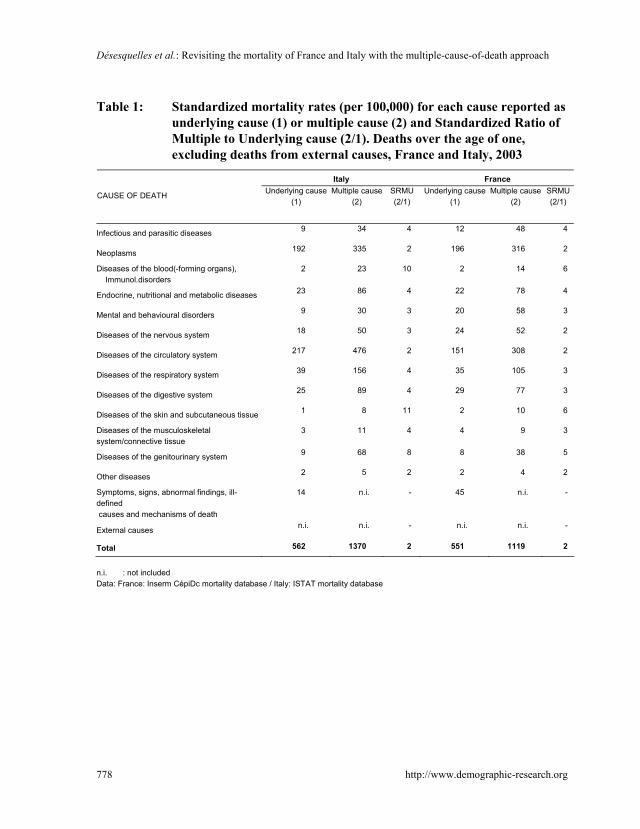
Considering the underlying cause of death only, the mortality profiles of the two countries look very similar. The total standardized mortality rate (excluding infant deaths and deaths from external causes) is only slightly lower in France (551 per 100,000) than in Italy (562 per 100,000) (Table 1). The cause-specific standardized mortality rates of the two countries are generally very similar too. However mortality rates for ill-defined causes and mechanisms of death, as well as for mental and behavioural disorders, are higher in France. Conversely, the rate of mortality assigned to diseases of the circulatory system is higher in Italy (216.9 per 100,000) than in
776 http://www.demographic-research.org

Demographic Research: Volume 23, Article 28
http://www.demographic-research.org 777
France (151.1 per 100,000). When ill-defined causes of death are excluded from the rankings, the top four underlying causes of death are the same in the two countries (neoplasms, diseases of the circulatory system, diseases of the respiratory system and diseases of the digestive system) but neoplasms and diseases of the circulatory system are first and second respectively in France while the situation is the reverse in Italy9.
3.1 A varying number of causes per certificate
The number of causes reported on the death certificate varies with age (Figure 1). In both countries it increases from age 20 up to age 80. When death occurs at an older age the number of listed causes is slightly lower. Figure 1 also shows that, on average, more causes are listed in Italy (4.0) than in France (3.1). When controlling for the different age and sex structure of the decedents in the two countries,10 the average number of causes per certificate remains unchanged. Some of the reported contributory conditions may be ill-defined causes or mechanisms of death that do not shed light on the mortality process. When excluding them from the computation (Table 2) we find that the difference between the two countries narrows (2.4 in France vs. 3.0 in Italy), suggesting that ill-defined causes of death are more frequently reported as contributory causes in Italy. For the remainder of the paper all the ill-defined contributory causes of death are excluded from the analysis, so the distribution of death certificates by the number of listed causes remains different in the two countries. The proportion of deaths with only one defined cause is 33% in France vs. 15% in Italy. Conversely, 58% of the Italian certificates vs. 39 % of the French certificates include at least three defined causes.
9 For a detailed description of the mortality profiles based on the underlying cause of death, see Meslé (2006) for France and Ongaro and Salvini (2009) for Italy. 10 The standardization was performed using the average number of deaths in France and Italy as the standard population.
Désesquelles et al.: Revisiting the mortality of France and Italy with the multiple-cause-of-death approach
778 http://www.demographic-research.org
Table 1: Standardized mortality rates (per 100,000) for each cause reported as underlying cause (1) or multiple cause (2) and Standardized Ratio of Multiple to Underlying cause (2/1). Deaths over the age of one, excluding deaths from external causes, France and Italy, 2003
Italy France
CAUSE OF DEATH Underlying cause (1)
Multiple cause (2)
SRMU (2/1)
Underlying cause (1)
Multiple cause (2)
SRMU (2/1)
Infectious and parasitic diseases 9 34 4 12 48 4
Neoplasms 192 335 2 196 316 2
Diseases of the blood(-forming organs), Immunol.disorders
2 23 10 2 14 6
Endocrine, nutritional and metabolic diseases 23 86 4 22 78 4
Mental and behavioural disorders 9 30 3 20 58 3
Diseases of the nervous system 18 50 3 24 52 2
Diseases of the circulatory system 217 476 2 151 308 2
Diseases of the respiratory system 39 156 4 35 105 3
Diseases of the digestive system 25 89 4 29 77 3
Diseases of the skin and subcutaneous tissue 1 8 11 2 10 6
Diseases of the musculoskeletal system/connective tissue
3 11 4 4 9 3
Diseases of the genitourinary system 9 68 8 8 38 5
Other diseases 2 5 2 2 4 2
Symptoms, signs, abnormal findings, ill-defined causes and mechanisms of death
14 n.i. - 45 n.i. -
External causes n.i. n.i. - n.i. n.i. -
Total 562 1370 2 551 1119 2
n.i. : not included Data: France: Inserm CépiDc mortality database / Italy: ISTAT mortality database

Demographic Research: Volume 23, Article 28
Figure 1: Average number of reported causes on the death certificate by age. Deaths over the age of one, excluding deaths from external causes, France and Italy, 2003
1
1,5
2
2,5
3
3,5
4
4,5
1-9 10-19 20-29 30-39 40-49 50-59 60-69 70-79 80-89 90+
France
Italy
France (excluding ill-definedcauses)Italy (excluding ill-definedcauses)
Data: France: Inserm mortality database / Italy: ISTAT mortality database
Table 2: Number of reported causes on the death certificate. Deaths over the age of one, excluding deaths from external causes, France and Italy, 2003
(%) Ill-defined causes and mechanisms of death INCLUDED
1 2 3 4 5 6+ Average number
France 15 26 25 17 9 8 3.1
Italy 1 10 34 25 15 15 4.0 (%) Ill-defined causes and mechanisms of death
EXCLUDED 1 2 3 4 5 6+ Average number
France 33 29 20 11 5 4 2.4
Italy 15 28 27 16 8 7 3.0 Data: France: Inserm CépiDc mortality database / Italy: ISTAT mortality database
http://www.demographic-research.org 779

Désesquelles et al.: Revisiting the mortality of France and Italy with the multiple-cause-of-death approach
780 http://www.demographic-research.org
Table 3: Average number of reported causes on the death certificate by underlying cause of death (ill-defined causes reported as contributory causes of death are excluded). Deaths over the age of one, excluding deaths from external causes, France and Italy, 2003
UNDERLYING CAUSE OF DEATH Italy France
Infectious and parasitic diseases 3.5 2.7 Neoplasms 3.1 2.5 Diseases of the blood(-forming organs), immunol.disorders 3.0 2.8 Endocrine, nutritional and metabolic diseases 3.5 2.9 Mental and behavioural disorders 2.5 2.3 Diseases of the nervous system 2.6 2.3 Diseases of the circulatory system 3.0 2.5 Diseases of the respiratory system 2.9 2.4 Diseases of the digestive system 3.3 2.9 Diseases of the skin and subcutaneous tissue 2.8 2.5 Diseases of the musculoskeletal system/connective tissue 3.3 3.1 Diseases of the genitourinary system 3.0 2.8 Other diseases 3.1 2.9 Symptoms, signs, abnormal findings, ill-defined causes and mechanisms of death 1.0 1.0 External causes n.i. n.i.
Total 3.0 2.4 Average number standardized for the structure by underlying cause of death 2.9 2.5 n.i.: not included. The standardization was performed using the average of number of deaths in France and Italy as the standard
population. Data: France: Inserm CépiDc mortality database / Italy: ISTAT mortality database
The number of reported causes also depends on the underlying cause (Table 3).11
The two groups with the lowest numbers of reported causes (“mental and behavioural disorders” and “diseases of the nervous system”) are common to both countries. In Italy the highest values are obtained for infectious diseases, for endocrine, nutritional and metabolic diseases, for diseases of the digestive system, and for diseases of the musculoskeletal system. In France, with the exception of infectious diseases that fall into a lower ranking, the same groups of causes also head the list. After controlling for the different underlying-cause-of-death structures of the two countries, the gap in terms of number of reported causes narrows further but does not disappear (2.5 reported causes in France vs. 2.9 in Italy).
11 The same table is provided for the more detailed list of causes in the appendix (table A1).

Demographic Research: Volume 23, Article 28
http://www.demographic-research.org 781
3.2 Stability of the leading causes of death
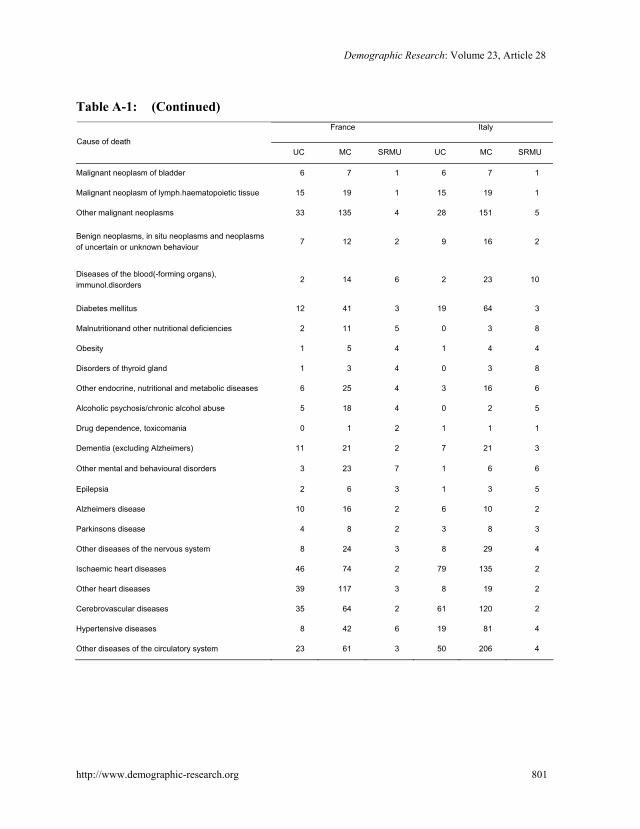
Table 1 also displays the standardized ratios of multiple to underlying cause (SRMU). The smallest value is for neoplasms (1.6 in France and 1.7 in Italy). For all other groups of causes the SRMU is over two. Thus, in more than half of the cases where these causes are mentioned, they are recorded as a contributory cause. The multiple-cause-of-death approach only moderately reinforces the role played by diseases of the circulatory system: the SRMU is equal to 2.0 in France and 2.2 in Italy. The loss of information resulting from the single-cause-of-death approach is larger for respiratory diseases (SRMU equal to 3.0 in France and 4.0 in Italy). The highest values of the SRMU are for diseases of the blood (6.1 in France and 9.9 in Italy), for diseases of the skin and the subcutaneous tissues (5.9 in France and 11.4 in Italy), for diseases of the genitourinary system (4.6 in France and 7.6 in Italy), for infectious diseases (4.0 in both countries), and for endocrine, nutritional and metabolic diseases (3.6 in France and 3.7 in Italy). At a more detailed level of classification (see Table A.1 in the appendix), we find especially high values for septicaemia (6.2 in France and 7.9 in Italy), renal failure (respectively 5.6 and 8.1), malnutrition and other nutritional deficiencies (respectively 5.0 and 7.7), hypertensive diseases (respectively 5.5 and 4.2), as well as, more markedly for Italy, disorders of the thyroid gland (respectively 4.5 and 8.3) and hyperplasia of the prostate (respectively 3.2 and 8.7).
When comparing two broad age groups (over and under eighty - see Table A2 in the appendix) we find that, with very few exceptions, the SRMU is lower in the older age group. This result is in line with our previous observation that the average number of reported causes decreases at very old ages. The SRMU is also generally higher in Italy. As a consequence the multiple-cause-of-death approach results in a larger upward revision of the mortality rates in Italy than in France. However it does not dramatically alter the ranking of the causes of death. In Italy the top five causes of death are exactly the same – and with the same ranking – as when the underlying cause only is considered. In France the MCOD approach strongly reinforces the contribution to mortality of the endocrine, nutritional and metabolic diseases, which “jump” from the seventh to the fourth place of the ranking, just above diseases of the digestive system.
All in all the top five causes of death resulting from the MCOD are the same in the two countries but the order is slightly different: in France, neoplasms head the list, just above diseases of the circulatory system (the situation is the reverse in Italy) and diseases of the respiratory system. When comparing Italy and France, endocrine, nutritional and metabolic diseases, and diseases of the digestive system exchange rankings.

Désesquelles et al.: Revisiting the mortality of France and Italy with the multiple-cause-of-death approach
782 http://www.demographic-research.org
3.3 Three broad patterns of combination of causes
Figure 2.1 and 2.2 display graphically the cause-of-death association indicator (CDAI) for France and Italy.12 The cells of the table that result from the cross-matching of every underlying and every contributory cause of death have been coloured according to the value of the corresponding CDAI. After computing the standard deviation (σ) of this indicator13, we created the five following classes: [0;100[ , [100;100+σ/4[ , [100+σ/4;100+σ/2[ , [100+σ/2;100+3σ/4[ and [100+3σ/4;∞[. The first class is white (weak association) while all other classes are progressively darker shades of pink.
60% of the cells of the two figures have exactly the same colour. In both countries most cells on the diagonal are dark pink: diseases that are classified in the same group as the underlying cause of death are more likely to be involved in the etiological sequence ending in death than other diseases. Not surprisingly, if the death is assigned to an ill-defined cause there is rarely another well-defined cause mentioned on the death certificate: in both France and Italy all corresponding cells (last horizontal line) are white.
Careful examination of the strength of the associations indicates that, depending on the underlying cause, three broad patterns of association can be distinguished. The combinations involving one of the three leading causes of death (neoplasms, diseases of the circulatory system, and respiratory diseases) are generally characterized by weak associations, whatever the “role” (underlying or contributory cause) these conditions play in the morbid process. Specifically to France, we find that a respiratory disease often contributes to the deaths assigned to a disease of the nervous system or to a mental or behavioural disorder.
Three groups of causes display a completely opposite pattern in the two countries: “diseases of the skin and the subcutaneous tissue”, “diseases of the musculoskeletal system and the connective tissue” and the heterogeneous group of “other diseases”. Associations involving these causes, both as underlying and contributory causes of death, are more frequent than expected. These unexpectedly frequent associations are often symmetrical. As an example, the combination between the first (mainly: decubitus ulcer) and the second group (mainly: arthropathies and osteopathies) is visible in the two possible orders. Similarly, these two groups are very frequently and symmetrically associated with an infectious disease (mainly: septicaemia). We find that the deaths assigned to a mental or behavioural disorder (mainly: dementia), a disease of the nervous system (mainly: Parkinson’s and Alzheimer’s diseases) or to an endocrine, nutritional and metabolic disease (mainly: diabetes, volume depletion and malnutrition)
12 These figures (see Figures A1 and A2 in the Appendix) were made for two separate age groups too (deaths over the age of one and under the age of 80, and death at age 80 or over). 13 The standard deviation was calculated taking into account all the values of the CDAI in the two countries.

Demographic Research: Volume 23, Article 28
frequently involve a disease of the skin (mainly: decubitus ulcer or ulcer of lower limb). For diseases of the musculoskeletal system and the connective tissue (mainly: arthropathies and systemic connective tissue disorders), a frequent association with diseases of the blood and the genitourinary diseases (mainly: renal failure) is observed. Specifically to France, external causes (mainly: S and T codes “injury, poisoning and certain other consequences of external causes”) strongly contribute to the deaths assigned to musculoskeletal diseases (mainly: bone disorder). This French specificity is likely to be due to the fact that in Italy, if the automatic procedure fails to code external causes, the underlying cause is often the only coded cause.
Figure 2a): CDAIs –Deaths over the age of one, excluding deaths from external causes, France, 2003
Horizontal axis: contributory cause. Vertical axis: underlying cause Data: Inserm CépiDc mortality database
http://www.demographic-research.org 783

Désesquelles et al.: Revisiting the mortality of France and Italy with the multiple-cause-of-death approach
Figure 2b): CDAIs –Deaths over the age of one, excluding deaths from external causes, Italy, 2003
Horizontal axis: contributory cause. Vertical axis: underlying cause Data: ISTAT mortality database
The infectious diseases display a pattern similar to the previous one, but they
emerge more specifically as a very frequent contributory cause for several underlying causes. Their contribution is especially frequent when the underlying cause is a disease of the blood, of the digestive system, of the skin, of the musculoskeletal system and the connective tissue, or a disease of the genitourinary system. In many cases septicaemia is the reported condition. More specifically to Italy, digestive diseases (mainly: cirrhosis of the liver and hepatic failure) very frequently contribute to the deaths assigned to an infectious disease (mainly: chronic viral hepatitis).
Most cells involving the six remaining groups (“diseases of the blood and blood-forming organs” and “diseases of the genitourinary system”, “endocrine, nutritional and metabolic diseases”, “diseases of the digestive system”, “mental and behavioural disorders” and “diseases of the nervous system”) are in lighter shades of pink or in white. However several very frequent associations can be highlighted. In both countries, a condition belonging to the group “other diseases” (mainly: diseases of the eye and congenital malformations) is frequently mentioned as a contributory cause for an
784 http://www.demographic-research.org

Demographic Research: Volume 23, Article 28
http://www.demographic-research.org 785
endocrine, nutritional or metabolic disease. In France, the deaths assigned to that cause frequently involve a genitourinary disease (mainly: renal failure). Specifically to France too, we find that an external cause is frequently reported if the death is assigned to a mental and behavioural disorder (mainly: dementia and disorder assigned to alcohol use) or a disease of the nervous system (mainly: Parkinson’s disease, Alzheimer’s disease and epilepsy). In a large number of cases, these deaths are due to asphyxia caused by a foreign body in the respiratory tract, which, in practical terms, suggests that the death has been caused by regurgitation related to bed confinement.
4. Discussion
4.1 Impact of the MCOD approach
The multiple-cause-of-death approach does not substantially alter the ranking of the causes of death of either France or Italy. In the literature there are very few studies like ours that present an in-depth analysis of the impact of the MCOD approach for all causes of death. With a different list of causes, Stallard (Stallard 2002) found that the MCOD approach does not modify the hierarchy of the five leading causes of death in the US for the years 1990 and 1998. Likewise for the years 1968 and 1977 in the US, Manton and Stallard (1982) found no change in the five major causes of death except that hypertensive diseases and influenza/pneumonia exchange rankings.14 Not surprisingly the leading causes of death have the lowest values of the SRMU: given the severity of these diseases, which is reflected in their high ranking as underlying causes of death, it is unlikely that they play a contributory role only in the morbid process. However there is no simple negative correlation between the SRMU and the standardized mortality rate computed on the basis of the underlying cause of death. As an example, infectious and parasitic diseases on the one hand, and endocrine, nutritional and metabolic diseases on the other, have the same SRMU (4 in both France and Italy) but a very different ranking in the hierarchy of causes of death.
Though not modifying the ranking of the leading causes of death, our findings clearly indicate that omitting the contributory causes leads to a substantial underestimation of the role played by certain conditions in the process leading to death. These conditions can be broadly categorized in two groups. The first group consists of diseases that are not lethal in themselves but that play a role as “background factors for other causes” (Manton and Stallard 1982: 543): when combined with another serious disease, the risk of dying increases, reflecting either “synergistic” or “additive” morbid
14 Respectively number 4 and 5 with the single-cause-of-death approach and number 5 and 4 with the multiple-cause-of-death approach.

Désesquelles et al.: Revisiting the mortality of France and Italy with the multiple-cause-of-death approach
786 http://www.demographic-research.org
processes (Speizer, Trey, and Parker 1977: 336). Hypertension, identified by several other authors (Dorn and Moriyama 1964; Wing and Manton 1981; Manton and Stallard 1982; Stallard 2002) as a frequent contributory cause of the death, is a good example of a background factor. The second group consists of complications of the initiating disease or of the medical treatment. It is best exemplified by diseases of the blood. In line with the literature (Dorn and Moriyama 1964; Guralnick 1966; Chamblee and Evans 1982; Steenland et al. 1992), we find that the underlying cause approach overlooks the contribution to mortality of anaemia and coagulation defects. Blood disorders can be both the consequence of other diseases (e.g. diseases of the liver) or secondary effects of therapies (e.g. cancer therapies). Renal failure, septicaemia and diseases of the skin (mainly bedsores) also belong to that group. Bedsores, which generally result from bed-confinement, contribute to the process leading to death in so far as they participate in the overall weakening of the body. Renal failure is known to be a potential complication of diabetes. Regarding septicaemia and, more generally, infectious diseases, our results indicate that they continue to be an important factor of mortality, not as underlying cause – as was the case before the epidemiological transition (Omran 1971) – but as contributory cause. Moreover, the grouping of causes we used probably leads to an underestimation of the actual contribution of infectious diseases to mortality since many of them (e.g. influenza, pneumonia, acute bronchitis) are classified in other ICD chapters (e.g. with diseases of the respiratory system). According to Manton (Manton and Stallard 1982: 539), population aging could result in a fresh upsurge in infectious diseases, since chronic degenerative diseases “often progress to a point where the vitality of the organism as a whole is impaired, at which time the organism is susceptible to a lethal infectious complication – usually of the lungs or the blood”. Nam suggested “that the present notion of the stages of the epidemiological transition may be oversimplified, based as it is on the primary cause-of-death model” (Crews 1990: 202). In line with these comments, our results confirm the need to use the MCOD approach to monitor, both retrospectively and prospectively, the trends in mortality involving infectious diseases.
4.2 Combination of causes
Our results confirm that the assumption of independent occurrence of diseases is generally not valid. Many associations are indeed more frequent than would be predicted by a random occurrence of the diseases. We distinguish three broad patterns of associations that are common to both countries. They form a gradient from the three leading causes of death that often have no contributory cause, to far less lethal conditions – such as diseases of the skin or diseases of the musculoskeletal system – for

Demographic Research: Volume 23, Article 28
http://www.demographic-research.org 787
which several combinations appear to be much more frequent than expected. At this point we should draw attention to a side effect of how we calculate the cause-of-death association indicator. As pointed out earlier, the CDAI measures the deviation from the mean of the frequency of occurrence of a specific association of causes. Neoplasms and diseases of the circulatory system, whose weight in overall mortality is overwhelming, contribute much more to the average than the other causes of death. As a consequence all CDAIs computed for the combinations involving these diseases are less likely to be significantly different from 100.
Another striking result concerns the diagonal cells and, more generally, the symmetrical associations. In both countries about two-thirds of the strong associations (dark/very dark pink cells) are symmetrical. This result inevitably raises the question of the extent to which the order of reporting matters. In other words, “should a report of diabetes mellitus as the underlying cause with diseases of heart as contributory or contributory cause be considered the same disease process as the case where the heart disease is the underlying cause and diabetes the contributory condition?” (Guralnick 1966:985-986). Regarding the diagonal cells, we must acknowledge that the result depends on the level of aggregation used to group the causes of death: with a more detailed classification, cases where two reported causes belong to the same group would have been less frequent. But it clearly indicates that complications as well as background factors of the initiating cause are likely to belong to the same ICD chapter as the underlying cause. For the other symmetrical combinations, an analysis at a lower level of classification would provide identical results. Some of these associations (e.g. symmetrical association between a musculoskeletal disease and a disease of the skin) probably reflect the fact that the exact role of certain conditions in the etiological sequence leading to death is often questionable (Coste and Jougla 1994). As suggested by Percy (Percy, Stanek, and Gloeckler 1981), symmetrical associations could also be a consequence of insufficient training of the certifying physicians who may not be fully aware that the order of entry of the terms on the death certificate ultimately determines the selection of the underlying cause by the coders.
4.3 Limitations
We will now return to the main limitation of our study on the quality of the multiple-cause-of-death data. The variation with age in the number of reported causes per certificate (Figure 1) illustrates this point clearly. The increase in the number of reported causes up to age 80 is consistent with the increased frequency of co-morbidity with age. We cannot rule out that the subsequent decline results from a selection effect: people with fewer diseases are likely to live longer. But we suspect that it is rather an

Désesquelles et al.: Revisiting the mortality of France and Italy with the multiple-cause-of-death approach
788 http://www.demographic-research.org
artifact resulting from a less thorough description of the morbid process when death occurs at very old ages (Mackenbach et al. 1995). The need to provide an extensive explanation is certainly less obvious when age seems to be the cause of the death.
There is an abundant literature on the accuracy of information reported by certifying physicians on death certificates (D’Amico et al. 1999; Mant et al. 2006; Speizer, Trey, and Parker 1977; Stallard 2002; Wall et al. 2005). Inconsistencies between death certificates and autopsy reports have been documented. As noted before, erroneous temporal sequencing of causes and incomplete reporting is often attributed to inadequate training of physicians. But even with proper training the certifying physicians may not be fully informed about the morbid process that led to death, and the accuracy of their reporting is likely to be dependent on how – i.e. where, when and why – the death occurred. As an example, reporting is probably less complete in cases of sudden death than in cases where the decedent was suffering from a long-term illness. Moreover, the content of the death certificate also reflects the state of the art of medical knowledge: if the biological plausibility of a combination is high – or is already well-established – then the physicians will be more likely to report this combination of causes (Redelings, Wise, and Sorvillo 2007). Finally, the fact that the death certificate is designed to select the underlying cause, implies that the certifying physician is forced to make a decision “as to the one etiological sequence ending in death”. As a consequence, “he may be prevented from describing the clinical course of death completely” (Guralnick 1966: 979). This is obviously not without consequences for the reporting of multiple causes.
All in all, these various sources of mis/underreporting may result in an inaccurate selection of the underlying cause of the death – which is problematic when the underlying cause only is taken into account – or in heterogeneous reporting of the contributory causes on the certificates. They may thus affect the results both in terms of the revised cause-specific mortality rates and the associations of causes. The next question concerns the extent to which the comparison of the two countries is distorted. The fact that the number of reported causes per certificate - as well as the SRMU - is higher in Italy than in France supports the idea that reporting practices are not alike in France and Italy. Most studies in other countries (White, Selvin, and Merrill 1989; Steenland et al. 1992; Redelings, Sorvillo, and Simon 2006; Australian Bureau of Statistics 2008) show an average number of causes per death certificate that is much lower than that of Italy and close to that of France, but these studies are not fully comparable with ours.15 Neither the different structure of deaths - by age, sex and underlying cause - of the two countries, nor the more extensive use of ill-defined causes as contributory cause in Italy than in France, suffice to explain the gap. Interestingly, most of the difference results from a higher proportion of deaths with no contributory
15 E.g., different reference period, inclusion of the deaths due to an external cause and/or under the age of one.
Demographic Research: Volume 23, Article 28
http://www.demographic-research.org 789
cause in France than in Italy. According to White (White, Selvin, and Merrill 1989), a higher number of causes per certificate signals better diagnosis and more complete recording and, as a consequence, better quality of the data. And indeed in a recent classification of the WHO member states based on the quality of cause-of-death statistics (Mahapatra et al. 2007), Italy is assessed as having medium-high quality data while France is assessed as having medium-low quality data. However, as mentioned earlier, the French and the Italian death certificates differ in two important ways. The fact that the Italian certificate comprises more lines than the French one and, second, the reverse ordering of the causal pathway on the Italian certificate (from the initial to the final cause) could result in an inflation of the number of causes listed by Italian physicians.
In addition to reporting practices, coding procedures also have a major impact on the cause-of-death statistics. In the case of Italy, where ICD-10 has only been in use since 2003, coding procedures are probably not yet stable, but it is not possible to predict how far this distorts the comparison. Regarding the automated coding systems, both countries use ACME to select the underlying cause of death. While STYX directly produces ICD-10 codes, CODSAN II relies on the USA-ERN (Entity Reference Number) system that translates each medical term into a number. A transition table is then used to convert the ERN into an ICD-10 code. So the two systems may produce different outputs at the level of the fourth digit of the ICD classification only. As a consequence we do not expect any impact on the results presented in this paper.
4.4 Why compare countries?
As we have seen, French and Italian cause-of-death data are neither flawless nor fully comparable. While this situation appears to preclude cross-country comparisons, we believe, on the contrary, that it argues in favour of this line of research. Both the similarities and dissimilarities that emerge from the comparison of a set of countries must be interpreted with caution, but they are a potentially fruitful source of information. Unless a clear bias can be identified mutually similar findings usually reinforce each other’s credibility. Dissimilarities may reflect real differences in the morbid processes prevailing in the countries. They may correspond to country-specific certifying and coding practices too. So cross-country comparison helps to identify failures of the coding and/or certification practices as well as other drawbacks of the data gathering tools. It is thus likely to expand our knowledge of the reliability of the multiple-cause-of-death data, which in turn could result in an improvement of their quality. There are several ways to address these failures: adequate training of physicians (including emphasis on the utility of the cause-of-death statistics in terms of public

Désesquelles et al.: Revisiting the mortality of France and Italy with the multiple-cause-of-death approach
790 http://www.demographic-research.org
health), increased access of certifying physicians to the decedents’ medical records, changes in the coding procedures or in the death certificate. Last but not least, we believe that international recommendations on the reporting of multiple causes, as has been done for the selection of the underlying cause, would greatly contribute to improving multiple-cause-of-death statistics. From that perspective particular attention should be paid to deaths that occur at old ages. In 2005 about half of the people who died in both France and Italy were aged 80 and over, and by 2050 the percentage could reach about 80%. In this context access to high quality multiple-cause-of-death data will become an increasingly compelling need.
5. Acknowledgment
The authors wish to thank Kirill F. Andreev for providing the software to produce figures 2a and b and A1 and 2 of this paper.

Demographic Research: Volume 23, Article 28
http://www.demographic-research.org 791
References
Australian Bureau of Statistics (2008): http://www.ausstats.abs.gov.au.
Chamblee, R.F. and Evans, M.C. (1982). New dimensions in cause of death statistics. American Journal of Public Health 72(11): 1265-1270. doi:10.2105/AJPH.72.11.1265.
Coste, J. and Jougla, E. (1994). Mortality from rheumatoid arthritis in France, 1970-1990. International Journal of Epidemiology 23(3): 545-552. doi:10.1093/ije/23.3.545.
Crews, D.E. (1990). Multiple causes of death, chronic diseases and aging. Collegium Antropologicum 14 (2): 197-204.
Désesquelles, A. and Meslé, F. (2004). Intérêt de l’analyse des causes multiples dans l’étude de la mortalité aux grands âges: l’exemple français. Cahiers québécois de démographie 33(1): 83-116.
D'Amico, M., Agozzino, E., Biagino, A., Simonetti, A., and Marinelli, P. (1999). Ill-defined and multiple causes on death certificates- a study of misclassification in mortality statistics. European Journal of Epidemiology 15(2): 141-148. doi:10.1023/A:1007570405888.
Dorn, H.F. and Moriyama, I.M. (1964). Uses and significance of multiple cause tabulations for mortality statistics. American Journal of Public Health Nations Health 54: 400-406.
Eurostat (1998). http://circa.europa.eu/Public/irc/dsis/health/library?l=/methodologies sandsdatasc/causessofsdeath/shortslistpdf/_EN_1.0_&a=d
Frova, L., Salvatore, M.A., Pappagallo, M., and Egidi, V. (2009). The Multiple cause of death approach to analyse mortality patterns. Genus 65(1): 1-21.
Fuhrman, C., Jougla, E., Nicolau, J., Eilstein, D., and Delmas, M.C. (2006). Deaths from chronic obstructive pulmonary disease in France, 1979-2002: a multiple-cause analysis. Thorax 61: 930-934. doi:10.1136/thx.2006.061267.
Guralnick, L. (1966). Some problems in the use of multiple causes of death. Journal of Chronic Diseases 19(9): 979-990. doi:10.1016/0021-9681(66)90031-2.
Israel, R.A., Templeton, M.C., and Evans, M.C. (1972). New approaches to coding and analyzing mortality data. Proceedings of the social statistical section. Washington, DC: American Statistical Association.

Désesquelles et al.: Revisiting the mortality of France and Italy with the multiple-cause-of-death approach
792 http://www.demographic-research.org
Israel, R.A., Rosenberg, H.M., and Curtin, L.R.(1986). Analytical Potential for Multiple Cause-of-Death Data. American Journal of Epidemiology 124(2):161-79.
Istat (2004a). Death certificate and certification practices: an international comparison. Essays 14.
Istat (2004b). Applying ACS to Causes of death Statistics in Italy. Some clues on implementation, bridge coding and further steps. Essays 13.
Janssen, T.A. (1940). Importance of Tabulating Multiple Causes of Death. American Journal of Public Health Nations Health 30: 871-879.
Mackenbach, J.P., Kunst, A., Lautenbach, H., Bijlsma, F., and Oei, Y.B. (1995). Competing causes of death: an analysis using multiple-cause-of-death data from the Netherlands. American Journal of Epidemiology 141 (5): 466-475.
Mahapatra, P., Shibuya, K., Lopez, A.D., Coullare, F., Notzon, F.C., Rao, C., and Szreter, S. (on behalf of Monitoring vital events writing group) (2007). Civil registration systems and vital statistics: sucesses and missed opportunities. The Lancet 370 (10):1653-1663. doi:10.1016/S0140-6736(07)61308-7.
Mannino, D.M., Ford, E., Giovino, G.A., and Thun, M. (1998). Lung cancer deaths in the United States from 1979 to 1992: an analysis using multiple-cause mortality data. International Journal of Epidemiology 27(2): 159-166. doi:10.1093/ije/27.2.159.
Mant, J., Wilson, S., Parry, J., Bridge, P., Wilson, R., Murdoch, W., Quirke, T., Davies, M., Gammage, M., Harriso, R., and Warfield, A. (2006). Clinicians didn’t reliably distinguish between different causes of cardiac death using case histories. Journal of Clinical Epidemiology 59(8): 862-867. doi:10.1016/j.jclinepi.2005.11.021.
Manton, K.G. and Stallard, E. (1982). Temporal trends in U. S. multiple cause of death mortality data: 1968 to 1977. Demography 19: 527-547. doi:10.2307/2061017.
Manton, K.G. (1986). Cause specific mortality patterns among the oldest old: multiple cause of death trends 1968 to 1980. Journal of Gerontology 41(2): 282-289.
Manton, K.G. and Myers, G.C (1987). Recent trends in multiple-caused mortality 1968 to 1992: age and cohort components. Population Research and Policy Review 6: 161-176. doi:10.1007/BF00149207.
Meslé, F. (2006). Recent improvements in life expectancy in France: men are starting to catch up. Population-E 61(4): 365-388.

Demographic Research: Volume 23, Article 28
http://www.demographic-research.org 793
Nizard, A. and Munoz-Pérez, F. (1993). Alcool, tabac et mortalité en France depuis 1950 - Essai d’évaluation des décès dus à la consommation d’alcool et de tabac en 1986. Population 3: 571-607. doi:10.2307/1534096.
Omran, A.R. (1971). The epidemiologic transition: a theory of the epidemiology of population change. The Milbank Memorial Fund Quarterly 489(4): 509-538. doi:10.2307/3349375.
Ongaro, F. and Salvini, S. (eds.) (2009). Rapporto sulla popolazione. Sopravvivenza e salute. Bologna: Il Mulino.
Pace, M. and Grippo, F. (2007). Istruzioni integrative per l’applicazione dell’ICD-10 nella codifica delle cause di morte. Istat - Metodi e Norme 35.
Pavillon, G., Boileau, J., Tenaud, G., Lefèvre, H., and Jougla, E. (2005). Conséquences des changements de codage des causes médicales de décès sur les données nationales de mortalité en France, à partir de l’année 2000. Bulletin Epidémiologique Hebdomadaire 4: 13-16.
Percy, C., Stanek, E., and Gloeckler, L. (1981). Accuracy of cancer death certificates and its effect on cancer mortality statistics. American Journal of Public Health 71(3): 242-250. doi:10.2105/AJPH.71.3.242.
Redelings, M.D., Sorvillo, F., and Simon, P. (2006). A comparison of underlying cause and multiple causes of death. US vital statistics, 2000-2001. Epidemiology 17(1): 100-103. doi:10.1097/01.ede.0000187177.96138.c6.
Redelings, M.D., Wise, M., and Sorvillo, F. (2007). Using multiple cause-of-death data to investigate associations and causality between conditions listed on the death certificate. American Journal of Epidemiology 166(1): 104-108. doi:10.1093/aje/kwm037.
Romon, I., Jougla, E., Balkau, B., and Fagot Campagna, A. (2008). The burden of diabetes-related mortality in France in 2002: an analysis using both underlying and multiple causes of death. European Journal of Epidemiology 23(5):327-334. doi:10.1007/s10654-008-9235-5.
Speizer, F.E., Trey, C., and Parker, P. (1977). The uses of multiple causes of death data to clarify changing patterns of cirrhosis mortality in Massachusetts. American Journal of Public Health 67(4): 333-336. doi:10.2105/AJPH.67.4.333.
Stallard, E. (2002). Underlying and multiple cause mortality at advanced ages: United States 1980-1998. North American Actuarial Journal 6 (3): 64-87.

Désesquelles et al.: Revisiting the mortality of France and Italy with the multiple-cause-of-death approach
794 http://www.demographic-research.org
Steenland, K., Nowlin, S., Ryan, B., and Adams S. (1992). Use of multiple-cause mortality data in epidemiologic analyses: US rate and proportion files developed by the National Institute for Occupational Safety and Health and the National Cancer Institute. American Journal of Epidemiology 136(7): 855-862. doi:10.1093/aje/136.7.855.
Wall, M.M., Huang, J., Oswald, J., and McCullen, D. (2005). Factors contributory with reporting multiple causes of death. Medical Research Methodology 5(4). doi:10.1186/1471-2288-5-4.
White, M.C., Selvin, S., and Merrill, D.W. (1989). A study of multiple causes of death in California: 1955 and 1980. Journal of Clinical Epidemiology 42: 355-365. doi:10.1016/0895-4356(89)90040-1.
WHO (1949). Manual of the international statistical classification of diseases, injuries, and causes of death. Sixth revision. Geneva: World Health Organization.
WHO (2005). International Statistical Classification of Diseases and related Health Problems 10th Revision Second Edition. Geneva: World Health Organization.
Wing, S. and Manton, K.G. (1981). A multiple cause of death analysis of hypertension-related mortality in North Carolina, 1968-1977. American Journal of Public Health 71(8): 823-830. doi:10.2105/AJPH.71.8.823.
Wise, M.E. and Sorvillo, F. (2005). Hepatitis A-related mortality in California, 1989-2000: analysis of multiple-coded death data. American Journal of Public Health 95(5): 900-905. doi:10.2105/AJPH.2003.035485.

Demographic Research: Volume 23, Article 28
http://www.demographic-research.org 795
Appendix
Group # Groups and subgroups ICD-10 code
1 Infectious and parasitic diseases
Tuberculosis A15-A19, B90
AIDS (HIV-disease) B20-B24
Viral hepatitis B15-B19, B94.2
Septicaemia A40-A41
Intestinal infectious diseases A00-A09
Other Infectious and parasitic diseases (A00-B99) excluding Supra codes
2 Neoplasms
Malignant neoplasm of lip, oral cavity, pharynx C00-C14
Malignant neoplasm of oesophagus C15
Malignant neoplasm of stomach C16
Malignant neoplasm of colon, rectum, and anus C18,C19, C20, C21
Malignant neoplasm of liver and intrahepatic bile ducts C22
Malignant neoplasm of pancreas C25
Malignant neoplasm of larynx and trachea/bronchus/lung C32-C34
Malignant melanoma of skin C43
Malignant neoplasm of skin C44
Malignant neoplasm of breast C50
Malignant neoplasm of cervix uteri and other parts of uterus C53, C54, C55
Malignant neoplasm of ovary C56
Malignant neoplasm of prostate C61
Malignant neoplasm of kidney C64
Malignant neoplasm of bladder C67

Désesquelles et al.: Revisiting the mortality of France and Italy with the multiple-cause-of-death approach
796 http://www.demographic-research.org
Malignant neoplasm of lymph, haematopoietic tissue C81-C96
Other malignant neoplasms (C00-C99) excluding Supra codes
Benign neoplasms, in situ neoplasms and neoplasms of
uncertain or unknown behaviour
D00-D09, D10-D36, D37-D48
3 Diseases of the blood(-forming organs), immunol. disorders
D50-D89
4 Endocrine, nutritional and metabolic diseases
Diabetes mellitus E10-E14
Malnutrition and other nutritional deficiencies E40-E64
Obesity E65-E68
Disorders of thyroid gland E00-E07
Other endocrine, nutritional and metabolic diseases (E00-E90) excluding Supra codes
5 Mental and behavioural disorders
Alcoholic psychosis/chronic alcohol abuse F10, G31.2
Drug dependence, toxicomania F11-F16, F18-F19
Dementias (excluding Alzheimer’s) F01, F03, G31.0, G31.8, G31.9
Other mental and behavioural disorders (F00-F99) excluding Supra F codes
6 Diseases of the nervous system
Epilepsy G40-G41
Alzheimer’s disease G30
Parkinson’s disease G20, G21
Other diseases of the nervous system (G00-G98) excluding (G31.0, G31.2,
G31.8, G31.9) and Supra codes

Demographic Research: Volume 23, Article 28
http://www.demographic-research.org 797
7 Diseases of the circulatory system
Ischaemic heart diseases I20-I25
Other heart diseases I30-I33, I39-I45, I47-I48, I49.1-I52, I00-
Cerebrovascular diseases I60-I69
Hypertensive diseases I10-I15
Other Diseases of the circulatory system (I00-I99) excluding (I46, I49.0, I95.9,
I99) and Supra codes
8 Diseases of the respiratory system
Influenza J10-J11
Pneumonia J12-J18
Other acute lower respiratory diseases J00-J09, J19-J22
Asthma J45-J46
Other chronic lower respiratory diseases J40-J44
Lung diseases due to external agents J60-J70
Other diseases of the respiratory system (J00-J99) (J96.0, J96.9) excluding
Supra codes
9 Diseases of the digestive system
Ulcer of stomach, duodenum and jejunum K25-K28
Chronic liver disease K70, K73-K74
Other diseases of the digestive system (K00-K93) excluding Supra codes
10 Diseases of the skin and subcutaneous tissue L00-L99
11 Diseases of the musculoskeletal system/connective tissue
Rheumatoid arthritis and arthrosis M05-M06, M15-M19
Other diseases of the musculoskeletal
system/connective tissue
(M00-M99) excluding Supra codes

Désesquelles et al.: Revisiting the mortality of France and Italy with the multiple-cause-of-death approach
798 http://www.demographic-research.org
12 Diseases of the genitourinary system
Renal failure N17-N19
Other diseases of kidney and ureter N00-N16
Hyperplasia of prostate N40
Other diseases of the genitourinary system (N00-N99) excluding Supra codes
13 Other diseases
Complications of pregnancy, childbirth and puerperium
Certain conditions originating in the perinatal period
Congenital malformations and chromosomal abnormalities
Diseases of the eye and adnexia
Diseases of the ear and mastoid process
SIDS
O00-O99
(P00-P96) excluding P28.5
Q00-Q99
H00- H59
H60- H95
R95
14 Symptoms, signs, abnormal findings and ill- defined causes
Senility R54
Mechanisms of death ° I46, I49.0, R09.2, R40.2, R57
Other symptoms, signs, abnormal findings and ill-defined
causes °°
(R00-R94), (R96-R99),
I95.9, I99, J96.0, J96.9, P.28.5, U00
excluding Supra R codes
15 External causes S, T, V, W, X Y codes
°) Cardiac arrest (I46.0), Ventricular fibrillation (I49.0), Respiratory arrest (R09.2), Coma (R40.2), Shock (R57) °°) Hypotension (I95.9), Other unspecified disorders of circulatory system (I99), Acute respiratory failure (J96.0), Respiratory failure
unspecified (J96.9), Respiratory failure of newborn P(.28.5)

Demographic Research: Volume 23, Article 28
http://www.demographic-research.org 799
Abbreviations used for figures 2a, 2b, A1 and A2
# Multiple cause group Abbreviation
1 Infectious and parasitic diseases INF
2 Neoplasms NEO
3 Diseases of the blood(-forming organs), immunol.disorders BLOOD
4 Endocrine, nutritional and metabolic diseases ENDOC
5 Mental and behavioural disorders MENT
6 Diseases of the nervous system NERV
7 Diseases of the circulatory system CIRC
8 Diseases of the respiratory system RESP
9 Diseases of the digestive system DIG
10 Diseases of the skin and subcutaneous tissue SKIN
11 Diseases of the musculoskeletal system/connective tissue MUS
12 Diseases of the genitourinary system GEN
13 Other diseases OTHER
14 Symptoms, signs, abnormal findings, ill-defined causes ILLDEF
15 External cause EXT

Désesquelles et al.: Revisiting the mortality of France and Italy with the multiple-cause-of-death approach
800 http://www.demographic-research.org
Table A-1: Standardized mortality rates (per 100,000) for each cause reported as underlying cause (UC) or multiple cause (MC) and Standardized Ratio of Multiple to Underlying cause (SRMU) – Deaths over the age of one, excluding deaths from external causes, France and Italy, 2003
France Italy Cause of death
UC MC SRMU UC MC SRMU
Tuberculosis 1 2 2 1 1 3
AIDS (HIV-disease) 2 3 2 2 4 2
Viral hepatitis 1 3 4 3 8 3
Septicaemia 5 29 6 2 19 8
Intestinal infectious diseases 1 1 1 0 0 2
Other infectious and parasitic diseases 3 12 4 1 3 4
Malignant neoplasm of lip, oral cavity, pharynx 7 8 1 4 4 1
Malignant neoplasm of oesophagus 6 7 1 2 3 1
Malignant neoplasm of stomach 6 7 1 12 13 1
Malignant neoplasm of colon, rectum and anus 19 22 1 19 22 1
Malignant neoplasm of the liver and the intrahepatic bile ducts
9 11 1 11 12 1
Malignant neoplasm of pancreas 9 10 1 10 10 1
Malignant neoplasm of larynx and trachea/bronchus/lung 40 44 1 42 46 1
Malignant melanoma of skin 2 2 1 2 2 1
Malignant neoplasm of skin 1 1 1 0 1 2
Malignant neoplasm of breast 13 15 1 12 15 1
Malignant neoplasm of cervix uteri and other parts of uterus 3 4 1 3 3 1
Malignant neoplasm of ovary 4 4 1 3 4 1
Malignant neoplasm of prostate 12 17 1 9 13 1
Malignant neoplasm of kidney 4 5 1 3 4 1
Demographic Research: Volume 23, Article 28
http://www.demographic-research.org 801
Table A-1: (Continued) France Italy
Cause of death UC MC SRMU UC MC SRMU
Malignant neoplasm of bladder 6 7 1 6 7 1
Malignant neoplasm of lymph.haematopoietic tissue 15 19 1 15 19 1
Other malignant neoplasms 33 135 4 28 151 5
Benign neoplasms, in situ neoplasms and neoplasms of uncertain or unknown behaviour
7 12 2 9 16 2
Diseases of the blood(-forming organs), immunol.disorders
2 14 6 2 23 10
Diabetes mellitus 12 41 3 19 64 3
Malnutritionand other nutritional deficiencies 2 11 5 0 3 8
Obesity 1 5 4 1 4 4
Disorders of thyroid gland 1 3 4 0 3 8
Other endocrine, nutritional and metabolic diseases 6 25 4 3 16 6
Alcoholic psychosis/chronic alcohol abuse 5 18 4 0 2 5
Drug dependence, toxicomania 0 1 2 1 1 1
Dementia (excluding Alzheimers) 11 21 2 7 21 3
Other mental and behavioural disorders 3 23 7 1 6 6
Epilepsia 2 6 3 1 3 5
Alzheimers disease 10 16 2 6 10 2
Parkinsons disease 4 8 2 3 8 3
Other diseases of the nervous system 8 24 3 8 29 4
Ischaemic heart diseases 46 74 2 79 135 2
Other heart diseases 39 117 3 8 19 2
Cerebrovascular diseases 35 64 2 61 120 2
Hypertensive diseases 8 42 6 19 81 4
Other diseases of the circulatory system 23 61 3 50 206 4

Désesquelles et al.: Revisiting the mortality of France and Italy with the multiple-cause-of-death approach
802 http://www.demographic-research.org
Table A-1: (Continued) France Italy
Cause of death UC MC SRMU UC MC SRMU
Influenza 0 1 1 1 1 2
Pneumonia 11 38 3 7 38 5
Other acute lower respiratory diseases 3 9 3 1 3 4
Asthma 1 3 2 1 2 3
Other chronic lower respiratory diseases 9 19 2 23 57 3
Lung diseases due to external agents 3 10 4 1 5 4
Other diseases of the respiratory system 7 32 5 6 63 11
Ulcer of stomach, duodenum and jejunum 1 3 3 1 4 4
Chronic liver disease 13 23 2 12 25 2
Other diseases of the digestive system 15 56 4 12 67 5
Diseases of the skin and subcutaneous tissue 2 10 6 1 8 11
Rheumatoid arthritis and arthrosis 1 2 3 1 4 5
Other diseases of the musculoskeletal system/connective tissue
3 7 3 2 7 3
Renal Failure 5 30 6 7 59 8
Other diseases of kidney and ureter 1 2 3 0 2 5
Hyperplasia of prostate 0 1 3 0 2 9
Other diseases of the genitourinary system 2 6 3 1 7 7
Other Diseases 2 4 2 2 5 2
Senility 4 - - 4 - -
Mechanisms of death 19 - - 7 - -
Other Symptoms, signs, abnormal findings, ill-defined causes
22 - - 3 - -
Data: France: Inserm CépiDc mortality database / Italy: ISTAT mortality database

Demographic Research: Volume 23, Article 28
http://www.demographic-research.org 803
Table A-2: Standardized ratio of multiple to underlying cause by age group and underlying cause of the death – Deaths over the age of one, excluding deaths from external causes, France and Italy, 2003
France Italy CAUSE OF DEATH
Under 80 80 or more Under 80 80 or more
Infectious and parasitic diseases 4.2 3.6 3.8 4.8
Neoplasms 1.6 1.6 1.7 1.8
Diseases of the blood(-forming organs), immunol.disorders 7.1 4.6 11.0 8.7
Endocrine, nutritional and metabolic diseases 3.8 3.3 3.8 3.6
Mental and behavioural disorders 3.6 2.2 3.6 3.1
Diseases of the nervous system 2.4 1.9 2.7 2.9
Diseases of the circulatory system 2.1 2.0 2.3 2.1
Diseases of the respiratory system 3.6 2.6 4.6 3.5
Diseases of the digestive system 2.7 2.4 3.7 3.2
Diseases of the skin and subcutaneous tissue 8.5 4.9 13.3 10.4
Diseases of the musculoskeletal system/connective tissue 2.7 2.5 3.3 4.4
Diseases of the genitourinary system 5.6 3.8 8.4 6.9
Other diseases 2.1 10.3 2.1 5.5
Data: France: Inserm CépiDc mortality database / Italy: ISTAT mortality database

Désesquelles et al.: Revisiting the mortality of France and Italy with the multiple-cause-of-death approach
Figure A1: CDAIs – Deaths over the age of one and under the age of 80, excluding deaths from external causes, France and Italy, 2003.
Horizontal axis: contributory cause. Vertical axis: underlying cause Data: France: Inserm CépiDc mortality database / Italy: ISTAT mortality database
804 http://www.demographic-research.org

Demographic Research: Volume 23, Article 28
Figure A2: CDAIs – Deaths at the age of 80 or more, excluding deaths from external causes, France and Italy, 2003.
Horizontal axis: contributory cause. Vertical axis: underlying cause Data: France: Inserm CépiDc mortality database / Italy: ISTAT mortality database
http://www.demographic-research.org 805

Désesquelles et al.: Revisiting the mortality of France and Italy with the multiple-cause-of-death approach
806 http://www.demographic-research.org