revista do ic do rs 2003
TRANSCRIPT

Revista Médica do Instituto deCardiologia
Ano 3 / Volume 1 - www.cardiologia.org.br

______________________________________________ INDICE 2003
DYNAMICS OF THE PULMONARY VENOUS FLOW IN THE FETUS AND ITS ASSOCIATIONVASCULAR DIAMETERPaulo ZIELINSKY, Antônio L. PICCOLI Jr, Eduardo I. GUS, João Luiz MANICA, Fabíola SATLER,Luiz Henrique NICOLOSO, Stelamaris LUCHESE, Silvana MARCANTONIO, Marlui SCHEID, Do-mingos M. HATEM. Circulation 2003;108:2377-2380
COMPARISON OF LEFT VENTRICULAR ELECTROMECHANICAL MAPPING AND LEFT VENTRICULARANGIOGRAPHY: DEFINING PRACTICAL STANDARTS FOR ANALYSIS OF NOGATM MAPS.Rogério SARMENTO-LEITE, Guilherme V. SILVA, Hans F.R. DOHMAN, Ricardo M. ROCHA, HansJ.F. DOHMAN, Nelson Durval S.G. MATTOS, Luis Antonio CARVALHO, Carlos A.M.GOTTSCHALL. Texas Heart Institute Journal 2003;30:19-26
Impact of renal denervation on renal content of GLUT1, albuminuria, and urinary TGF-B1 instreptozotocina-induced diabetic rats.Beatriz D. SCHAAN, Sílvia LACCHINI, Marcello C. BERTOLUCI, Maria C. IRIGOYEN, Ubiratan F.MACHADO, Helena SCHMID. Neuroscience: Basic and Clinical 2003;104:88-94
RIGHT VENTRICLE BRONCHOGENIC CYST.Paulo R. PRATES, , Abud HOMSI-NETO, Marinez BARRA, João Ricardo M. SANT’ANNA, RenatoA.K. KALIL, Ivo A. NESRALLA. Texas Heart Institute Journal 2003;30(1):71-73.
NEW LEAD FOR IN UTERO PACING FOR FETAL CONGENITAL HEART BLOCK.Renato S. ASSAD, Paulo ZIELINSKY, Renato A.K. KALIL, Gustavo G. LIMA, Anna M.ARAMAYO. Journal Thoracic and Cardiovascular Surgery 2003;126(1):300-302
O PAPEL DA PROTEÍNA QUINASE C NO DESENVOLVIMENTO DAS COMPLICAÇÕES VASCULARESDO DIABETES MELLITUS.Beatriz D. SCHAAN. Arquivos Brasileiros de Endocrinologia e Metabologia 2003;47(6):654-662
PULSATILIDADE VENOSA PULMONAR EM FETOS DE MÃES DIABÉTICAS: UM ESTUDODOPPLER-ECOCARDIOGRÁFICO PRÉ-NATAL.Paulo ZIELINSKY, Antonio L. PICCOLI Jr, Lucas TEIXEIRA, Eduardo I. GUS, João L. MANICA,Fabíola SATLER, Humberto VAZ, Luiz Henrique NICOLOSO, Stelamaris LUCHESE, MarluiSCHEID, Silvana MARCANTONIO, Domingos M. HATEM. Arquivos Brasileiros de Cardiologia2003; 81(6): 600-603
FATORES PREDITIVOS DE COMPLICAÇÕES APÓS O IMPLANTE DE “STENTS” CORONARIANOS.Alexandre S. QUADROS, Carlos A.M. GOTTSCHALL, Rogério SARMENTO-LEITE, Miguel GUS,Rodrigo WAINSTEIN, André BUSSMANN. Arquivos Brasileiros de Cardiologia 2003;80(5): 531-537
ASSOCIAÇÃO ENTRE A DOENÇA ATEROSCLERÓTICA CORONARIANA E A ESPESSURA MÉDIO-INTIMAL DA CARÓTIDA COMUM ATRAVÉS DA ULTRA-SONOGRAFIA.Eduardo M. ROSA, Caroline KRAMER, Iran CASTRO. Arquivos Brasileiros de Cardiologia2003;80(6):585-8
BEHAVIOUR OF THE “SEPTUM PRIMUM” MOBILITY IN THIRD TRIMESTER FETUSES WITHMYOCARDIAL HYPERTROPHY.Cora FIRPO, Paulo ZIELINSKY. Ultrasound in Obstetrics & Gynecology 2003;21:445-50

________________________________DISSERTAÇÕES
A Teoria do Autocuidado no Manejo dos Fatores de Risco (Obesidade, Hipertensão eTabagismo) em Pacientes Pós-Infarto Agudo do Miocárdio.Autor: Silvia GOLDMEIER - Orientador: Prof. Dr. Iran CASTRO
Variações da Função Diastólica do Ventrículo Esquerdo de Acordo com a Idade Através daEcocardiografia com Doppler Tissular.Márcia D. PEDONE - [Orientador: Prof. Dr. Iran CASTRO]
Correlação e concordância entre medidas ecocardiográficas obtidas durante o exame noecocardiógrafo, com medidas de imagens digitalizadas em estação de trabalho dedicada.Maria Amélia B. HATEM - [Orientador: Prof. Dr. Iran CASTRO]
Aferição da Taxa de Eritroblastos e dos Parâmetros do Equilíbrio Acidobásico no Sangue daVeia Umbilical no Nascimento Capacitação da Enfermagem na Aplicação da Metodologia.Maria Antonieta MORAES [Orientador: Prof. Dr. Ivo BEHLE]
O Uso do Balão Intra-Aórtico no Pré-Operatório de Cirurgia de Revascularização MiocárdicaAssociada à Disfunção Ventricular Grave.Marcelo KERN [Orientador: Prof. Dr. João Ricardo Sant’Anna]
Triiodotironina Oral na Prevenção da Redução do Hormônio da Tireóide em Cirurgia CardíacaValvar em Adultos.Ana Paula Arbo MAGALHÃES [Orientador: Profª. Drª. Beatriz D. SCHAAN]
Associação do perfil lipídico, da proteína C reativa ultra sensível, do fibrinogênio e daglicemia com a evolução intra e pós-hospitalar de pacientes com síndrome isquêmicaagudas.Elizabeth DUARTE [Orientador: Profª. Drª. Vera L. PORTAL]
Prevalência de Hipertensão Arterial Sistêmica em uma População acima de 40 anos emCaxias do Sul.José Antonio V. MASCIA [Orientador: Prof. Dr. Mauro R.S. MOURA]Banca avaliadora: Prof. Dr. Celso Blacher / UFRGS; Prof. Dr. Iran Castro / FUC; Profª. Drª.Vera L. PORTAL / FUC.
Alternativa Prática do Uso de Amiodarona Oral na Prevenção de Fibrilação e Flutter Atrial noPós-Operatório de Cirurgia de Revascularização Miocárdica.Rafael ALCALDE [Orientador: Prof. Dr. Iran CASTRO]
Distribuição do Fluxo em Artérias Pulmonares na Anastomose de Blalock-Taussig ModificadaConforme Modelo Computadorizado.Francisco MICHIELIN FILHO [Orientação: Prof. Dr. João Ricardo M. SANT’ANNA]
Ablação da condução atrioventricular por cateter de radiofreqüência em pacientes comfibrilação atrial: efeitos na qualidade de vida.Carlos Antônio KALIL [Orientador: Prof. Dr. Renato A.K. Kalil]
_____________________________________________________________EDITORIAL A REVISTA MÉDICA DO INSTITUTO DE CARDIOLOGIA DO RIO GRANDE DO SUL/
FUNDAÇÃO UNIVERSITÁRIA DE CARDIOLOGIA foi criada por Rubem Rodrigues como o Órgão de
divulgação cultural e científico desta Instituição, tendo retratado artigos de grande utilidade cultural
nas áreas de Cardiopatia Isquêmica (Vol 1 Nº 1e 2) Prevenção em Cardiologia (Vol 1 Nº 3) e
Cardiologia Pediátrica e Fetal (Revista Vol 2 Nº 2 - Cardiologia Pediátrica e Fetal II) tendo contribuído
para a divulgação da ciência cardiovascular e da melhoria da prática cardiológica em nosso meio.
Recentemente, a revista sofreu as conseqüências das dificuldades econômicas de nosso país e
teve sua divulgação interrompida por falta de patrocinadores.
Inconformados com a impossibilidade de levar adiante o projeto iniciado pelo Prof. Rubem e tão
bem conduzido posteriormente pelo Editor Nelson C. Nonohay com auxílio de um excelente Conselho
Editorial tendo como Presidente Ivo A. Nesralla, Cardiologia Clínica Oscar Dutra, Cardiologia Setorial
Nestor S. Daudt e Epidemiologia Iseu Gus , os professores do curso de pós-graduação reunidos
decidiram manter a revista em um formato eletrônico, sem custos e com a intenção de divulgar a
produção intelectual da Instituição.
Esta mudança de foco deve ficar bem definida para os nossos leitores e associados,
particularmente os que não atuam no âmbito acadêmico. As modificações em nosso perfil editorial
foram motivadas pela impossibilidade econômica de manter a revista em papel e os artigos menos
voltados às questões utilitárias e sim à investigação cardiovascular inovadora, provenientes de teses
da nossa pós-graduações e das publicações realizadas por nossa massa crítica acadêmica em
revistas nacionais e internacionais.
Assim pretendemos dar continuidade a revista atualizando nossos leitores do que tem-se
produzido em publicações na casa, de forma concentrada e acessível.
Por motivos alheios a nossa vontade não podemos em um primeiro número dispor toda a
demanda reprimida de publicações realizadas por membros desta casa, assim pedimos colaborações
no sentido de nos balizar as publicações que lhes forem mais prementes de serem divulgadas neste
meio de comunicação.
Aproveitamos para lembrar a todos que a pesquisa no IC/FUC depende de verbas e que o novo
FAPICC esta aceitando qualquer tipo de doação, assim como a possibilidade de comerciais nesta
página são bem-vindas, bastando entrar em contato conosco, [email protected]
Dr. Iran Castro Prof. do Programa de Pós-Graduação IC/FUC, Editor Dr. Renato A. K. Kalil Diretor Científico do IC/FUC

Dynamics of the Pulmonary Venous Flow in the Fetus andIts Association With Vascular Diameter
Paulo Zielinsky, MD, PhD; Antônio Piccoli, Jr, MD; Eduardo Gus, MD; João Luiz Manica, MD;Fabíola Satler, MD; Luiz Henrique Nicoloso, MD, MSc; Stelamaris Luchese, MD, MSc;
Silvana Marcantonio, MD, MSc; Marlui Scheid, MD; Domingos Hatém, MD, MSc
Background—The usual positioning of the Doppler sample volume to assess fetal pulmonary vein flow is in the distalportion of the vein, where the vessel diameter is maximal. This study was performed to test the association of thepulmonary vein pulsatility index (PVPI) with the vessel diameter.
Methods and Results—Twenty-three normal fetuses (mean gestational age, 28.6�5.3 weeks) were studied by Dopplerechocardiography. Pulmonary right upper vein flow was assessed adjacent to the venoatrial junction (“distal” position)and in the middle of the vein (“proximal” position). The vessel diameter was measured by 2D echocardiography withpower Doppler, and the PVPI was obtained by the ratio (maximal velocity [systolic or diastolic peak]�minimal velocity[presystolic peak])/mean velocity. The statistical analysis used t test and exponential correlation studies. Mean distaldiameter was 0.33�0.10 cm (0.11 to 0.57 cm), and mean proximal diameter was 0.16�0.08 cm (0.11 to 0.25 cm)(P�0.0001). Mean distal PVPI was 0.84�0.21 (0.59 to 1.38), and mean proximal PVPI was 2.09�0.59 (1.23 to 3.11)(P�0.0001). Exponential inverse correlation between pulmonary vein diameter and pulsatility index was highlysignificant (P�0.0001), with a determination coefficient of 0.439.
Conclusions—In the normal fetus, the pulmonary venous flow pulsatility decreases from the lung to the heart, and thisparameter is inversely correlated to the diameter of the pulmonary vein, which increases from its proximal to its distalportion. This study emphasizes the importance of the correct positioning of the Doppler sample volume, adjacent to thevenoatrial junction, to assess pulmonary venous flow dynamics. (Circulation. 2003;108:2377-2380.)
Key Words: fetus � echocardiography � blood flow � physiology � vessels
Fetal Doppler echocardiography is an expanding field, andfunctional studies are now an essential part of the routine
examination.The paramount importance of the events taking place in the
left atrium, such as flow through the foramen ovale, comingfrom the ductus venosus, mitral flow patterns, and flow fromthe pulmonary veins, are directly related to left atrial pressureand volume and to left ventricular relaxation and compliance.Analysis of the pulmonary vein flow has been used alongwith other parameters in the assessment of fetal diastolicfunction.1,2 The pulmonary vein pulsatility index (PVPI)reflects the relative impedance to the forward flow and isbelieved to be better comparable than absolute values ofindividual waveforms and independent of the insonationangle.3 The standard position of the Doppler sample volumeto obtain the pulmonary vein flow is in the distal portion ofthe vein, adjacent to the venoatrial junction, where the vesseldiameter is maximal. Morphometric studies of the pulmonaryvenous vasculature confirm that the pulmonary veins show atapering pattern from the left atrium to the hylum,4,5 andmathematical models show that the flow wave is altered by
the change in the cross-sectional area of the vessel.6–10 Itseemed logical to suppose that if the Doppler sampling wereperformed more proximally, in a region where the pulmonaryvein size was smaller, the results could be different, possiblyexpressing an increased impedance to the forward flow wherethe vessel was narrower.
Thus, this study was performed to test the hypothesis thatthe PVPI should be lower in the venoatrial junction than at amore proximal site and that this behavior should be correlatedto the progressive decrease in the vessel diameter from theleft atrium toward the lung.
MethodsTwenty-three normal fetuses, with a mean gestational age of28.6�5.3 weeks (20 to 36 weeks) were studied by cross-sectionaland Doppler echocardiography. Any maternal or fetal abnormalitiesexcluded the patient from the study. Commercially available equip-ment with 2D, M-mode, pulsed, and continuous Doppler; color flowmapping; and power angio-Doppler capabilities was used.
Considering the established reproducibility of transthoracic pul-monary venous Doppler flow indices,11 intraobserver and interob-server variability was not calculated.
Received April 28, 2003; revision received July 11, 2003; accepted July 11, 2003.From the Fetal Cardiology Unit, Institute of Cardiology of Rio Grande do Sul, Porto Alegre, Brazil.Correspondence to Dr Paulo Zielinsky, Instituto de Cardiologia do Rio Grande do Sul, Unidade de Pesquisa, Av Princesa Isabel, 370, Santana, Porto
Alegre Zip 90.620-001. E-mail [email protected] or [email protected]© 2003 American Heart Association, Inc.
Circulation is available at http://www.circulationaha.org DOI: 10.1161/01.CIR.0000093195.73667.52
2377

Pulmonary venous flow was assessed in the upper right vein at 2different sites: adjacent to the opening to the left atrium (“distal”position) and in the middle of the vein (“proximal” position), belowthe level of the middle lobe vein.12 The vessel diameter wasmeasured at the 2 sites by 2D echocardiography enhanced withpower Doppler (Figure 1). PVPI was obtained by the pulsed Dopplerratio, as follows: (maximal velocity [systolic or diastolicpeak]�minimal velocity [presystolic peak])/mean velocity, electron-ically calculated by the equipment after manual tracing of thepulmonary waveforms during the entire cardiac cycle (Figure 2). Themean of 5 measurements was considered, in the absence of fetalbreathing movements.
Informed consent was obtained in every case.Statistical analysis used t test and exponential correlation studies,
with a confidence limit of 99%.
ResultsMean distal internal diameter was 0.33�0.10 cm (0.11 to0.57 cm), with a median of 0.32 cm, and mean proximal
diameter was 0.16�0.08 cm (0.11 to 0.25 cm), with a medianof 0.16 cm (P�0.0001) (Figure 3).
There was no statistical difference between mean systolic(S wave) and diastolic (D wave) peak velocities at the 2 sites(distal S�0.20�0.09 m/s [0.17 to 0.58 m/s], proximalS�0.22�0.08 m/s [0.14 to 0.52 m/s]; distal D�0.21�0.09m/s [0.14 to 0.53 m/s], proximal D�0.19�0.14 m/s [0.10 to0.53 m/s]).
Mean peak presystolic velocity (A wave) was significantlyhigher in the distal position (A�0.12�0.04 m/s [0.06 to 0.16m/s]) than at the proximal site (A��0.12�0.07 m/s [�0.13to 0.09 m/s]) (P�0.002).
Figure 1. Right upper pulmonary (PULM)vein imaging in a 33-week fetus by 2Dechocardiography enhanced by powerDoppler. Notice progressive increase ofvessel diameter toward left atrium (LA).
Figure 2. Doppler tracing of a typical distal pulmonary vein flow.Velocities were electronically calculated after manual tracing ofwaveforms. Presystolic velocity is 0.09 m/s, and calculated pul-satility index is 1.21.
Figure 3. Diagram showing median distal and proximal pulmo-nary vein (PV) diameters. Horizontal bars above and belowmedian boxes represent maximal and minimal values of PVdiameter.
2378 Circulation November 11, 2003
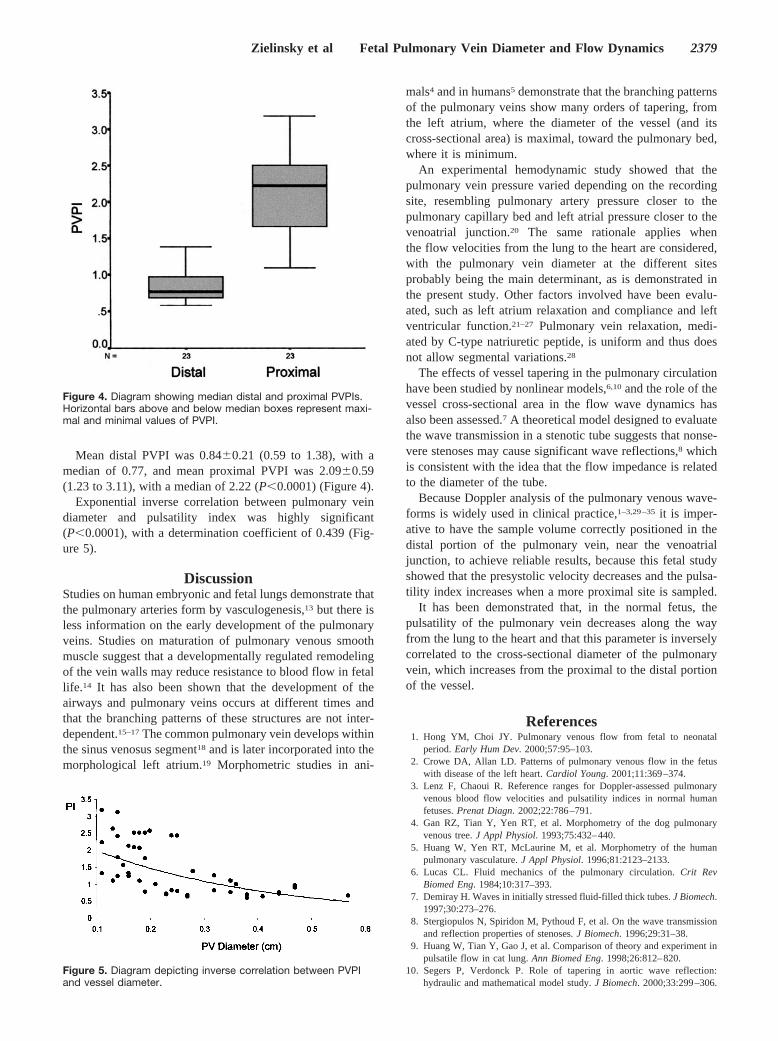
Mean distal PVPI was 0.84�0.21 (0.59 to 1.38), with amedian of 0.77, and mean proximal PVPI was 2.09�0.59(1.23 to 3.11), with a median of 2.22 (P�0.0001) (Figure 4).
Exponential inverse correlation between pulmonary veindiameter and pulsatility index was highly significant(P�0.0001), with a determination coefficient of 0.439 (Fig-ure 5).
DiscussionStudies on human embryonic and fetal lungs demonstrate thatthe pulmonary arteries form by vasculogenesis,13 but there isless information on the early development of the pulmonaryveins. Studies on maturation of pulmonary venous smoothmuscle suggest that a developmentally regulated remodelingof the vein walls may reduce resistance to blood flow in fetallife.14 It has also been shown that the development of theairways and pulmonary veins occurs at different times andthat the branching patterns of these structures are not inter-dependent.15–17 The common pulmonary vein develops withinthe sinus venosus segment18 and is later incorporated into themorphological left atrium.19 Morphometric studies in ani-
mals4 and in humans5 demonstrate that the branching patternsof the pulmonary veins show many orders of tapering, fromthe left atrium, where the diameter of the vessel (and itscross-sectional area) is maximal, toward the pulmonary bed,where it is minimum.
An experimental hemodynamic study showed that thepulmonary vein pressure varied depending on the recordingsite, resembling pulmonary artery pressure closer to thepulmonary capillary bed and left atrial pressure closer to thevenoatrial junction.20 The same rationale applies whenthe flow velocities from the lung to the heart are considered,with the pulmonary vein diameter at the different sitesprobably being the main determinant, as is demonstrated inthe present study. Other factors involved have been evalu-ated, such as left atrium relaxation and compliance and leftventricular function.21–27 Pulmonary vein relaxation, medi-ated by C-type natriuretic peptide, is uniform and thus doesnot allow segmental variations.28
The effects of vessel tapering in the pulmonary circulationhave been studied by nonlinear models,6,10 and the role of thevessel cross-sectional area in the flow wave dynamics hasalso been assessed.7 A theoretical model designed to evaluatethe wave transmission in a stenotic tube suggests that nonse-vere stenoses may cause significant wave reflections,8 whichis consistent with the idea that the flow impedance is relatedto the diameter of the tube.
Because Doppler analysis of the pulmonary venous wave-forms is widely used in clinical practice,1–3,29–35 it is imper-ative to have the sample volume correctly positioned in thedistal portion of the pulmonary vein, near the venoatrialjunction, to achieve reliable results, because this fetal studyshowed that the presystolic velocity decreases and the pulsa-tility index increases when a more proximal site is sampled.
It has been demonstrated that, in the normal fetus, thepulsatility of the pulmonary vein decreases along the wayfrom the lung to the heart and that this parameter is inverselycorrelated to the cross-sectional diameter of the pulmonaryvein, which increases from the proximal to the distal portionof the vessel.
References1. Hong YM, Choi JY. Pulmonary venous flow from fetal to neonatal
period. Early Hum Dev. 2000;57:95–103.2. Crowe DA, Allan LD. Patterns of pulmonary venous flow in the fetus
with disease of the left heart. Cardiol Young. 2001;11:369–374.3. Lenz F, Chaoui R. Reference ranges for Doppler-assessed pulmonary
venous blood flow velocities and pulsatility indices in normal humanfetuses. Prenat Diagn. 2002;22:786–791.
4. Gan RZ, Tian Y, Yen RT, et al. Morphometry of the dog pulmonaryvenous tree. J Appl Physiol. 1993;75:432–440.
5. Huang W, Yen RT, McLaurine M, et al. Morphometry of the humanpulmonary vasculature. J Appl Physiol. 1996;81:2123–2133.
6. Lucas CL. Fluid mechanics of the pulmonary circulation. Crit RevBiomed Eng. 1984;10:317–393.
7. Demiray H. Waves in initially stressed fluid-filled thick tubes. J Biomech.1997;30:273–276.
8. Stergiopulos N, Spiridon M, Pythoud F, et al. On the wave transmissionand reflection properties of stenoses. J Biomech. 1996;29:31–38.
9. Huang W, Tian Y, Gao J, et al. Comparison of theory and experiment inpulsatile flow in cat lung. Ann Biomed Eng. 1998;26:812–820.
10. Segers P, Verdonck P. Role of tapering in aortic wave reflection:hydraulic and mathematical model study. J Biomech. 2000;33:299–306.
Figure 4. Diagram showing median distal and proximal PVPIs.Horizontal bars above and below median boxes represent maxi-mal and minimal values of PVPI.
Figure 5. Diagram depicting inverse correlation between PVPIand vessel diameter.
Zielinsky et al Fetal Pulmonary Vein Diameter and Flow Dynamics 2379

11. Hole T, Urheim S, Skjaerpe T. Intra- and inter-observer reproducibility oftransthoracic pulmonary venous Doppler flow indices after acute myo-cardial infarction. Eur J Echocardiogr. 2002;3:32–38.
12. Yazar F, Ozdogmus O, Tuccar E, et al. Drainage patterns of middle lobevein of right lung: an anatomical study. Eur J Cardiothorac Surg. 2002;22:717–720.
13. Hall SM, Hislop AA, Pierce CM, et al. Prenatal origins of humanintrapulmonary arteries: formation and smooth muscle maturation. Am JRespir Cell Mol Biol. 2000;23:194–203.
14. Fasouliotis SJ, Achiron R, Kivilevitch Z, et al. The human fetal venoussystem: normal embryologic, anatomic, and physiologic characteristicsand developmental abnormalities. J Ultrasound Med. 2002;21:1145–1158.
15. DeMello DE, Reid LM. Embryonic and early fetal development of humanlung vasculature and its functional implications. Pediatr Dev Pathol.2000;3:439–449.
16. Hislop AA. Airway and blood vessel interaction during lung devel-opment. J Anat. 2002;201:325–334.
17. Hall SM, Hislop AA, Haworth SG. Origin, differentiation, and maturationof human pulmonary veins. Am J Respir Cell Mol Biol. 2002;26:333–340.
18. Blom NA, Gittenberger-de-Groot AC, Jongeneel TH, et al. Normal devel-opment of the pulmonary veins in human embryos and formulation of amorphogenetic concept for sinus venosus defects. Am J Cardiol. 2001;87:305–309.
19. Webb S, Kanani M, Anderson RH, et al. Development of the humanpulmonary vein and its incorporation into the morphologically left atrium.Cardiol Young. 2001;11:632–642.
20. Appleton CP. Hemodynamic determinants of Doppler pulmonary venousflow velocity components: new insights from studies in lightly sedatednormal dogs. J Am Coll Cardiol. 1997;30:1562–1574.
21. Barbier P, Solomon S, Schiller NB, et al. Determinants of forwardpulmonary vein flow: an open pericardium pig model. J Am Coll Cardiol.2000;35:1947–1959.
22. Talbert DG, Johnson P. The pulmonary vein Doppler flow velocitywaveform: feature analysis by comparison of in vivo pressures and flowswith those in a computerized fetal physiological model. UltrasoundObstet Gynecol. 2000;16:457–467.
23. Smiseth OA, Thompson CR, Lohavanichbutr K, et al. The pulmonaryvenous systolic flow pulse: its origin and relationship to left atrialpressure. J Am Coll Cardiol. 1999;34:802–809.
24. Rajagopalan B, Friend JA, Stallard T, et al. Blood flow in pulmonaryveins, I: studies in dog and man. Cardiovasc Res. 1979;13:667–676.
25. Rajagopalan B, Friend JA, Stallard T, et al. Blood flow in pulmonaryveins, II: the influence of events transmitted from the right and left sidesof the heart. Cardiovasc Res. 1979;13:677–683.
26. Rajagopalan B, Bertram CD, Stallard T, et al. Blood flow in pulmonaryveins, III: simultaneous measurements of their dimensions, intravascularpressure and flow. Cardiovasc Res. 1979;13:684–692.
27. Hellevik LR, Segers P, Stergiopulos N, et al. Mechanism of pulmonaryvenous pressure and flow waves. Heart Vessels. 1999;14:67–71.
28. Lakshminrusimha S, D’Angelis CAD, Russell JA, et al. C-type natriureticpeptide system in fetal ovine pulmonary vasculature. Am J Physiol LungCell Mol Physiol. 2001;281:L361–L368.
29. Rossi A, Loredana L, Cicoira M, et al. Additional value of pulmonaryvein parameters in defining pseudonormalization of mitral inflow pattern.Echocardiography. 2001;18:673–679.
30. Graziano JN, Heidelberger KP, Ensing GJ, et al. The influence of arestrictive atrial septal defect on pulmonary vascular morphology inpatients with hypoplastic left heart syndrome. Pediatr Cardiol. 2002;23:146–151.
31. Lenz F, Machlitt A, Hartung J, et al. Fetal pulmonary venous flow patternis determined by left atrial pressure: report of two cases of left hearthypoplasia, one with patent and the other with closed interatrial commu-nication. Ultrasound Obstet Gynecol. 2002;19:392–395.
32. Yalcin F, El-Amrousy M, Muderrisoglu H, et al. Pulmonary venous flowsreflect changes in left atrial hemodynamics during mitral balloon val-votomy. Angiology. 2002;53:323–327.
33. Palazzuoli A, Puccetti L, Pastorelli M, et al. Transmitral and pulmonaryvenous flow study in elite male runners and young adults. Int J Cardiol.2002;84:47–51.
34. Yang H, Jones M, Shiota T, et al. Pulmonary venous flow determinantsof left atrial pressure under different loading conditions in a chronicanimal model with mitral regurgitation. J Am Soc Echocardiogr.2002:15(10 pt 2):1181–1218.
35. Ito T, Harada K, Takada G. Changes in pulmonary venous flow patternsin patients with ventricular septal defect. Pediatr Cardiol. 2002;23:491–495.
2380 Circulation November 11, 2003

ClinicalInvestigation Comparison of Left Ven-
tricular ElectromechanicalMapping and LeftVentricular AngiographyDefining Practical Standards for Analysis of NOGA™ Maps
We performed this prospective cohort study to correlate the findings of left ventricularangiography (LVA) and NOGA™ left ventricular electromechanical mapping (LVEM) in theevaluation of cardiac wall motion and also to establish standards for wall motion assess-ment by LVEM. Fifty-five patients (35 men; mean age, 60.4 ± 11.8 years) eligible for elec-tive left cardiac catheterization underwent LVA and LVEM. Wall motion scores, LVejection fractions (LVEF), and LV volumes derived from LVA versus LVEM data werecompared and analyzed statistically. Receiver operating characteristic (ROC) curveswere used to assess the accuracy of LVEM in distinguishing between normal, hypoki-netic, and akinetic/dyskinetic wall motion. Mean LVEM procedure time was 37 ± 11 min-utes. The LVEM and LVA findings differed for mean LVEF (55% ± 13% vs 36% ± 9%),mean end-systolic volume (56 ± 13 mL vs 36 ± 10 mL), and mean end-diastolic volume(174 ± 104 mL vs 123 ± 65 mL). Mean wall motion scores (± SD) for normokinetic, hypo-kinetic, and akinetic/dyskinetic segments were 13.9% ± 5.6%, 8.3% ± 5.2%, and 3.2%± 3.1%, respectively. Cutpoints for differentiating between wall motion types were 12%and 6%. The ROC curves showed LVEM to have a 93% accuracy in differentiating be-tween normokinetic and akinetic/dyskinetic segments and a 73% accuracy betweennormokinetic and hypokinetic segments. These data suggest that LVEM can differenti-ate between normal and abnormal cardiac wall motion, although it is more accurate atdifferentiating between normokinetic and akinetic/dyskinetic motion than betweennormokinetic and hypokinetic motion. (Tex Heart Inst J 2003;30:19-26)
eft ventricular electromechanical mapping (LVEM) using NOGA™ soft-ware (Biosense-Webster; Diamond Bar, Calif ) is a new technology that re-constructs 3-dimensional maps of the left ventricle (LV) from data acquired
at multiple points on the endocardium. The NOGA software is used to comparethe location of an endocardial point in systole and diastole and calculate its move-ment in relation to other surrounding points. This movement is expressed as linearlocal shortening (LLS), which is a validated measure of myocardial mechanicalfunction.1-3 Through reconstruction of the LV endocardial contour, the system hasthe capability to provide hemodynamic data such as LV ejection fraction, end-systolic volume, and end-diastolic volume.4
Left ventricular angiography (LVA) was the 1st method used to assess LV wallmotion contractility and hemodynamic parameters.5,6 Other methods used for thispurpose now include 2- and 3-dimensional (2-D and 3-D) echocardiography, ra-dionuclide ventriculography, computed tomography, and magnetic resonanceimaging.7 Left ventricular angiography is still widely used for LV assessment and re-mains one of the gold standards for wall motion analysis.
Previous studies have demonstrated a moderate correlation between LVEM andLVA in terms of global and regional contractile LV function and volume measure-ments.8-10 To determine whether this correlation remains valid for LVEM findingsobtained with use of a newer version of the NOGA software (v. 4.0), which in-corporates a different LLS algorithm, we analyzed and correlated the findings ofLVEM and LVA in a prospective cohort study. In addition, as the primary endpoint, we sought to establish standard values for wall motion assessment (in com-
Rogerio Sarmento-Leite,MD, PhD
Guilherme V. Silva, MDHans F.R. Dohman, MDRicardo Mourilhe Rocha,
MDHans J.F. Dohman, MDNelson Durval S.G.
de Mattos, MDLuis Antonio Carvalho, MDCarlos A.M. Gottschall, MDEmerson C. Perin, MD, PhD
Key words: Angiography;diagnostic imaging/instrumentation; electro-mechanical mapping;electrophysiology/methods;heart/anatomy/physiology;heart catheterization; heartventricle/physiology; imagingprocessing, computer-assisted
From: Texas Heart Instituteat St. Luke’s EpiscopalHospital (Drs. Perin,Sarmento-Leite, and Silva),Houston, Texas; HospitalPro-Cardíaco (Drs. Carvalho,de Mattos, F.R. Dohman, J.F. Dohman, and Rocha),Rio de Janeiro, Brazil; andInstituto de Cardiologia do Rio Grande do Sul (Dr. Gottschall), PortoAlegre, Brazil
Address for reprints:Emerson C. Perin, MD, 6624 Fannin, Suite 2220,Houston, TX 77030
E-mail: [email protected]
© 2003 by the Texas Heart ®
Institute, Houston
Texas Heart Institute Journal Comparison of LV Electromechanical Mapping and LV Angiography 19
L

parison with LVA findings) that can be used routinelyin the analysis of LV electromechanical maps.
Patients and MethodsStudy Design and Inclusion Criteria
We conducted a cohort prospective study of 55 pa-tients who underwent mapping procedures after elec-tive left cardiac catheterization at 2 centers (TexasHeart Institute, Houston, Texas; and Hospital Pro-Cardíaco, Rio de Janeiro, Brazil). Electromechanicalmapping was performed after LVA. The LVEM proce-dures were performed only in patients who were clini-cally stable; excluded were those patients who hadsevere peripheral vascular disease, atrial fibrillation,aortic stenosis, suspected thrombus in the left ventri-cle, or acute myocardial infarction. The study protocolwas approved by the ethics committees of both hospi-tals. There was no industry support for this study. Theprocedures were explained, and informed written con-sent was obtained from all patients before they wereenrolled in the study.
NOGA Mapping System and TechniqueA NOGA electromechanical map of the left ventricleis constructed by the acquisition of a series of pointsat multiple locations on the LV endocardial surfacegated to a surface electrocardiogram. NOGA LVEMuses ultra-low magnetic fields (10-5–10-6 tesla) that aregenerated by a triangular magnetic pad positioned be-neath the patient. The intersection of the magneticfields with a location sensor just proximal to the de-flectable tip of a 7F mapping catheter helps to deter-mine the location and orientation of the catheter tipinside the left ventricle. An algorithm is used by theNOGA system to calculate and analyze the movementof the catheter tip or the location of an endocardialpoint throughout systole and diastole. That move-ment is then compared with the movement of neigh-boring points in an area of interest. The resultingvalue, which is called linear local shortening (LLS) andis expressed as a percentage, is representative of themechanical function of the left ventricle at that point.
Data points are obtained only when the catheter tip is in stable contact with the endocardium. Thiscontact is determined automatically by the NOGAsystem using the following criteria: 1) point loop sta-bility (LS), defined as the trajectory of a specific pointduring 2 consecutive cardiac cycles (a low value, in-dicating good-quality data, is preferable); 2) cyclelength (CL) stability, defined as the difference betweenthe CL of a specific point and the average CL of thepreviously recorded 100 beats; 3) local activation time(LAT) stability, defined as the difference between theLAT of a point and the LATs of points previously re-corded (variation should be no more than 3 ms); and
4) location stability (LcS), defined as the variability inthe location of the catheter tip during the cardiac cycle(between end systole and end diastole). The mappingcatheter also incorporates electrodes that measure en-docardial electrical signals (unipolar or bipolar volt-age). Voltage values are assigned to each point acquiredduring mapping of the LV, and an electrical map isconstructed. Each data point has an LLS value and avoltage value. When the map is complete, all the datapoints are integrated by the NOGA workstation andare presented in a 3-D color-coded reconstruction ofthe endocardial surface, and in 9- and 12-segmentbull’s-eye views that show average values for LLS andvoltage data in each segment (Fig. 1). These maps canbe spatially manipulated in real time on a SiliconGraphics workstation (Mountain View, Calif ).
The 3-D representations acquired during the cardiaccycle are used to calculate LV volumes. The NOGAsystem uses the largest volume as the end-diastolic vol-ume (EDV) and the smallest volume as the end-sys-tolic volume (ESV). The LV ejection fraction (LVEF)is calculated as (EDV – ESV)/EDV. The NOGA sys-tem also uses, as predetermined by the operator, a tri-angle fill threshold (FT) that determines the extent towhich the computer algorithm will interpolate datainto (or “fill in”) the space between adjacent points. Inthe present study, a triangle FT of 15 mm was used(the standard recommended by the manufacturer toensure map completeness). After the acquisition ofpoints, postprocessing analysis is performed with a se-ries of filters in the moderate setting to eliminate innerpoints, points that do not fit the standard stability cri-teria (LcS <4 mm; LS <6 mm; and CL <10%), pointsacquired during ST-segment elevation, and points notrelated to the left ventricle (for example, those on theatrium).
Volume 30, Number 1, 200320 Comparison of LV Electromechanical Mapping and LV Angiography
Fig. 1 A representative, 3-dimensional, color-coded recon-struction of the endocardial surface (left) and 9- and 12-segment bull’s-eye views (right top and bottom, respectively).
LLS = linear local shortening

Left Ventricular Angiography ProtocolLeft ventricular angiography was performed throughthe femoral approach using a 5F pigtail catheter (Cor-dis; Miami Lakes, Fla), which was marked at 1-cm intervals for accurate calculation of the LV volumesand LVEFs according to the area-length formula.11 AllLVAs were obtained in 2 planes—a 30° right anterioroblique (RAO) view and a 60° left anterior oblique(LAO) view—during a period of stable sinus rhythm.Ventricular volume was not measured during or aftera premature beat. Wall motion was evaluated in theRAO view by 2 independent experienced observers.Segments visible in the angiographic RAO view (thatis, anterobasal, anteromedial, apical, inferomedial, andposterobasal) were compared with the corresponding 5 segments of the LVEM bull’s-eye view. Wall motionin each myocardial segment was scored as follows: 0 =dyskinetic; 1 = akinetic; 2 = hypokinetic; and 3 = nor-mokinetic.
Left Ventricular Electro-mechanical Mapping ProtocolLeft ventricular electromechanical mapping was per-formed as follows. All patients were heparinized (70U/kg) after biplane LVA and before LVEM. The map-ping catheter curve (B, D, or F) was selected on thebasis of LV size. The catheter (7F) was advanced un-der f luoroscopic guidance to the descending thoracicaorta, where its tip was fully deflected and then subse-quently advanced around the aortic arch and acrossthe aortic valve into the left ventricle. Inside the leftventricle, the deflection was relaxed and the cathetertip was oriented toward the LV apex. The initial datapoint was acquired at the LV apex, and 2 points wereacquired—one at the base of the septum and one atthe lateral wall—to complete an initial triangle defin-ing the borders of the LV. Subsequent points were ac-quired until all endocardial segments were uniformlysampled (ideally, 3 points in each of 12 segments, according to the NOGA™ Mapping Excellence Pro-gram*). Each data point was filtered on-line, immedi-ately after acquisition, and during postprocessinganalysis with use of the parameters described above.
Map AnalysisThe LVEMs were analyzed using data on the mechan-ical function of the myocardium (LLS), which hasbeen extensively validated in previous studies.1-3 Thedata from the maps were compared with data ob-tained by angiography. Angiography provides a 2-D
image of the left cardiac chamber that historically hasbeen compared with images produced by emergingtechnologies such as echocardiography, radionuclidestudies, and MRI.7
To compare wall motion as represented by LVEMversus LVA, the anterobasal, anteromedial, apical, in-feromedial, and posterobasal segments on the RAOangiogram (Fig. 2) were matched with those on thecorresponding 5 segments of the 9-segment LVEMbull’s-eye view. (Again, according to the NOGA™Mapping Excellence Program, each LVEM segmentshould contain at least 3 points after initial filteringand postprocessing analysis.) The segments were di-vided into 3 groups according to wall motion score:Group I (0 or 1, akinetic or dyskinetic); Group II (2,hypokinetic); and Group III (3, normokinetic).
Texas Heart Institute Journal Comparison of LV Electromechanical Mapping and LV Angiography 21
∗ The NOGA™ Mapping Excellence Program was created byBiosense-Webster in order to verify and ensure the quality ofNOGA maps. It has been developed and implemented by theauthors in conjunction with Biosense-Webster.
Fig. 2 Schematic illustrations show the 5 myocardial segmentsevaluated by left ventricular angiography and left ventricularelectromechanical mapping (top) and corresponding bull’s-eyeview (bottom) for comparison.
AB = anterobasal; AM = anteromedial; Ap = apical; IM = infero-medial; PB = posterobasal

LVA, compared, and classified into 3 groups. Group I(akinetic/dyskinetic) comprised 9 segments; Group II(hypokinetic), 68 segments; and Group III (normo-kinetic), 198 segments. Table III shows the mean LLS(± SD) values for each group. Using discriminantanalysis, the cutpoints for differentiation between nor-mokinetic, hypokinetic, and akinetic/dyskinetic seg-ments by LLS were set at 12% and 6% (Table IV). Asshown by ROC curves (Figs. 9 and 10), the LLS val-ues determined by LVEM had an accuracy of 93% indifferentiating between normokinetic and akinetic/dyskinetic myocardial segments and an accuracy of73% in differentiating between normokinetic and hy-pokinetic myocardial segments.
Statistical AnalysisLeft ventricular ejection fraction and volume data werepresented as the mean ± standard deviation (SD). Themean values obtained by LVEM and LVA were com-pared using the unpaired Student’s t-test. A P value of<0.5 was considered significant for all comparisons.Correlation coefficients were reported in terms of thePearson correlation index (r), and correction index-es for each variable were created. The Bland-Altmantechnique was used to determine the agreement be-tween continuous measurements acquired by LVEMand LVA. For each group of wall motion scores, themean LLS (± SD) was determined. Boundaries forclassification of wall motion as normal, hypokinetic,and akinetic/dyskinetic were derived by discriminantanalysis. This analytic technique finds the 2 bound-aries that predict classification into a group (in thiscase, 1 of the 3 groups determined by LVEM wall mo-tion score). The Scheffé test was also used for multiplecomparisons of wall motion. Receiver operating char-acteristic (ROC) curves were used to assess the sensi-tivity and specificity of LVEM for distinguishingbetween normokinetic and hypokinetic and betweennormokinetic and akinetic/dyskinetic wall motion.
Results
The study population consisted of 55 consecutive pa-tients who were scheduled for elective left heartcatheterization, during which LVEM was performed(Table I). The mean age was 60.4 ± 11.8 years (range,42–86 years), and there were more men (35 [64%])than women. The average LVEM procedure time was37 ± 11 minutes. After application of a moderate automatic filter, a mean of 62 ± 12 points was ob-tained in each mapping to render a representative 3-D reconstruction of the LV. There were no deaths ormajor complications associated with LVEM (such asmalignant ventricular arrhythmias or LV perforationrequiring pericardiocentesis). One patient had a leftventricular perforation that resulted in a small post-procedural pericardial effusion. This complication wasmanaged conservatively and was followed with serialechocardiography until it resolved; pericardiocentesiswas not necessary.
The mean values for EF, EDV, and ESV, obtainedby LVEM and LVA, are shown in Table II. The Pear-son correlation index and graphs for each variable areshown in Figs. 3–5. A moderate-to-good correlationwas found between LVEM and LVA findings; how-ever, as shown by Bland-Altman analysis (Figs. 6–8),clinical disagreement and lack of interchangeabilitywas found between all measured parameters for bothmethods.
In the 55 cases studied, the wall motion scores in atotal of 275 segments were determined by LVEM and
Volume 30, Number 1, 200322 Comparison of LV Electromechanical Mapping and LV Angiography
TABLE I. Characteristics of 55 Patients at Baseline
No. of Patient Characteristic Pts. (%)
Mean age (y) 60.4 ± 11.8*
SexMale 35 (64)Female 20 (36)
HistoryDiabetes 11 (20)Hypertension 36 (65)Smoking 27 (49)Hyperlipidemia 41 (75)Myocardial infarction 25 (45)Cerebral vascular disease 4 (7)Peripheral vascular disease 5 (9)Bypass graft 19 (35)PTCA 27 (49)
Mean LV ejection fraction 55% ± 13%*
Associated proceduresDiagnostic catheterization 33 (60)DMR 2 (4)PCI 20 (36)
*Mean ± SD
DMR = direct myocardial revascularization; LV = left ventricular;PCI = percutaneous coronary intervention; PTCA = percutane-ous transluminal coronary angioplasty
TABLE II. Mean Values for LVA and LVEM Findings
Cardiac Component LVA LVEM
Ejection fraction (%) 55 ± 13 36 ± 9
End-diastolic volume (mL) 174 ± 104 123 ± 65
End-systolic volume (mL) 56 ± 13 36 ± 10
All data are presented as mean ± SD.
LVA = left ventricular angiography; LVEM = left ventricularelectromechanical mapping
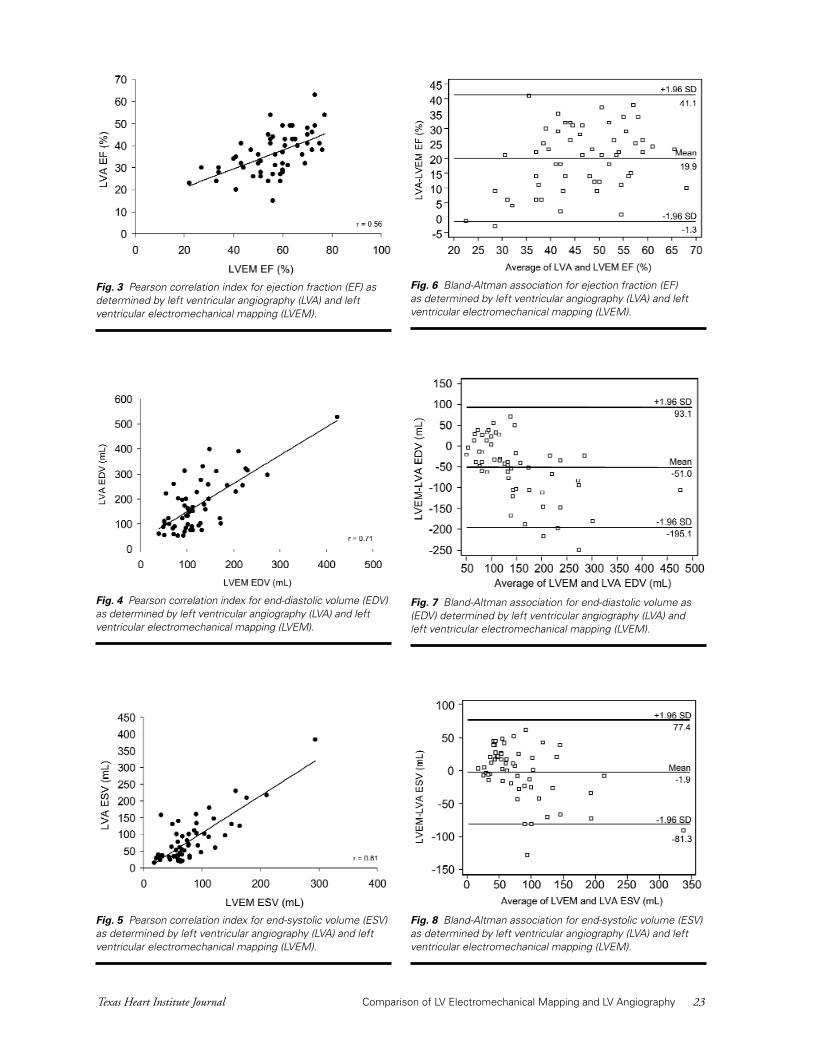
Fig. 3 Pearson correlation index for ejection fraction (EF) asdetermined by left ventricular angiography (LVA) and leftventricular electromechanical mapping (LVEM).
Fig. 4 Pearson correlation index for end-diastolic volume (EDV)as determined by left ventricular angiography (LVA) and leftventricular electromechanical mapping (LVEM).
Fig. 5 Pearson correlation index for end-systolic volume (ESV)as determined by left ventricular angiography (LVA) and leftventricular electromechanical mapping (LVEM).
Fig. 6 Bland-Altman association for ejection fraction (EF) as determined by left ventricular angiography (LVA) and leftventricular electromechanical mapping (LVEM).
Fig. 7 Bland-Altman association for end-diastolic volume as(EDV) determined by left ventricular angiography (LVA) and left ventricular electromechanical mapping (LVEM).
Fig. 8 Bland-Altman association for end-systolic volume (ESV)as determined by left ventricular angiography (LVA) and leftventricular electromechanical mapping (LVEM).
Texas Heart Institute Journal Comparison of LV Electromechanical Mapping and LV Angiography 23

Discussion
The present study was designed to compare the as-sessment of global and regional function of the leftventricle by 2 different techniques: LVEM and LVA.Both techniques are invasive and yield quantitativeand qualitative information about the performanceof the left ventricle. However, LVEM creates an on-line, real-time 3-D reconstruction of the endocardialsurface and has proven value for assessing both myo-cardial viability12 and the mechanical function of myo-cardial segments.
Several studies have focused on the ability of LVEMto distinguish between normal and infarcted myo-cardium, to enable comparison of hemodynamic parameters, and to perform wall motion analysis.Nonetheless, no practical cutpoints for LVEM analy-sis of wall motion had previously been established.8-10
Therefore, as the primary end point of a study of thelargest LVEM cohort in the literature, we have corre-lated the findings of LVEM and LVA by analyzingonly those LVEM segments that were also well visual-ized by LVA and well matched to the same regions ofthe LVEM bull’s-eye views.
The values used to define wall motion in the pres-ent study were similar to those already described inthe literature. However, the mean values (± SD) thatwe established for normokinetic, hypokinetic, andakinetic/dyskinetic wall motion (13.9% ± 5.6%,8.3% ± 5.2%, and 3.2% ± 3.1%, respectively) over-lapped and sometimes made it difficult to differen-
TABLE III. Wall Motion Classification and Mean LLSValues
Wall Motion Segments LLSPattern (n = 275) (%)
Group I - Akinetic/dyskinetic 9 3.2 ± 3.1
Group II - Hypokinetic 68 8.3 ± 5.2
Group III - Normokinetic 198 13.9 ± 5.6
Data are presented as mean ± SD. P <0.05 for all comparisons.
LLS = linear local shortening
TABLE IV. Cutpoints for Differentiation of Wall Motionby LLS According to Discriminant Analysis
Wall Motion Pattern LLS (%)
Group I - Akinetic/dyskinetic <6%
Group II - Hypokinetic ≥6% or <12%
Group III - Normokinetic ≥12%
LS = linear local shortening
Fig. 9 Receiver operating characteristic curve for the differ-entiation between normokinetic and akinetic/dyskinetic seg-ments by local linear shortening (LLS).
Area under the curve = 0.93; threshold <6%; sensitivity, 89%;specificity, 88%
Fig. 10 Receiver operating characteristic curve for the differ-entiation between normokinetic and hypokinetic segments bylocal linear shortening (LLS).
Area under the curve = 0.73; threshold <12%; sensitivity,68%; specificity, 62%
tiate between normokinetic and hypokinetic tissue.This was well exemplified by the ROC curve (Fig. 10),which showed a weak accuracy of 73%. These find-ings agree with the data of Lessick and colleagues,13
who compared echocardiography with LVEM dataand reported an accuracy of 69%. On the other hand,our cutpoints allowed excellent differentiation be-tween normokinetic and akinetic/dyskinetic myo-cardial areas, with an accuracy of 93% (Fig. 9).
Volume 30, Number 1, 200324 Comparison of LV Electromechanical Mapping and LV Angiography
demarcation of appropriate “target” zones for treat-ment is one of the keys to the success of our proce-dure. Therefore, by defining practical LLS thresholdsfor assessing mechanical activity in the present study,we believe we have made it easier to target viable myo-cardium (that is, tissues with low LLS and preservedelectrical activity) using the NOGA system and so op-timize therapy. Moreover, even though the system issomewhat limited in its ability to differentiate wallmotion, this limitation appears to be restricted to se-verely dilated or very hypertrophic ventricles. In suchcases, performing a complete LVEM is already tech-nically challenging. We believe that this limitation canbe overcome by devising mapping procedures that aremore careful and detailed.
In conclusion, our data indicate that there is a mod-erate correlation between LVA and LVEM findingsand that LVEM can differentiate between normal andabnormal cardiac wall motion. However, it appearsthat LVEM is severely limited in its ability to measureLV hemodynamics, which will limit its widespreaduse for this purpose. Nevertheless, our findings areimportant, because they add to the current knowledgeabout the interpretation of LVEM findings, and be-cause they have important implications for the use ofLVEM in conjunction with intramyocardial therapiesin which optimal treatment delivery requires the accu-rate targeting of viable (normokinetic) versus nonvi-able (akinetic/dyskinetic) segments.
References1. Ben-Haim SA, Osadchy D, Schuster I, Gepstein L, Hayam
G, Josephson ME. Nonfluoroscopic, in vivo navigation andmapping technology. Nat Med 1996;2:1393-5.
2. Gepstein L, Hayam G, Ben-Haim SA. A novel method fornonfluoroscopic catheter-based electromechanical mappingof the heart. In vitro and in vivo accuracy results. Circula-tion 1997;95:1611-22.
3. Smeets JL, Ben-Haim SA, Rodriguez LM, Timmermans C,Wellens HJ. New method for nonfluoroscopic endocardialmapping in humans: accuracy assessment and first clinicalresults. Circulation 1998;97:2426-32.
4. Gepstein L, Hayam G, Shpun S, Ben-Haim SA. Hemody-namic evaluation of the heart with a nonfluoroscopic elec-tromechanical mapping technique. Circulation 1997;96:3672-80.
5. Dodge HT, Sandler H, Baxley WA, Hawley RR. Usefulnessand limitations of radiographic methods for determiningleft ventricular volume. Am J Cardiol 1966;18:10-24.
6. Viamonte M Jr. Innovations in angiography. Radiol ClinNorth Am 1971;9:361-8.
7. Greenberg SB, Sandhu SK. Ventricular function. RadiolClin North Am 1999;37:341-59,vi.
8. Bossi I, Black AJ, Choussat R, Cassagneau B, Farah B, La-borde JC, et al. Biosense NOGA electro-mechanical mappingaccurately predicts left-ventricular wall motion at cineven-triculography [abstract]. Am J Cardiol 1999;84(6A):95P.
9. Thambar ST, Sharaf BL, Miele NJ, Williams DO. Assess-ment of global and regional wall motion by NOGA three-dimensional electro-mechanical mapping: a correlation
The discrepancy in accuracy of differentating be-tween normokinetic and hypokinetic tissue and be-tween normokinetic and akinetic/dyskinetic tissuemay be due to several factors. First, it can be very dif-ficult in some cases, especially in dilated or very hy-pertrophic ventricles, to perform a complete LVEMbecause the catheter cannot uniformly reach all areasof the left ventricle. As a result, mapping may be in-complete, and the average of the mapped values for adetermined region may be misrepresented. Second,data suggesting low contractility of basal areas of theLV may in part represent the presence of fibrous tissuein perivalvular areas. Future development of LVEM interms of performance and analysis may improve uponthe completeness of mapping and make the interpre-tation of the data more accurate.
As shown in a recent study by Van Langenhove andcoworkers,14 the hemodynamic data obtained byLVEM has its limitations. In their study, the correla-tion between ESV and EF measurements obtained byLVEM versus LVA was moderate (r = 0.67 and r =0.78, respectively), and the correlation between EDVmeasurements was poor (r = 0.40).14 These results dif-fer somewhat from ours, which showed better corre-lations for measurements of ESV (r = 0.81) and EDV(r = 0.71) and a worse correlation for measurementsof EF (r = 0.56). Except for this difference, the resultsof our Bland-Altman analysis and the results from VanLangenhove’s study were similar, demonstrating thatthe dispersion of values is great and that the real clini-cal application of EDV and EF measurements sup-plied by LVEM is questionable, even when correctionformulas are applied. Therefore, we do not advocatethe routine use of the NOGA method as an alterna-tive to other established methods for assessing LVEF.
Similar problems with overlap of wall motion val-ues obtained by LVEM have been found in other se-ries.8-10,15 For example (although their comparison wasbetween the findings of LVEM and nuclear perfusionstudies), Kornowski’s group12 recorded normal and ab-normal LLS values (normal, 12.5% ± 2.8%; abnor-mal, 3.4% ± 3.4%), that were very similar to ours inthe present study (normal, 13.9% ± 5.6%; abnormal,3.2% ± 3.1%).
Despite its limitations, LVEM may assume an im-portant role in new therapies that directly target isch-emic heart disease. Such therapies aim to promoteangiogenesis or restore contractility through the trans-plantation of stem cells16 and myoblasts17,18 or by injec-tion of growth factors.19 The future success of theseand similar therapies depend profoundly on carefullycontrolled clinical trials that apply appropriate meth-ods and end points. In that regard, the NOGA map-ping system has an advantage over other potentialtherapeutic delivery systems (especially those involv-ing surgery), because it is less invasive. In theory, the
Texas Heart Institute Journal Comparison of LV Electromechanical Mapping and LV Angiography 25
with the “gold standard” contrast left ventriculogram. Cir-culation 1999;100(18):I-23.
10. Van Langenhove G, Smits PC, Serrano P, Kosuma K, KayIP, Albertal M, et al. Assessment of regional LV wall mo-tion: a comparison between computerized LV angiographyand nonfluoroscopic electromechanical mapping. Circula-tion 1999;100(18):I-725.
11. Kennedy JW, Trenholme SE, Kasser IS. Left ventricular vol-ume and mass from single-plane cineangiocardiogram. Acomparison of anteroposterior and right anterior obliquemethods. Am Heart J 1970;80:343-52.
12. Kornowski R, Hong MK, Leon MB. Comparison betweenleft ventricular electromechanical mapping and radionu-clide perfusion imaging for detection of myocardial viabili-ty. Circulation 1998;98:1837-41.
13. Lessick J, Smeets JL, Reisner SA, Ben-Haim SA. Electro-mechanical mapping of regional left ventricular function inhumans: comparison with echocardiography. Cathet Car-diovasc Interv 2000;50:10-8.
14. Van Langenhove G, Hamburger JN, Smits PC, Albertal M,Onderwater E, Kay IP, Serruys PW. Evaluation of left ven-tricular volumes and ejection fraction with a nonfluoroscop-ic endoventricular three-dimensional mapping technique.Am Heart J 2000;140:596-602.
15. Keck A, Schwartz Y, Bahlmann E, Kuchler R, Kitzing R,Schluter M, Kuck KH. Assessment of regional left ventricu-lar contractility: comparison between NOGATM electrome-chanical mapping and echocardiography [abstract]. J AmColl Cardiol 1999;33(2 Suppl A):442A.
16. Orlic D, Kajstura J, Chimenti S, Jakoniuk I, Anderson SM,Li B, et al. Bone marrow cells regenerate infarcted myocar-dium. Natuare 2001;410:701-5.
17. Taylor DA, Atkins BZ, Hungspreugs P, Jones TR, ReedyMC, Hutcheson KA, et al. Regenerating functional myo-cardium: improved performance after skeletal myoblast trans-plantation [erratum appears in Nat Med 1998;4:1200]. NatMed 1998;4:929-33.
18. Menasche P, Hagege AA, Scorsin M, Pouzet B, Desnos M,Duboc D, et al. Myoblast transplantation for heart failure.Lancet 2001;357:279-80.
19. Freedman SB, Isner JM. Therapeutic angiogenesis for coro-nary artery disease. Ann Intern Med 2002;136:54-71.
Volume 30, Number 1, 200326 Comparison of LV Electromechanical Mapping and LV Angiography

Impact of renal denervation on renal content of GLUT1, albuminuria
and urinary TGF-h1 in streptozotocin-induced diabetic rats
Beatriz D’Agord Schaana,*, Silvia Lacchinib, Marcello Casaccia Bertolucic,Maria Claudia Irigoyend, Ubiratan Fabres Machadoe, Helena Schmidf
a Instituto de Cardiologia do Rio Grande do Sul/FUC, Unidade de Pesquisa, Av. Princesa Isabel, 395 Santana, 90.620-001 Porto Alegre, RS, BrazilbLaboratorio de Genetica e Cardiologia Molecular, Instituto do Corac�ao (InCor), HC-FMUSP, Universidade de Sao Paulo, Sao Paulo, SP, Brazil
cHospital de Clınicas de Porto Alegre, Porto Alegre, BrazildLaboratorio de Hipertensao Experimental - Unidade de Hipertensao, Instituto do Corac�ao (InCor), HC-FMUSP, Universidade de Sao Paulo,
Sao Paulo, SP, BrazileDepartamento de Fisiologia, Instituto de Ciencias Biologicas, Universidade de Sao Paulo, Sao Paulo, Brazil
fCurso de Pos-Graduac�ao da UFRGS, Hospital de Clınicas de Porto Alegre and FFFCMPA, Porto Alegre, Brazil
Received 9 January 2002; received in revised form 30 October 2002; accepted 9 December 2002
Abstract
In long-term diabetes mellitus, the progression of nephropathy has been related to the occurrence of autonomic neuropathy. This study
was designed to evaluate the effects of bilateral denervation of the kidneys of streptozotocin-diabetic rats, an experimental model that
presents diabetic nephropathy with increased abundance of cortical GLUT1 in the kidney and increased urinary excretion of albumin and
transforming growth factor-h1 (TGF-h1). Twenty-four-hour urinary TGF-h1 (ELISA), urinary albumin (electroimmunoassay) and GLUT1
protein levels (Western blotting) in the renal cortex and medulla were evaluated in diabetic (n = 13) and control (n = 13) rats 45 days after
streptozotocin injection, submitted or not to surgical renal denervation. Evaluations were performed 15 days after the surgery. The effects of
renal denervation were confirmed by intra-renal decrease of norepinephrine levels. Mean arterial pressure did not differ between diabetic and
control rats, whether they underwent renal denervation or not. Renal denervation increased cortical (6905F 287, 3506F 193, 4144F 246
and 5204F 516 AU in renal-denervated controls, controls, renal-denervated diabetics and diabetics, respectively) and medullar GLUT1
protein in control rats, but reverted the cortical GLUT1 protein rise determined by diabetes. Although kidney denervation in diabetic rats
induced a decrease in cortical GLUT1 abundance toward normal levels, these levels did not reach those of normal animals. However, renal
denervation did not determine any changes in urinary albumin and urinary TGF-h1 in both diabetic (127.3F 12 Ag/24 h and 111.8F 24 ng
mg� 1 creatinine, respectively) and control rats (45.9F 3 Ag/24 h and 13.4F 4 ng mg� 1 creatinine, respectively). In conclusion, early-phase
renal denervation in streptozotocin-diabetic rats produces a normalisation of previously elevated cortical GLUT1 protein content, but is not
enough for reverting the increased urinary TGF-h1 and albuminuria of diabetes.
D 2003 Elsevier Science B.V. All rights reserved.
Keywords: Diabetes mellitus, experimental; Diabetes mellitus, nephropathies; Denervation; Transforming growth factors; Streptozotocin; Glucose transporters
1. Introduction
In long-term diabetes mellitus, the progression of nephr-
opathy has been related to the occurrence of autonomic
neuropathy (Sundkvist and Lilja, 1993). The mechanisms
involved are not well understood.
Persistent immunoreactivity for transforming growth
factor-h1 (TGF-h1) protein, a cytokine directly involved
in extracellular matrix production, was previously demon-
strated by us, in the glomeruli of streptozotocin-diabetic
rats. The correlation of these results with the progressive
albuminuria shown by these animals suggests that this
polypeptide is involved in the genesis of rat diabetic
glomerulosclerosis (Bertoluci et al., 1996). More recently,
we showed, in the same animal model, that 45 days of
experimental diabetes significantly increased urinary albu-
min and urinary TGF-h1, as well as GLUT1 protein in the
renal cortex, but not in the renal medulla. These findings
suggest that higher cortical GLUT1 protein levels amplify
the effects of hyperglycemia in determining higher intra-
cellular glucose in mesangial cells, contributing to the
1566-0702/03/$ - see front matter D 2003 Elsevier Science B.V. All rights reserved.
doi:10.1016/S1566-0702(02)00295-3
* Corresponding author. Tel.: +55-513-2232746; fax: +55-513-
2192802.
E-mail addresses: [email protected],
[email protected] (B. D’Agord Schaan).
www.elsevier.com/locate/autneu
Autonomic Neuroscience: Basic and Clinical 104 (2003) 88–94

kidney damage that complicates diabetes. This premature
appearance of albuminuria and high urinary TGF-h1 in
these experiments probably reflects the metabolic decom-
pensation to which these animals were submitted, since they
did not receive insulin (Schaan et al., 2001).
In human diabetic nephropathy, high blood pressure levels
determine deterioration of renal function. Glomerular hy-
pertension, determining mechanical stretch, enhances extrac-
ellular matrix formation by mesangial cells, which is aggra-
vated in a milieu of high glucose concentration (Cortes et al.,
1997). The cytokine TGF-h1 secreted by mesangial cells is
probably involved in this process (Hirakata et al., 1997).
Decreased renal vascular resistance induced by decreas-
ing sympathetic nerve activity renders diabetes and hyper-
tension-induced mesangial cell stretch unopposed (DiBona
and Kopp, 1997). Since muscle denervation (another model
of decreased sympathetic nerve activity) determines reduc-
tion in GLUT4 mRNA and protein content in myocites, we
hypothesised that renal denervation could induce changes in
kidney glucose transporter content, consequently increasing
glucose content of cortical cells like the mesangial, endo-
thelial and/or epithelial kidney cells (Henriksen et al., 1991;
Block et al., 1991). Even though the streptozotocin-diabetic
rat develops characteristic glomerulosclerotic lesions similar
to those found in human diabetic nephropathy, this animal
model does not develop hypertension, making it a good
model for evaluating the effects of denervation itself. No
studies in the streptozotocin-diabetic rat model have
explored whether autonomic dysfunction could determine
the modifications of renal function that are implicated in the
genesis of diabetic nephropathy.
Since experimental diabetes requires 6–9 months to
determine autonomic denervation of the gastrointestinal
tract (Schmidt and Sharp, 1982), and also of the heart
(Felten et al., 1982), and surgical renal denervation is a
relatively simple and widely used procedure, we propose its
utilisation in rats injected with streptozotocin in order to
evaluate the effects of renal denervation on the diabetic
kidney. The absence of hypertension in this model would
allow us to study only the effects of autonomic innervation
failure on renal function, independently of the effects of
systemic hypertension on renal haemodynamics.
Considering that the progression of nephropathy has been
related to the occurrence of autonomic neuropathy, the aims
of this study were to examine the effects of renal denervation
upon mechanisms involved in the development of nephrop-
athy like cortical GLUT1 and TGF-h1 production, as well asurinary albumin in the streptozotocin-diabetic rat.
2. Materials and methods
2.1. Animals
Experiments were performed on male Wistar rats (Ani-
mal Quarter House of the Universidade Federal do Rio
Grande do Sul, Porto Alegre, Brazil) weighing 180–280 g.
They were fasted overnight and rendered diabetic by a
single injection in the tail vein of streptozotocin (60 mg
kg� 1; Sigma, St. Louis, MO, USA) dissolved in citrate
buffer (pH 4.5) and injected slowly. Controls were injected
with citrate buffer. Animals were subsequently maintained
for 30 days (diabetics: n = 13, controls: n = 13) in individual
cages with free access to tap water and standard rat food.
2.2. Surgical renal denervation
Thirty days after streptozotocin injection, a 24-h urinary
sample was collected and bilateral renal denervation or
sham surgery was performed in the four experimental
groups: renal-denervated diabetic (n = 7), diabetic (n = 6),
renal-denervated control (n = 5) and control (n = 8). Renal
denervation was adapted as previously described and vali-
dated in this laboratory (Oliveira et al., 1992; Lacchini et al.,
1997). As widely described, renal denervation was accom-
plished by using a surgical–pharmacological procedure
(DiBona and Rios, 1980; Kassab et al., 1995; Granger et
al., 1996; Huang et al., 1998; Lohmeier et al., 1998).
Mechanical denervation was performed by carefully
stripping all visible nerves at 16� magnification (M90
stereomicroscope, FD Vascocelos) along the renal arteries
and veins from the aorta to the hilum of the kidney.
Chemical denervation was performed by quickly painting
the renal artery with 20% phenol in absolute ethanol. Then
the artery was washed with isotonic saline. For sham
denervation, the surgery was the same, but the renal artery
and vein were not isolated and the nerves were left intact.
Fifteen days later, another 24-h urinary sample was
collected. The effectiveness of the procedure was determined
by measuring renal tissue norepinephrine content, homoge-
nising parts of the tissue in perchloric acid and, subsequently,
assaying it using the alumina extraction procedure. Norepi-
nephrine content of the renal homogenate was determined by
high-performance liquid chromatography coupled with an
electrochemical detector. Previous studies showed that this
procedure markedly deplete the renal tissue norepinephrine
to less than 5% in both kidneys (Granger et al., 1996;
Lacchini et al., 1997). Surgical renal denervation determined
a significant decrease in renal tissue norepinephrine content:
0.0131 pg mg� 1 PNC in renal-denervated control animals
compared to 1.658 pg mg� 1 PNC in controls ( p < 0.05).
2.3. Arterial pressure measurement
Catheters filled with saline were implanted under ether
anesthesia into the femoral artery (PE-10) for direct meas-
urement of arterial pressure. One day after catheter place-
ment, the arterial cannula was connected to a strain-gauge
transducer (P23Db, Gould-Statham, Oxnard, CA) and blood
pressure signals were recorded during a 40-min period with
a microcomputer equipped with an analog-to-digital con-
verter board (CODAS, 2-kHz sampling frequency, Dataq
B. D’Agord Schaan et al. / Autonomic Neuroscience: Basic and Clinical 104 (2003) 88–94 89

Instruments, Akron, OH). Rats were conscious and moved
freely during the experiments. Recorded data were analysed
on a beat-to-beat basis.
Subsequently, blood was collected for plasma glucose
measurement and the animals were anaesthetised in order to
have the kidneys removed.
2.4. Renal sampling
Anesthesia was performed with sodium pentobarbital (25
mg kg� 1 body weight, IV). Immediately after clamping the
aorta up to the renal arteries, the abdominal aorta was
isolated and catheterised below the renal arteries. After that,
the inferior vena cava was cut below the renal veins. The
kidneys were perfused with Hanks buffer and immediately
removed. Renal cortex and medulla were dissected under
ocular control; the tissue fragments of each area were
weighed and frozen at � 70 jC for further procedures.
2.5. Measurements
2.5.1. Glucose, albumin and TGF-�1Plasma and urinary glucose were measured using the
colorimetric enzymatic test (commercial kit, Merck, GE,
Centrifichem System 400-Roche/Cobas Mira-Roche).
Urinary albumin was quantified by electroimmunoassay
using antibody anti-rat albumin as previously described
(Schmid et al., 1989).
For the TGF-h1 assay, immediately after collection,
urinary samples were centrifuged at 2000 rpm for 5 min at
room temperature and stored at � 80 jC. On the day of the
assay, in order to activate latent TGF-h1, the samples were
acidified with 1 N HCl to a pH of 2–3 for 30 min at room
temperature, and then re-neutralised to pH 7–8 with the same
amount of 1 N NaOH. The TGF-h1 was measured by using
an enzyme-linked immunosorbent assay kit (TGF-h1 Emaxk
ImmunoAssay Systems-Promega, Madison, WI, USA) with
a monoclonal antibody to human active TGF-h1 provided bythe manufacturer as previously described (Schaan et al.,
2001). Among the standards, the intra- and inter-assay
coefficients were 6.9% and 12%, respectively. The reprodu-
cibility of the assay was defined by measuring standards for 2
consecutive days: the correlation coefficient was 0.96.
Recovery of samples between expected and apparent TGF-
h1 concentrations after adding known amounts of TGF-h1was 119%. The detection limit was 32 pg ml� 1. The cross-
reactivity with TGF-h2 was 1.6% and with TGF-h3 0.7%.
Urinary TGF-h1 results were corrected by urinary creatinine
and results expressed as ng mg� 1 of creatinine.
2.5.2. GLUT1
Renal cortex and medulla were analysed for their GLUT1
protein abundance. The antibody used was raised in New
Zealand, white rabbits from a 15 amino acid peptide of rat
GLUT1, which was synthesised according to the deduced
carboxy-terminal sequence of rat GLUT1. It was coupled to
keyhole limpet hemocyanin and used for immunisation of
male New Zealand white rabbits. This anti-serum has been
successfully used for immunoblotting (Vestri et al., 2001).
The tissue samples were homogenised in 10 w/v buffer
(10 mM Tris–HCl, 1 mM EDTA and 250 mM sucrose, pH
7.4, containing 5 mg/ml aprotinin), using a Polytron set at
24,000 rpm for 30 s, and centrifuged at 3000� g for 15 min.
The supernatant was centrifuged at 12,000� g for 20 min,
and the pellet was resuspended as a plasma membrane
fraction, in which the alkaline phosphatase activity was
shown to have increased more than three times compared
to the enzyme activity in the supernatant of the first
centrifugation. A Western blotting analysis was then per-
formed as previously described (Vestri et al., 2001). The
results were expressed as arbitrary units (AU) by amount of
electrophoresed total protein.
2.6. Statistical analysis
Data are reported as meansF standard error of the mean.
Statistical significance was calculated by the Student’s t-test
for unpaired data when two groups were compared, and
ANOVA (Student–Newman–Keuls as post-test) when four
groups were compared. Urinary albumin and urinary TGF-
h1 data were log10 transformed before analysis. Differences
were considered to be significant for p < 0.05.
3. Results
At baseline, body weights were similar in all experimen-
tal groups: 250F 4, 261F11, 263F 7 and 241F11g, for
Table 1
Characteristics of diabetic (D) and nondiabetic (ND) rats after 15 days of renal denervation (RD) (45 days after STZ injection)
D D-RD ND ND-RD
Body weight (g) 189F 7* (7) 212F 18* (6) 295F 1 (6) 292F 8 (7)
Plasma glucose (mmol/l) 20.8F 3* (7) 21.7F 2* (5) 7.8F 1 (6) 8.1F1 (5)
24-h urinary glucose (mg/24 h) 2856F 484*,# (12) 6064F 1242* (8) 3.1F 0.9 (10) 2.2F 0.5 (10)
Diuresis (ml/24 h) 59F 6*,# (12) 86F 7* (8) 20F 1 (10) 24F 10 (10)
Mean arterial pressure (mmHg) 99F 7 (5) 103F 7 (4) 112F 3 (4) 107F 2 (4)
Data are meanF S.E.M. Numbers in parenthesis indicate numbers of animals.
*p< 0.05 vs. ND and ND-RD.# p< 0.05 vs. D-RD.
B. D’Agord Schaan et al. / Autonomic Neuroscience: Basic and Clinical 104 (2003) 88–9490

renal-denervated control, control, renal-denervated diabetic
and diabetic animals, respectively ( p = 0.13). The groups
which received streptozotocin presented a slight loss of
weight, whereas controls increased their body weights.
Consequently, control rats were significantly heavier than
diabetic rats at the end of the experiment ( p < 0.05). As
expected, plasma glucose levels after 45 days of streptozo-
tocin injection were elevated (by 2.5-fold) in diabetic rats
when compared to control groups ( p < 0.05). Also, 24-h
urinary glucose and diuresis were significantly higher in
diabetic animals versus their controls, 30 and 45 days after
streptozotocin injection. Therefore, these results confirmed
the severity of the diabetic state obtained by the streptozo-
tocin injection (Table 1).
Renal denervation affected neither weight gain nor
plasma glucose levels in either group, but it increased
urinary glucose by 45% and diuresis by 68% in diabetics
( p < 0.05) (Table 1).
Mean arterial pressure did not differ between diabetic
and control rats (99F 7 and 112F 3 mm Hg, respectively),
whether they underwent renal denervation or not (103F 7
and 107F 2 mm Hg, respectively). These data are shown in
Table 1.
Thirty days after streptozotocin injection, urinary albu-
min was significantly higher in the diabetic group
(212.3F 47 vs. 73F 5 Ag/24 h, p< 0.05). Fifteen days of
renal denervation did not operate changes in albuminuria,
neither between non-diabetic nor between diabetic animals
(46F 6, 89.1F18, 127.3F 19 and 141.3F 24 Ag/24 h in
renal-denervated control, control, renal-denervated diabetic
and diabetic groups, respectively). These data are shown in
Fig. 1.
Fig. 2 shows that similar results were observed when
urinary TGF-h1 was measured in the same urinary samples:
30 days of experimental diabetes determined higher levels of
this polypeptide concentration, 71.1F 9 vs. 10.8F 2 ng/mg
creatinine in diabetics and controls, respectively ( p < 0.05).
Renal denervation did not determine any change in urinary
TGF-h1, considering all groups (13.4F 5, 10F 4,
111.8F 24 and 89.9F 27 ng mg� 1 creatinine in renal-
denervated control, control, renal-denervated diabetic and
diabetic groups, respectively).
Experimental diabetes and renal denervation in control
animals determined higher levels of cortical GLUT1 protein
independently ( p < 0.05 for each). However, renal denerva-
tion in diabetic animals significantly reduced levels of
cortical GLUT1 protein by 20% ( p < 0.05), in such a way
that these levels were close to those of control animals
Fig. 1. Albuminuria in control (ND) and diabetic (D) rats 30 days after STZ
treatment (left) and 15 days later (right) after sham operation or renal
denervation (RD). Data are meanF S.E.M. Besides the bars, n= indicates
the number of animals. *p< 0.05 vs. ND; #p< 0.05 vs. ND-RD.
Fig. 2. Urinary TGF-h1 in control (ND) and diabetic (D) rats, 30 days after
STZ treatment (left) and 15 days later (right) after sham operation or renal
denervation (RD). Cre = creatinine. Data are meanF S.E.M. Besides the
bars, n= indicates the number of animals. *p< 0.05 vs. ND; #p< 0.05 vs.
ND-RD.
Fig. 3. Cortical (left) and medullar (right) GLUT1 protein content in
nondiabetic (ND) and diabetic (D) rats submitted to sham operation or renal
denervation (RD). Top, typical autoradiograms; bottom, data are meanFS.E.M. of four (cortex) or six animals (medulla). **p< 0.05 vs. ND and D-
RD; yp< 0.05 vs. D. *p< 0.05 vs. ND, ND-RD and D; #p< 0.05 vs. ND-RD
and ND.
B. D’Agord Schaan et al. / Autonomic Neuroscience: Basic and Clinical 104 (2003) 88–94 91
(Fig. 3). Medullar levels of GLUT1 protein decreased by
50% in experimental diabetes ( p < 0.05). The effect of renal
denervation in this group was reverse, but did not com-
pletely restore GLUT1 protein levels to those observed in
non-diabetic animals (Fig. 3).
4. Discussion
An association between diabetic neuropathy and nephr-
opathy has been suggested by a possible effect of denerva-
tion in determining an enhancement of kidney vulnerability
to the hemodynamic effects of blood pressure (Sundkvist and
Lilja, 1993). In the streptozotocin-diabetic rat, albuminuria
was related to progressively higher glomerular immunohis-
tochemical TGF-h1 staining and deposition of total and typeI collagen (Bertoluci et al., 1996), even though in this model
there is no hypertension (Schaan et al., 1997), as it is
observed in humans (Parving et al., 1981). In this animal
model, renal diabetic damage is probably highly mediated by
increased glucose utilisation in mesangial cells (Ayo et al.,
1991). This increased glucose utilisation could be mediated
by high levels of facilitative glucose transporters present on
the cell surface of mesangial cells, since it is clear that the
activity of these transporters may be a rate-limiting factor for
increased glucose utilisation and consequently important in
the development of diabetic changes in the kidney (Heilig et
al., 1995). Despite the diuretic, natriuretic and hemodynamic
effects of renal denervation and the kidney GLUT1 abun-
dance currently described in many experimental conditions,
they were not well defined in the streptozotocin-diabetic rat.
The present study intended to observe the effects of renal
denervation upon markers involved in the pathogenesis of
diabetic nephropathy, such as the pattern of cortical GLUT1
expression, urinary albumin and urinary TGF-h1 in the
experimental model of streptozotocin-diabetic rat.
It is largely known that the effectiveness of renal dener-
vation is determined by the reduction in norepinephrine
renal tissue content (Kline and Mercer, 1980; Kassab et al.,
1995; Granger et al., 1996; Lohmeier et al., 1998). Using
these observations, we can consider that renal denervation in
the present study was effective and clearly reduced the renal
norepinephrine content in the animals submitted to the
surgical procedure.
In control animals, renal denervation determined, as
diabetes also did, an elevation of cortical GLUT1 protein
content. In diabetic animals, however, renal denervation
significantly reduced levels of cortical GLUT1 protein, in
such a way that these levels were almost identical to those of
control animals. These effects could be explained by the
possibility of cell damage or downregulation induced by
glucotoxicity, since other authors, studying cells in culture,
have observed elevation of GLUT1 expression and protein
levels when the glucose medium content was increased
(15–20 mmol l� 1), followed by reduction when glucose
concentration was excessively increased (25–30 mmol l� 1)
(Wakisaka et al., 1995; Knott et al., 1996). Nevertheless,
even in the presence of downregulation of glucose trans-
porters, other authors have demonstrated that the net glucose
consumption by cultured glomerular cells remains substan-
tially increased and is accompanied by a highly significant
enhancement in types IV and VI collagen production
(Wakisaka et al., 1994). In agreement with these authors,
we observed a tendency to higher urinary TGF-h1 levels in
these rats, indicating that the GLUT1 decrease determined
by 15 days of denervation was not enough to decrease
urinary TGF-h1 levels and, probably, neither the fibrosis
process. In summary, renal denervation normalised previ-
ously elevated cortical GLUT1 protein, but this change was
not accompanied by reduced urinary TGF-h1 levels. More-
over, it is important to emphasize that cortical GLUT1
expression had never been reported to be impaired in
diabetes.
Recently, some clinical studies emphasized the impor-
tance of our findings regarding the potential role of GLUT1
overexpression in the pathogenesis of diabetic nephropathy.
These studies demonstrated, in Chinese and Caucasoid
diabetic patients, the association between polymorphisms
of the glucose transporter GLUT1 gene and diabetic nephr-
opathy (Liu et al., 1999; Hodgkinson et al., 2001; Ng et al.,
2002). Also, the repercussions of GLUT1 gene overexpres-
sion changes were described in cultured mesangial cells: cell
hypertrophy, increased cell glucose mesangial uptake,
extracellular matrix, collagen IV and fibronectin synthesis.
All these alterations were reversed by rhein, which
decreases GLUT1 (Zhu et al., 2001).
Compared to control rats, diabetes determined reduction
of medullar GLUT1 protein content, while denervation
increased it in diabetic animals. Other authors already
observed these changes determined by diabetes: compared
to the cortical GLUT1 protein abundance, medullar GLUT1
levels are modified in a different way; they are reduced by
diabetes (Asada et al., 1997; Dominguez et al., 1994).
However, in diabetic rats, kidney denervation induced an
increase in GLUT1 abundance toward normal levels, but the
levels did not reach those observed in normal animals.
These results suggest that, in order to maintain GLUT1
abundance and glucose metabolism, completely different
mechanisms operate in renal tubular cells when compared to
cortical cells. The different responses of the same glucose
transporter, whether present in cortex or medulla, reflect its
different functions, and these different patterns ratify that, in
the present study, cortex and medulla were adequately
dissected. The modulation of reduced medullar GLUT1
content by insulin administration described by Asada et al.
in renal tubular cells suggests that GLUT1 protein abun-
dance reduction occurs in response to the high glucose
content presented to renal tubular cells (Asada et al., 1997).
Urinary glucose was significantly higher in diabetic rats
1 month after diabetes induction as well as after 45 days of
experimental diabetes, which includes 15 days of renal
denervation. It was also increased in renal-denervated dia-
B. D’Agord Schaan et al. / Autonomic Neuroscience: Basic and Clinical 104 (2003) 88–9492

betic as compared to diabetic animals. Diuresis showed the
same trends, probably because of the osmotic effect of
glucose on tubular fluid. These findings agree with those
described in normal rats (Piryova et al., 1980) and could be
explained by changes in GLUT2, the main glucose trans-
porter found in proximal tubule S1 segment, described to be
increased by diabetes as an adaptive response to maintain
high transtubular glucose flux (Dominguez et al., 1994;
Vestri et al., 2001).
Renal denervation did not operate changes in albuminu-
ria or urinary TGF-h1 in neither group. Since 15 days of
denervation does not decrease urinary albumin or urinary
TGF-h1 in experimental diabetes and does not increase
levels of GLUT1 in renal cortex, acceleration of diabetic
nephropathy cannot be assigned to it. Studying the same
model, Matsuoka did not find any effect of denervation on
albuminuria after 15 days, but he did find higher albumi-
nuria in diabetic denervated rats 30 days after the surgical
procedure (Matsuoka, 1993).
Reinnervation is a definitive phenomenon that begins
14–21 days after surgical denervation (Kline and Mercer,
1980). In this reinnervation process, areas of denervation
and hyperinnervation may develop, as it was recently
described to occur in the heart of diabetic rats (Schmid et
al., 1999). In this case, the result would be an increase in the
sympathetic tonus, which could determine worsening of
diabetic nephropathy. Of course, more extensive studies
concerning the process of denervation and possible reinner-
vation are necessary to fully explain what the effects of
autonomic neuropathy on the kidney of diabetic rats are.
Extending the period of denervation by another 15 days
could not reflect the pattern of changes of denervation.
Since hypertension is considered to have an important
role in the pathogenesis of human diabetic nephropathy
(Parving et al., 1981) and, in rats, diabetes and kidney
denervation do not increase blood pressure levels (Schaan
et al., 1997), we cannot rule out the possibility that this
difference could account for the different end-points
observed. Even though normal levels of blood pressure
could be directly transmitted to the glomerulus in the
denervated kidney, being a cause of injury, the fact that
rats, unlike humans, do not walk in an upright position
could also be protective. Taking all these observations
together, the extent to which this model is really represent-
ing what diabetic autonomic neuropathy determines in
human kidneys is still unknown.
We conclude that early-phase renal denervation in strep-
tozotocin-diabetic rats produces a normalisation of previ-
ously elevated cortical GLUT1 protein content, but urinary
TGF-h1 and albumin are not significantly ameliorated.
Since it has been hypothesised that renal denervation
increases kidney damage, we speculate that this is likely
to happen if animals’ blood pressure is increased (as in
humans with diabetic nephropathy), but it does not occur in
an animal model without increased mechanical stretch in its
mesangial cells.
References
Asada, T., Ogawa, T., Iwai, M., Shimomura, K., Kobayashi, M., 1997.
Recombinant insulin-like growth factor I normalizes expression of renal
glucose transporters in diabetic rats. Am. J. Physiol. 42, F27–F37.
Ayo, S.H., Radnik, R.A., Glass, W.F., Garoni, J.A., Rampt, E.R., Appling,
D.R., Kreisberg, J.I., 1991. Increased extracellular matrix synthesis
and mRNA in mesangial cells grown in high-glucose medium. Am. J.
Physiol. 260, F185–F191.
Bertoluci, M.C., Schmid, H., Lachat, J.J., Coimbra, T.M., 1996. Trans-
forming growth factor-beta in the development of rat diabetic nephrop-
athy. Nephron 74, 189–196.
Block, N.E., Menick, D.R., Robinson, K.A., Buse, M.G., 1991. Effect of
denervation on the expression of two glucose transporter isoforms in rat
hindlimb muscle. J. Clin. Invest. 88, 1546–1552.
Cortes, P., Zhao, X., Riser, B., Narins, R.G., 1997. Role of glomerular
mechanical strain in the pathogenesis of diabetic nephropathy. Kidney
Int. 51, 57–68.
DiBona, G.F., Rios, L.L., 1980. Renal nerves in compensatory renal re-
sponse to contralateral renal denervation. Am. J. Physiol. 238, F26–F30.
DiBona, G.F., Kopp, U.C., 1997. Neural control of renal function. Physiol.
Rev. 77, 75–197.
Dominguez, J.H., Camp, K., Maianu, L., Feister, H., Garvey, T., 1994.
Molecular adaptations of GLUT1 and GLUT2 in renal proximal tubules
of diabetic rats. Am. J. Physiol. 266, F282–F290.25.
Felten, S.Y., Peterson, R.G., Shea, P.A., Besch, J.R., Felten, D.L., 1982.
Effects of streptozotocin diabetes on the noradrenergic innervation of
the rat heart: a longitudinal histofluorescence and neurochemical study.
Brain Res. Bull. 8, 593–607.
Granger, J.P., Novak, J., Schnackenberg, C., Williams, S., Reinhart, G.A.,
1996. Role of renal nerves in mediating the hypertensive effects of nitric
oxide synthesis inhibition. Hypertension 27, 613–618.
Heilig, C.W., Concepcion, L.A., Riser, B.L., Freytag, S.O., Zhu, M.,
Cortes, P., 1995. Overexpression of glucose transporters in rat mesan-
gial cells cultured in a normal glucose millieu mimics the diabetic
phenotype. J. Clin. Invest. 96, 1802–1814.
Henriksen, E.J., Rodnik, K.J., Mondon, C.E., James, D., Holloszy, J.O.,
1991. Effect of denervation or unweighting on GLUT-4 protein in rat
soleus muscle. J. Appl. Physiol. 70, 2322–2327.
Hirakata, M., Kaname, S., Chung, U.G., Joki, N., Hori, Y., Noda, M.,
Takuwa, Y., Okazaki, T., Fujita, T., Katoh, T., Kurokawa, K., 1997.
Tyrosine kinase dependent expression of TGF-beta induced by stretch
in mesangial cells. Kidney Int. 51, 1028–1036.
Hodgkinson, A.D., Millward, B.A., Demaine, A.G., 2001. Polymorphisms
of the glucose transporter GLUT1 gene are associated with diabetic
nephropathy. Kidney Int. 59, 985–989.
Huang, W.-C., Fang, T.-C., Cheng, J.-T., 1998. Renal denervation prevents
and reverses hyperinsulinemia-induced hypertension in rats. Hyperten-
sion 32, 249–254.
Kassab, S., Kato, T., Wilkins, C.F., Chen, R., Hall, J.E., Granger, J.P., 1995.
Renal denervation attenuates the sodium retention and hypertension
associated with obesity. Hypertension 25, 893–897.
Kline, R.L., Mercer, P.F., 1980. Functional reinnervation and development
of supersensitivity to NE after renal denervation in rats. Am. J. Physiol.
238, R353–R358.
Knott, R.M., Robertson, M., Muckersie, E., Forrester, J.V., 1996. Regula-
tion of glucose transporters (GLUT-1 and GLUT-3) in human retinal
endothelial cells. Biochem. J. 318, 313–317.
Lacchini, S., Fang, J., Fernandes, T.R.G., Irigoyen, M.C., 1997. Arterial
pressure control in normal rats: role of renal nerves and sodium. J.
Hypertens. 29 (3), 897.
Liu, Z.H., Guan, T.J., Chen, Z.H., Li, L.S., 1999. Glucose transporter
GLUT1 allele (XbaI-) associated with nephropathy in non-insulin de-
pendent diabetes mellitus. Kidney Int. 55, 1843–1848.
Lohmeier, T.E., Reinhart, G.A., Mizelle, H.L., Han, M., Dean, M.M., 1998.
Renal denervation supersensitivity revisited. Am. J. Physiol. 275,
R1239–R1246.
B. D’Agord Schaan et al. / Autonomic Neuroscience: Basic and Clinical 104 (2003) 88–94 93

Matsuoka, H., 1993. Protective role of renal nerves in the development of
diabetic nephropathy. Diabetes Res. 23, 19–29.
Ng, D.P.K., Canani, L.H., Araki, S.I., Smiles, A., Warram, J.H., Krolewski,
A.S., 2002. Polymorphisms in GLUT1 are associated with the develop-
ment of diabetic nephropathy in diabetes mellitus. Diabetes 51 (Suppl. 2),
A36.
Oliveira, V.L.L., Irigoyen, M.C., Moreira, E.D., Strunz, C., Krieger, E.M.,
1992. Renal denervation normalizes pressure and baroreceptor reflex in
high renin hypertension in conscious rats. Hypertension 19, II-17– II-21.
Parving, H.-H., Andersen, A.R., Smidt, U.M., Friisberg, B., Svendsen,
P.A., 1981. Reduced albuminuria during early and aggressive antihy-
pertensive treatment of insulin-dependent diabetic patients with diabetic
nephropathy. Diabetes Care 4, 459–463.
Piryova, B., Natcheff, N.B., Kirkova, N.L., 1980. Effect of renal denerva-
tion on glucose transport. Acta Physiol. Pharmacol. Bulg. 6, 3–8.
Schaan, B.D., Bertoluci, M., Lacchini, S., Machado, U., Irigoyen, M.C.,
Schmid, H., 2001. Increased renal GLUT1 abundance, albuminuria and
urinary TGF-h1 in STZ-induced diabetic rats: implications for the de-
velopment of diabetic nephropathy (DN). Horm. Metab. Res. 33, 1–6.
Schaan, B.D., Maeda, C.Y., Timm, H., Medeiros, S., Moraes, R., Ferlin, E.,
Fernandes, T.G., Ribeiro, J.P., Schmid, H., Irigoyen, M.C., 1997. Time
course of changes in heart rate and blood pressure variability in strep-
tozotocin-induced diabetic rats treated with insulin. Br. J. Med. Biol.
Res. 30, 1081–1086.
Schmid, H., Bertoluci, M.C., Coimbra, T.M., 1989. Determinac�ao da ex-
crec� ao urinaria de albumina por eletroimunoensaio (EIE). Arq. Bras.
Endocrinol. Metabol. 33, 73–75.
Schmid, H., Forman, L.A., Cao, X., Sherman, P.S., Stevens, M., 1999.
Heterogeneous cardiac sympathetic denervation and decreased myocar-
dial nerve growth factor in streptozotocin-induced diabetic rats: impli-
cations for cardiac sympathetic dysinnervation complicating diabetes.
Diabetes 48, 603–608.
Schmidt, R.E., Sharp, D.W., 1982. Axonal dystrophy in experimental dia-
betic autonomic neuropathy. Diabetes 31, 761–770.
Sundkvist, G., Lilja, B., 1993. Autonomic neuropathy predicts deterioration
in glomerular filtration rate in patients with IDDM. Diabetes Care 16
(5), 773–779.
Vestri, S., Okamoto, M.M., de Freitas, H.S., Aparecida dos Santos, R.,
Nunes, M.T., Morimatsu, M., Heimann, J.C., Machado, U.F., 2001.
Changes in sodium or glucose filtrated rate modulate expression of
glucose transporters in renal proximal tubular cells of rat. J. Membr.
Biol. 182 (2), 105–112.
Wakisaka, M., Spiro, M.J., Spiro, R.G., 1994. Synthesis of type VI colla-
gen by cultured glomerular cells and comparison of its regulation by
glucose and other factors with that of type IV collagen. Diabetes 43,
95–103.
Wakisaka, M., He, Q., Spiro, M.J., Spiro, R.G., 1995. Glucose entry into rat
mesangial cells is mediated by both Na+-coupled and facilitative trans-
porters. Diabetologia 38, 291–297.
Zhu, J., Liu, Z., Li, Y., 2001. Inhibition of glucose transporter 1 over-
expression in mesangial cells by rhein. Zhonghua Nei Ke Za Zhi 40,
537–542.
B. D’Agord Schaan et al. / Autonomic Neuroscience: Basic and Clinical 104 (2003) 88–9494

CaseReports Right Ventricular
Bronchogenic CystWe report an exceedingly rare case of primary bronchogenic cyst in the outflow tract ofthe right ventricle in a 48-year-old woman. In our review of the world literature, wefound only 1 other report of an intracardiac bronchogenic cyst. Our patient’s only symp-tom was mild dyspnea not associated with physical exertion, and the cyst was resect-ed successfully. We report clinical aspects of the case, diagnostic methods, surgicalmanagement, and histopathologic findings. (Tex Heart Inst J 2003;30:71-3)
he resection of a cardiac tumor was first performed in 1951, when Maurer1
successfully removed an epicardial lipoma. In 1954, extracorporeal circula-tion enabled Crafoord2 to excise successfully a left atrial myxoma.
Primary cardiac neoplasms are 100 to 1,000 times less prevalent than are sec-ondary neoplasms of the heart.3,4 Autopsy findings have shown that their preva-lence in the general population ranges from 0.0017% to 0.28%.5
About 75% of primary cardiac neoplasms are benign.5 Of these benign tumors,about 50% are myxomas. In children, rhabdomyomas are the most common.4,6,7
Most malignant tumors are sarcomas, but lymphomas, thymomas, and plasma-cytomas have also been reported.
Bronchogenic cysts have benign characteristics and comprise 1.3% of all prima-ry tumors of the heart and pericardium.8 In our review of the world literature, wefound only 1 case of an intracardiac bronchogenic cyst, which occurred in the leftatrium of a 43-year-old woman and involved the entire atrial septum.8
Case Report
In October 1996, a previously healthy 48-year-old woman was seen in our hospi-tal. She complained of dyspnea not related to physical exertion. She reported nohistory of family cardiopathy, hypertension, smoking, alcoholism, or hormonaldisorders.
At physical examination, her vital signs were blood pressure, 120/80 mmHg;heart rate, 72 beats/min; and axillary temperature, 36.5 °C. Pulmonary ausculta-tory findings consisted of bilateral vesicular breath sounds without rales. Cardiacauscultatory findings included a regular rhythm, S1 and S2 audible, and a low-fre-quency, harsh systolic ejection murmur, most intense in the 4th left intercostalspace and radiating to the 2nd left intercostal space, without thrills. She presentedno jugular distention, adenopathy, hepatomegaly, ascites, or edema in the lowerlimbs. The rest of the physical examination was normal.
An electrocardiogram revealed sinus rhythm and right bundle branch block. Thechest radiograph was normal.
Transthoracic echocardiography revealed a cyst with well-defined margins,which caused a 4.2-cm reduction in the right ventricular (RV) cavity and subtotalobstruction of the RV outflow tract. The RV cavity was enlarged, but the size ofthe other cardiac cavities was normal. The valves were morphologically and func-tionally normal. The pericardium exhibited normal, free movement of its layers.
Magnetic resonance imaging showed a cystic mass (Fig. 1) invading the myo-cardium of the anterior wall of the right ventricular outflow tract. This mass meas-ured 3.3 × 4.2 cm in diameter, and obstructed the RV outflow tract almost com-pletely.
Right ventriculography revealed a spherical mass in the outf low tract, whichproduced a systolic gradient of 46 mmHg. Coronary angiography findings werenormal.
Paulo R. Prates, MDLucas Lovato, MDAbud Homsi-Neto, MDMarinez Barra, MDJoão R.M. Sant´Anna,
MD, PhDRenato A.K. Kalil, MD, PhDIvo A. Nesralla, MD, PhD
Key words: Bronchogeniccyst/surgery; case report;female; heart neoplasms/diagnosis; heart neoplasms/primary; heart ventricle
From: Surgery Service,Instituto de Cardiologia do Rio Grande do Sul, Fundação Universitária deCardiologia, Porto Alegre, RS 90.620-001, Brazil
Address for reprints:Dr. Paulo R. Prates, Unidade de Pesquisa doIC/FUC, Av. Princesa Isabel395, Santana, Porto Alegre,RS 90.620-001, Brazil
E-mail: [email protected]
© 2003 by the Texas Heart ®
Institute, Houston
Texas Heart Institute Journal Right Ventricular Bronchogenic Cyst 71
T

Referred to surgery with a diagnosis of RV cystictumor, the patient underwent median sternotomy,pericardiotomy, cannulation of the ascending aortaand of the superior and inferior venae cavae, extracor-poreal circulation at a f low rate of 4 L/min, infusionof a hypothermic crystalloid cardioplegic solution,and hypothermia at 30 °C.
The protrusion caused by the tumor in the RV out-f low tract was seen. We performed a right ventricu-lotomy, exposed the cystic mass (Fig. 2), and resectedit completely. We patched the endocardium with asmall piece of preserved bovine pericardium. Theaortic clamping time was 25 minutes, and cardiopul-monary bypass time was 42 minutes. The surgery
was successful. The patient had an uneventful post-operative recovery and was completely asymptomaticat her discharge on the 7th postoperative day. Histo-logic examination revealed that the mass was a bron-chogenic cyst (Figs. 3 and 4).
Volume 30, Number 1, 200372 Right Ventricular Bronchogenic Cyst
Fig. 1 A) Sagittal magnetic resonance image shows a high-intensity lesion (arrow) causing obstruction of the right ven-tricular outflow tract. B) Axial magnetic resonance imageshows high-intensity lesion (arrow) invading the myocardiumof the anterior wall of the right ventricular outflow tract.
Fig. 2 Operative exposure of the cystic mass.
Fig. 3 Photomicrograph of the cystic wall, low magnification(H&E, orig. ×200).
Fig. 4 Cystic wall, high magnification (H&E, orig. ×400). Pho-tomicrograph shows respiratory epithelium and intramuralcartilage, indicated by the arrow.
A
B
Discussion
Bronchogenic cysts of the heart are exceedingly raretumors; in our review of the world literature, we foundonly 1 other report of a case. They are benign congen-ital malformations that arise from an abnormality ofthe primitive foregut. They may occur in any part ofthe lung, but are uncommon in the mediastinum.9,10
Clinical manifestations of cardiac tumors are vari-able and often ref lect the chamber of origin, ratherthan the specific tumor type.11,12
Cardiac tumors can cause dyspnea by obstructingthe cardiac chambers, compressing the heart, and em-bolizing systemically. This last manifestation can re-sult in the initial presentation—with the centralnervous system as the most common site.12-15 More-over, cardiac tumors are a possibility in the differentialdiagnosis of valve diseases, congestive heart failure,conduction abnormalities, abnormal heart murmurs,ventricular and supraventricular arrhythmias, syncope,congestive heart failure, severe cyanosis, and pulmo-nary embolism.16,17
Our patient’s tumor originated in the anterior wall ofthe RV, next to the outflow tract, and partially obstruct-ed the blood flow, which explained her symptoms.
The initial investigation of patients with suspectedcardiac tumors should include chest radiography and transthoracic 2-dimensional echocardiography.The echocardiography can provide accurate determi-nation of tumor size, location, point of attachment,mobility, and hemodynamic relevance. Magnetic res-onance imaging (MRI) provides a noninvasive meth-od of obtaining 3-dimensional images of massesinvolving the cardiac chambers and pericardium. In-deed, MRI has become an established method in thediagnosis of a mass and in preparing for surgical in-tervention, for it can show not only location andmovement, but spacial relationships. An MR imagecan distinguish between solid and f luid lesions andcan determine tissue characteristics.18
Two-dimensional echocardiography is also highlysensitive and noninvasive, and has the advantage, overMRI, of lower cost. It can be recommended as an op-timal alternative for postoperative follow-up.12,13
Surgery for benign cardiac tumors can be per-formed safely with the use of modern techniques formyocardial protection, extracorporeal circulation, andhypothermic circulatory arrest. High rates of healingand low morbidity and mortality rates can be ob-tained.6 The prognosis is associated with the resect-ability of the tumor but is usually good even whenresection is incomplete.19
References1. Maurer ER. Successful removal of tumor of the heart. J
Thorac Cardiovasc Surg 1952;23:479-85.
2. Crafoord C. Discussion of Glover RP. The technique of mi-tral commissurotomy. In: Lam CR, ed. Proceedings of theHenry Ford Hospital International Symposium on Cardio-vascular Surgery: Studies in Physiology, Diagnosis andTechniques. 1955 Mar; Detroit, Mich. Philadelphia: WBSaunders; 1955. p. 202-3.
3. Grebenc ML, Rosado de Christenson ML, Burke AP, GreenCE, Galvin JR. Primary cardiac and pericardial neoplasms:radiologic-pathologic correlation. Radiographics 2000;20:1073-103.
4. Burke A, Virmani R. Fascicle 16, 3rd Series: Tumors of theheart and great vessels. In: Atlas of tumor pathology. Wash-ington, DC: Armed Forces Institute of Pathology; 1996.
5. McAllister HA Jr, Fenoglio JJ. Fascicle 15, 2nd Series: Tu-mors of the cardiovascular system. In: Atlas of tumor path-ology. Washington, DC: Armed Forces Institute of Pathology;1978. p. 1-3.
6. Murphy MC, Sweeney MS, Putnam JB Jr, Walker WE, Fra-zier OH, Ott DA, Cooley DA. Surgical treatment of cardiactumors: a 25-year experience. Ann Thorac Surg 1990;49:612-8.
7. Beghetti M, Gow RM, Haney I, Mawson J, Williams WG,Freedom RM. Pedriatric primary benign cardiac tumors: a15-year review. Am Heart J 1997:134:1107-14.
8. Soeda T, Matsuda M, Fujioka Y, Doui K, Maruhashi H. Acase report of a huge bronchogenic cyst originated in theatrial septum [in Japanese]. Nippon Kyobu Geka GakkaiZasshi 1996;44:1781-6.
9. Kobzik L, Schoen FJ. O pulmao. In: Robbins patologia es-trutural e funcional. 5th ed. Rio de Janeiro: GuanabaraKoogan SA; 1996. p. 599.
10. Matthay RA, Arroliga AC. Anormalidades localizadas da aer-acao pulmonar. In: Cecil tratado de medicina interna. 6thed. Rio de Janeiro: Guanabara Koogan SA; 1996. p. 431.
11. Veinot JP, Burns BF, Commons AS, Thomas J. Cardiac neo-plasms at the Canadian Reference Centre for Cancer Path-ology. Can J Cardiol 1999;15:311-9.
12. Richardson JV, Brandt B 3rd, Doty DB, Ehrenhaft JL. Sur-gical treatment of atrial myxomas: early and late results of11 operations and review of the literature. Ann Thorac Surg1979;28:354-8.
13. Verkkala K, Kupari M, Maamies T, Leinonen H, Salo J, Jarvi-nen A, et al. Primary cardiac tumours—operative treatmentof 20 patients. Thorac Cardiovasc Surg 1989;37:361-4.
14. Salehian O, Demers C, Patel A. Atrial myxoma presentingas isolated unilateral blindness: a case report and review ofthe literature. Can J Cardiol 2001;17:898-900.
15. Donsbeck AV, Ranchere D, Coindre JM, Le Gall F, CordierJF, Loire R. Primary cardiac sarcomas: an immunohisto-chemical and grading study with long-term follow-up of 24cases. Histopathology 1999;34:295-304.
16. Silvermann NA. Primary cardiac tumors. Ann Surg 1980;191:127-38.
17. Stiller B, Hetzer R, Meyer R, Dittrich S, Pees C, Alexi-Mes-kishvili V, Lange PE. Primary cardiac tumours: when is sur-gery necessary? Eur J Cardiothorac Surg 2001;20:1002-6.
18. Hoffmann U, Globits S, Frank H. Cardiac and paracardiacmasses. Current opinion on diagnostic evaluation by mag-netic resonance imaging. Eur Heart J 1998;19:553-63.
19. Miralles A, Bracamonte L, Soncul H, Diaz del Castillo R,Akhtar R, Bors V, et al. Cardiac tumors: clinical experienceand surgical results in 74 patients. Ann Thorac Surg 1991;52:886-95.
Texas Heart Institute Journal Right Ventricular Bronchogenic Cyst 73

New lead for in utero pacing for fetalcongenital heart blockRenato S. Assad, MD,a Paulo Zielinsky, MD,b Renato Kalil, MD,b
Gustavo Lima, MD,b Anna Aramayo, MD,b Ari Santos, MD,b
Roberto Costa, MD,a Miguel B. Marcial, MD,a andSergio A. Oliveira, MD,a Sao Paulo and Porto Alegre, Brazil
Complete heart block occurs in 4% to 15% of cases offetal arrhythmia. Although it is usually well toleratedin the absence of complicating cardiac anomalies, asmany as 25% of these fetuses have hydrops and die in
utero.1 The pathophysiologic arguments for fetal ventricular pac-ing are compelling. We describe the case of a fetus presenting withcomplete heart block, hydrops, and associated structural heartdefects, the mother of whom consented to attempts at in uteropacing. The purpose of this article is to describe a new lead forpercutaneous implantation that minimizes surgical trauma to boththe fetus and the mother.
Clinical Summary A 36-year-old woman was referred to theInstitute of Cardiology Porto Alegre at 18 weeks’ gestation with afetus presenting with complete heart block (heart rate, 47 beats/min), marked hydrops, left atrial isomerism, and an atrioventricu-lar septal defect. Maternal therapy with positive chronotropicdrugs and steroids did not reverse the low output failure and lowfetal heart rate. A follow-up maternal ultrasound examination at 24weeks’ gestation suggested decreased right ventricular contractil-ity in the fetus and abdominal and pleural effusions.
With the risk of fetal demise approaching 100%, fetal pacingwas considered. After extensive discussions with the physiciansinvolved with the Fetal Cardiology Research Program of the HeartInstitute University of Sao Paulo and the Institute of CardiologyPorto Alegre, including explanation of the procedure’s benefits andrisks, the patient consented to attempts at in utero transthoracicfetal ventricular pacing. The procedure was performed at 25weeks’ gestation according to a protocol approved by our institu-tional ethics committee on human research.
Anesthesia. The mother was sedated with intravenousmidazolam and fentanyl citrate. Xylocaine 1% was infiltrated
subcutaneously inher abdomen inpreparation for chor-docentesis. The pla-cental cord was thenpunctured transpla-centally, under ul-trasonographicguidance, with an18-gauge needle.Pancuronium andketamine were administered to the fetus.
The new lead. We recently designed a prototype T-shapedlead that can be introduced through an 18-gauge needle to fixsecurely to the fetal myocardium, with no need for open surgicalprocedures. The lead represents a modification of the temporaryepicardial pacing lead commonly used after heart surgery. Themain difference is that at the cardiac end, the pacing lead is cutclose to the polypropylene coating, and a stainless-steel bar (5 mm� 0.5 mm) is connected to the wire, producing a T-bar. Thepurpose of this shape is to keep the new lead securely anchored tothe myocardium, thus preventing lead dislodgment. The other endof the lead remains intact, consisting of a long straight needle. Thelead length remained the original 60 cm.
In the present case the new pacing lead was driven to the heartof the fetus through the tip of a specially designed, 15-cm, 18-gauge introducer needle with a 25° beveled tip. This tip containeda 7-mm longitudinal side slot cut from the heel of the bevel thathoused the T-bar. The T-bar was positioned within the lumen at thetip of the needle, and the pacing wire protruded from the slot andtrailed alongside the needle (Figure 1). Use of a needle stylet wasplanned to eject the T-bar from the slot.
Fetal pacing procedure. The site for lead introduction wasmarked on the mother’s abdomen, and local anesthesia was ap-plied. Under continuous scanning, the new lead was inserted intothe uterine cavity and advanced into the fetal thorax and then theventricle. The fetus was in the dorsal presentation, making itdifficult to reach the ventricles. After 4 attempts, the needle tip hitthe myocardium. The needle stylet was gently advanced into theneedle lumen, and the T-bar lead was ejected from the introducerneedle slot into the myocardium by pressing the needle styletforward. The introducer needle was then withdrawn. A secondlead was placed in the thoracic wall for bipolar stimulation. Theleads were then connected to the pacing system analyzer(Biotronik ERA 300; Berlin, Germany) to measure the sensi-tivity and stimulation thresholds. Ventricular pacing was begunat 140 beats/min. Stimulation resistance was measured during
From the Heart Institute (InCor),a University of Sao Paulo Medical School,Sao Paulo, and the Institute of Cardiology,b Porto Alegre, Brazil.
Presented at the 4th World Congress of Pediatric Cardiology and CardiacSurgery, Toronto, Canada, May 2001.
Received for publication Sept 9, 2002; accepted for publication Oct 23,2002.
Address for reprints: Renato S. Assad, MD, Heart Institute, University ofSao Paulo, Division of Surgery, Av Dr Eneas Carvalho Aguiar, 44, SaoPaulo, SP 05403-000 Brazil (E-mail: [email protected]).
J Thorac Cardiovasc Surg 2003;126:300-2
Copyright © 2003 by The American Association for Thoracic Surgery
0022-5223/2003 $30.00 � 0
doi:10.1016/S0022-5223(03)00220-4
Marcial, Assad, Oliveira, Costa (left to right)
Kalil, Lima, Zielinsky, Santos, Aramayo (left to right)
Brief Communications
300 The Journal of Thoracic and Cardiovascular Surgery ● July 2003

constant-voltage pacing (5 V) at a pulse duration of 0.5 ms. Wemeasured a stimulation resistance of 357� and a sensed fetal Rwave of 6.4 mV. During the procedure, cardiac tamponadedeveloped, which was managed with pericardiocentesis.
Fetal myocardial stimulation threshold. Measurements weremade at constant pulse width pacing until the lowest outputprovided 100% ventricular capture. Stimulation thresholds wereobtained at pulse widths ranging from 0.1 to 2.0 ms by gradu-ally decreasing the voltage output of the pulse analyzer to thepoint at which ventricular noncapture was apparent with bra-dycardia. The acute fetal myocardial stimulation thresholdswere consistently low, with no stimulation failure seen with thenew electrode. The curve remained relatively constant at pulsewidths of greater than 0.6 ms, turning sharply upward withshorter pulse widths of less than 0.6 ms. After all measurementswere completed, the leads were connected to a Biotronik ActrosSR single-chamber pulse generator, which was implanted sub-cutaneously in the maternal abdominal wall. The pacemakerwas set to the following parameters: VVI mode; pacing rate,140 pulses/min; cardiac sensitivity, 1.25 mV; cardiac pulseamplitude, 5.0 V; and refractory period, 400 ms. During the firstpostoperative day, an echocardiogram revealed recovery ofventricular function, a stable fetal heart rate of 140 beats/min,and a mild pericardial effusion. No uterine contractions wereobserved during the postoperative period. Again, low stimula-tion thresholds and no stimulation failures were seen. Figure 2shows the voltage strength-duration curves obtained during theprocedure (ie, implantation) and on the first postoperative day.After 36 hours of ventricular pacing, asystole was noticed onultrasonography, and the pericardial effusion appeared signifi-cant. The pregnancy was subsequently terminated through acesarean section, resulting in the delivery of an 800-g hydropicinfant.
Fetal Autopsy. Postmortem examination confirmed massivehydrops and cardiac anatomic defects. A moderate bloody effusionin the pericardial sac was considered the probable cause of fetaldeath. One pacing lead was firmly placed in the left ventricle’smuscle, and the other lead was also placed in the thoracic wall. Nohematoma was observed in the ventricular wall, nor were thrombiseen within the ventricles.
DiscussionThe T-bar lead proposed here for use in percutaneous fetalpacing might offer important technical advantages over leadsused in conventional open surgical procedures. During theobserved period of fetal pacing, our lead provided stable fixa-tion with acceptable performance, as demonstrated by the lowacute thresholds. Indeed, we believe that this is the first docu-mentation of voltage strength-duration curves for the acutemyocardial stimulation threshold of a human fetus that survived36 hours after intrauterine pacemaker implantation. Moreover,this technique has the potential to minimize surgical trauma toboth the fetus and the mother.
The cardiac tamponade observed in this case could haveresulted from the 3 failed attempts at lead placement. Webelieve that use of fetoscopy in conjunction with ultrasono-graphic guidance would allow for a more controlled procedurein which the new lead could be more easily placed.2 In addition,the development of improved materials, such as a thinner needle(20 gauge) and a bipolar pacing wire, could facilitate punctureof the fetal myocardium, thus decreasing the chances of such acomplication.
In the present case the fetal heart rate abruptly increased from 47to 140 beats/min with pacing. Nevertheless, bradyarrhythmia, with aheart rate 50% of the normal fetal rate, is well tolerated in the absenceof complicating systemic abnormalities or placental insufficiency.Therefore, it seems to us that a gradual increase in the fetal heart ratewould be more adaptive and could adequately augment the cardiacoutput as well. It also is unclear whether such a jump in the fetal heartrate could result in any acid-base imbalances caused by increasingmyocardial oxygen consumption and cardiac output.
Previous attempts at in utero percutaneous pacing, either througha transthoracic approach1 or through the inferior vena cava,3 haveresulted in fetal demise a few hours after the procedure. A lack ofmyocardial fixation and consequent dislodgment of the percutaneouslead represents a major technical limitation of the percutaneous ap-proach. Although the authors have demonstrated that the pacing wirescan be satisfactorily positioned within the heart, they could not pre-vent dislodgement with resumption of fetal activity. Our new proto-type lead has the length increased from 60 to 150 cm to avoid thisproblem. Attempts at direct pacemaker implantation through a cesar-ean section were undertaken at the University of California, San
Figure 1. The introducer needle with the new T-bar lead: A,stainless steel bar; B, pacing wire with polypropylene coating; C,straight needle; D, 18-gauge introducer needle with a 25° beveledtip fashioned with a 7-mm longitudinal side slot cut from the heelof the bevel (E); F, needle stylet.
Figure 2. Voltage strength-duration curves for acute myocardialstimulation threshold of a human fetus during lead implantation(implant) and on the first postoperative day (1st POD).
Brief Communications
The Journal of Thoracic and Cardiovascular Surgery ● Volume 126, Number 1 301

Francisco,4 and at the Institute of Cardiology Porto Alegre, both ofwhich were unsuccessful.
In our previous experimental study,5 we described the use of anepicardial modified screw-in lead to pace fetuses with completeheart block through a cesarean section as a safer and more reliableprocedure. However, the possibility of premature labor still repre-sents a challenge for fetal surgery.6 The percutaneous approachassociated with this new lead for fetal ventricular pacing seems tobe more compelling and less invasive. Moreover, it should be arelatively inexpensive, simple, and quick alternative to classicsurgical placement of an epicardial lead.
We thank Dr Jose Antonio Franchini Ramirez, Director of theHeart Institute (InCor), University of Sao Paulo Medical School,and Dr Ivo Nesralla, Director of the Institute of Cardiology PortoAlegre, for facilitating the agreement between the 2 involvedinstitutions. This agreement permitted this successful collaborativeeffort at fetal pacing to occur.
References
1. Carpenter RJ Jr, Strasbuerger JF, Garson A, Smith RT, Deter RL,Engelhardt HT Jr. Fetal ventricular pacing for hydrops secondary tocomplete atrioventricular block. J Am Coll Cardiol. 1986;8:1434-6.
2. Kohl T, Strumper D, Witteler R, Merschhoff G, Alexiene R, CallenbeckC, et al. Fetoscopic direct fetal cardiac access in sheep: an importantexperimental milestone along the route to human fetal cardiac interven-tion. Circulation. 2000;102:1602-4.
3. Walkinshaw SA, Welch CR, McCormack J, Walsh K. In utero pacingfor fetal congenital heart block. Fetal Diagn Ther. 1994;9:183-5.
4. Silverman NH, Kohl T, Harrison MR, Hanley FL. Experimental fetalsurgery in the animal model and in the human fetus. In: Imai Y, MommaK, editors. Proceedings of the Second World Congress of PediatricCardiology and Cardiac Surgery. Armonk (NY): Futura Publishing Co;1998. p. 622-3.
5. Assad RS, Jatene MB, Moreira LF, Sales PC, Costa R, Hanley FL, et al.Fetal heart block: a new experimental model to assess fetal pacing.Pacing Clin Electrophysiol. 1994;17:1256-63.
6. Longaker MT, Golbus MS, Filly RA, Rosen MA, Chang SW, HarrisonMR. Maternal outcome after open fetal surgery. A review of the first 17human cases. JAMA. 1991;265:737-41.
Brief Communications
302 The Journal of Thoracic and Cardiovascular Surgery ● July 2003
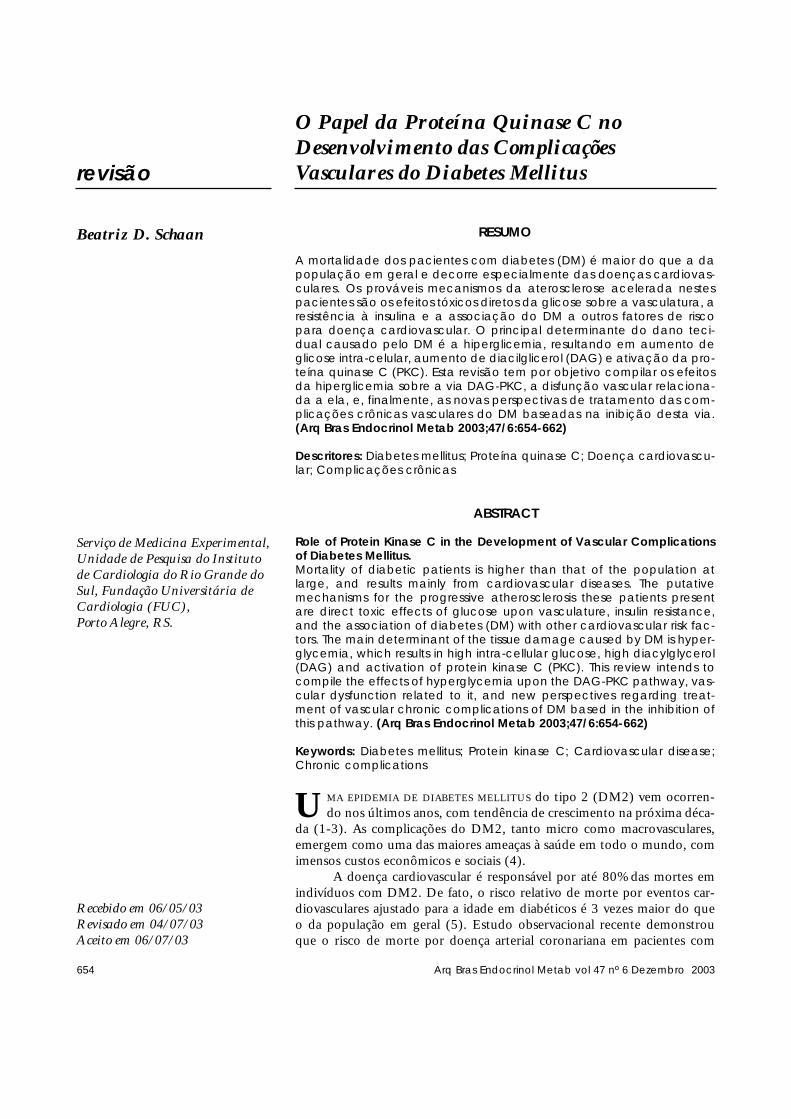
Arq Bras Endocrinol Metab vol 47 nº 6 Dezembro 2003654
RESUMO
A mortalidade dos pacientes com diabetes (DM) é maior do que a dapopulação em geral e decorre especialmente das doenças cardiovas-culares. Os prováveis mecanismos da aterosclerose acelerada nestespacientes são os efeitos tóxicos diretos da glicose sobre a vasculatura, aresistência à insulina e a associação do DM a outros fatores de riscopara doença cardiovascular. O principal determinante do dano teci-dual causado pelo DM é a hiperglicemia, resultando em aumento deglicose intra-celular, aumento de diacilglicerol (DAG) e ativação da pro-teína quinase C (PKC). Esta revisão tem por objetivo compilar os efeitosda hiperglicemia sobre a via DAG-PKC, a disfunção vascular relaciona-da a ela, e, finalmente, as novas perspectivas de tratamento das com-plicações crônicas vasculares do DM baseadas na inibição desta via.(Arq Bras Endocrinol Metab 2003;47/6:654-662)
Descritores: Diabetes mellitus; Proteína quinase C; Doença cardiovascu-lar; Complicações crônicas
ABSTRACT
Role of Protein Kinase C in the Development of Vascular Complicationsof Diabetes Mellitus.Mortality of diabetic patients is higher than that of the population atlarge, and results mainly from cardiovascular diseases. The putativemechanisms for the progressive atherosclerosis these patients presentare direct toxic effects of glucose upon vasculature, insulin resistance,and the association of diabetes (DM) with other cardiovascular risk fac-tors. The main determinant of the tissue damage caused by DM is hyper-glycemia, which results in high intra-cellular glucose, high diacylglycerol(DAG) and activation of protein kinase C (PKC). This review intends tocompile the effects of hyperglycemia upon the DAG-PKC pathway, vas-cular dysfunction related to it, and new perspectives regarding treat-ment of vascular chronic complications of DM based in the inhibition ofthis pathway. (Arq Bras Endocrinol Metab 2003;47/6:654-662)
Keywords: Diabetes mellitus; Protein kinase C; Cardiovascular disease;Chronic complications
UMA EPIDEMIA DE DIABETES MELLITUS do tipo 2 (DM2) vem ocorren-do nos últimos anos, com tendência de crescimento na próxima déca-
da (1-3). As complicações do DM2, tanto micro como macrovasculares,emergem como uma das maiores ameaças à saúde em todo o mundo, comimensos custos econômicos e sociais (4).
A doença cardiovascular é responsável por até 80% das mortes emindivíduos com DM2. De fato, o risco relativo de morte por eventos car-diovasculares ajustado para a idade em diabéticos é 3 vezes maior do queo da população em geral (5). Estudo observacional recente demonstrouque o risco de morte por doença arterial coronariana em pacientes com
revisão
O Papel da Proteína Quinase C no Desenvolvimento das Complicações Vasculares do Diabetes Mellitus
Beatriz D. Schaan
Serviço de Medicina Experimental,Unidade de Pesquisa do Institutode Cardiologia do Rio Grande doSul, Fundação Universitária deCardiologia (FUC), Porto Alegre, RS.
Recebido em 06/05/03Revisado em 04/07/03Aceito em 06/07/03

Arq Bras Endocrinol Metab vol 47 nº 6 Dezembro 2003
Proteína Quinase C e Vasculopatia DiabéticaSchaan
655
DM2 é semelhante àquele observado para indivíduossem DM que tiveram um infarto agudo do miocárdioprévio (6).
As razões para a aterosclerose acelerada manifesta-da em pacientes com DM ainda não são completamentecompreendidas, tendo sido sugeridos como mecanismosprováveis os efeitos tóxicos diretos da glicose sobre a vas-culatura, a resistência à insulina e a associação do DM aoutros fatores de risco (6). Os resultados de vários estu-dos, especialmente de 2 grandes ensaios clínicos recentes,em pacientes com DM1 (7) e DM2 (8), demonstrando arelação direta entre os níveis de hiperglicemia cronica-mente mantida e as complicações micro e macrovascu-lares, suportam que a hiperglicemia é o fator determi-nante inicial principal na patogênese das complicações doDM. O aumento de glicose intra-celular é o principaldeterminante do dano tecidual causado pelo DM, danoeste que pode ser reversível quando restaurada a condiçãode normoglicemia, ou irreversível, mesmo revertida ahiperglicemia, pois se originou de alterações cumulativasem macro-moléculas de vida longa (9).
A glicose, presente no compartimento extra-celu-lar, é transportada para o compartimento intra-celularpor difusão facilitada, mediante ação dos transportadoresde glicose, especialmente GLUTs 1 e 4. Uma vez dentroda célula, a glicose é metabolisada por glicólise. Menosdo que 5% da glicose intra-celular é metabolisada pela viada aldose-redutase, mesmo em condições de hiper-glicemia, o que aumenta o fluxo da via do sorbitol,mudando seu potencial redox, e altera vias de transduçãode sinais. É possível que a via comum pela qual a hiper-glicemia estaria mediando seus efeitos adversos seja aalteração de vias de transdução de sinais, como é a ati-vação da via diacilglicerol (DAG)-proteína quinase C(PKC) (10). O GLUT 1 é superexpresso em condiçõesde altas concentrações extra-celulares de glicose e hipó-xia, e o aumento do fluxo glicolítico resulta em aumen-to da síntese de novo de DAG (11). Nas células vascu-lares, a ativação da via DAG-PKC pode alterar váriasfunções reconhecidamente alteradas no DM.
Vários mecanismos bioquímicos têm sido propos-tos para explicar anormalidades estruturais e funcionaisassociadas com a exposição prolongada dos tecidos vas-culares à hiperglicemia, tais como: 1) Formação de pro-dutos avançados da glicosilação não-enzimática; 2)Aumento da atividade da aldose-redutase, levando aalterações decorrentes do aumento de sorbitol e reduçãode mio-inositol; 3) Alterações de radicais livres e estadode oxidação; e 4) Ativação da PKC via acúmulo hiper-glicemia-induzido de DAG (12). Não há uma hipóteseque unifique estes 4 mecanismos, mas tanto alteraçõesredox causadas pelo aumento do fluxo na via do sorbitol
como o aumento da formação de espécies reativas deoxigênio (ROS) hiperglicemia-induzido podem serresponsáveis por todas as outras alterações bioquímicas.Também o aumento de ROS pode reduzir os níveis deóxido nítrico (NO) e daí ativar a aldose redutase. Oaumento do fluxo pela via dos polióis induzido peloaumento de ROS determina maior conversão de glicosea sorbitol, o que acarreta concomitantemente redução deNADPH e glutationa, o que aumenta o estresse oxidati-vo hiperglicemia-induzido. O sorbitol é convertido a fru-tose, resultando em aumento da relação NADH:NAD+,o que aumentaria a síntese de novo de diacilglicerol, e daíativação da PKC. Por fim, a formação de produtosavançados de glicosilação não enzimática (AGEs),induzida pela hiperglicemia crônica do DM, além decausar dano tecidual direto, também pode aumentar aformação de ROS (13).
Esta revisão tem por objetivo compilar osefeitos da hiperglicemia sobre a via DAG-PKC, a dis-função vascular relacionada a ela, e, finalmente, asnovas perspectivas de tratamento das complicaçõesvasculares do DM baseadas na inibição desta via.
O que é a proteína quinase C, suas características, suas funçõesAdicionar e remover grupos fosfato é um mecanismofisiológico importante na regulação de proteínas intra-celulares, as quais podem ser enzimas, receptores ousegundo-mensageiros. Uma série de respostas celularesmediadas por receptores e vias metabólicas podem serativadas e desativadas por quinases (enzimas que adi-cionam grupos fosfato) ou fosfatases (enzimas queremovem grupos fosfato) intra-celulares. As quinases eas fosfatases, por sua vez, são reguladas por sinais bio-químicos extrínsecos, tais como hormônios e fatoresde crescimento. As quinases celulares são divididasnaquelas que fosforilam proteínas em resíduos tirosina(tirosina-quinases) e aquelas que fosforilam proteínasem resíduos serina e treonina (serina/treonina-qui-nases). A PKC é uma das 3 principais quinases serina-treonina. Ela está envolvida em eventos de transduçãode sinais, respondendo a estímulos específicos hor-monais, neuronais e de fatores de crescimento. Suaação é catalisando a transferência de um grupo fosfatodo ATP (adenosina tri-fosfato) a várias proteínas subs-trato. Da mesma forma, a PKC também sofre fosfori-lações antes de ser ativada, o que ocorre durante suatranslocação do citosol para a membrana da célula. Suaativação e translocação do citosol à membrana plas-mática ocorre em resposta a aumento transitório deDAG ou exposição a agentes exógenos, conhecidoscomo forbol-ésteres (10).

A família PKC inclui 12 isoformas (α, βΙ, βΙΙ, δ, ε,γ, ι, η, λ, µ, θ, ζ), classificadas em convencionais (cPKC,cálcio-dependentes, ativadas pela fosfatidil-serina e peloDAG); original (nPKC, cálcio-independentes, reguladaspelo DAG e fosfatidilserina) e atípicas (aPKC, cálcio-independentes, não requerem DAG para ativação, masfosfatidil-serina para regular sua atividade). As isoformassão produtos de diferentes genes, exceto PKCβI e βII,que são variantes de um mesmo gene. Estas isoformas sãodistribuídas em vários tecidos, demonstrando diferençasde acordo com sua localização. Por exemplo, a PKC-βestá presente nas ilhotas pancreáticas, monócitos, cérebroe tecidos vasculares (retina, rins e coração). Dentro deuma única célula, as isoformas também exibem diferençasem sua distribuição antes e após translocação após ati-vação. Sugere-se que funções de cada isoforma associadasa uma determinada célula podem ser conferidas por dife-renças na localização sub-celular da PKC após translo-cação para proteínas específicas (14).
O DAG celular é o principal ativador fisiológicoda PKC; deriva de múltiplas fontes, incluindo ahidrólise de fosfatidil-inositídeos, metabolismo da fos-fatidil-colina por fosfolipases ou síntese de novo. Tam-bém é possível que a ativação da via DAG-PKC induzi-da pela hiperglicemia seja resultado de glico-oxidação,já que existem evidências de que alguns oxidantes,como H2O2, podem ativar a PKC (13) (figura 1).Aumento do DAG e decorrente ativação da PKC têm
sido descritos em tecidos de animais e humanos dia-béticos, tais como retina, aorta, coração e glomérulo,mesmo quando o estímulo de hiperglicemia é agudo(15-17), assim como em células vasculares expostas aaltas concentrações de glicose no meio de cultura (18).
A hiperglicemia, elevando DAG de diferentesformas, preferencialmente ativa uma ou mais isoenzi-mas PKC em diferentes tecidos, por exemplo, PKC-βII no coração e aorta (15), PKC-α PKC-βII e PKC-ε na retina (16), PKC-α, βI e δ nas células glomeru-lares (19). É interessante observar que a ativação daPKC-βII é a resposta dominante nos tecidos macrovas-culares, o que inclui tecido muscular liso e célulasendoteliais da retina, enquanto que a PKC-βI é pre-dominantemente superexpressa nas células glomeru-lares em resposta à hiperglicemia (12).
Mecanismos pelos quais a ativação da viaDAG-PKC estaria envolvida na gênese dascomplicações vasculares do diabetesA ativação da PKC regula uma série de funções vascu-lares, tais como permeabilidade vascular (20), contrati-lidade (21), proliferação celular (22), síntese de matrizextracelular (23) e transdução de sinais para váriascitocinas e hormônios (24) (figura 2). Como as patolo-gias vasculares do DM caracterizam-se pelas alteraçõesdescritas, tem sido especulado um papel patogenéticoda ativação da PKC sobre estas vasculopatias.
Proteína Quinase C e Vasculopatia DiabéticaSchaan
656 Arq Bras Endocrinol Metab vol 47 nº 6 Dezembro 2003
Figura 1. A liberação intracelular de diacilglicerol (DAG) é oprimeiro passo que leva à ativação e translocação da PKC.O DAG celular, que é o ativador fisiológico da PKC, derivade múltiplas fontes: hidrólise de fosfatidilinositídeos, meta-bolismo da fosfatidilcolina pela fosfolipase C ou D ou sín-tese de novo (principal via responsável pela formação deDAG hiperglicemia-induzida no diabetes).
Figura 2. Representação esquemática das anormalidadesestruturais e funcionais decorrentes da ativação da viaDAG-PKC hiperglicemia-induzida. Algumas destas anorma-lidades podem ser melhoradas pelo tratamento com vita-mina E (ativador da DAG-quinase; anti-oxidante), inibidoresespecíficos da PKC (LY333531) ou inibidores da glicação deproteínas (aminoguanidina). DAG: diacilglicerol; PKC: proteína quinase C; TGF- β: fatortransformador do crescimento-beta; MEC: matriz extra-celular; PAI1: inibidor do ativador do plasminogênio 1;ICAMs: moléculas de adesão intra-celular; VEGF: fator decrescimento vascular derivado do endotélio; ANP: pep-tídeo natriurético atrial; NF kB: fator nuclear kB; ET-1:endotelina 1; NO: óxido nítrico.

Espessamento da membrana basal capilar eexpansão da matriz extracelularSão anormalidades estruturais precoces que ocorremem vários tecidos, inclusive vasculares no DM (25).Como a membrana basal pode afetar inúmeras fun-ções, como suporte estrutural, permeabilidade vascu-lar, adesão celular, proliferação, diferenciação e expres-são de genes, alterações de seus componentes podemcausar disfunção celular (12).
A hiperglicemia do DM aumenta a expressão demRNA de colágeno tipo IV, fibronectina e lamininanos grandes vasos (26) e de colágeno tipo VI nomiocárdio (27). Estas alterações podem levar ao enri-jecimento do músculo cardíaco, contribuindo para amiocardiopatia diabética.
A expansão de matriz mesangial glomerular e oespessamento da membrana basal dos capilares glomeru-lares são manifestações precoces clássicas da nefropatiadiabética. Histologicamente, observa-se aumento do co-lágeno tipo IV e VI e fibronectina e redução de proteo-glicanos no mesângio. A célula mesangial glomerular é aresponsável pela maior expressão da matriz extracelular.Estudos in vitro utilizando células mesangiais cultivadasem meios com alto teor de glicose demonstraram maiorexpressão de mRNA e síntese protéica de colágeno tipoIV e fibronectina (18), alterações que são mediadas pelaativação da PKC (28).
O aumento de expressão de TGF-β1 citocina,que estimula a produção de componentes da matrizextra-celular, tem sido implicado no desenvolvimentoda expansão mesangial e espessamento da membranabasal no DM (29). Considerando que a ativação daPKC pode aumentar a expressão de TGF-β1 e a pro-dução de matriz extra-celular, são de interesse osrelatos de que os inibidores da PKC podem tambémprevenir aumentos de TGF-β1 e matriz extra-celularinduzidos pela hiperglicemia em células mesangiais eglomérulos (30). A glicose entra para o interior damaioria das células, inclusive as mesangiais, por difusãofacilitada. Este processo é mediado por proteínas inte-grais de membrana específicas, os transportadores deglicose (GLUTs) (31). Estudos com células mesangiaisin vitro demonstraram maior expressão de GLUT1 emmeios com alto teor de glicose, levando à maior ativi-dade da PKC e conseqüente estímulo à síntese de pro-teínas da matriz extracelular (32). Nosso grupodemonstrou recentemente, no modelo de DM porSTZ em ratos, maior expressão de GLUT1 em córtexrenal, associado à maior excreção urinária de TGF-β1 emicroalbuminúria, o que sugere que, in vivo, o TGF-β1 também age, assim como in vitro foi demonstrado,aumentando a expressão de GLUT1, o que amplificaria
os efeitos deletérios teciduais da hiperglicemia (33).Subseqüentemente, estudamos estas variáveis no mo-delo animal de hipertensão geneticamente determinada(ratos SHR), com diabetes por STZ e os resultadosforam semelhantes, além de observar um efeito aditivoda hipertensão sobre a hiperglicemia em aumentar aexcreção urinária de TGF-β1 (34).
Fluxo sangüíneo vascularAnormalidades de fluxo sangüíneo e contratilidadevasculares têm sido relatadas em animais e pacientesdiabéticos, em retina, rins, artérias periféricas emicrovasculatura de nervos periféricos.
Redução do fluxo retiniano no DM foi demons-trada por Bursell e cols., em 1996 (35), e Small e cols.,em 1987 (36). Além disto, os ésteres do forbol, quesão agonistas da PKC, reduzem o fluxo sangüíneoretiniano, enquanto que os inibidores da PKC norma-lizam este fluxo, sugerindo que a ativação da PKC teriaum papel regulador sobre o fluxo sangüíneo retiniano,possivelmente por ação vasoconstrictora ou aumentan-do a expressão de endotelina-1 (16,37).
No rim, aumento da taxa de filtração glomerularé uma característica da fase inicial da nefropatia diabéti-ca, o que pode relacionar-se à redução da resistênciaarteriolar induzida pela hiperglicemia e poderia se deverà maior produção de prostaglandinas (38), efeito medi-ado pela ativação da PKC (39). Não se descarta que aPKC tenha papel regulador sobre a hemodinâmica renalatravés de interferência sobre a produção de NO (40).
A neuropatia diabética caracteriza-se pordiminuição da velocidade de condução nervosa emenor regeneração neuronal, em cuja gênese têm sidoimplicados efeitos metabólicos da hiperglicemia associ-ados à redução de fluxo sangüíneo ao nervo (41).Como o aumento da atividade da PKC nos vasa ner-vorum leva à maior resposta contrátil e redução davasodilatação, foram realizados estudos utilizandoinibidores da PKC, os quais demonstraram efeito po-sitivo sobre a condução nervosa, o que se atribuiu àmelhora do fluxo sangüíneo aos nervos (42,43).
Contratilidade do músculo liso vascularHá uma maior resposta contrátil do músculo lisovascular no DM, o que é atribuído parcialmente àativação da PKC pela hiperglicemia. A normalizaçãoda glicemia restaura a resposta contrátil do músculoliso vascular. Um estudo demonstrou que, em con-traste com o aumento de contratilidade do músculoliso vascular em resposta a estímulos pressóricos, oestímulo da hiperglicemia acarreta alterações maissustentadas (44).
Proteína Quinase C e Vasculopatia DiabéticaSchaan
657Arq Bras Endocrinol Metab vol 47 nº 6 Dezembro 2003
Permeabilidade vascular e neovascularizaçãoUma característica precoce da disfunção vascular doDM, especialmente em vasos da retina e rim, é a maiorpermeabilidade vascular a macromoléculas circulantes(25). A ativação da PKC aumenta a permeabilidade àalbumina e outras moléculas diretamente através deefeito sobre as barreiras formadas por células endo-teliais, provavelmente por levar à fosforilação de pro-teínas cito-esqueléticas que formam as junções in-tracelulares (45).
A ativação da PKC pode regular a permeabili-dade vascular e também a neovascularização viaexpressão de fatores de crescimento, como o VEGF(vascular permeability factor), implicado nos processosde neovascularização na retinopatia diabética (46) eem células musculares lisas da aorta (47).
Ativação e disfunção endotelialO endotélio normal tem papel chave na regulação dotônus vascular pela produção e liberação de fatores derelaxamento e contração, de forma que a disfunçãoendotelial é um marcador precoce de disfunção vascu-lar. A ativação da PKC diminui a síntese de NO, en-quanto que a inibição da PKC aumenta sua liberação.Estudo recente em humanos submetidos a um clampehiperglicêmico por 6 horas demonstrou que o fluxosangüíneo do antebraço em resposta à metacolina estáreduzido na hiperglicemia, o que é corrigido após otratamento oral com inibidores da PKC-β. Estes resul-tados sugerem que a hiperglicemia prejudica a funçãoendotelial, em parte via ativação da PKC-β (48).
A endotelina-1 (ET-1), potente vasoconstric-tor, também é sintetizada pelo endotélio. Seu aumen-to tem sido associado a menor fluxo sangüíneo na reti-na e nervos periféricos de modelos animais de DM.Estes aumentos têm sido atribuídos à aumento daatividade da PKC, isoformas β e δ, mediada pela hiper-glicemia (37).
A exposição de plaquetas humanas a altas con-centrações de glicose in vitro ou in vivo diminui suacapacidade de causar vasodilatação endotélio-depen-dente. Este fenômeno é mediado por aumento deníveis de DAG e estímulo da PKC e atividade da fos-folipase A2, conforme resultados obtidos in vitrorecentemente por Oskarsson e cols. (49).
Adesão de monócitosA adesão de monócitos às células endoteliais é umevento precoce importante na formação de ateroma, eque está aumentado no DM. Foi demonstrado aumen-to da atividade da PKC em monócitos de indivíduoscom DM, a qual foi reduzida em 40% com a normali-
zação da glicemia. Como a maior atividade da PKCaumenta a adesão dos monócitos à parede vascular,aumenta a ligação do fibrinogênio e promove suadiferenciação a macrófagos, espera-se, nesta circuns-tância, progressão dos ateromas (50).
Proliferação de células musculares lisasCélulas musculares lisas cultivadas em meios com altasconcentrações de glicose apresentam maior atividadeda PKC e atividades proliferativas, comparativamente acélulas cultivadas em meios com concentrações baixasde glicose. Tanto inibidores da aldose-redutase, comoda PKC-β, impedem estas alterações (51).
MiocardiopatiaUtilizando camundongos transgênicos que superex-pressam especificamente a isoforma βII da PKC nomiocárdio, Wakasaki e cols., em 1997 (52), demons-traram que estes animais apresentavam, comparativa-mente à espécie nativa, hipertrofia ventricular esquer-da, necrose de cardiomiócitos, fibrose multifocal eredução da função ventricular esquerda.
O estudo de corações humanos que apresen-tavam miocardiopatia dilatada ou isquêmica por outrosautores demonstrou aumento de 40% na expressão dePKC-β1 e β2 de membranas celulares (53).
Atividade da Na-K-ATPaseA Na-K-ATPase é um componente da bomba de sódioque está envolvida na manutenção de funções celu-lares, tais como integridade, contratilidade, crescimen-to e diferenciação. Os mecanismos pelos quais a hiper-glicemia altera a atividade da Na-K-ATPase têm sidodiscutidos. A PKC pode regular os níveis de Na-K-ATPase em alguns tecidos pela fosforilação/defosfori-lação de sua sub-unidade alfa e agir estimulando ouinibindo sua atividade, dependendo do sistema estuda-do (54).
Possibilidades terapêuticas
Inibidores da PKC-βA inibição de todas as isoformas da PKC através deinibidores inespecíficos provou-se impraticável pela suatoxicidade. Como os estudos em retina, rins e tecidosvasculares de diabéticos demonstraram que a isoformapreferentemente ativada é a β, um inibidor específicodesta isoforma, o LY333551 foi desenvolvido e temsido testado com resultados interessantes.
Estudos in vitro demonstraram que seu usoreduz a atividade da PKCβII, mas não da PKCα,reduzindo o DAG nos tecidos vasculares estudados. O
Proteína Quinase C e Vasculopatia DiabéticaSchaan
658 Arq Bras Endocrinol Metab vol 47 nº 6 Dezembro 2003
mesmo estudo comprovou sua efetividade in vivo,demonstrando melhora da hemodinâmica retiniana erenal em ratos com DM (19). Estes inibidores tambémpreveniram a superexpressão de TGF-β, colágeno α1 efibronectina em glomérulos de ratos diabéticos, even-tos que sabidamente estão envolvidos na gênese danefropatia diabética (55). Ainda no modelo animal deDM, outros autores demonstraram que o LY333551determinou normalização de fluxo sangüíneo neuronale velocidade de condução nervosa (43).
O tratamento de camundongos transgênicosque superexpressam a PKCβII com LY333551 oralresulta em melhora das alterações histológicas e fun-cionais cardíacas descritas neste modelo animal (52).
Por outro lado, o efeito do LY333551 sobre aatividade proliferativa de células musculares lisas emmeios de cultura com alto teor de glicose foi inferioràquele obtido com o uso de epalrestat, inibidor da via daaldose-redutase, mesmo que ambos tenham-se demons-trado efetivos na inibição da PKC isoforma βII (51).
O uso de LY333531 oral (ruboxistaurin mesy-late) em humanos demonstrou que a droga foi bemtolerada em doses de até 64mg/dia, não se associandoa efeitos adversos significativos (56,57). Os resultadosobtidos em 252 pacientes com diabetes e retinopatiade base tratados com o LY333531 ou placebo por 36-48 meses demonstraram menor progressão daretinopatia sem alterações no controle glicêmico nosindivíduos tratados (redução de 32% no risco de pro-gressão) (56). O tratamento de 205 pacientes comneuropatia diabética periférica com 32 e 64mg/dia damesma droga foi efetivo em reduzir os sintomas refe-rentes a esta complicação, os quais são freqüentementeincapacitantes (57). Estudos de fase III estão em anda-mento para indicações de retinopatia e neuropatia dia-béticas com lançamento previsto para 2005/2006.
É importante considerar possíveis efeitosdeletérios a longo prazo com o uso destas drogas, jáque a PKC-β é expressa no cérebro, além de nos teci-dos vasculares (58). No tratamento propriamente ditode indivíduos diabéticos, o uso dos inibidores da PKC-β provavelmente será empregado cronicamente, o quenão tem precedentes nos estudos apresentados.
Vitamina ECom o conhecimento de que o DM acompanha-se deaumento do estresse oxidativo, a vitamina E, um anti-oxidante, tem sido estudada, com interesse adicionalpor inibir a ativação de DAG-PKC em tecidos vascu-lares e células vasculares cultivadas em meios com altoteor de glicose. O mecanismo envolvido neste efeitoprovavelmente decorre de efeito inibidor da vitamina
E sobre a via da PKC através de sua capacidade emaumentar a atividade da DAG-quinase, portanto,aumentando seu metabolismo a ácido fosfatídico elevando à redução do DAG, e conseqüentemente daativação da PKC (59).
Injeções intra-peritoneais de vitamina E pre-veniram aumentos da atividade de DAG e PKC na reti-na (60), aorta, coração (61) e glomérulos renais (62)de ratos diabéticos. Funcionalmente, na retina e rinshá prevenção das alterações hemodinâmicas pelo usoda vitamina E, em paralelo com a inibição da ativaçãoda DAG-PKC. Também o aumento da albuminúria foiprevenido pelo uso de vitamina E nestes animais (63).Portanto, é possível que algum aumento da ativação dePKC no diabetes pode ser resultado de oxidantes emexcesso, que sabidamente ativam a PKC e podem sergerados na hiperglicemia.
Inibidores da HMG-CoA redutaseEvidências de que os inbidores da HMG-CoA redu-tase diminuem a migração de células musculares lisasvasculares in vitro e in vivo levaram a estudos onde foidemonstrado que estes efeitos se dão diretamentesobre a parede vascular por mecanismos via supressãodo aumento do estresse oxidativo induzido pela fos-folipase D e PKC (63). É possível que parte dos efeitosna prevenção da doença arterial coronariana obtidoscom o emprego destas drogas se devam a estes efeitos.
Inibidores da enzima conversoraAos já conhecidos efeitos benéficos dos inibidores daenzima conversora no DM somam-se os resultados deestudo experimental utilizando ramipril, o qual foi efe-tivo em prevenir o aumento da PKC induzido peloDM por estreptozotocina na retina, glomérulos eartéria mesentérica, sugerindo que aqueles efeitosbenéficos possam ser, pelo menos em parte, mediadospela inibição da PKC em vários tecidos (64).
Considerações finaisA hiperglicemia ativa a via da DAG-PKC. Os fatoresiniciantes deste processo são metabólicos, e o principalelemento é a hiperglicemia. O achado de que metabó-litos secundários da glicose, como produtos glicosila-dos e oxidantes, podem também ativar a via DAG-PKC sugerem que esta ativação pode ser o mecanismocomum pelo qual múltiplos co-produtos da glicoseexercem seus efeitos colaterais. Não é surpresa que avia DAG-PKC sirva para este papel, porque é uma viade transdução de sinais que sabidamente regula muitasfunções e ações vasculares. Nos tecidos vasculares, aisoforma PKC-β parece ser o mediador principal de
Proteína Quinase C e Vasculopatia DiabéticaSchaan
659Arq Bras Endocrinol Metab vol 47 nº 6 Dezembro 2003
alterações na proliferação celular, função endotelial,permeabilidade microvascular e formação de colágeno.
A inibição da via DAG-PKC, quer seja atravésdo uso de inibidores da PKC, seletivos para as dife-rentes isoformas, quer seja pelo uso de vitamina E,aumentando a degradação de DAG e outras drogas deuso mais recente, têm, portanto, potencial promissorna prevenção das complicações vasculares do DM, ino-vando no tratamento das complicações do DM inde-pendente do controle glicêmico. Estudos de longaduração em humanos são necessários para reforçar autilidade destas drogas como mais uma ferramenta naterapêutica do DM.
REFERÊNCIAS
1. Newham A, Ryan R. Prevalence of diagnosed diabetesmellitus in general practice in England and Wales, 1994to 1998. Health Stat Quart 2002;14:5-13.
2. Mokdad AH, Ford ES, Bowman BA, Nelson DE, EngelgauMM, Vinicor F, et al. Diabetes trends in the U.S.: 1990-1998. Diabetes Care 2000;23:1278-83.
3. Schaan BD, Harzhein E, Lima NGL, Gus I. Fatores de riscopara doença arterial coronariana em indivíduos comdiferentes graus de tolerância à glicose no Rio Grandedo Sul (RS). Arq Bras Endocrinol Metab2002;46(supl.1):S394.
4. Gray A, Clarke P, Farmer A, Holman R. Implementingintensive control of blood glucose concentration andblood pressure in type 2 diabetes in England: cost analy-sis (UKPDS 63). BMJ 2002;325:860-5.
5. Stamler J, Vaccaro O, Neaton JD, Wentworth D. Dia-betes, other risk factors, and 12-yr cardiovascular mor-tality for men screened in the Multiple Risk Factor Inter-vention Trial. Diabetes Care 1993;16:434-44.
6. Haffner SM, Lehto S, Ronnemma T, Pyorala K, Laakso M.Mortality from coronary heart disease in subjects withtype 2 diabetes and in nondiabetic subjects with andwithout myocardial infarction. N Engl J Med1998;339:229-34.
7. The Diabetes Control and Complications Trial ResearchGroup: The effect of intensive treatment of diabetes onthe development and progression of long-term compli-cations in insulin-dependent diabetes mellitus. N Engl JMed 1993;329:977-86.
8. UK Prospective Diabetes Study (UKPDS) Group. Intensiveblood-glucose control with sulphonylureas or insulincompared with conventional treatment and risk ofcomplications in patients with type 2 diabetes (UKPDS33). Lancet 1998;352:837-53.
9. Nishikawa T, Edelstein D, Brownlee M. The missing link: asingle unifying mechanism for diabetic complications.Kidney Int Suppl 2000;58:S26-S30.
10. Idris I, Gray S, Donnelly. Protein kinase C activation:isozyme-specific effects on metabolism and cardiovascu-lar complications in diabetes. Diabetologia 2001;44:659-73.
11. Kaiser N, Sasson S, Feener EP, Boukobza-Vardi N, Higashi S,Moller DE, et al. Differential regulation of glucose trans-port and transporters by glucose in vascular endothelialand smooth muscle cells. Diabetes 1993;42:80-9.
12. Koya D, King GL. Protein kinase C activation and thedevelopment of diabetic complications. Diabetes1998;47:859-66.
13. Brownlee M. Biochemistry and molecular cell biology ofdiabetic complications. Nature 2001;414:813-20.
14. Newton AC. Protein kinase C: structure, function andregulation: minireview. J Biol Chem 1995;270:28495-8.
15. Inoguchi T, Battan R, Handler E, Sportsman JR, Hezth W,King GL. Preferential elevation of protein kinase C iso-form βII and diacylglycerol levels in the aorta and heartof diabetic rats: differential reversibility to glycemic con-trol by islet cell transplantation. Proc Natl Acad Sci USA1992;89:11059-63.
16. Shiba T, Inoguchi T, Sportsman JR, Heath W, Bursell S,King GL. Correlation of diacylglycerol and protein kinaseC activity in rat retina to retinal circulation. Am J Physiol1993;265:E783-E793.
17. Craven PA, DeRubertis FR. Protein kinase C is activatedin glomeruli from streptozotocin diabetic rats. J ClinInvest 1989;83:1667-75.
18. Ayo SH, Radnik R, Garoni JA, Troyer DA, Kreisberg JI. Highglucose increases diacylglycerol mass and activatesprotein kinase C in mesangial cell cultures. Am J Physiol1991;261:F571-F577.
19. Ishii H, Jirousek MR, Koya D, Takagi C, Xia P, Clermont A,et al. Amelioration of vascular dysfunctions in diabeticrats by an oral PKCβ inhibitor. Science 1996;272:728-31.
20. Lynch JJ, Ferro TJ, Blumenstock FA, Brockenauer AM,Malik AM. Increased endothelial albumin permeabilitymediated by protein kinase C activation. J Clin Invest1990;85:1991-8.
21. Rasmussen H, Forder J, Kojuma I, Scriabine A. TPA-induced contraction of isolated rabbit vascular smoothmuscle. Biochem Biophys Res Commun 1984;122:776-84.
22. Kariya K, Kawahara Y, Tsuda T, Fukuzaki H, Takai Y. Possi-ble involvement of protein kinase C in platelet-derivedgrowth factor-stimulated DNA synthesis in vascularsmooth muscle cells. Atherosclerosis 1987;63:251-5.
23. Huhtala P, Chow LT, Tryggvason K. Structure of thehuman type IV collagen gene. J Biol Chem1990;265:11077-82.
24. Hachiya HL, Takayama S, White MF, King GL. Regulationof insulin receptor internalization in vascular endothelialcells by insulin and phorbol esters. J Biol Chem1987;262:6417-24.
25. Williamson JR, Kilo C. Extracellular matrix changes in dia-betes mellitus. In: Scarpelli DG, Migahi G, editors. Com-parative pathobiology of major age-related diseases.New York: Liss; 1984.p.269-88.
26. Cagliero E, Roth T, Roy S, Maiello M, Lorenzi M. Expressionof genes related to extracellular matrix in humanendothelial cells. J Biol Chem 1991;266:14244-250.
27. Spiro MJ, Crowley TJ. Increased rat myocardial type VIcollagen in diabetes mellitus and hypertension. Dia-betologia 1993;36:93-8.
Proteína Quinase C e Vasculopatia DiabéticaSchaan
660 Arq Bras Endocrinol Metab vol 47 nº 6 Dezembro 2003

28. Studer RK, Craven PA, DeRubertis F. Role for proteinkinase C in the mediation of increased fibronectin accu-mulation by mesangial cells grown in high-glucosemedium. Diabetes 1993;42:118-26.
29. Bertoluci MC, Schmid H, Lachat JJ, Coimbra TM. Trans-forming growth factor-beta in the development of ratdiabetic nephropathy. Nephron 1996;74:189-96.
30. Murphy M, Godson C, Cannon S, Kato S, Mackenzie HS,Martin F, et al. Suppression subtractive hybridizationidentifies high glucose levels as a stimulus for expressionof connective tissue growth factor and other genes inhuman mesangial cells. J Biol Chem 1999;274:5830-4.
31. Gould GW, Holman GD. The glucose transporter family:structure, function and tissue-specific expression.Biochem J 1993;295:329-41.
32. Henry DN, Busik JV, Brosius F, Heilig CW. Glucose trans-porters control gene expression of aldose reductase,PKCα and GLUT1 in mesangial cells in vitro. Am J Physiol1999;46:F97-F104.
33. Schaan B, Bertoluci M, Lacchini S, Machado U, IrigoyenMC, Schmid H. Increased renal GLUT1 abundance,albuminuria and urinary TGF-β1 in STZ-induced diabeticrats: Implications for the development of diabeticnephropathy (DN). Horm Metab Res 2001;33:1-6.
34. Schaan B, Oliveira F, Lima NG, Passaglia J, Hermes E,Sauer F, et al. Efeito da hipertensão arterial (HAS) sobreo TGF-β1 urinário na nefropatia diabética experimental(NDE). Arq Bras Endocrinol Metab 2002;46(supl.1):S370.
35. Bursell SE, Clermont AC, Kinsley BT, Simonson DC, AielloLM, Wolpert HA. Retinal blood flow changes in patientswith insulin-dependent diabetes mellitus and no diabet-ic retinopathy. Invest Ophtalmol Vis Sci 1996;37:886-97.
36. Small KW, Stefansson E, Hatcehll D. Retinal blood flow innormal and diabetic dogs. Invest Ophthalmol Vis Sci1987;28:672-5.
37. Park JY, Takahara N, Gabriele A, Chou E, Naruse K, Suzu-ma K, et al. Induction of endothelin-1 expression by glu-cose: an effect of protein kinase C activation. Diabetes2000;49:1239-48.
38. Craven PA, Caines MA, DeRubertis FR. Sequential alter-ations in glomerular prostaglandin and thromboxanesynthesis in diabetic rats: relationship to the hyperfiltra-tion of early diabetes. Metabolism 1987;36:95-103.
39. Lin L-L, Wartmann M, Lin AY, Knopf JL, Seth A, Davis RJ.cPLA2 is phosphorylated and activated by MAP kinase.Cell 1993;72:269-78.
40. Sharma K, Danoff TM, DePiero A, Zyiadeh FN. Enhancedexpression of inducible nitric oxide synthase in murinemacrophages and glomerular mesangial cells by ele-vated glucose levels: possible mediation via proteinkinase C. Biochem Biophys Res Commun 1995;207:80-8.
41. Feldman E, Stevens MJ, Greene DA. Pathogenesis ofdiabetic neuropathy. Clin Neurosci 1997;4:365-70.
42. Cameron NE, Cotter MA, Jack AM, Basso MD, HohmanTC. Protein kinase C effects on nerve function, perfusion,Na(+), K(+)-ATPase activity and glutathione content indiabetic rats. Diabetologia 1999;42:1120-30.
43. Nakamura J, Kato K, Hamada Y, Nakayama M, ChayaS, Nakashima E, et al. A protein kinase C-beta-selectiveinhibitor ameliorates neural dysfunction in streptozo-tocin-induced diabetic rats. Diabetes 1999;48:2090-5.
44. Williams B. Glucose-induced vascular smooth muscledysfunction: the role of protein kinase C. J Hyperten1995;13:477-86.
45. Stasek JE Jr, Patterson CE, Garcia JG. Protein kinase Cphosphorylates caldesmon 77 and vimentin andenhances albumin permeability across cultured bovinepulmonary artery endothelial cell monolayers. J CellPhysiol 1992;153:62-75.
46. Aiello LP, Avery RL, Arrigg PG, Keyt BA, Jampel HD, ShahST, et al. Vascular endothelial growth factor in ocularfluid in patients with diabetic retinopathy and other reti-nal disorders. N Engl J Med 1994;331:1480-7.
47. Xia P, Aiello LP, Ishii H, Jiang ZY, Park DJ, Robinson GS, etal. Characterization of vascular endothelial growth fac-tor’s effect on the activation of protein kinase C, its iso-forms, and endothelial growth. J Clin Invest1996;98:2018-26.
48. Beckman JA, Goldfinc AB, Gordon MB, Garrett LA,Creager MA. Inhibition of protein kinase Cβ preventsimpaired endothelium-dependent. Circ Res2002;90:107-11.
49. Oskarsson HJ, Hofmeyer TG, Coppey L, Yorek MA. Effectof protein kinase C and phospholipase A2 inhibitors onthe impaired ability of human diabetic platelets tocause vasodilation. Br J Pharmacol 1999;127:903-8.
50. Ceolotto G, Gallo A, Miola M, Sartori M, Trevisan R, DelPrato S, et al. Protein kinase C activity is acutely regulat-ed by plasma glucose concentration in human mono-cytes in vivo. Diabetes 1999;48:1316-22.
51. Nakamura J, Kasuya Y, Hamada Y, Nakashima E, NaruseK, Yasuda Y, et al. Glucose-induced hyperproliferationof cultured rat aortic smooth muscle cells through poly-ol pathway hyperactivity. Diabetologia 2001;44:480-7.
52. Wakasaki H, Koya D, Schoen FJ, Jirousek MR, Ways DK,Hoit BD, et al. Targeted overexpression of protein kinaseC β2 isoform in myocardium causes cardiomyopathy.Proc Natl Acad Sci USA 1997;94:9320-35.
53. Bowling N, Walsh RA, Song G, Estridge T, Sandusky GE,Fouts RL, et al. Increase protein kinase C ativity andexpression of Ca2+-sensitive isoforms in the failing humanheart. Circulation 1999;99:384-91.
54. Greene DA, Lattimer SA, Sima AA. Sorbitol, phospho-inositides, and sodium-potassium-ATPase in the patho-genesis of diabetic complications. N Engl J Med1987;316:599-606.
55. Koya D, Jirousek MR, Lin YW, Ishii H, Kuboki K, King GL.Characteristics of protein kinase C β isoform activationon the gene expression of transforming growth factor β,extracellular matrix components and prostanoids in theglomeruli of diabetic rats. J Clin Invest 1997;100:115-26.
56. Milton RC, Aiello LP, Davies MD, Sheetz MJ, Arora V, Vig-nati L, and the PKC-DRS Study Group. Initial results of theprotein kinase C β inhibitor diabetic retinopathy study(PKC-DRS). Diabetes 2003;52:A127.
57. Bastyr III EJ, Price KL, Skljarevski V, Lledo A, Vignati L.Ruboxistaurin (RBX) mesylate treatment in patients withdiabetic peripheral neuropathy (DPN) improves clinicalglobal impression (CGI) and correlates with change inpatient symptoms and signs. Diabetes 2003;52:A191.
Proteína Quinase C e Vasculopatia DiabéticaSchaan
661Arq Bras Endocrinol Metab vol 47 nº 6 Dezembro 2003
58. Gutterman DD. Vascular dysfunction in hyperglycemia:Is protein kinase C the culprit? Circ Res 2002;90:5-7.
59. Lee IK, Koya D, Ishii H, Kanoh H, King GL. D-alpha-toco-pherol prevents the hyperglycemia induced activationof diacylglycerol(DAG)-protein kinase C pathway in vas-cular smooth muscle cell by an increase of DAG kinaseacticity. Diabetes Res Clin Pract 1999;45:183-90.
60. Kunisaki M, Bursell SE, Clermont AC, Ishii H, Ballas LM,Jirousek MR, et al. Vitamin E prevents diabetes-inducedabnormal retinal blood flow via the diacylglycerol-pro-tein kinase C pathway. Am J Physiol 1995;269:E239-E246.
61. Kunisaki M, Fumio U, Nawata H, King GL. Vitamin E nor-malises diacylglycerol-protein kinase C activationinduced by hyperglycemia in rat vascular tissues. Dia-betes 1996;45/3:S117-S119.
62. Koya D, Lee IK, Ishii H, Kanoh H, King GL. Prevention ofglomerular dysfunction in diabetes by treatment with d-alpha-tocopherol. J Am Soc Nephrol 1997;8:426-35.
63. Yasunari K, Maeda K, Minami M, Yoshikawa J. HMG-CoAreductase inhibitors prevent migration of human coro-
nary smooth muscle cells through suppression ofincrease in oxidative stress. Arterioscler Thromb Vasc Biol2001;21:937-42.
64. Osicka TM, Yu Y, Lee V, Panagiotopoulos S, Kemp BE,Jerums G. Aminoguanidine and ramipril prevents dia-betes-induced increases in protein kinase C activity inglomeruli, retina and mesentery artery. Clin Sci (Lond)2001;100:249-57.
Endereço para correspondência:
Beatriz D. SchaanInstituto de Cardiologia do Rio Grande do Sul - Unidade de PesquisaAv. Princesa Isabel, 37090620-001 Porto Alegre, RSFax: (051) 3230-3600 ramal 3877/3927e.mail: [email protected]
Proteína Quinase C e Vasculopatia DiabéticaSchaan
662 Arq Bras Endocrinol Metab vol 47 nº 6 Dezembro 2003

6 0 06 0 06 0 06 0 06 0 0
Zielinsky e colsPulsatilidade venosa pulmonar em fetos de mães diabéticas
Arq Bras Cardiol2003; 81: 600-3.
Instituto de Cardiologia do Rio Grande do Sul - Fundação Universitária de CardiologiaCorrespondência: Paulo Zielinsky - Unidade de Cardiologia Fetal do IC/FUCAv. Princesa Isabel, 395 - Cep 90620-001 - Porto Alegre, RSE-mail: [email protected]/[email protected] para publicação em 19/11/02Aceito em 29/4/03
Arq Bras Cardiol, volume 81 (nº 6), 600-3, 2003
Paulo Zielinsky, Antonio L. Piccoli Jr, Lucas Teixeira, Eduardo I. Gus, João L. Mânica,Fabíola Satler, Humberto Vaz, Luiz H. Nicoloso, Stelamaris Luchese, Marlui Sheid,
Silvana Marcantonio, Domingos Hatém
Porto Alegre, RS
Pulsatilidade Venosa Pulmonar em Fetos de Mães Diabéticas.Estudo Doppler-Ecocardiográfico Pré-Natal
Artigo Original
O diabetes mellitus insulino-dependente apresenta in-cidência de 0,8% e o diabetes gestacional de 3-5%. Ambassão manifestações do distúrbio no metabolismo dos carboi-dratos na gestação1. Filhos de mães diabéticas apresentamuma incidência de malformações congênitas três ou quatrovezes maior do que a população em geral2. Dessas, até 50%são alterações cardíacas congênitas3. Diabetes materno éum fator de risco para cardiopatia congênita e uma indicaçãoà realização de ecocardiograma fetal4-12.
A hiperglicemia materna e o excesso de glicose oferta-do para o feto estimulam as ilhotas pancreáticas fetais a au-mentar a produção de insulina, levando ao hiperinsulinismo,responsável por complicações fetais. A hipertrofia miocár-dica fetal é a anormalidade, mais freqüentemente, evidencia-da em recém nascidos de mães diabéticas, podendo ser en-contrada em até 35% desses bebês13. O septo interventricu-lar seria particularmente rico em receptores de insulina14, oque justificaria a hipertrofia mais acentuada nesse nível, se-cundária a hiperplasia e hipertrofia de células miocárdicas apartir da síntese aumentada de gorduras e proteínas.
O ecocardiograma fetal com Doppler tem aprimoradonosso entendimento sobre as mudanças cardiocirculatóriasno período pré-natal. Estudos recentes têm evidenciadosignificativas modificações no fluxo cardiovascular dos fe-tos de mães diabéticas, principalmente nas gestações comcontrole glicêmico inadequado15.
Com a introdução da ecocardiografia, muitos estudosclínicos têm demonstrado os padrões normais de fluxo veno-so pulmonar em crianças e adultos através da ecocardiografiatranstorácica e transesofágica16,17. A utilidade do índice depulsatilidade da veia pulmonar, como parâmetro de avaliaçãoda função diastólica durante a vida fetal, ainda não foi relata-da. Assim, testamos a hipótese de que o índice de pulsatilida-de da veia pulmonar nos fetos de mães diabéticas é maior doque em fetos de mães não diabéticas, com base na idéia deque um ventrículo esquerdo menos complacente aumentariaa impedância ao fluxo pré-sistólico na veia pulmonar, corres-pondente à fase de contração atrial e, conseqüentemente,aumentaria o índice de pulsatilidade nesse vaso.
Objetivo - Testar a hipótese de que o índice de pulsa-tilidade da veia pulmonar é maior em fetos de mães diabé-ticas do que em fetos normais.
Métodos - Examinados 24 fetos de mães com diabe-tes prévio ou gestacional (casos) e 25 fetos normais demães sem doença sistêmica (controles). Os fetos foram exa-minados pela ecocardiografia pré-natal com Doppler emapeamento de fluxo em cores. O índice de pulsatilidadeda veia pulmonar foi obtido colocando-se a amostra volu-me do Doppler pulsado sobre a veia pulmonar superiordireita e aplicando-se a fórmula (velocidade sistólica–velocidade pré-sistólica)/velocidade média.
Resultados - Os casos apresentaram idade gestacio-nal média de 30,3 ± 2,7 semanas, e os controles, de 29, ±3,3 semanas, sem diferença significativa entre as idadesgestacionais nos dois grupos (p = 0,14). Os fetos de mãesdiabéticas apresentaram índice de pulsatilidade da veiapulmonar médio de 1,6 ± 1 e os fetos do grupo controle0,86 ± 0,27.
Conclusão - Fetos de mães diabéticas apresentamíndice de pulsatilidade da veia pulmonar (parâmetroDoppler-ecocardiográfico de fácil obtenção, que pode es-tar relacionado com a função diastólica fetal) maior doque os de mães com glicemia normal.
Palavras-chave: ecocardiografia fetal, função diastólicafetal, fluxo venoso pulmonar fetal, dia-betes, índice de pulsatilidade da veiapulmonar
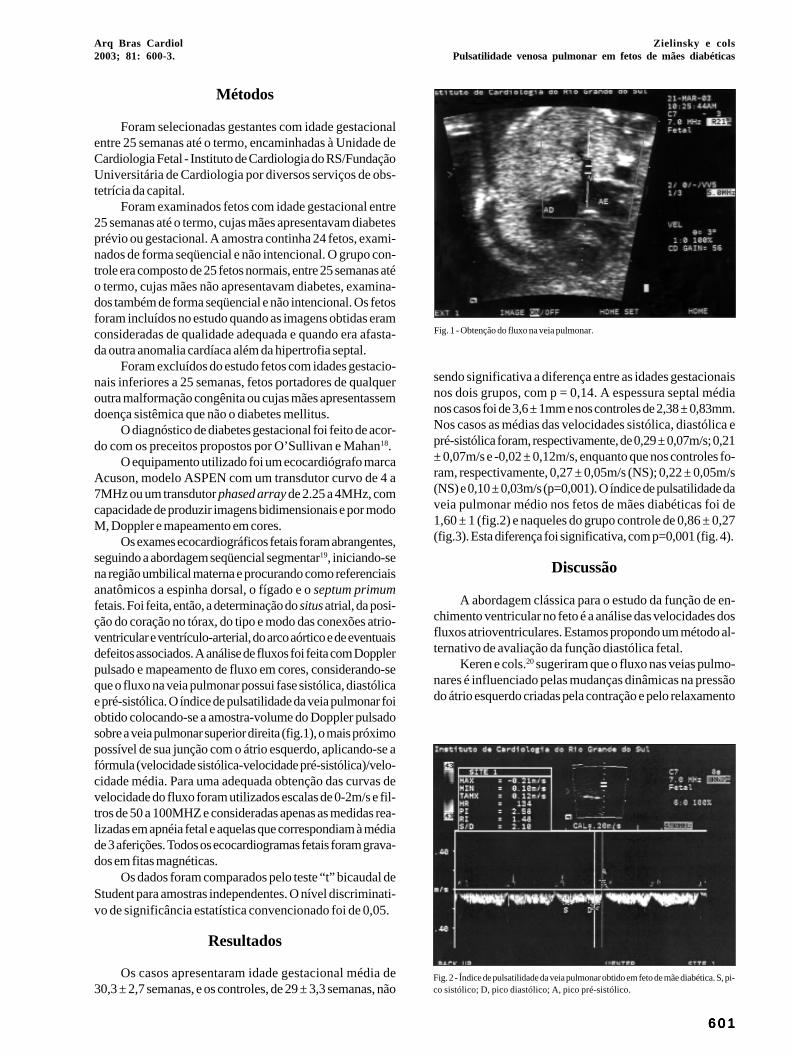
Arq Bras Cardiol2003; 81: 600-3.
Zielinsky e colsPulsatilidade venosa pulmonar em fetos de mães diabéticas
6 0 16 0 16 0 16 0 16 0 1
Métodos
Foram selecionadas gestantes com idade gestacionalentre 25 semanas até o termo, encaminhadas à Unidade deCardiologia Fetal - Instituto de Cardiologia do RS/FundaçãoUniversitária de Cardiologia por diversos serviços de obs-tetrícia da capital.
Foram examinados fetos com idade gestacional entre25 semanas até o termo, cujas mães apresentavam diabetesprévio ou gestacional. A amostra continha 24 fetos, exami-nados de forma seqüencial e não intencional. O grupo con-trole era composto de 25 fetos normais, entre 25 semanas atéo termo, cujas mães não apresentavam diabetes, examina-dos também de forma seqüencial e não intencional. Os fetosforam incluídos no estudo quando as imagens obtidas eramconsideradas de qualidade adequada e quando era afasta-da outra anomalia cardíaca além da hipertrofia septal.
Foram excluídos do estudo fetos com idades gestacio-nais inferiores a 25 semanas, fetos portadores de qualqueroutra malformação congênita ou cujas mães apresentassemdoença sistêmica que não o diabetes mellitus.
O diagnóstico de diabetes gestacional foi feito de acor-do com os preceitos propostos por O’Sullivan e Mahan18.
O equipamento utilizado foi um ecocardiógrafo marcaAcuson, modelo ASPEN com um transdutor curvo de 4 a7MHz ou um transdutor phased array de 2.25 a 4MHz, comcapacidade de produzir imagens bidimensionais e por modoM, Doppler e mapeamento em cores.
Os exames ecocardiográficos fetais foram abrangentes,seguindo a abordagem seqüencial segmentar19, iniciando-sena região umbilical materna e procurando como referenciaisanatômicos a espinha dorsal, o fígado e o septum primumfetais. Foi feita, então, a determinação do situs atrial, da posi-ção do coração no tórax, do tipo e modo das conexões atrio-ventricular e ventrículo-arterial, do arco aórtico e de eventuaisdefeitos associados. A análise de fluxos foi feita com Dopplerpulsado e mapeamento de fluxo em cores, considerando-seque o fluxo na veia pulmonar possui fase sistólica, diastólicae pré-sistólica. O índice de pulsatilidade da veia pulmonar foiobtido colocando-se a amostra-volume do Doppler pulsadosobre a veia pulmonar superior direita (fig.1), o mais próximopossível de sua junção com o átrio esquerdo, aplicando-se afórmula (velocidade sistólica-velocidade pré-sistólica)/velo-cidade média. Para uma adequada obtenção das curvas develocidade do fluxo foram utilizados escalas de 0-2m/s e fil-tros de 50 a 100MHZ e consideradas apenas as medidas rea-lizadas em apnéia fetal e aquelas que correspondiam à médiade 3 aferições. Todos os ecocardiogramas fetais foram grava-dos em fitas magnéticas.
Os dados foram comparados pelo teste “t” bicaudal deStudent para amostras independentes. O nível discriminati-vo de significância estatística convencionado foi de 0,05.
Resultados
Os casos apresentaram idade gestacional média de30,3 ± 2,7 semanas, e os controles, de 29 ± 3,3 semanas, não
sendo significativa a diferença entre as idades gestacionaisnos dois grupos, com p = 0,14. A espessura septal médianos casos foi de 3,6 ± 1mm e nos controles de 2,38 ± 0,83mm.Nos casos as médias das velocidades sistólica, diastólica epré-sistólica foram, respectivamente, de 0,29 ± 0,07m/s; 0,21± 0,07m/s e -0,02 ± 0,12m/s, enquanto que nos controles fo-ram, respectivamente, 0,27 ± 0,05m/s (NS); 0,22 ± 0,05m/s(NS) e 0,10 ± 0,03m/s (p=0,001). O índice de pulsatilidade daveia pulmonar médio nos fetos de mães diabéticas foi de1,60 ± 1 (fig.2) e naqueles do grupo controle de 0,86 ± 0,27(fig.3). Esta diferença foi significativa, com p=0,001 (fig. 4).
Discussão
A abordagem clássica para o estudo da função de en-chimento ventricular no feto é a análise das velocidades dosfluxos atrioventriculares. Estamos propondo um método al-ternativo de avaliação da função diastólica fetal.
Keren e cols.20 sugeriram que o fluxo nas veias pulmo-nares é influenciado pelas mudanças dinâmicas na pressãodo átrio esquerdo criadas pela contração e pelo relaxamento
Fig. 1 - Obtenção do fluxo na veia pulmonar.
Fig. 2 - Índice de pulsatilidade da veia pulmonar obtido em feto de mãe diabética. S, pi-co sistólico; D, pico diastólico; A, pico pré-sistólico.
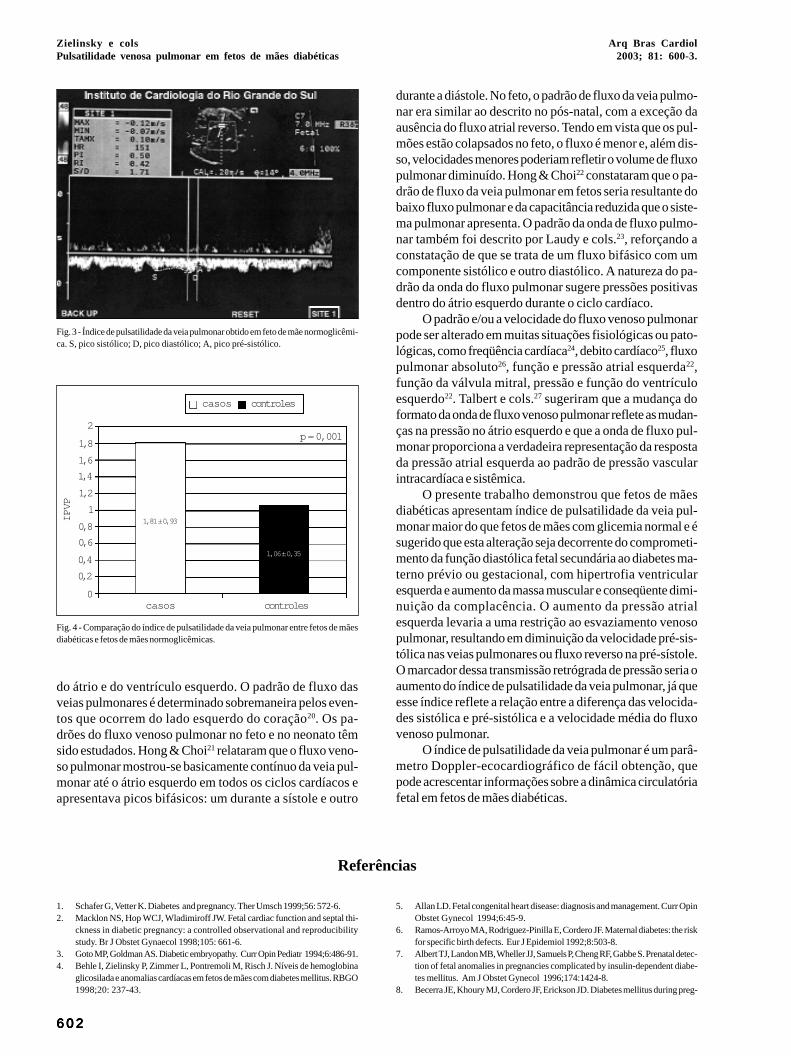
6 0 26 0 26 0 26 0 26 0 2
Zielinsky e colsPulsatilidade venosa pulmonar em fetos de mães diabéticas
Arq Bras Cardiol2003; 81: 600-3.
do átrio e do ventrículo esquerdo. O padrão de fluxo dasveias pulmonares é determinado sobremaneira pelos even-tos que ocorrem do lado esquerdo do coração20. Os pa-drões do fluxo venoso pulmonar no feto e no neonato têmsido estudados. Hong & Choi21 relataram que o fluxo veno-so pulmonar mostrou-se basicamente contínuo da veia pul-monar até o átrio esquerdo em todos os ciclos cardíacos eapresentava picos bifásicos: um durante a sístole e outro
Fig. 3 - Índice de pulsatilidade da veia pulmonar obtido em feto de mãe normoglicêmi-ca. S, pico sistólico; D, pico diastólico; A, pico pré-sistólico.
casos controles
IPVP
casos controles
p = 0,001
1,81 ± 0,93
1,06 ± 0,35
2
1,8
1,6
1,4
1,2
1
0,8
0,6
0,4
0,2
0
durante a diástole. No feto, o padrão de fluxo da veia pulmo-nar era similar ao descrito no pós-natal, com a exceção daausência do fluxo atrial reverso. Tendo em vista que os pul-mões estão colapsados no feto, o fluxo é menor e, além dis-so, velocidades menores poderiam refletir o volume de fluxopulmonar diminuído. Hong & Choi22 constataram que o pa-drão de fluxo da veia pulmonar em fetos seria resultante dobaixo fluxo pulmonar e da capacitância reduzida que o siste-ma pulmonar apresenta. O padrão da onda de fluxo pulmo-nar também foi descrito por Laudy e cols.23, reforçando aconstatação de que se trata de um fluxo bifásico com umcomponente sistólico e outro diastólico. A natureza do pa-drão da onda do fluxo pulmonar sugere pressões positivasdentro do átrio esquerdo durante o ciclo cardíaco.
O padrão e/ou a velocidade do fluxo venoso pulmonarpode ser alterado em muitas situações fisiológicas ou pato-lógicas, como freqüência cardíaca24, debito cardíaco25, fluxopulmonar absoluto26, função e pressão atrial esquerda22,função da válvula mitral, pressão e função do ventrículoesquerdo22. Talbert e cols.27 sugeriram que a mudança doformato da onda de fluxo venoso pulmonar reflete as mudan-ças na pressão no átrio esquerdo e que a onda de fluxo pul-monar proporciona a verdadeira representação da respostada pressão atrial esquerda ao padrão de pressão vascularintracardíaca e sistêmica.
O presente trabalho demonstrou que fetos de mãesdiabéticas apresentam índice de pulsatilidade da veia pul-monar maior do que fetos de mães com glicemia normal e ésugerido que esta alteração seja decorrente do comprometi-mento da função diastólica fetal secundária ao diabetes ma-terno prévio ou gestacional, com hipertrofia ventricularesquerda e aumento da massa muscular e conseqüente dimi-nuição da complacência. O aumento da pressão atrialesquerda levaria a uma restrição ao esvaziamento venosopulmonar, resultando em diminuição da velocidade pré-sis-tólica nas veias pulmonares ou fluxo reverso na pré-sístole.O marcador dessa transmissão retrógrada de pressão seria oaumento do índice de pulsatilidade da veia pulmonar, já queesse índice reflete a relação entre a diferença das velocida-des sistólica e pré-sistólica e a velocidade média do fluxovenoso pulmonar.
O índice de pulsatilidade da veia pulmonar é um parâ-metro Doppler-ecocardiográfico de fácil obtenção, quepode acrescentar informações sobre a dinâmica circulatóriafetal em fetos de mães diabéticas.
Fig. 4 - Comparação do índice de pulsatilidade da veia pulmonar entre fetos de mãesdiabéticas e fetos de mães normoglicêmicas.
1. Schafer G, Vetter K. Diabetes and pregnancy. Ther Umsch 1999;56: 572-6.2. Macklon NS, Hop WCJ, Wladimiroff JW. Fetal cardiac function and septal thi-
ckness in diabetic pregnancy: a controlled observational and reproducibilitystudy. Br J Obstet Gynaecol 1998;105: 661-6.
3. Goto MP, Goldman AS. Diabetic embryopathy. Curr Opin Pediatr 1994;6:486-91.4. Behle I, Zielinsky P, Zimmer L, Pontremoli M, Risch J. Níveis de hemoglobina
glicosilada e anomalias cardíacas em fetos de mães com diabetes mellitus. RBGO1998;20: 237-43.
Referências
5. Allan LD. Fetal congenital heart disease: diagnosis and management. Curr OpinObstet Gynecol 1994;6:45-9.
6. Ramos-Arroyo MA, Rodriguez-Pinilla E, Cordero JF. Maternal diabetes: the riskfor specific birth defects. Eur J Epidemiol 1992;8:503-8.
7. Albert TJ, Landon MB, Wheller JJ, Samuels P, Cheng RF, Gabbe S. Prenatal detec-tion of fetal anomalies in pregnancies complicated by insulin-dependent diabe-tes mellitus. Am J Obstet Gynecol 1996;174:1424-8.
8. Becerra JE, Khoury MJ, Cordero JF, Erickson JD. Diabetes mellitus during preg-
Arq Bras Cardiol2003; 81: 600-3.
Zielinsky e colsPulsatilidade venosa pulmonar em fetos de mães diabéticas
6 0 36 0 36 0 36 0 36 0 3
nancy and the risks for specific birth defects: a population-based case-controlstudy. Pediatrics 1990;85:1-9.
9. Gladman G, McCrindle BW, Boutin C, Smallhorn JF. Fetal echocardiographicscreening of diabetic pregnancies for congenital heart disease. Am J Perinatol1997;14:59-62.
10. Shields LE, Gan EA, Murphy HF, Sahn DJ, Moore TR. The prognostic value of he-moglobin A1c in predicting fetal heart disease in diabetic pregnancies. ObstetGynecol 1993;81:954-7.
11. Meyer-Wittkopf M, Simpson JM, Sharland GK. Incidence of congenital heart de-fects in fetuses of diabetic mothers: a retrospective study of 326 cases. UltrasoundObstet Gynecol 1996;8:8-10.
12. Smith RS, Comstock CH, Lorenz RP, Kirk JS, Lee W. Maternal Diabetes Mellitus:which views are essential for fetal echocardiography? Obstet Gynecol1997;90:575-9.
13. Zielinsky P, Costa Mhl, Oliveira LT, Bonow FP, Silva NIT, Hagemann LL.Estudo da história natural da hipertrofia miocárdica e sua associação com hipe-rinsulinismo em filhos de mães diabéticas. Arq Bras Cardiol 1997;69:389-94.
14. Thorsson AV, Hintz RL. Insulin receptors in the newborn: increase in receptor af-finity and number. N Engl J Med 1977;297:908-12.
15. Zielinsky P, Hagemann LL, Daudt LE, Behle I. Pre- and postnatal analysis of fac-tors associated with fetal miocardial hypertrophy in diabetic pregnancies. JMatern Fetal Invest 1992;2:163-7.
16. keren G, Meisner JS, Sherez J, Yellin EL, Laniado S. Iterrelationship of mid-dias-tolic mitral valve motion, pulmonary vemous flow and transmitral flow. Circula-tion 1986;74:36-44.
17. Kuecherer HF, Muhiuddem IA, Kusumoto FM, LEE E, Cahalan MK, Shiller NB.
Estimation of mean left atrial pressure from trans-esophageal pulsed Dopplerechocardiography of pulmonary venous flow. Circulation 1990;82:1127-39.
18. O’ Sullivan JB, Mahan CM. Criteria for the oral glucose tolerance test in pregnan-cy. Diabetes 1964;13:278-85.
19. Zielinsky P, Haertel JC, Lucchese F. Abordagem seqüencial das cardiopatiascongênitas: um enfoque ecocardiográfico bidimensional. Arq Bras Cardiol1985;45:129-44.
20. Keren G, Sherez J, Megidish R, et al. Pulmonary venous flow pattern – its rela-tionship to cardiac dynamics. Circulation 1985;71:1105-12.
21. Hong Y, Choi J. Doppler study on pulmonary venous flow in human fetus. FetalDiagn Ther 1999;14:86-91.
22. Hong YM, Choi JY. Pulmonary venous flow from fetal to neonatal period. EarlyHum Dev 2000;57:95-103.
23. Laudy JA, Huisman TW, de Ridder MA, Wladimiroff JW. Normal fetal pulmonaryvenous blood flow velocity. Ultrasound Obstet Gynecol 1996;7:299-300.
24. Drihashi K, Goliner PL, Oka Y. Intraoperative assessment of pulmonary veinflow. Echocardiography 1990;7:261-71.
25. Kenny JF, Plappert T, Cartier M, et al. Changes in intracardiac blood flow veloci-ties and right and left ventricular stroke volumes with gestational age in the nor-mal human fetus: a prospective Doppler Echocardiography study. Circulation986;74:1208-16.
26. Wang J, Deng Y, Ying W, Wang X. Pulmonary venous flow evaluated by DopplerEchocardiography. Jpn Heart J 1989;1:55-63.
27. Talbert DG, Johnson P. The pulmonary vein Doppler waveform: feature analysisby comparison of in vivo pressures and flows with those in a computerized fetalphysiological model. Ultrasound Obstet Gynecol 2000;16:457-67.
Escola Naval - RJ Mucio Tavares de Oliveira Jr.
Editor da Seção de Fotografias Artísticas: Cícero Piva de AlbuquerqueCorrespondência: InCor - Av. Dr. Enéas C. Aguiar, 44 - 05403-000 - São Paulo, SP - E-mail: delcicero@incor. usp.br
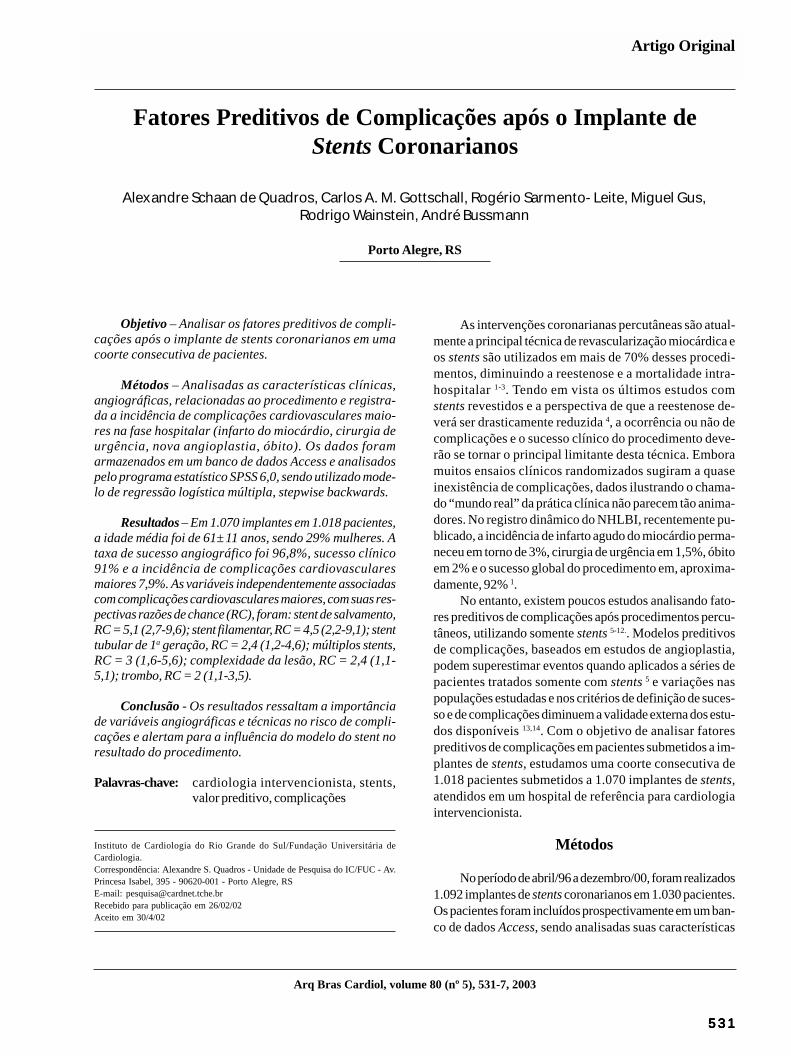
Arq Bras Cardiol2003; 80: 531-7.
Quadros e colsFatores preditivos de complicações após implante de stents
5 3 15 3 15 3 15 3 15 3 1
Instituto de Cardiologia do Rio Grande do Sul/Fundação Universitária deCardiologia.Correspondência: Alexandre S. Quadros - Unidade de Pesquisa do IC/FUC - Av.Princesa Isabel, 395 - 90620-001 - Porto Alegre, RSE-mail: [email protected] para publicação em 26/02/02Aceito em 30/4/02
Arq Bras Cardiol, volume 80 (nº 5), 531-7, 2003
Alexandre Schaan de Quadros, Carlos A. M. Gottschall, Rogério Sarmento-Leite, Miguel Gus,Rodrigo Wainstein, André Bussmann
Porto Alegre, RS
Fatores Preditivos de Complicações após o Implante deStents Coronarianos
Artigo Original
As intervenções coronarianas percutâneas são atual-mente a principal técnica de revascularização miocárdica eos stents são utilizados em mais de 70% desses procedi-mentos, diminuindo a reestenose e a mortalidade intra-hospitalar 1-3. Tendo em vista os últimos estudos comstents revestidos e a perspectiva de que a reestenose de-verá ser drasticamente reduzida 4, a ocorrência ou não decomplicações e o sucesso clínico do procedimento deve-rão se tornar o principal limitante desta técnica. Emboramuitos ensaios clínicos randomizados sugiram a quaseinexistência de complicações, dados ilustrando o chama-do “mundo real” da prática clínica não parecem tão anima-dores. No registro dinâmico do NHLBI, recentemente pu-blicado, a incidência de infarto agudo do miocárdio perma-neceu em torno de 3%, cirurgia de urgência em 1,5%, óbitoem 2% e o sucesso global do procedimento em, aproxima-damente, 92% 1.
No entanto, existem poucos estudos analisando fato-res preditivos de complicações após procedimentos percu-tâneos, utilizando somente stents 5-12.. Modelos preditivosde complicações, baseados em estudos de angioplastia,podem superestimar eventos quando aplicados a séries depacientes tratados somente com stents 5 e variações naspopulações estudadas e nos critérios de definição de suces-so e de complicações diminuem a validade externa dos estu-dos disponíveis 13,14. Com o objetivo de analisar fatorespreditivos de complicações em pacientes submetidos a im-plantes de stents, estudamos uma coorte consecutiva de1.018 pacientes submetidos a 1.070 implantes de stents,atendidos em um hospital de referência para cardiologiaintervencionista.
Métodos
No período de abril/96 a dezembro/00, foram realizados1.092 implantes de stents coronarianos em 1.030 pacientes.Os pacientes foram incluídos prospectivamente em um ban-co de dados Access, sendo analisadas suas características
Objetivo – Analisar os fatores preditivos de compli-cações após o implante de stents coronarianos em umacoorte consecutiva de pacientes.
Métodos – Analisadas as características clínicas,angiográficas, relacionadas ao procedimento e registra-da a incidência de complicações cardiovasculares maio-res na fase hospitalar (infarto do miocárdio, cirurgia deurgência, nova angioplastia, óbito). Os dados foramarmazenados em um banco de dados Access e analisadospelo programa estatístico SPSS 6,0, sendo utilizado mode-lo de regressão logística múltipla, stepwise backwards.
Resultados – Em 1.070 implantes em 1.018 pacientes,a idade média foi de 61±11 anos, sendo 29% mulheres. Ataxa de sucesso angiográfico foi 96,8%, sucesso clínico91% e a incidência de complicações cardiovascularesmaiores 7,9%. As variáveis independentemente associadascom complicações cardiovasculares maiores, com suas res-pectivas razões de chance (RC), foram: stent de salvamento,RC = 5,1 (2,7-9,6); stent filamentar, RC = 4,5 (2,2-9,1); stenttubular de 1a geração, RC = 2,4 (1,2-4,6); múltiplos stents,RC = 3 (1,6-5,6); complexidade da lesão, RC = 2,4 (1,1-5,1); trombo, RC = 2 (1,1-3,5).
Conclusão - Os resultados ressaltam a importânciade variáveis angiográficas e técnicas no risco de compli-cações e alertam para a influência do modelo do stent noresultado do procedimento.
Palavras-chave: cardiologia intervencionista, stents,valor preditivo, complicações

5 3 25 3 25 3 25 3 25 3 2
Quadros e colsFatores preditivos de complicações após implante de stents
Arq Bras Cardiol2003; 80: 531-7.
como surgimento de hematoma > 5cm no sítio de punção,necessidade de exploração cirúrgica ou surgimento depseudoaneurisma.
Realizaram-se as avaliações angiográficas através deangiografia quantitativa off-line ou mensurações compaquímetros manuais. O fluxo antes e após o procedimentofoi classificado de acordo com a classificação de TIMI 17 e otipo de estenose conforme os critérios do American Colle-ge of Cardiology modificados 18. Trombo foi definido comodefeito de enchimento intraluminal, lesão excêntrica quandoa estenose era observada na metade do suposto lúmennormal em pelo menos uma projeção, e oclusão do vaso porsurgimento de estenose total ou subtotal dentro ou nasbordas do stent, com fluxo TIMI 0 ou 1. Foi considerado usode altas pressões quando a pós-dilatação da prótese foirealizada com pressão > 14 ATM.
Quanto à indicação da implantação do stent, procedi-mento eletivo foi considerado quando indicada a coloca-ção do stent antes do procedimento, resultado subótimoquando por dissecções não oclusivas, lesões residuais ourecolhimento elástico e salvamento quando o procedimen-to realizado em vigência de oclusão aguda. Os stents utili-zados foram os seguintes: Tenax (Biotronik, Berlin, Ger-many) = 271 implantes; Multilink (Guidant/AdvancedCardiovascular Systems, Santa Clara, Califórnia) = 260 im-plantes; Freedom (Global Therapeutics Inc, Cook Com-pany, Broomfield CO, USA) = 143 implantes; Vflex (CookGroup Inc, Broomfield, CO, USA) = 105; NIR (MedinolLtd., Tel Aviv, Israel) = 77 implantes; AVE GFX (ArterialVascular Engineering, Inc., Santa Rosa, California) = 73implantes; BX Velocity (Cordis/Johnson & Johnson In-terventional, Warren, New Jersey) = 60 implantes; Iris(Uni-Cath Inc, Saddle Brook, NJ, USA) = 44 implantes;Jostent (Jomed AB, Helsinborg, Sweden) = 11 implantes;Palmaz Schatz (Cordis/Johnson & Johnson Interventio-nal, Warren, New Jersey) = 9 implantes; Angiostent (AngioDynamics, Glens Falls, NY, USA) = 8 implantes; Tensum(Biotronik GmbH, Berlin, Germany) = 5 implantes;Wallstent (Schneider Europe, Lausanne, Switzerland) = 1implantes. Em relação ao tipo de stent, a amostra foi dividi-da em quatro grupos: filamentares (Freedom, angiostent),primeira geração (Palmaz Schatz, Vflex, Iris, Jostent,Walstent, NIR, GFX), segunda geração (Multilink, BXVelocity), revestidos com carboneto de silício (Tenax,Tensum). Com o objetivo de avaliar a influência da curvade aprendizado institucional nos resultados, a amostra foidividida em quartis, analisados comparativamente em rela-ção à presença de complicações.
Variáveis categóricas são apresentadas em percen-tuais e variáveis contínuas conforme sua média e desvio-padrão. Diferenças entre os grupos de variáveis categóricasforam analisadas pelo teste do qui-quadrado e diferençasentre os grupos de variáveis contínuas pelo teste t paraamostras independentes. Foram considerados níveis designificância < 0,05 como estatisticamente significativos.
Analisaram-se comparativamente as variáveis relacio-
clínicas, angiográficas, aspectos relacionados ao implante eevolução intra-hospitalar. Registrou-se a incidência decomplicações cardiovasculares maiores e complicaçõesmenores relacionadas ao procedimento, tendo sido excluí-dos pacientes com reestenose intrastent, em choque car-diogênico ou sem seguimento clínico. A amostra analisadaconsistiu de 1.070 implantes de stents em 1.018 pacientes,sendo que 46 pacientes receberam 2 stents e 3 pacientesreceberam 3 stents.
O procedimento de implantação dos stents foi realiza-do conforme preconizado na literatura 15,16. O uso de altaspressões, tipo e número de stents utilizados, angioplastiacoronariana em outro vaso, uso de outros dispositivos e ini-bidores da glicoproteína IIb/IIIa foram decididos pelos ope-radores. A maioria dos pacientes foi tratada em vigência deinibição plaquetária com ácido acetilsalicílico e tienopiridi-nas; em casos de urgência, estas drogas foram administra-das durante ou logo após o procedimento.
Quanto ao quadro clínico do paciente antes do proce-dimento, angina estável foi definida como a estabilidade dopadrão de desencadeamento da dor nos últimos dois me-ses; angina instável como a piora da intensidade e/ou fre-qüência do padrão de angina nos últimos dois meses antesdo procedimento; angina de recente começo, presença deangina em repouso ou dor torácica com alteração enzimáticasem supradesnivelamento do segmento ST; infarto agudodo miocárdio indicado para o procedimento quando o pa-ciente foi encaminhado para recanalização mecânica da arté-ria relacionada ao infarto em vigência de dor torácica esupradesnivelamento do segmento ST.
Sucesso do procedimento foi definido como implan-te do stent na estenose mais severa pela angiografia, comlesão residual < 30% e sem complicações cardiovascu-lares maiores. Definiu-se complicações cardiovascularesmaiores como a ocorrência de óbito, cirurgia de revascu-larização miocárdica de emergência, infarto agudo domiocárdio ou nova angioplastia de urgência. Infarto agu-do do miocárdio como complicação do procedimento foidefinido como surgimento de ondas Q novas com supra-desnivelamento do segmento ST e/ou elevação da CPKMB acima de 5 vezes o valor normal. Cirurgia de revascula-rização do miocárdio definida como a necessidade derevascularização de urgência em pacientes com isquemiagrave e refratária durante o procedimento, e óbito como aocorrência de óbito hospitalar. Nova angioplastia definidacomo necessidade de novo procedimento de revasculari-zação percutânea no vaso tratado na fase hospitalar ou no1º mês após a intervenção índice quando por trombosesubaguda do stent.
Dissecções não complicadas foram definidas comoaparecimento de defeito de enchimento linear < 10mm logoapós o implante, com ou sem retenção de contraste, massem comprometimento significativo do fluxo coronariano(manutenção de fluxo TIMI 2 ou 3). Perda de ramos definidascomo a oclusão de ramos maiores ou iguais a 2,0mm duranteou logo após o procedimento e complicações vasculares

Arq Bras Cardiol2003; 80: 531-7.
Quadros e colsFatores preditivos de complicações após implante de stents
5 3 35 3 35 3 35 3 35 3 3
nadas às características clínicas, angiográficas e do proce-dimento nos grupos com e sem complicações. As variáveisestatisticamente significativas foram selecionadas parainclusão em um modelo de regressão logística múltipla, step-wise backwards. Foram estabelecidas oito variáveis parainclusão no modelo 19: 1) apresentação clínica, definidacomo presença ou não de infarto agudo do miocárdio; 2)comprimento da lesão, em milímetros; 3) tipo de lesão, defi-nida como lesão complexa (B2/C) ou simples (A/B1); 4) pre-sença de trombo, sim ou não; 5) indicação do procedimento,definida como stent de salvamento ou não; 6) tipo de stent,definido como filamentar, tubular de primeira geração, tubu-lar de última geração ou stent revestido com carboneto desilício; 7) estenose residual, definida em percentuais; 8) usode múltiplos stents, sim ou não. As variáveis estatistica-mente significativas são apresentadas com sua razão dechance, respectivo intervalo de confiança, estatística deWald, coeficente B e nível de significância.
Resultados
A média de idade dos pacientes foi de 60 (±11) anos,sendo que 29% eram do sexo feminino. Os dados referentesà presença de fatores de risco, infarto agudo do miocárdioprévio, procedimentos de revascularização percutâneaprévios, função ventricular, extensão do comprometimentoarterial e apresentação clínica encontram-se na tabela I. Osdados referentes às características angiográficas, tipo delesão tratada e características da lesão estão apresentadasna tabela II e os aspectos relacionados ao procedimento natabela III.
As taxas de sucesso, complicações cardiovascularesmaiores e complicações cardiovasculares menores encon-tram-se na tabela IV. O índice de sucesso angiográfico foi de96,8%, com sucesso clínico de 91%. Insucesso angiográficoocorreu em 3,2% dos casos (34 pacientes), principalmentepor estenoses residuais maiores do que 30% (2,2% dos
Tabela I - Características clínicas dos pacientes
Todos Com Sem Ppacientes CCVM CCVM
Número de procedimentos 1070 84 986Idade, anos 60 ± 11 60 ± 11 60 ± 11 NSSexo feminino,% 29,3 34,5 28,8 NSHipertensão arterial,% 41,6 36,9 42 NSTabagismo,% 26,1 22,6 26,4 NSHistória familiar,% 21,1 16,7 21,5 NSDislipidemia,% 24,7 16,7 25,4 NSDiabetes mellitus,% 26,3 32 25,8 NSCRM prévia,% 10,9 7,2 11,2 NSRevascularizaçãopercutânea prévia,% 13,1 16,7 12,8 NSIAM prévio,% 15 8,3 15,5 NSFração de ejeção,% 65 ± 10 65 ± 10 65 ± 9 NSNúmero de vasoscomprometidos,% NS
Um 51,2 50 51,3Dois 35,3 40,5 34,9Três 13,5 9,5 13,8
Apresentação clínica,% 0,003Angina estável 24,7 26,2 24,6Angina instável 64,4 51,2 65,5IAM 10,9 22,6 9,9
CCVM- complicações cardiovasculares maiores; CRM- cirurgia de re-vascularização do miocárdio; IAM- infarto agudo do miocárdio; NS- nãosignificante.
Tabela II - Características angiográficas
Todos os pacientes Com CCVM Sem CCVM P
Número de procedimentos 1070 84 986Artéria tratada,% NS
Tronco 0,8 0 0,9Descendente anterior 53,1 54,7 53,2Circunflexa 13,4 12,2 13,8Direita 28,6 28,5 28,8Ponte de safena 5,2 6 5,2
Diâmetro de referência, mm 3,36 ± 0,42 3,21 ± 0,47 3,38 ± 0,42 < 0,01Severidade da estenose,% 83,4 ± 10,7 86,7 ± 11,5 84,4 ± 11,2 < 0,01Diâmetro luminal mínimo, mm 0,54 ± 0,37 0,42 ± 0,35 0,55 ± 0,38 < 0,01Comprimento da lesão, mm 9,83 ± 4,78 11,7 ± 5,96 10 ± 5,08 < 0,01Fluxo normal pré-stent (TIMI 3),% 80,8 62,7 81,5 < 0,0001
Tipo de lesão (classificação ACC),% < 0,0001A 6,3 2,4 6,6B1 20,6 8,5 21,6B2 48,6 42,7 49,1C 24,5 46,3 22,6
Trombo,% 18,6 36,6 17,1 < 0,0001Cálcio,% 13,4 15,9 13,2 NSUlceração,% 24,4 29,3 24 NSRamos,% 35,5 34,1 35,6 NSExcentricidade,% 86,7 89 86,6 NS
CCVM- complicações cardiovasculares maiores; NS- não significativo; mm- milímetros; TIMI- Thrombolysis in Myocardial infarction; ACC- American College ofCardiology.

5 3 45 3 45 3 45 3 45 3 4
Quadros e colsFatores preditivos de complicações após implante de stents
Arq Bras Cardiol2003; 80: 531-7.
casos, 24 pacientes), sendo que impossibilidade de cruzar alesão, mal posicionamento e perda da prótese foram menosfreqüentes (1% dos casos, 10 pacientes). As complicaçõescardiovasculares maiores mais freqüente foram a necessi-dade de nova angioplastia (4,8% dos casos, 52 pacientes),principalmente por oclusão aguda (34 pacientes) ou trom-bose subaguda (11 pacientes). Infarto agudo do miocárdioocorreu em 17 pacientes (1,6% dos casos), cirurgia deurgência em 6 pacientes (0,6% dos casos) e óbito em 9 pa-cientes (0,8% dos casos).
Os dados comparativos dos dois grupos em relação àssuas características clínicas encontram-se na tabela I.Observamos diferença estatisticamente significativa quantoà apresentação clínica dos pacientes, principalmente devidoa um maior número de pacientes tratados em vigência deinfarto agudo do miocárdio no grupo que apresentou com-plicações cardiovasculares maiores. As demais variáveisanalisadas não apresentaram diferença estatisticamentesignificativa entre os dois grupos.
Os dados referentes às comparações entre as caracte-rísticas angiográficas dos dois grupos encontram-se natabela II. Foram associadas com a presença de complica-ções cardiovasculares maiores: vasos menores, estenosesmais severas, diâmetros luminais menores, lesões mais lon-gas e fluxo arterial mais comprometido antes do implante. Ogrupo com complicações cardiovasculares maiores tambémapresentou significativamente mais lesões do tipo C e trom-bos angiograficamente evidentes do que os pacientes semcomplicações.
Os dados disponíveis na tabela III mostram que o gru-po com complicações cardiovasculares maiores apresentou
significativamente mais pacientes com oclusões agudaspós angioplastia coronariana antes do implante do stent,enquanto que no grupo sem complicações predominarampacientes encaminhados para implantes eletivos. Quantoao tipo de stents, observamos que os pacientes que apre-sentaram complicações foram, mais freqüentemente, trata-dos com stents filamentares ou tubulares de primeira gera-ção, enquanto que os pacientes sem complicações recebe-ram mais stents tubulares de última geração ou revestidoscom carboneto de silício. Além disso, o grupo com compli-cações cardiovasculares maiores recebeu stents mais lon-gos, balões menores, permaneceu com estenoses residuaismaiores e diâmetro luminal final menor, além de ser maisfreqüente o uso de múltiplos stents.
Realizou-se modelo de regressão logística múltipla
Tabela III - Aspectos relacionados ao procedimento
Todos os pacientes Com CCVM Sem CCVM P
Número de procedimentos 1070 84 986Indicação,% < 0,0001
Eletiva 58,2 36,9 60,1Provisional 34,6 36,9 34,5Salvamento 7,1 26,2 5,5
Tipo de stent,% 0,006Filamentar 14,1 25 13,2Tubulares 1a geração 22,9 29,8 22,3Tubulares 2a geração 36,8 26,2 37,7Carboneto de silício 25,8 19 26,4
Lesão ostial,% 2,1 2,4 2 NSComprimento do stent, mm 16,5 ± 4,81 18 ± 5,64 16,5 ± 4,82 < 0,05Pressão utilizada, ATM 13,1 ± 2,81 13,1 ± 3,22 13,1 ± 2,77 NSDiâmetro do balão, mm 3,37 ± 0,37 3,24 ± 0,41 3,38 ± 0,37 < 0,05Estenose residual,% 1,8± 15 19 ± 35 0,4 ± 11 < 0,0001Diâmetro luminal final, mm 3,3 ± 0,53 2,7 ± 1,1 3,3 ± 0,4 < 0,0001Inibidor de glicoproteína,% 3,2 4,2 3,1 NSMúltiplos stents,% 10,1 23,2 8,9 < 0,0001Curva de aprendizado,% NS
1º quartil 37,2 24,22º quartil 21,7 26,63º quartil 23,5 27,94º quartil 19,3 23,4
Angioplastia associada,% 10,3 15,5 9,8 NS
CCVM- complicações cardiovasculares maiores; NS- não significante; mm- milímetros; ATM- atmosferas.
Tabela IV - Resultados do procedimento
Insucesso 34 (3,2%)Não cruzou a lesão 2 (0,2%)Mal posicionamento 5 (0,5%)Perda da prótese 3 (0,3%)Estenose residual > 30% 24 (2,2%)
Complicações maiores 84 (7,9%)Nova angioplastia no primeiro mês 52 (4,8%)IAM 17 (1,6%)Cirurgia de urgência 6 (0,6%)Óbito 9 (0,8%)
Complicações menores 77 (7,2%)Dissecções 47 (4,4%)Complicações vasculares 8 (0,7%)Perda de ramo 22 (2,1%)
Sucesso angiográfico 96,8%Sucesso clínico 91%
Arq Bras Cardiol2003; 80: 531-7.
Quadros e colsFatores preditivos de complicações após implante de stents
5 3 55 3 55 3 55 3 55 3 5
Tabela V - Análise multivariada das variáveis relacionadas àscomplicações
Razão de Intervalo de Wald P Bchance confiança
Tipo de stentCarboneto de silício 1,2 0,6-2,3 0,3 0,6 0,2Tubular de 1a geração 2,4 1,2-4,6 6,8 0,009 1,9Filamentar 4,5 2,2-9,1 17,8 <0,0001 1,5Lesão complexa 2,4 1,1-5,1 5,3 0,02 0,9Stent de salvamento 5,1 2,7-9,6 25 <0,0001 1,6Múltiplos stents 3 1,6-5,6 12 0,005 1,1Trombo 2 1,1-3,5 5,4 0,02 0,7Constante 103,4 <0,0001 4,3
Schünlen e cols. relataram análise de 2.444 pacientes, iden-tificando diversas características clínicas e angiográficas(principalmente dissecções residuais e não uso de ticlopi-dina) associadas com complicações, mas não o tipo destent 11. Da mesma forma, nos estudos de Moscucci e cols.e Kastrati e cols., o tipo de stent também não foi associadoa complicações 6,20. Por outro lado, dados de alguns estu-dos observacionais demonstram variações de até duasvezes na incidência de complicações com o uso de diferen-tes tipos de stents 21. Nossos dados demonstraram um ris-co de complicações 4,5 vezes (IC: 2,2-9,1) maior com osstents filamentares e 2,4 (IC: 1,2-4,6) vezes maior com osstents tubulares de primeira geração, achados que sãocompatíveis com estudos prévios que demonstram menorforça radial dos stents filamentares e possibilidade demaior prolapso de placa por entre suas hastes, permitindoestenoses residuais maiores e maior substrato trombogê-nico 22. Embora estes modelos de próteses não sejam maisutilizados clinicamente, estes resultados ressaltam a impor-tância do desenho e do formato do stent no resultado doprocedimento e podem ser importantes em um futuro ondea disponibilidade do revestimento do stent com drogas an-tiproliferativas poderia levar a uma maior flexibilização nosmodelos e desenhos das próteses.
O uso de stents para salvamento de oclusões agudasde angioplastia foi a variável associada com maior risco decomplicações cardiovasculares maiores, com razão dechance de 5,1 (IC: 2,7-9,6), compatível com dados de litera-tura 23,24. O uso de múltiplos stents também foi associadocom maior risco, provavelmente pela maior superfície metá-lica e, também, pela sua sobreposição10,11.
A complexidade da lesão é tradicionalmente um dosfatores mais associados a complicações cardiovascularesmaiores, na maioria dos estudos que analisa fatores prediti-vos de complicações pós angioplastia coronariana 6,9,20, massua importância tem sido questionada quando o procedimen-to envolve a colocação do stent 12. A complexidade da lesãofoi uma das variáveis independentemente associada comcomplicações nos estudos de Moscucci e cols. e no deHolmes e cols., mas não no estudo de Schünlen e cols. 5,7,11.Em nosso estudo, os pacientes com lesões complexas apre-sentaram risco 2,4 vezes (IC: 1,1 - 5,1) maior de complicações.
Embora tenha apresentado significância estatística naanálise univariada, procedimento realizado em vigência deinfarto agudo do miocárdio não foi independentementeassociado com a ocorrência de complicações cardiovas-culares maiores, ao contrário da maioria dos estudos pré-vios 6,7,9,11. Os motivos para esse achado não nos parecemclaros, embora a concomitância de pacientes com infartoagudo do miocárdio, trombo e situação de salvamentopossa ter influenciado no modelo. Estenose residual e com-primento da lesão, significativos na análise univariada, nãoo foram no modelo final. Da mesma forma, idade e disfunçãoventricular esquerda também não foram associados comcomplicações, mesmo na análise univariada.
O índice de sucesso clínico neste estudo é comparável
stepwise backwards com oito variáveis estatisticamentesignificativas na análise univariada: infarto agudo do mio-cárdio, comprimento da lesão, complexidade da lesão, pre-sença de trombo, stent de salvamento, tipo de stent, esteno-se residual e uso de múltiplos stents (tab. V). As variáveismais fortemente associadas às complicações cardiovascu-lares maiores foram implante de stent de salvamento e o tipode stent utilizado (filamentar, ou tubular de primeira gera-ção). Implante de múltiplos stents no mesmo procedimento,complexidade da lesão e presença de trombo também apre-sentaram significância estatística. O grau de estenose resi-dual, implante de stent em vigência de infarto agudo do mio-cárdio e o comprimento do stent não foram independen-temente associados com complicações cardiovascularesmaiores, embora com significância estatística na análiseunivariada.
Discussão
Os pacientes estudados constituem uma amostrarepresentativa de um centro de referência terciário, dedica-do, exclusivamente, a pacientes cardiológicos. Estes dadospodem auxiliar na avaliação do risco de complicações empacientes submetidos a implantes de stents em condiçõessemelhantes às relatadas. Neste estudo, analisando 1.070implantes de endopróteses coronarianas em 1.018 pacientesconsecutivos, demonstrou-se que os principais preditoresde complicações cardiovasculares maiores foram o tipo destent utilizado (filamentares ou de primeira geração), implan-tes de stents de salvamento, complexidade da lesão, pre-sença de trombo e o uso de múltiplos stents no mesmoprocedimento.
O tipo do stent implantado foi uma das principaisvariáveis independentemente associadas às complica-ções cardiovasculares maiores, tornando-se o principalachado deste trabalho, resultado que não havia sido rela-tado previamente em estudos especificamente delineadospara a análise de complicações 5,6,11,20. Holmes e cols. anali-saram 3.761 pacientes submetidos a implantes de stents,verificando que o modelo de predição de risco do estadode Nova York foi o principal fator preditivo de complica-ções; não foram relatados os tipos de stents utilizados 5.

5 3 65 3 65 3 65 3 65 3 6
Quadros e colsFatores preditivos de complicações após implante de stents
Arq Bras Cardiol2003; 80: 531-7.
a diversos estudos prévios, considerando as diferenças noscritérios de sucesso e complicações cardiovasculares maio-res utilizadas (em nosso estudo, necessidade de nova inter-venção percutânea na fase hospitalar ou no primeiro mêsquando por trombose subaguda foi considerada complica-ção maior) 1,5,11,25,26. Alguns ensaios clínicos randomizadostêm relatado taxas de sucesso de até 99%, mas em gruposde pacientes de muito baixo risco, excluindo infarto agudomiocárdio em evolução e pacientes com critérios angio-gráficos desfavoráveis 21.
Complicações cardiovasculares maiores ocorreramem 7,9% dos nossos pacientes, com incidência de infar-to agudo miocárdio, cirurgia de urgência e óbito semelhan-tes àquelas relatadas na literatura. A alta incidência deoclusões agudas (3,1% dos pacientes) pode ser atribuídaà alta freqüência de oclusões agudas de angioplastia co-ronariana e de pacientes com infarto agudo do miocárdioem evolução. Assim, 71 pacientes (7,1% do total) (tab. III)foram tratados justamente por oclusões agudas durante aangioplastia, sendo que neste subgrupo a possibilidadedo paciente permanecer em oclusão aguda foi sete vezesmaior do que o risco de um paciente eletivo apresentaresta intercorrência, achado que é compatível com dados deliteratura 11, 20.
Este estudo foi iniciado em 1996, incluindo stents fila-mentares e de primeira geração e a evolução das técnicas de
implante e o uso mais freqüente dos inibidores da glicopro-teína IIb/IIIa podem ter limitado a extrapolação destes resul-tados. Embora a inclusão dos pacientes tenha sido realizada,prospectivamente, a análise dos dados foi retrospectiva, oque também poderia introduzir viés de aferição no estudo.Embora as características clínicas não tenham apresentadopapel significativo, como determinantes de complicaçõeshospitalares, são reconhecidamente importantes preditorasde prognóstico a longo prazo.
Concluindo, o principal achado deste estudo foi deque o tipo de stent, filamentar ou de primeira geração,contribuiu como um dos fatores mais fortemente asso-ciados com o ocorrência de complicações cardiovascu-lares maiores após o implante. Outras variáveis estatisti-camente associadas com complicações cardiovascularesmaiores no modelo de regressão logística múltipla foramstents implantados por salvamento, múltiplos stents,complexidade da lesão e presença de trombo pré implan-te. Estes resultados ressaltam a importância de variáveisangiográficas e técnicas no risco de complicações e aler-tam para a influência do modelo do stent no resultado doprocedimento.
Agradecimentos
À Sra. Vânia Hirakata pela análise estatística dos dados.
Referências
1. Wiliams DO, Holubkov R, Yeh W, et al. Percutaneous coronary intervention inthe current era compared with 1985-1986. The National Heart, Lung, and BloodInstitute Registries. Circulation 2000;102; 2945-51.
2. Rankin JM, Spinelli JJ, Carere RG, et al. Improved clinical outcome after wides-pread use of coronary-artery stenting in Canada. N Engl J Med 1999; 341:1957-65.
3. Kimmel SE, Localio AR, Krone RJ, et al. The effects of contemporary use ofcoronary Stents on in-hospital mortality. Registry Committee of the Society forCardiac Angiography and Interventions. J Am Coll Cardiol 2001; 37: 499-504.
4. Souza JE, Costa MA, Abizaid A, et al. Sustained supression of neointimal proli-feration by sirolimus-eluting Stents: one-year angiographic and intravascularultrasound follow-up. Circulation 2001; 104: 2007-11.
5. Holmes DR, Berger PB, Garratt KN, et al. Application of the New York StatePTCA mortality model in patients undergoing stent implantation. Circulation2000; 102: 517-22.
6. Moscucci M, Kline-Rogers E, Share D, et al. Simple bedside additive tool forprediction of in-hospital mortality after percutaneous coronary interventions.Circulation 2001; 104: 262-8.
7. O´Connor GT, Malenka DJ, Quinton H, et al., for the Northern New England Car-diovascular Disease Study Group. Multivariate prediction of in-hospital morta-lity after percutaneous coronary interventions in 1994-1996. J Am Coll Cardiol1999; 34: 681-91.
8. Ellis SG, Weintraub W, Holmes D, Shaw R, Block PC, King 3rd SB. Relation ofoperator volume and experience to procedural outcome of percutaneous coronaryrevascularization at hospitals with high interventional volumes. Circulation1997; 96: 2479-84.
9. Moscucci M, O´Connor GT, Ellis SG, et al. Validation of risk adjustment modelsfor in-hospital percutaneous transluminal coronary angioplasty mortality on anindependent data set. J Am Coll Cardiol 1999; 34: 692-7.
10. Ellis SG, Buetta B, Miller D, Whitlow PL, Topol EJ. Relation between lesion cha-racteristics and risk with percutaneous intervention in the stent and glycopro-tein Iib/IIIa era: an analysis of results from 10907 lesions and proposal for newclassification scheme. Circulation 1999; 100: 1971-6.
11. Schünlen H, Kastrati A, Dirschinger J, et al. Intracoronary stenting and risk for ma-jor adverse cardiac events during the first month. Circulation 1998; 98: 104-11.
12. Maier W, Mini O, Antoni J, Wischnewsky MB, Meier B. ABC stenosis morpho-logy classification and outcome of coronary angioplasty. Circulation 2001;103: 1225-31.
13. Lindsay J, Pinnow EE, Popma JJ, Pichard AD. Obstacles to outcomes analysis inpercutaneous transluminal coronary revascularization. Am J Cardiol 1995; 76:168-72.
14. Block PC, Peterson EC, Krone R, et al. Identification of variables needed to riskadjust outcomes of coronary interventions: evidence-based guidelines for effi-cient data collection. J Am Coll Cardiol 1998; 32: 275-82.
15. Holmes DR, Hirshfield J, Faxon D, et al. ACC Expert Consensus Document onCoronary Artery Stents. Document of the American College of Cardiology. J AmColl Cardiol 1998; 32: 1471-82.
16. Carrozza JP, Baim DS. Coronary stenting. In: Baim DS, Grossman W, eds. Gross-man´s Cardiac Catheterization, Angiography, and Intervention. 6a ed. Philadel-phia, EUA: Lippincott Wiliams & Wilkins, 2000: 637-66.
17. The TIMI Study Group. The Thrombolysis in myocardial infarction (TIMI) trial:Phase I findings. N Engl J Med 1985; 312: 932-6.
18. Baim DS. Coronary angioplasty. In: Baim DS, Grossman W, eds. Grossman´sCardiac Catheterization, Angiography, and Intervention. 6a ed. Philadelphia,EUA: Lippincott Wiliams & Wilkins, 2000: 547-600.
19. Concato J, Feinstein AR, Holford TR. The risk of determining risk with multiva-riable models. Ann Intern Med 1993; 118: 201-10.
20. Kastrati A, Schömig A, Elezi S, et al. Prognostic value of the modified AmericanCollege of Cardiology/American Heart Association stenosis morphology clas-sification for long-term angiographic and clinical outcome after coronary stentplacement. Circulation 1999; 100: 1285-90.
21. Kastrati A, Dirschinger J, Boekstegers P, et al. Influence of stent design on 1-yearoutcome after coronary stent placement: a randomized comparison of five stenttypes in 1147 unselected patients. Catheter Cardiovasc Interv 2000; 50: 290-7.
22. Lansky A, Roubin G, O´Shaughnessy CD, et al. Randomized comparison of GR-II stent and Palmaz-Schatz stent for elective treatment of coronary stenoses.Circulation 2000; 102: 1364-8.
Arq Bras Cardiol2003; 80: 531-7.
Quadros e colsFatores preditivos de complicações após implante de stents
5 3 75 3 75 3 75 3 75 3 7
23. Schömig A, Kastrati A, Mudra H, et al. Four-year experience with Palmaz-Schatzstenting in coronary angioplasty complicated by dissection with threatened orpresent vessel closure. Circulation 1994; 90: 2716-24.
24. Sutton JM, Ellis SG, Roubin GS, et al. Major clinical events after coronary sten-ting. The multicenter registry of acute and elective Gianturco-Roubin stent pla-cement. The Gianturco- Roubin Intracoronary Stent Investigator Group. Circu-lation 1994; 89: 1126-37.
25. Mattos LA, Pinto I, Abizaid A, et al. Safety and efficacy of coronary stent implan-tation. Acute and six month outcomes of 1126 consecutive patients treated in1996 and 1997. Arq Bras Cardiol 1999; 73: 30-6.
26. Kastrati A, Schömig A, Dirschinger J, et al. Increased risk of restenosis afterplacement of gold-coated stents: results of a randomized trial compring gold-coated with uncoated steel stents in patients with coronary artery disease. Circu-lation 2000; 101: 2478-83.
Catedral - Brasília - DF Luisa Guilherme - São Paulo
Editor da Seção de Fotografias Artísticas: Cícero Piva de AlbuquerqueCorrespondência: InCor - Av. Dr. Enéas C. Aguiar, 44 - 05403-000 - São Paulo, SP - E-mail: delcicero@incor. usp.br

Arq Bras Cardiol2003; 80: 585-8.
Rosa e colsAterosclerose coronariana e espessura médio-íntima da carótida
5 8 55 8 55 8 55 8 55 8 5
Instituto de Cardiologia do Rio Grande do Sul/ Fundação Universitária deCardiologia.Correspondência: Iran Castro - Unidade de Pesquisa do IC/FUC - Av. PrincesaIsabel, 395-Santana 90620-001- Porto Alegre, RSe-mail: [email protected] para publicação em 7/12/01Aceito em 8/11/02
Arq Bras Cardiol, volume 80 (nº 6), 585-8, 2003
Eduardo Maffini da Rosa, Caroline Kramer, Iran Castro
Porto Alegre, RS
Associação Entre a Doença Aterosclerótica Coronariana e aEspessura Médio-Íntimal da Carótida Comum Através da
Ultra-Sonografia
Artigo Original
A espessura da camada médio-intimal da carótida co-mum foi recomendada como parâmetro útil para aferição dapresença de doença arterial coronariana em publicaçãorecente feita pela American Heart Association1. Os artigoscitados como referências2-8, entretanto, são na sua maioria,estudos de prognóstico. Referem-se à capacidade de amaior espessura da camada médio-intimal da carótida(comum e interna) prever a ocorrência de eventos coronaria-nos, como infarto ou morte cardíaca, num período médio de2-4 anos. Apenas o trabalho de Leary e cols.2, que avaliou acamada médio-intimal de pacientes idosos, obteve comoresultado uma associação positiva entre a maior camadamédio-intimal da carótida comum e a presença de doençaarterial coronariana. Na literatura médica, muitos estudosque abordam a associação da camada médio-intimal e a pre-sença de doença arterial coronariana9-12 não usam apenas acarótida comum para realizar a medida da camada médio-intimal, mas utilizam também o bulbo carotídeo e a carótidainterna. Adam e cols.12 verificaram especificamente a cama-da médio-intimal da carótida comum e observaram umafraca associação com a presença de doença arterial corona-riana. Burke e cols.4, entretanto, verificaram a ocorrência deassociação positiva entre a maior espessura da camada mé-dio-intimal e a presença de doença arterial coronariana, po-rém, o diagnóstico da presença ou não da doença, foi obtidoapenas através da história clínica.
O presente estudo tem como objetivo verificar a asso-ciação da maior espessura da camada médio-intimal da caró-tida comum com a presença de doença arterial coronariana.
Métodos
O método empregado foi o estudo caso-controle deprevalência prospectivo, e a amostra avaliada se constituiude 29 pacientes casos, portadores de doença arterial coro-nariana, e 29 pacientes saudáveis controles. Os critérios deinclusão para os pacientes casos foram estar internados noInstituto de Cardiologia do Rio Grande do Sul, de junho a
Objetivo - Verificar se a espessura da camada médio-intimal da carótida comum de pacientes com doença arte-rial coronariana é maior que a espessura da camada mé-dio-intimal de pessoas sem a doença.
Método - Estudo caso-controle de prevalência, deordem prospectiva, que verifica a espessura da camadamédio-intimal de 29 pacientes com doença arterialcoronariana e 29 sem a doença, através de ultra-sonogra-fia das carótidas. Foram excluídos do estudo os diabéticose os vasculopatas arteriais periféricos e cerebrais.
Resultados - A idade média foi de 51±7,5 anos. Cin-qüenta e cinco por cento eram homens. O infarto agudo domiocárdio esteve presente em 62%; cateterismo cardíacoem 72%; cirurgia de ponte de safena em 5%; e angioplas-tia coronariana em 24%. A espessura da camada médio-intimal da carótida comum nos pacientes casos foi de 0,81±0,25mm e nos controles, de 0,62±0,18mm (p=0,001).
Conclusão - A espessura da camada médio-intimalda carótida comum é significativamente maior em pacien-tes com doença arterial coronariana.
Palavras-chave: coronariopatia; espessura médio-inti-mal; carótida comum
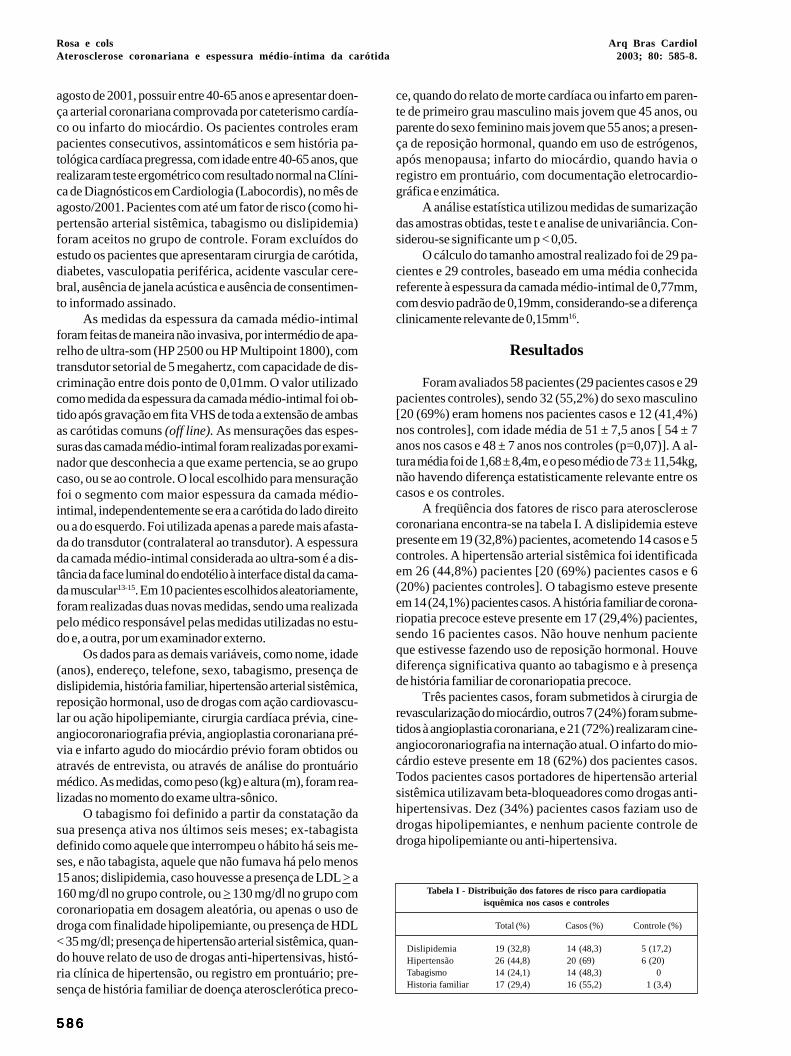
5 8 65 8 65 8 65 8 65 8 6
Rosa e colsAterosclerose coronariana e espessura médio-íntima da carótida
Arq Bras Cardiol2003; 80: 585-8.
ce, quando do relato de morte cardíaca ou infarto em paren-te de primeiro grau masculino mais jovem que 45 anos, ouparente do sexo feminino mais jovem que 55 anos; a presen-ça de reposição hormonal, quando em uso de estrógenos,após menopausa; infarto do miocárdio, quando havia oregistro em prontuário, com documentação eletrocardio-gráfica e enzimática.
A análise estatística utilizou medidas de sumarizaçãodas amostras obtidas, teste t e analise de univariância. Con-siderou-se significante um p < 0,05.
O cálculo do tamanho amostral realizado foi de 29 pa-cientes e 29 controles, baseado em uma média conhecidareferente à espessura da camada médio-intimal de 0,77mm,com desvio padrão de 0,19mm, considerando-se a diferençaclinicamente relevante de 0,15mm16.
Resultados
Foram avaliados 58 pacientes (29 pacientes casos e 29pacientes controles), sendo 32 (55,2%) do sexo masculino[20 (69%) eram homens nos pacientes casos e 12 (41,4%)nos controles], com idade média de 51 ± 7,5 anos [ 54 ± 7anos nos casos e 48 ± 7 anos nos controles (p=0,07)]. A al-tura média foi de 1,68 ± 8,4m, e o peso médio de 73 ± 11,54kg,não havendo diferença estatisticamente relevante entre oscasos e os controles.
A freqüência dos fatores de risco para aterosclerosecoronariana encontra-se na tabela I. A dislipidemia estevepresente em 19 (32,8%) pacientes, acometendo 14 casos e 5controles. A hipertensão arterial sistêmica foi identificadaem 26 (44,8%) pacientes [20 (69%) pacientes casos e 6(20%) pacientes controles]. O tabagismo esteve presenteem 14 (24,1%) pacientes casos. A história familiar de corona-riopatia precoce esteve presente em 17 (29,4%) pacientes,sendo 16 pacientes casos. Não houve nenhum pacienteque estivesse fazendo uso de reposição hormonal. Houvediferença significativa quanto ao tabagismo e à presençade história familiar de coronariopatia precoce.
Três pacientes casos, foram submetidos à cirurgia derevascularização do miocárdio, outros 7 (24%) foram subme-tidos à angioplastia coronariana, e 21 (72%) realizaram cine-angiocoronariografia na internação atual. O infarto do mio-cárdio esteve presente em 18 (62%) dos pacientes casos.Todos pacientes casos portadores de hipertensão arterialsistêmica utilizavam beta-bloqueadores como drogas anti-hipertensivas. Dez (34%) pacientes casos faziam uso dedrogas hipolipemiantes, e nenhum paciente controle dedroga hipolipemiante ou anti-hipertensiva.
agosto de 2001, possuir entre 40-65 anos e apresentar doen-ça arterial coronariana comprovada por cateterismo cardía-co ou infarto do miocárdio. Os pacientes controles erampacientes consecutivos, assintomáticos e sem história pa-tológica cardíaca pregressa, com idade entre 40-65 anos, querealizaram teste ergométrico com resultado normal na Clíni-ca de Diagnósticos em Cardiologia (Labocordis), no mês deagosto/2001. Pacientes com até um fator de risco (como hi-pertensão arterial sistêmica, tabagismo ou dislipidemia)foram aceitos no grupo de controle. Foram excluídos doestudo os pacientes que apresentaram cirurgia de carótida,diabetes, vasculopatia periférica, acidente vascular cere-bral, ausência de janela acústica e ausência de consentimen-to informado assinado.
As medidas da espessura da camada médio-intimalforam feitas de maneira não invasiva, por intermédio de apa-relho de ultra-som (HP 2500 ou HP Multipoint 1800), comtransdutor setorial de 5 megahertz, com capacidade de dis-criminação entre dois ponto de 0,01mm. O valor utilizadocomo medida da espessura da camada médio-intimal foi ob-tido após gravação em fita VHS de toda a extensão de ambasas carótidas comuns (off line). As mensurações das espes-suras das camada médio-intimal foram realizadas por exami-nador que desconhecia a que exame pertencia, se ao grupocaso, ou se ao controle. O local escolhido para mensuraçãofoi o segmento com maior espessura da camada médio-intimal, independentemente se era a carótida do lado direitoou a do esquerdo. Foi utilizada apenas a parede mais afasta-da do transdutor (contralateral ao transdutor). A espessurada camada médio-intimal considerada ao ultra-som é a dis-tância da face luminal do endotélio à interface distal da cama-da muscular13-15. Em 10 pacientes escolhidos aleatoriamente,foram realizadas duas novas medidas, sendo uma realizadapelo médico responsável pelas medidas utilizadas no estu-do e, a outra, por um examinador externo.
Os dados para as demais variáveis, como nome, idade(anos), endereço, telefone, sexo, tabagismo, presença dedislipidemia, história familiar, hipertensão arterial sistêmica,reposição hormonal, uso de drogas com ação cardiovascu-lar ou ação hipolipemiante, cirurgia cardíaca prévia, cine-angiocoronariografia prévia, angioplastia coronariana pré-via e infarto agudo do miocárdio prévio foram obtidos ouatravés de entrevista, ou através de análise do prontuáriomédico. As medidas, como peso (kg) e altura (m), foram rea-lizadas no momento do exame ultra-sônico.
O tabagismo foi definido a partir da constatação dasua presença ativa nos últimos seis meses; ex-tabagistadefinido como aquele que interrompeu o hábito há seis me-ses, e não tabagista, aquele que não fumava há pelo menos15 anos; dislipidemia, caso houvesse a presença de LDL > a160 mg/dl no grupo controle, ou > 130 mg/dl no grupo comcoronariopatia em dosagem aleatória, ou apenas o uso dedroga com finalidade hipolipemiante, ou presença de HDL< 35 mg/dl; presença de hipertensão arterial sistêmica, quan-do houve relato de uso de drogas anti-hipertensivas, histó-ria clínica de hipertensão, ou registro em prontuário; pre-sença de história familiar de doença aterosclerótica preco-
Tabela I - Distribuição dos fatores de risco para cardiopatiaisquêmica nos casos e controles
Total (%) Casos (%) Controle (%)
Dislipidemia 19 (32,8) 14 (48,3) 5 (17,2)Hipertensão 26 (44,8) 20 (69) 6 (20)Tabagismo 14 (24,1) 14 (48,3) 0Historia familiar 17 (29,4) 16 (55,2) 1 (3,4)

Arq Bras Cardiol2003; 80: 585-8.
Rosa e colsAterosclerose coronariana e espessura médio-íntima da carótida
5 8 75 8 75 8 75 8 75 8 7
O exame de ultra-som obteve em 100% dos exames ima-gem suficientemente adequada para a realização de medidada camada médio-intimal. A variação intra-observador foide 0,05±0,02mm, enquanto que a variação inter-observadorfoi de 0,07±0,04mm.
A espessura da camada médio-intimal das carótidascomuns dos pacientes casos foi significativamente maiorque a espessura da camada médio-intimal nos pacientescontroles. A espessura da camada médio-intimal dos paci-entes casos foi de 0,81 ± 0,25mm (0,71 ± 0,9mm), enquantoque nos pacientes controles foi de 0,62 ± 0,18mm (0,58-0,71mm) (p=0,001) (fig.1). A analise de univariância demons-trou que o tabagismo foi o único fator de risco que apresen-tou relevância quanto a maior espessura da camada médio-intimal.
Discussão
A espessura da camada médio-intimal da carótida co-mum, no presente estudo, foi maior no grupo de pacientescom doença arterial coronariana. Esse achado é comparávelaos resultados disponíveis na literatura médica especializa-da2,8-12. A espessura da camada médio-intimal da carótidacomum, encontrada no grupo de pacientes casos, foi de 0,81+0,25mm (0,71-0,9mm), semelhante ao apresentado na litera-tura. Adams e cols.12 encontraram um valor de 0,83+0,20mmpara portadores de doença arterial coronariana, enquantoBlankenhorn e cols.17 verificaram uma medida de 0,65+0,11mm, e Lamount e cols.18 obtiveram uma média de 0,79mm(0,75+0,83mm).
A média da espessura das camada médio-intimal dascarótida comum dos pacientes do grupo controle foi de0,62+0,18mm (0,58+0,71mm). Este valor se aproxima dosresultados de estudos na literatura. Pignoli e cols.13, compa-rando medidas de ultra-som com medidas em peças anatô-micas, obtiveram o valor de 0,53+0,05mm em pacientes semdoença arterial coronariana. Lamont e cols.18 encontraramuma média de 0,76 mm (0,74+0,78mm), enquanto Schmidt-Truncksass e cols.19, analisando 160 homens saudáveis eatletas, obtiveram uma média de 0,73mm.
Apesar das semelhanças apresentadas com a literaturamédica, algumas particularidades devem ser destacadas nopresente estudo. Em primeiro lugar, a técnica utilizada pararealizar a mensuração da camada médio-intimal, ou seja, amensuração do local de maior espessura da camada médio-intimal, após varredura de toda extensão da carótida co-mum, utilizando apenas a parede contralateral. Esta técnicase caracteriza por ser uma técnica simples e rápida, porémsujeita a não identificar realmente o local de maior espes-sura. A janela acústica utilizada neste estudo foi exclusi-vamente a janela da borda posterior do músculo esternocli-domastóide, o que gerou medidas exclusivamente da pa-rede anteromedial da carótida comum. Na literatura, há umagrande variedade de modos de medir a espessura da cama-da médio-intimal3,4,9,12,17,20. Há duas técnicas utilizadas commaior frequência: a primeira refere-se a uma média das medi-das da espessura da camada médio-intimal da carótidacomum, bulbo e carótida interna, medida na parede proximale distal, utilizada nos estudos de Crouse e cols.9, Burke ecols.4, e Yamaraki e cols.20. Um segundo método de medidafoi utilizado por Salomem e cols.3, Blankenhorn e cols. 17,Adams 12 e cols., que escolheram a marca de 10mm distal àbifurcação da carótida comum. Existem outros métodos demedida, como o empregado por Hodis e cols.21, que consis-te em fazer 80 medidas num segmento de 1cm no local maisespessura da carótida, ou o método empregado por Nowake cols. 11, que realizou a medida da área da camada médio-intimal 5-10mm proximal ao bulbo.
O método empregado no presente estudo é novo, foiescolhido e aplicado pela necessidade de desenvolvimentode um meio rápido e simples, mas que mantivesse a associa-ção com doença arterial coronariana, facilitando o procedi-mento para fins assistenciais e de pesquisa.
A segunda particularidade deste estudo refere-se aoscritérios de seleção da amostra. Foi selecionada uma amos-tra que não apresentasse marcadores clínicos utilizadospara identificar clinicamente pacientes com doença arterialcoronariana22, mesmo nos portadores da doença, comoforam os pacientes casos. Isso se deve ao fato de que esteestudo gerou uma medida na população de interesse clíni-co e de pesquisa, que poderá ser empregada na tentativa deidentificar pacientes com doença arterial coronariana, mes-mo na ausência da marcadores clínicos tradicionalmenteutilizados.
Ainda dentro das particularidades deste estudo, pelomenos 4 limitações devem ser consideradas: 1º) o equipa-mento para realizar os exames do grupo controle difere doequipamento usado no grupo de casos; 2º) a maneira utiliza-da para inferir a ausência de doença arterial coronariana nogrupo controle. A probabilidade pós- teste de um pacienteassintomático com 40-65 anos, que apresenta um testeergométrico com resultado normal, ser portador da doençaarterial coronariana, é de 1-3%23. Deve ficar claro que a pre-sença da doença não foi excluída e que o uso da cineangio-coronariografia em todos os pacientes apesar de superior,não foi empregado por razões éticas; 3º) a mensuração dosfatores de risco foi qualitativa. Muito embora o presenteFig.1 - Distribuição da espessura da camada médio-intimal entre os casos e controles.

5 8 85 8 85 8 85 8 85 8 8
Rosa e colsAterosclerose coronariana e espessura médio-íntima da carótida
Arq Bras Cardiol2003; 80: 585-8.
Referências
1. Smith SC, Greenland P, Grundy SM. Prevention Conference V. Beyond Secon-dary Prevention: identifying the high-risk patient for primary prevention. Exe-cutive Summary. Circulation 2000;101:111-6.
2. O’Leary DH, Polak JF, Manolio TA, et al. Cardiovascular health study colla-borative research group: carotid artery intimal and media thickness as a risk fac-tor for myocardial infarction and stroke in older adults. N Eng J Med 1999;340:14-22.
3. Salonen JT, Salonen R. Ultrasonographically assessed carotid morphology andthe risk of coronary heart disease. Arterioscler Thromb 1991;11:1245-9.
4. Burke GL, Evans GW, Riley WA, et al. Arterial wall thickness is associated withprevalent cardiovascular disease in middle-aged adults. Stroke 1995;26:386-91.
5. O’Leary DH, Polak JF, Kronmal RA, et al. Carotid-artery intima and mediathickness as a risk factor for myocardial infarction and stroke in older adults. NEng J Med 1999; 340: 14-22.
6. Hodis HN, Mack WJ, Labree L, et al. The role carotid arterial intima-media thick-ness in predicting clinical coronary events. Ann Intern Med 1998; 128: 262-9.
7. Mannami T, Konisk M, Baba S, Nishi N, Terao A. Prevalence of asymptomaticcarotid atherosclerotic lesions detected by high-resolution ultrasonographyand its relation to cardiovascular risk factors in the general population of ajapanese city. Stroke 1997; 28: 518-25.
8. Bots ML, Hoes AW, Koudstool PJ, Hofman A, Grobbee DE. Commom carotidintima-media thickness and risk of stroke and myocardial infartion. Circulation1997; 96: 1432-7.
9. Crouse JR, Craven TE, Hagaman AP, et al. Association of coronary disease withsegment-specific intima-media thickening of the extracranial carotid artery.Circulation 1995;92:1141-7.
10. Craven TE, Ryu JE, Espeland MA, et al. Evaluation of the associations betweencarotid artery atherosclerosis and coronary artery stenosis. A case-controlestudy. Circulation 1990;82:1230-42.
11. Nowak J, Nilsson T, Sylven C, Jogestrand T. Potential of carotid ultrasonographyin the diagnosis of coronary artery disease. Stroke 1998; 29: 439-46.
12. Adams MR, Nakagomi A, Keech A, et al. Carotid intima-media thickness is onlyweakly correlated with the extent and severity of coronary artery disease.Circulation 1995; 92: 2127-34.
13. Pignoli P, Tremoli E, Poll A, et al. Intima plus media thickness of the arterialwall: a direct measurement with ultrasound imaging. Circulation 1986,74:1399-06.
14. Junqueira LC, Carneiro J. Sistema circulatório. In. Junqueira LC. HistologiaBásica. Rio de Janeiro: Guanabara, 1985.
15. Pimentel P. Estudo eco-color-doppler normal. In: Pimentel P, Ristow AV, AraujoWB. Eco-doppler da Artérias Carótidas e Vertebrais. Avaliação Diagnóstica eCorrrelação Angiográfica Cirurgica. Rio de Janeiro: Revinter,1993.
16. Ebrahim S. Use of B mode ultrasound of peripheral arteries as end point inclinical trials. Br Heart J 1994;72:501-3.
17. Blankenhorn DH, Selzer RH, Crawford DW, et al. Beneficial effects of colestipo-niacin therapy on the common carotid artery. Circulation 1993;88:20-8.
18. Lamont D, Parkerl L, White M, et al. Risk of cardiovascular disease measured bycarotid intima-media thickness at age 49-51: lifecourse study. Br Med J 2000;320; 273-8.
19. Schmidt-Trucksâss A, Grathwohe D, Schmid A, et al. Structural, functional, andhemodynamic changes of the common carotid artery with age in male subjects.Arterioscler Thromb Vasc Biol 1999; 19: 1091-7.
20. Yamasaki Y. Carotid intima-media thickness in Japanese type 2 diabeticsubjects: predictors of progression and relationship with incident coronaryheart disease. Diabetes Care 2000, 23; 1310-15.
21. Hodis HN, Mack WJ, Labree L, et al. Reduction in carotid arterial wall thicknessusing lovastatin and dietary therapy. Ann Intern Med 1996; 124: 548-56.
22. Gersh BJ, Braunwald E, Rutherford JD. Chronic coronary artery disease. In:Braunwald E. Textbook: Braunwald Heart Disease. A Textbook of Cardiovas-cular Medicine. Philadelphia: WB Saunders Company 1997.
23. Management of stable angina pectoris. Recomendations of the task force of theeuropean society of cardiology. Eur Heart J 1997;18: 394-413.
estudo não tenha como objetivo testar especificamente osfatores de risco, a analise de univariância sugeriu que o taba-gismo possa influenciar na espessura da camada médio-intimal, e a presença dos respectivos dados quantitativospoderiam ser úteis para um melhor esclarecimento; e 4º) nãofoi realizado o cálculo de razão de chances, nem cálculos desensibilidade, especificidade, valor preditivo positivo ounegativo, devido ser a amostra composta de 50% de pacien-tes com doença arterial coronariana, ou seja, estaríamoscalculando propriedades diagnósticas para teste em uma
amostra com probabilidade de pré- teste muito elevado,gerando resultados inadequados.
Em conclusão, a medida da espessura da camada mé-dio-intimal da carótida comum é maior em portadores dedoença arterial coronariana em relação a pacientes sem adoença, e novos estudos devem ser feitos com o objetivode definir as características diagnósticas da camada médio-intimal obtida através de medida simples do local maisespesso da carótida comum em pacientes sem evidência clí-nica de doença arterial coronariana.

Original Article - Ultrasound Obstet Gynecol
BEHAVIOR OF SEPTUM PRIMUM MOBILITY IN THIRD TRIMESTER FETUSES WITH MYOCARDIAL HYPERTROPHY
Short title: Septum Primum Mobility
Cora Firpo *, MD, PhD, Paulo Zielinsky, MD, PhD.
Key words: Fetal heart – Diastole – Echocardiography – Hypertrophy – Atrium.
ABSTRACT
Background. The mobility of the septum primum in the fetus is a diastolic
phenomenon and could be related to left atrial pressure. We studied the linear
displacement of the septum primum in the left atrium in fetuses of diabetic mothers
(FDM) with and without septal hypertrophy (SH) and in normal fetuses of
normoglycemic mothers.
Objectives. To test the hypothesis that the linear displacement of the septum primum
flap valve is less marked in fetuses with SH than in fetuses without SH.
Methods. The ratio between the linear displacement of the flap valve and the left
atrial diameter (excursion index [EI]) was compared in 10 FDM with SH, 8 FDM with
normal septal thickness and 8 normal fetuses of non-diabetic mothers. Atrioventricular
flow velocities were also compared in the three groups.
Results. Comparison of the three groups showed that, in FDM with SH, the mean EI
was 0.36 ±0.09, in FDM without SH it was 0.51±0.09 (p= 0.001) and in the control
fetuses it was 0.49±0.12 (p=0.03). There was a significant negative correlation
between septal thickness and EI in FDM with SH. There was no correlation between
septal thickness and atrioventricular flow velocities.
* Supported by CNPq, Brasil.
2 Conclusion. There is less mobility of the septum primum in FDM with SH and
there is an inverse correlation between the linear displacement of the septum primum
and septal thickness. These findings may be related to changes in left ventricular
diastolic function secondary to myocardial hypertrophy.
Fetal diastolic function has been studied throughout gestation, with controversial
results (1-9). Despite the limitations of a non-invasive method and the technical
difficulties peculiar to intrauterine life, the usual indexes to evaluate diastolic function
by Doppler-echocardiography of atrioventricular flow analysis have been used to
study ventricular filling in fetuses with potential alterations of cardiovascular
physiology (10-14).
Myocardial hypertrophy is a frequent abnormality in neonates whose mothers are
diabetic (15-22). These newborns may present ventricular filling alterations and
congestive cardiac failure. In the last decade, prenatal diastolic function in fetuses
with “hypertrophic cardiomyopathy” was the subject of several reports (14, 23-27).
Little data is currently available on fetal intracardiac hemodynamics when the mother
has diabetes and in fetuses of normoglycemic women. Further studies are necessary
and justify the search for alternative indexes that may allow an easier assessment of
fetal diastolic function.
In a previous study we assessed the mobility of the septum primum flap valve during
intrauterine life (28). Observations of septum primum mobility during routine prenatal
echocardiographic examination of fetuses of diabetic mothers with septal hypertrophy
seemed to show a reduced excursion of this structure during diastole. A possible
explanation for this behavior could be related to changes in the left ventricular filling.
This study was designed to test the hypothesis that the linear displacement of the
septum primum flap valve is less marked in fetuses with SH than in fetuses without
SH. In addition, the authors aimed to comparatively study the linear displacement of
the septum primum and the flow velocities across mitral and tricuspid valves in the
same patients.

3 Patients and Methods
Twenty-six patients submitted to fetal echocardiography at the Fetal Cardiology Unit
of the Institute of Cardiology of Rio Grande do Sul between May 1999 and February
2000 were included in the study. Eighteen were diabetic women in prenatal follow-up
and had been referred by their obstetricians. Thirteen had a diagnosis of gestational
diabetes, according to O’Sullivan and Mahan criteria (29). Five patients had diabetes
mellitus prior to gestation. Eight women had normal glucose levels and were included
in the study as normal controls. Gestational age was determined according to the last
menstrual period and confirmed during ultrasonographic examination by the usual
methods (30, 31). Each fetus was examined only once. The Hospital Ethics
Committee approved the study and informed consent was obtained from each
mother.
The equipment used was an Advanced Technology Laboratories (ATL) sector scan,
model Ultramark 9 Digital Plus with a 3.5 MHz curved transducer and a 5 MHz
phased array transducer and an Acuson 128 XP-10 model scan equipped with 4 and
5 MHz transducers. Both were able to produce two dimensional, M-mode, Doppler
and color mapping images. All fetuses included in the study were those whose
images were considered of suitable quality, with no other cardiac abnormality except
for SH.
Flow analysis utilized pulsed Doppler and color imaging. Flow velocities through the
atrioventricular valves were recorded in the four-chamber view. The sample was
placed immediately distal to the valve annulus, between the tips of the leaflets. To
obtain maximal velocities, the only fetuses included in this study were those in whom
it was possible for the ultrasound beam and the direction of blood flow to run parallel
or forming an angle of less than 200. Three consecutives beats were always recorded
in the absence of fetal breathing. The variables obtained were peak E-wave and peak
A-wave in cm/s, corresponding to the mitral and tricuspid flows. For each variable, the
mean of three recorded beats was considered. The E/A ratio was calculated for each
beat.

4 The thickness of the interventricular septum (IVS) was measured in centimeters,
using M-mode at late diastole with the cursor directed perpendicularly to that structure
and positioned immediately distal to the atrioventricular valve leaflets. Three
measurements were carried out at adjoining sites in order to calculate the arithmetic
mean. The septal thickness value obtained for each fetus was compared to a
nomogram with a confidence interval of 95% (32). According to this and considering
the presence or absence of maternal diabetes, fetuses were classified in 3 groups:
Group 1: FDM with SH (n=10)
Group 2: FDM without SH (n=8)
Group 3: fetuses of non-diabetic mothers with normal echocardiograms (n=8).
The linear displacement of the septum primum was assessed in a four-chamber view
during fetal apnea by the ratio of maximum linear excursion of the septum primum in
diastole to maximum left atrial diastolic diameter (28). (Figure 1).These
measurements were obtained both from apical and long-axis four-chambers views. All
the measurements were performed by the same investigator, who was blinded to the
maternal diagnosis. To test variability, the measurements were repeated by the
second investigator and by the first investigator, each of whom was blinded to the
previous results. Variability was expressed as the difference from the mean of the two
results.
Results were presented as mean ± one standard deviation. Statistical analysis used
analysis of variance (ANOVA) to compare variables in the three groups, and
Pearson’s correlation to determine the association between variables.
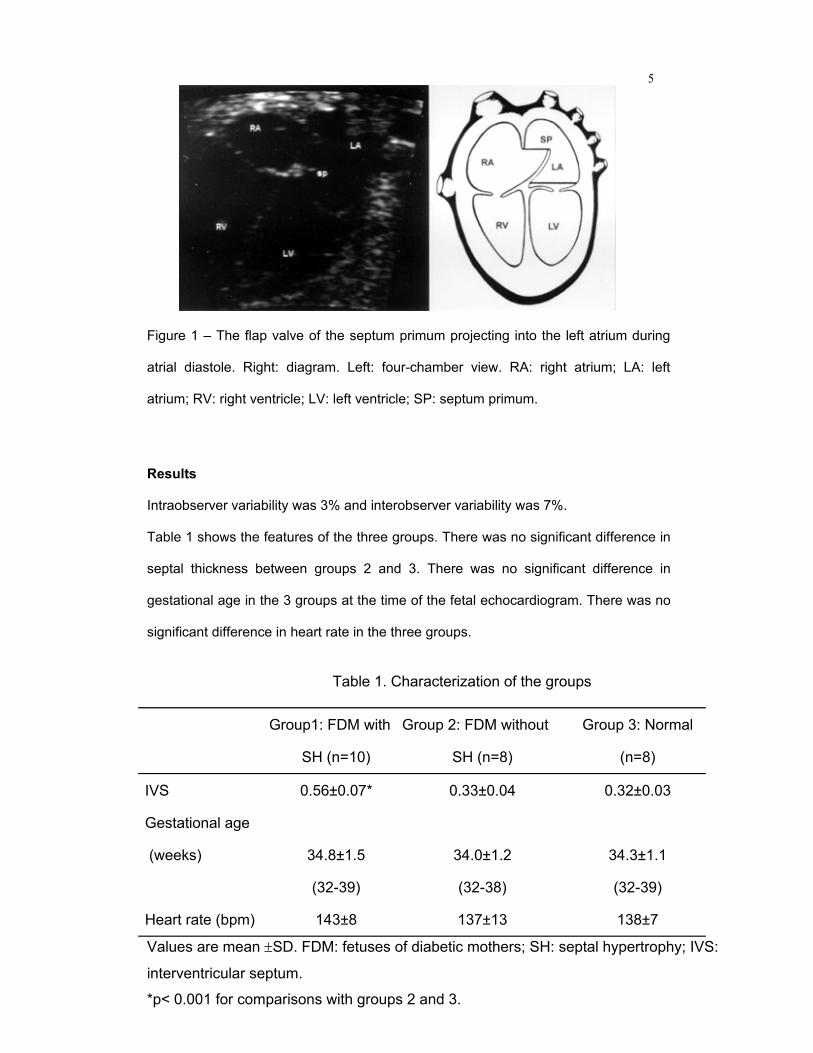
5
Figure 1 – The flap valve of the septum primum projecting into the left atrium during
atrial diastole. Right: diagram. Left: four-chamber view. RA: right atrium; LA: left
atrium; RV: right ventricle; LV: left ventricle; SP: septum primum.
Results
Intraobserver variability was 3% and interobserver variability was 7%.
Table 1 shows the features of the three groups. There was no significant difference in
septal thickness between groups 2 and 3. There was no significant difference in
gestational age in the 3 groups at the time of the fetal echocardiogram. There was no
significant difference in heart rate in the three groups.
Table 1. Characterization of the groups
Group1: FDM with
SH (n=10)
Group 2: FDM without
SH (n=8)
Group 3: Normal
(n=8)
IVS 0.56±0.07* 0.33±0.04 0.32±0.03
Gestational age
(weeks)
34.8±1.5
(32-39)
34.0±1.2
(32-38)
34.3±1.1
(32-39)
Heart rate (bpm) 143±8 137±13 138±7
Values are mean ±SD. FDM: fetuses of diabetic mothers; SH: septal hypertrophy; IVS:
interventricular septum.
*p< 0.001 for comparisons with groups 2 and 3.

6 Table 2. Echocardiographic and Doppler-echocardiographic measurements.
Group 1: FDM
with SH (n=10)
Group 2:FDM without
SH (n=8)
Group 3: Controls
(n=8)
EI .36±.09 * .51±.09 .49±.12
E-wave mitral velocity (cm/s) 31.66±6.25 29.99±4.34 31.30±6.57
A-wave mitral velocity (cm/s) 42.96±6.97 42.25±6.71 42.91±7.58
Mitral E/A 0.74±0.09 0.72±0.11 0.73±0.10
E-wave tricuspid velocity (cm/s) 31.85±10.72 37.28±7.79 39.10±8.64
A-wave tricuspid velocity (cm/s) 50.63±19.31 49.46±8.16 53.49±8.75
Tricuspid E/A 0.64±0.11 0.75±0.08 0.73±0.07
Values are mean±SD.FDM: fetuses of diabetic mothers; SH: septal hypertrophy; IVS:
interventricular septum; EI: excursion index of the septum primum.
*p = 0.01 for comparisons with group 2; p = 0.03 for comparisons with group 3.
Table 2 shows all two-dimensional and Dopper-echocardiographic data in the three groups,
(mean±SD). The mean excursion index of the septum primum flap valve was .36±.09 (.30-.43)
in FDM with SH, .51±.09 (.39-.59) in FDM without SH and .49±.12 (.44-.59) in the control
group. The “EI” was significantly smaller in group 1 (p=0.01) (Figure 2). There was no
significant difference in atrioventricular flow indexes in the 3 groups.

7
.00
.10
.20
.30
.40
.50
.60
.36±.09
.51±.09 .49±.12
Group 1 FDM with SH
n=10
Group 2 FDM without SH
n=8
Group 3Normal
n=8
EI
*
Figure 2. Comparison between EI in FDM with SH (group 1), FDM without SH (group
2) and normal fetuses (group 3). EI: excursion index of the septum primum; FDM:
fetuses of diabetic mothers; SH: septal hypertrophy.
The association between septal thickness, “EI” and atrioventricular flow indexes of
diastolic function in FDM with SH was studied (Table 3). There was a significant
negative correlation (r=-0.7; p=0.03) between IVS thickness and “EI” (Figure 3). There
was no significant correlation between IVS thickness and mitral or tricuspid flow
velocities.
Table 3. Correlation (r) between IVS thickness and EI, mitral and tricuspid flow velocities.
EI E (M) A (M) E/A (M) E (T) A (T) E/A (T)
IVS (r) -0,7* 0,3 0,4 -0,2 0,4 0,6 0,3
IVS: interventricular septum; r: correlation coefficient; EI :excursion index of the
septum primum; E(M): peak E wave in the mitral valve; A(M): peak A wave in the
mitral valve; E/A(M):E/A ratio in the mitral valve; E(T): peak E wave in the tricuspid
valve; A(T): peak A wave in the tricuspid valve; E/A(T): E/A ratio in the tricuspid
valve.
*p= 0.03

8
Interventricular septum
.7.6.5.4
Excu
rsio
n in
dex
of th
e fla
p va
lve
.6
.5
.4
.3
.2
.1
.0
r= -.7p= .03y= .738 - .486x
Figure 3. Correlation between the excursion index of the septum primum and
thickness of the interventricular septum in FDM with SH.
Discussion
Children of diabetic mothers present a well-known risk for the development of
myocardial hypertrophy, even under maternal metabolic control (19, 21), with variable
clinical presentation. It was suggested that severity could be related to diabetes
control (33).
Microscopic alterations of the hypertrophic myocardium in these babies include
hypertrophy, hyperplasia and a disorganization of the normal pattern of myofibers
similar to that described in the familial form of hypertrophic cardiomyopathy (34).
Pathophysiological mechanisms involved in the development of signs and symptoms
of cardiac failure in neonates with hypertrophic cardiomyopathy are mainly related to
difficulty in ventricular filling and therefore to diastolic dysfunction. These
abnormalities occur as a result of changes in the compliance and relaxation process.
Although several reports in literature deal with diastolic function in normal fetuses (1,
8, 9, 13, 35, 36) and in fetuses with hypertrophic cardiomyopathy (23, 25, 37, 38), we

9 are not aware of any study evaluating diastolic function in fetuses of diabetic
mothers comparing groups with and without septal hypertrophy.
Rizzo and co-workers have demonstrated changes in ventricular filling in diabetic
pregnancies during early gestation, by comparing the E/A ratio in fetuses of diabetic
mothers to fetuses of mothers without diabetes, in a longitudinal study (26). The
present transversal study failed to confirm such findings, but it compared three
groups of fetuses and was not designed to assess changes in atrioventricular flow
velocities during the first half of pregnancy.
Difficulties inherent to the fetal condition affect the recording of cardiac flows in the
fetus. Analysis of the venous flow is usually important to evaluate diastolic function,
particularly when atrioventricular flow alterations take on the pseudonormal pattern.
Obtaining these data during the prenatal period may require considerable
examination time and sometimes new studies until a suitable position of the fetus and
good cursor alignment are achieved (39, 40, 41). Even though analysis of the flow
across the ductus venosus is performed in many clinical situations, it is not yet part of
the routine assessment of diastolic function (42). On the other hand, the analysis of
atrioventricular flow in normal or abnormal fetuses is still controversial. In the present
study, we focused on the septum primum flap valve rim motion, since the septum
primum is not affected by fetus position. The linear displacement of that structure
during the cardiac cycle was compared to the usual diastolic function indexes.
The few studies on diastolic function in fetuses with myocardial hypertrophy have
used standard atrioventricular Doppler-echocardiographic indexes generally utilized in
postnatal life. Nevertheless, studies performed in adult patients showed that these
parameters are not appropriate to evaluate diastolic function in hypertrophic
cardiomyopathy. Nishimura and coworkers (43) showed that the transmitral velocity
curve does not evaluate the left ventricle filling function in patients with hypertrophic
cardiomyopathy, suggesting that new parameters should be established to assess
relaxation and compliance in such patients non-invasively.

10 The present study was designed to assess the mobility of the flap valve of the
septum primum, a very characteristic structure of the fetal heart, which can be easily
identified during prenatal echocardiographic evaluation. We hypothesized that the
mobility of the flap valve of the septum primum would be reduced in the presence of
septal hypertrophy, as a result of decreased compliance and altered relaxation of the
left ventricle, both present in hypertrophic cardiomyopathy. Increased filling pressure
would trigger an elevation of the mean pressure in both atria, with a trend to
equalizing pressures throughout the cardiac cycle and to reducing the flap excursion
within the left atrium. Decreased distensibility of the ventricular myocardium would
cause a less marked linear displacement of the septum primum flap valve. The results
obtained in this study confirmed our hypothesis, showing that, in the third trimester of
gestation, fetuses with septal hypertrophy have a less mobile septum primum flap
valve inside the left atrium, as compared to fetuses of diabetic mothers without this
condition and to normal fetuses.
The lack of correlation between the linear displacement of the septum primum and
flow velocities through the mitral and tricuspid valves highlights the need for
alternative methods to assess diastolic function in these fetuses. Briguori and
coworkers (44) suggested that the M-mode echogram of the left atrium could provide
a more suitable assessment of the left ventricle diastolic function in adults with
hypertrophic cardiomyopathy, than the Doppler-echocardiographic measurements of
mitral flow. Possible the mobility of the septum primum flap valve in the fetus is a
similar parameter, depending on left atrial diastolic pressure.
The data agree with the negative correlation found between the EI and the IVS
thickness measurement in FDM with SH in the third trimester. Although according to
experienced fetal echocardiographers, the mitral and tricuspid E/A ratio can be
obtained in practically every fetus, this new index may be an additional tool, which
may contribute to the assessment of diastolic function in these fetuses.
Even though overt heart failure is not a common clinical outcome in neonates with
myocardial hypertrophy secondary to maternal diabetes, the presence of diastolic

11 dysfunction is quite common (37, 38). Subtle early clinical and radiological
findings, such as tachypnea and mild pulmonary congestion, respectively, may be
due to diastolic alterations of the left ventricle in such babies. Prenatal assessment of
diastolic abnormalities may be important to predict the prognosis in fetuses of
diabetic mothers. Measuring the excursion index of the septum primum is easy and
could add information to the overall functional evaluation. Cohort studies designed to
assess the usefulness of particular parameters, such as atrioventricular flow
velocities and septum primum excursion, to predict postnatal clinical outcomes, are
desirable.
Diastolic dysfunction, responsible for the onset of signs and symptoms of neonatal
cardiac failure in myocardial hypertrophy, could explain the reduced mobility of the
septum primum in the fetus. The more hypertrophic the IVS, the worse would be the
restriction to ventricular filling and the smaller the excursion of the septum primum
flap valve within the left atrium throughout the cardiac cycle. These data suggest that
further studies, including assessment of flow through the foramen ovale, pulmonary
veins and in the ductus venosus in these fetuses, would be helpful.
In conclusion, the mobility of the septum primum is decreased in fetuses of diabetic
mothers during the third trimester of gestation and there is an inverse correlation
between the linear displacement of the septum primum and the ventricular septum
thickness in these fetuses. This index did not correlate with atrioventricular flow
velocity curves, suggesting that flow analysis of atrioventricular curves may be less
suitable for a comparatively study of diastolic function in fetuses with septal
hypertrophy and fetuses with normal septal thickness.
REFERENCES
(1) Pacileo G, Paladini D, Palmieri S, Pisacane C, Russo MG, Calabro R.
Echocardiographic assessment of diastolic function in normal human fetuses. J Perinat
Med 1994; 22(supl.1):43-45.

12 (2) Choi JY, Noh CI, Yun YS. Study on Doppler waveforms from the fetal
cardiovascular system. Fetal Diagn Ther 1991; 6:74-83.
(3) Veille JC, Smith N, Zaccaro D. Ventricular filling patterns of the right and left
ventricles in normally grown fetuses: a longitudinal follow-study from early intrauterine life
to age 1 year. Am J Obstet Gynecol 1999; 180:849-858.
(4) Reed KL, Sahn DJ, Scagnelli S, Anderson CF, Shenker L. Doppler echocardiographic
studies of diastolic function in the human fetal heart: changes during gestation. J Am Coll
Cardiol 1986; 8:391-395.
(5) Hata T, Aoki S, Hata K, Kitao M. Intracardiac blood flow velocity waveforms in normal
fetuses in utero. Am J Cardiol 1987; 59:464-468.
(6) Carceller-Blanchard AM, Fouron JC. Determinants of the Doppler flow velocity profile
through the mitral valve of the human fetus. Br Heart J 1993; 70:457-460.
(7) Harada K, Rice MJ, Shiota T, et al. Gestational age- and growth-related alterations in
fetal right and left ventricular diastolic filling patterns. Am J Cardiol 1997; 79:173-177.
(8) Tulzer G, Khowsathit P, Gudmundsson S, et al. Diastolic function of the fetal heart
during the second and third trimester: a prospective longitudinal Doppler-
echocardiographic study. Eur J Pediatr 1994; 153:151-154.
(9) Weber HS. Serial echocardiographic Doppler evaluation of diastolic function in the
normal human fetus. Cardiol Young 1996; 6:32-36.
(10) Capponi A, Rizzo G, Pasquini L, Arduini D, Romanini C. The effects of fetal blood
sampling on ventricular filling patterns: differences between normaly grown and growth-
retarded fetuses. Am J Perinatol 1996; 13:507-512.
(11) Tsyvian P, Malkin K, Wladimiroff JW. Assessment of fetal left cardiac isovolumic
relaxation time in appropriate and small-for-gestational-age fetuses. Ultrasound Med Biol
1995; 21:739-743.
(12) Harada K, Rice MJ, McDonald RW, et al. Doppler echocardiographic evaluation of
ventricular diastolic filling in fetuses with ductal constriction. Am J Cardiol 1997; 79:442-
446.
(13) Rizzo G, Arduini D, Romanini C, Mancuso S. Doppler echocardiographic assessment
of atrioventricular velocity waveforms in normal and small-for-gestational-age fetuses. Br J
Obstet Gynaecol 1988; 95:65-69.

13 (14) Tsyvian P, Malkin K, Artemieva O, Wladimiroff JW. Assessment of left ventricular
filling in normally grown fetuses, growth-resticted fetuses and fetuses of diabetic mothers.
Ultrasound Obstet Gynecol 1998; 12:33-38.
(15) Gutgesell HP, Mullins CE, Gillette PC, Speer M, Rudolph AJ, McNamara DG.
Transient hypertrophic subaortic stenosis in infants of diabetic mothers. J Pediatr 1976;
89:120-125.
(16) Gutgesell HP, Speer ME, Rosenberg HS. Characterization of the cardiomyopathy in
infants of diabetic mothers. Circulation 1980; 61:441-450.
(17) Way GL, Wolfe RR, Eshaghpour E, Bender RL, Jaffe RB, Ruttenberg HD. The natural
history of hypertrophic cardiomyopathy in infants of diabetic mothers. J Pediatr 1979;
95:1020-1025.
(18) Zielinsky P, Hagemann LL, Daudt L, Behle I. A pre and postnatal analysis of factors
associated with fetal myocardial hypertrophy in diabetic pregnancies. Journal of Maternal
Fetal Investigation 1992; 2: 163- 167.
(19) Sheehan PQ, Rowland TW, Shah BL, McGravey VJ, Reiter EO. Maternal diabetic
control and hypertrophic cardiomyopathy in infants of diabetic mothers. Clin Pediatr 1986;
25:266-271.
(20) Mace S, Hirschfeld SS, Riggs T, Fanaroff AA, Merkatz IR. Echocardiographic
abnormalities in infants of diabetic mothers. J Pediatr 1979; 95:1013-1019.
(21) Oberhoffer R, Hogel J, Stoz F, Kohne E, Lang D. Cardiac and extracardiac
complications in infants of diabetic mothers and their relation to parameters of
carbohydrate metabolism. Eur J Pediatr 1997; 156:262-265.
(22) Deorari AK, Saxena A, Singh M, Shrivastava S. Echocardiographic assessment of
infants born to diabetic mothers. Arch Dis Child 1989; 64:721-724.
(23) Weber HS, Botti JJ, Baylen BG. Sequential longitudinal evaluation of cardiac growth
and ventricular diastolic filling in fetuses of well controlled diabetic mothers. Pediatr Cardiol
1994; 15:184-189.
(24) Rizzo G, Arduini D, Romanini C. Accelerated cardiac growth and abnormal cardiac
flow in fetuses of type I diabetic mothers. Obstet Gynecol 1992; 80:369-376.
(25) Rizzo G, Arduini D, Romanini C. Cardiac function in fetuses of type I diabetic mothers.
Am J Obstet Gynecol 1991; 164:837-843.

14 (26) Rizzo G, Arduini D, Capponi A, Romanini C. Cardiac and venous blood flow in
fetuses of insulin-dependent diabetic mothers: evidence of abnormal hemodynamics in
early gestation. Am J Obstet Gynecol 1995; 173:1775-1781.
(27) Rizzo G, Pietropolli A, Capponi A, et al. Echocardiographic studies of the fetal heart. J
Perinat Med 1994; 22:46-49.
(28) Firpo C, Zielinsky P. Mobility of the flap valve of the primary atrial septum in the
developing human fetus. Cardiol Young 1998; 8:67-70.
(29) O' Sullivan JB, Mahan CM. Criteria for the oral glucose tolerance test in pregnancy.
Diabetes 1964; 13:278-285.
(30) Sabbagha RE, Hughey M. Standardization of sonar cephalometry and gestacional
age. Obstet Gynecol 1978; 52:402-406.
(31) Hohler CW, Quetel TA. Fetal femur lenght: equations for computer calculation of
gestacional age from ultrasound measurements. Am J Obstet Gynecol 1982; 143:479-482.
(32) Firpo C, Hoffman JIE, Silverman NH. Evaluation of fetal heart dimensions from 12
weeks to term. Am J Cardiol 2001;87:594-600.
(33) Relles MD, Kaplan S. Hypertrophic cardiomyopathy in infants of diabetic mothers: an
update. Am J Cardiol 1998; 5:353-358.
(34) Menezes HS, Barra M, Belló AR, et al. Fetal Myocardial Hypertrophy in an
Experimental Model of Gestational Diabetes. Cardiol Young 2001;11(6):609-13.
(35) Miyague NI, Ghidini A, Miyague LLT. Fetal breathing movements are associated with
changes in compliance of the left ventricle. Fetal Diagn Ther 1997; 12:72-75.
(36) van der Mooren K, Barendregt LG, Wladimiroff JW. Fetal atrioventricular and outflow
tract flow velocity waveforms during normal second half of pregnancy. Am J Obstet
Gynecol 1991; 165:668-674.
(37) Rizzo G, Pietropolli A, Capponi A, Cacciatore C, Arduini D, Romanini C. Analysis of
factors influencing ventricular filling patterns in fetuses of type I diabetic mothers. J Perinat
Med 1994; 22:149-157.
(38) Macklon NS, Hop WCJ, Wladimiroff JW. Fetal cardiac function and septal thickness in
diabetic pregnancy: a controlled observational and reproducibility study. Br J Obstet
Gynaecol 1998; 105:661-666.
(39) Hong Y, Choi J. Doppler study on pulmonary venous flow in the human fetus. Fetal
Diagn Ther 1999; 14:86-91.

15 (40) Papa M, Camesasca C, Santoro F, et al. Fetal echocardiography in detecting
anomalous pulmonary venous connection: four false positive cases. Br Heart J 1995;
73:355-358.
(41) Brezinka C, Laudy JA, Ursem NT, Hop WC, Wladimiroff JW. Fetal pulmonary venous
flow into the left atrium relative to diastolic and systolic cardiac time intervals. Ultrasound
Obstet Gynecol 1999;13(3):191-5.
(42) Kiserud T, Rasmussen S, Skulstad S. Blood flow and the degree of shunting through
the ductus venosus in the human fetus. Am J Obstet Gynecol 2000;182(1Pt.I):147-53.
(43) Nishimura RA, Appleton CP, Redfield MM, Holmes DR, Tajik AJ. Noninvasive
Doppler echocardiographic evaluation of left ventricular filling pressures in patients with
cardiomyopathies: a simultaneous Doppler echocardiographic and cardiac catheterization
study. J Am Coll Cardiol 1996; 28:1226-1233.
(44) Briguori C, Betocchi S, Losi MA, et al. Noninvasive evaluation of left ventricular
diastolic function in hypertrophic cardiomyopathy. Am J Cardiol 1998; 81:180-187.

Autor: Silvia Goldmeier
Orientador: Prof. Dr. Iran Castro
Título: A Teoria do Autocuidado no Manejo dos Fatores de Risco
(Obesidade, Hipertensão e Tabagismo) em Pacientes Pós-Infarto Agudo
do Miocárdio.
RESUMO
Fundamentação − Conseqüentemente, há uma grande lacuna a ser
ocupada entre as terapêuticas, considerando-se a prevenção como a
alternativa recomendada. A prevenção dos FR, em pacientes com DAC
estabelecida, está de acordo com a Teoria do Autocuidado, baseada em
ações conjuntas desenvolvidas pelo enfermeiro, a partir da necessidade
de autocuidado do paciente e de sua capacidade e motivação para
executar as atividades necessárias.
Objetivo − Avaliar a efetividade na redução de fatores de risco para
DAC estabelecida, em pacientes internados em uma UTI cardiológica
através da adição de um programa de enfermagem ao tratamento
convencional, tendo como fundamento a Teoria do Autocuidado.
Metodologia − Trata-se de um ensaio clínico randomizado, em uma
população composta de 74 pacientes com primeiro infarto agudo do
miocárdio. A intervenção (Grupo A) constituiu-se de um programa de
ações educativas de enfermagem. O grupo controle (Grupo B) foi
tratado convencionalmente, sem a intervenção de enfermagem. Os FR
analisados e submetidos à intervenção foram obesidade, hipertensão
arterial e tabagismo.

Resultados − A idade da população variou de 36 a 69 anos. A
predominância foi do sexo masculino (78%). Observou-se que, após a
intervenção de enfermagem (Grupo A), através do programa de Ações
Educativas de Enfermagem, os pacientes deste grupo tiveram uma
redução no número dos FR, comparados ao Grupo B (p<0,014). O
número de fumantes, no grupo de intervenção adicional de
enfermagem, foi significativamente menor (p <0,003) que no grupo
controle, observando-se redução de 85% no grupo com intervenção
contra 33,33% no grupo controle.
Conclusão − A prevenção é uma medida de ação de saúde necessária e
imprescindível no combate aos FR para DAC. O programa de intervenção
de enfermagem implementado na redução dos FR foi efetivo, de baixo
custo, de metodologia simples e de boa resolutividade. Somado às
intervenções médicas, pode contribuir na redução da mortalidade por
DAC.
ABSTRACT
Objective – To evaluate the effectiveness of reducing risk factors for
established CAD, by adding a nursing program to conventional
treatment based on the Theory of Self-Care.
Methodology – This is a randomized clinical trial in a population
consisting of 74 patients who have had a first myocardial infarction. The
intervention (Group A) was a program of educational nursing actions.
The control group (Group B) was treated conventionally, without nursing
intervention. The RF analyzed and submitted to intervention were
obesity, hypertension and smoking.

Results − The age of the population ranged from 36 to 69 years. Males
predominated (78%). It was observed that after nursing intervention
(Group A), through the program of Educational Nursing Actions, the
patients in this group had a reduced number of RF compared to Group B
(p<0.0140. The number of smokers in the group with additional nursing
interventions, was significantly smaller (p<0.003) than in the control
group, with an 85% reduction in the intervention group as compared to
33.33% in the control group.
Conclusion − Prevention is a necessary and indispensable health action
in fighting RF for CAD. The nursing intervention program implemented in
reducing RF was effective, low cost, with a simple methodology and
good resolution capacity. Added to medical interventions it may help
reduce mortality caused by CAD.

Autora: Márcia D. Pedone
Orientador: Prof. Dr. Iran Castro
Título: Variações da Função Diastólica do Ventrículo Esquerdo de
Acordo com a Idade Através da Ecocardiografia com Doppler Tissular
RESUMO
Objetivo – Determinar a correlação entre as velocidades diastólicas do
Doppler tissular com a idade em uma amostra de adultos saudáveis.
Como objetivo secundário, correlacionar a idade com as velocidades do
fluxo transmitral e de veias pulmonares.
Métodos - Foram estudados, através da ecocardiografia, 51 indivíduos
saudáveis, com idade entre 21 e 69 anos. Foram registradas as
velocidades miocárdicas diastólicas ao Doppler tissular e determinadas
as velocidades dos fluxos transmitral e venoso pulmonar. A associação
com a idade foi demonstrada através de correlações e teste t para
amostras independentes. O alfa crítico considerado foi de 0,05.
Resultados – As velocidades miocárdicas diastólicas iniciais septal
basal e lateral basal apresentaram correlação inversa com a idade, com
r = - 0,40 (p = 0,004) e r = - 0,60 (p = 0,0001) respectivamente. As
velocidades atriogênicas do Doppler tissular foram diretamente
correlacionas com a idade, sendo no segmento septal basal r = 0,56 (p
= 0,0001) e no segmento lateral basal r = 0,50 (p = 0,0001). As
velocidades do fluxo transmitral e do fluxo venoso pulmonar também
mostraram correlação com a idade.
Conclusão – Existe correlação entre a idade e as velocidades
miocárdicas diastólicas do Doppler tissular, bem como com as
velocidades do fluxo transmitral e fluxo venoso pulmonar. Desta forma,

foi demonstrada em indivíduos saudáveis uma variação de parâmetros
da função diastólica do ventrículo esquerdo com a evolução natural.
ABSTRACT
Objective – To determine the correlation between the diastolic
velocities of Tissue Doppler and age in a sample of healthy adults. The
secondary objective is to correlate age with velocities of the transmitral
and pulmonary vein flows.
Methods – Fifty-one healthy individuals were studied by
echocardiography, aged from 21 to 69 years. The diastolic myocardial
velocities using Tissue Doppler technique and the velocities of the
transmitral and pulmonary venous flows were recorded. The association
with age was shown by correlations and a t test for independent
samples. The critical alpha considered was 0.05.
Results – The early septal basal and lateral basal diastolic myocardial
velocities presented a reverse correlation with age, with respectively r =
- 0.40 (p = 0.004) e r = - 0.60 (p = 0.0001). The atriogenic Tissue
Doppler velocities were directly correlated to age r = 0.56 (p = 0.0001)
in the septal basal segment and r = 0.50 (p = 0.0001) in the basal
lateral segment. The velocities of transmitral flow and of pulmonary
venous flow also showed a correlation with age.
Conclusion – There is a correlation between age and diastolic
myocardial velocities in tissue doppler, as well as with the transmitral
flow and pulmonary venous flow velocities. thus, a variation was
demonstrated in the parameters of left ventricle diastolic function with
natural evolution.
Autora: Maria Amélia B. Hatem
Orientador: Prof. Dr. Iran Castro
Título: Correlação e concordância entre medidas ecocardiográficas
obtidas durante o exame no ecocardiógrafo, com medidas de imagens
digitalizadas em estação de trabalho dedicada.
RESUMO
Objetivo – Avaliar a correlação e a concordância entre medidas de
análise ecocardiográficas das dimensões cardíacas ao modo M e
bidimensional, obtidas através do aplicativo “Echo off-line” (programa
para obtenção de medidas de imagens digitalizadas em estação de
trabalho dedicada), desenvolvido em nosso meio e de baixo custo, com
as medidas realizadas convencionalmente (Conv), durante a realização
rotineira dos exames.
Métodos – Estudo transversal, contemporâneo, com seleção aleatória,
em 56 pacientes, cujas imagens foram capturadas durante a realização
de exame ecocardiográfico. Através do programa “Echo off-line” foram
mensuradas (em modo M e bidimensional) as medidas do diâmetro
sistólico e diastólico do ventrículo esquerdo, as espessuras parietais do
septo e parede posterior, do átrio esquerdo e aorta. Estas medidas
foram comparadas às realizadas convencionalmente durante a
realização de exames por outro ecocardiografista, através de
correlações e análise de concordância descrita por Bland e Altman. O
alfa crítico considerado foi de 0,05.
Resultados – As mensurações realizadas no sistema “Echo off-line”
mostraram índice de correlação variando de 0,85 a 0,98 (Correlação de
Pearson) para todas as variáveis estudadas, em ambos os métodos. A
análise de concordância mostrou que, para a grande maioria das
medidas, a diferença média entre os métodos foi muito próxima a zero,
demonstrando concordância adequada. A variação de valores absolutos,
para a maioria das medidas, não apresentou significância clínica. A
reprodutibilidade do método (intra-observador) mostrou-se adequada.
Discussão – A utilização desta ferramenta de medida em estação de
trabalho dedicada permitiu demonstrar índices de correlação
comparáveis aos dos outros trabalhos já descritos em literatura, além
de bons índices de reprodutibilidade das medidas intra-observadores.
Esta ferramenta foi desenvolvida no nosso meio, sendo aplicável a
programa de laudos, utilizando-se apenas um computador pessoal em
placa de captura de imagem. Seu baixíssimo custo, comparado a outras
estações de trabalho importadas, já existentes no mercado, possibilita
uma ampla utilização, praticamente sem custos significantes.
Conclusão – Existe correlação direta e adequada concordância entre as
medidas ecocardiográficas das dimensões cardíacas realizadas pelo
modo M e bidimensional, obtidas através do programa “Echo off-line”,
para obtenção de medidas de imagens digitalizadas em estação de
trabalho dedicada, com as medidas realizadas convencionalmente,
podendo este programa ser utilizado rotineiramente nos laboratórios de
ecocardiografia.
ABSTRACT
Background - Several studies have analyzed the correlation between
digital and standard echocardiography videotape images. The
advantages of the digital echocardiography are providing a faster exam,
reducing its costs and upgrading the number of exams performed. Our
study intends to evaluate the correlation and agreement between
cardiac dimensions measures of M and two-dimensional

echocardiography, by the “Echo off line” program, and by standard
echocardiography.
Methods - Transversal, randomized study, in 56 patients, whose
images were acquired during an echocardiographic examination. The left
ventricle systolic and diastolic chamber diameters, the parietal septum
and posterior wall thickness, and left atrium and aorta diameters
measures were obtained by the “Echo off line” program. These
measures were compared to those acquired in the standard method by
other sonographer, through correlation and agreement analysis
described by Bland and Altman. R Values <.05 were considered to be
significant.
Results - The correlation index between the methods varied from 0, 85
to 0, 98 (Pearson’s Index), for every studied variable. The analysis
showed that, for most of the measures, the mean difference between
the methods was close to zero, evidencing an adequate agreement. The
variability of absolute values, for most measures, did not have clinical
significance. The method’s reproducibility (intraobserver) was adequate.
The use of this measurement tool allowed the demonstration of
correlation indexes similar to those in the consulted literature, besides
the adequate reproducibility indexes of the intraobserver measures. Its
low cost, compared to other foreign workstations already in the market,
allows a wide use of it without significant costs.
Conclusion - There is a direct correlation and an adequate agreement
between M and two-dimensional echocardiography measures of the
evaluated cardiac dimensions, obtained by the “Echo off line” program
and by the standard videotape-based method. The “Echo off line”
program can be used as a routine in the echocardiography laboratories.
Autora: Maria Antonieta Moraes
Orientador: Prof. Dr. Ivo Behle
Título: Aferição da Taxa de Eritroblastos e dos Parâmetros do Equilíbrio
Acidobásico no Sangue da Veia Umbilical no Nascimento Capacitação da
Enfermagem na Aplicação da Metodologia.
RESUMO
Objetivo – Identificar os fatores que dificultam a implementação
rotineira da aferição da taxa dos eritroblastos e parâmetros do equilíbrio
acidobásico no sangue da veia umbilical. Como objetivo secundário,
avaliar as repercussões de um treinamento sobre a efetividade da
metodologia.
Pacientes e Método – Ensaio clínico observacional, com 1204
parturientes divididas em três amostras: A – observação; B –
intervenção; C – observação. Foi coletado sangue da veia umbilical em
duas seringas. Os parâmetros analisados na seringa 1 foram: pH, PO2,
PCO2 e o estado acidobásico. Na seringa 2 foram quantificadas as
células das séries branca e vermelha. Ao final das três etapas, os
resultados foram comparados entre si.
Resultados – A maioria das falhas detectadas na amostra A esteve
relacionada com fatores administrativos e disciplinares da metodologia.
A análise dos resultados do EAB mostrou que houve redução
significativa no número de exames inadequados − 43,76% na amostra
A para 25,82% na amostra C (p=0,003). A efetividade desta
metodologia aumentou em 24,19%. A Análise dos resultados do
hemograma mostrou que houve redução significativa de casos com
material inadequado − 38,72% na amostra A para 24,81% na amostra C
(p=<0,001). Casos em que os eritroblastos deixaram de ser calculados
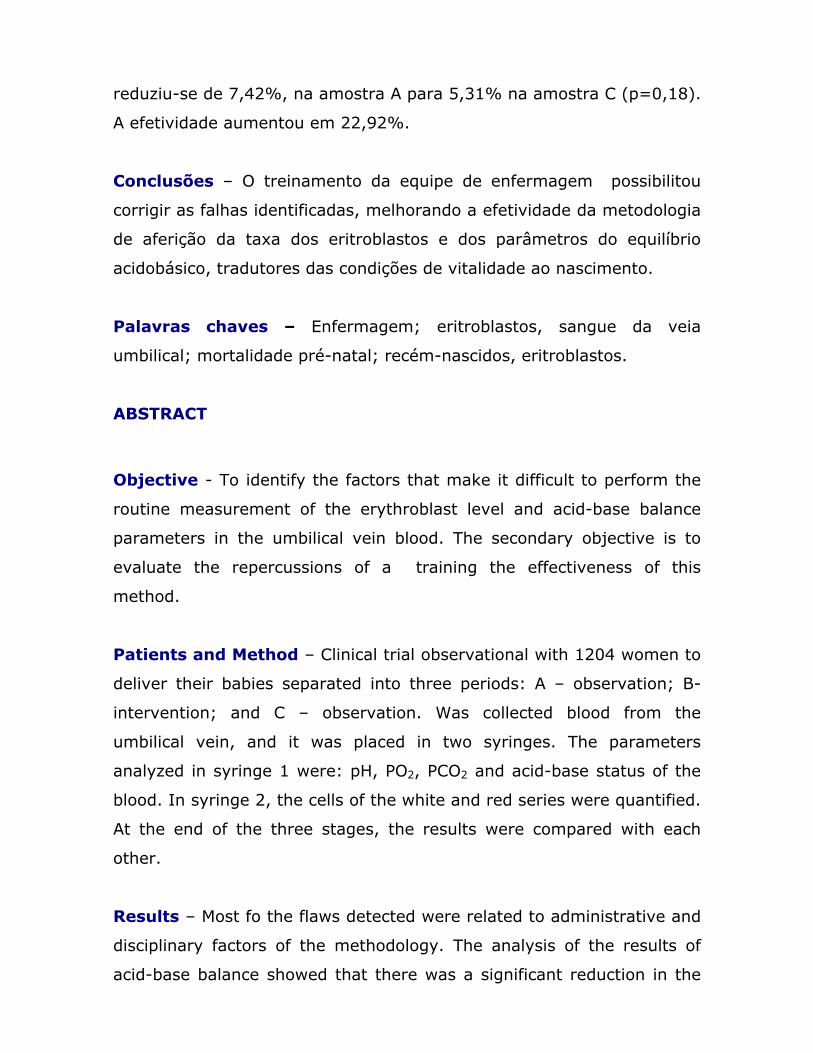
reduziu-se de 7,42%, na amostra A para 5,31% na amostra C (p=0,18).
A efetividade aumentou em 22,92%.
Conclusões – O treinamento da equipe de enfermagem possibilitou
corrigir as falhas identificadas, melhorando a efetividade da metodologia
de aferição da taxa dos eritroblastos e dos parâmetros do equilíbrio
acidobásico, tradutores das condições de vitalidade ao nascimento.
Palavras chaves – Enfermagem; eritroblastos, sangue da veia
umbilical; mortalidade pré-natal; recém-nascidos, eritroblastos.
ABSTRACT
Objective - To identify the factors that make it difficult to perform the
routine measurement of the erythroblast level and acid-base balance
parameters in the umbilical vein blood. The secondary objective is to
evaluate the repercussions of a training the effectiveness of this
method.
Patients and Method – Clinical trial observational with 1204 women to
deliver their babies separated into three periods: A – observation; B-
intervention; and C – observation. Was collected blood from the
umbilical vein, and it was placed in two syringes. The parameters
analyzed in syringe 1 were: pH, PO2, PCO2 and acid-base status of the
blood. In syringe 2, the cells of the white and red series were quantified.
At the end of the three stages, the results were compared with each
other.
Results – Most fo the flaws detected were related to administrative and
disciplinary factors of the methodology. The analysis of the results of
acid-base balance showed that there was a significant reduction in the

number of tests whose blood was not adequate for processing – 43.76%
in sample A to 25.82% in sample C (p=0.003). The effectiveness of this
methodology increased by 24.19%.
The analysis of the hemogram results showed that there was a
significant reduction in the number of cases inadequate material -
38.72% in sample A to 24.81% in sample C (p=<0.001). Cases in which
the erythroblast was not calculated were reduced from 7.42% in
sample A to 5.31% in sample C (p=0.18). The effectiveness increased
by 22.92%.
Conclusions: The purpose of training the nursing team made it possible
to correct the flaws identify, well as to improve the effectiveness of the
methodology used to measure of the erythroblast level and acid-base
balance parameters employed to evaluate the vital conditions at birth.
Keywords – Nursing care; erythroblasts; prenatal care; mortality;
infant, newborn; umbilical veins

Autor: Marcelo Kern
Orientador: Prof. Dr. João Ricardo Sant’Anna
Título: O Uso do Balão Intra-Aórtico no Pré-Operatório de Cirurgia de
Revascularização Miocárdica Associada à Disfunção Ventricular Grave.
RESUMO
Introdução - Pacientes com indicação de revascularização miocárdica,
apresentando lesão de tronco de coronária esquerda, angina instável,
revascularização cirúrgica prévia ou disfunção ventricular grave, são
considerados de maior risco operatório. Nos últimos 10 anos, os efeitos
fisiológicos do balão intra-aórtico (BIAo) foram vistos como de grande
valia na proteção miocárdica, nos pacientes em maior risco. O uso pré-
operatório do BIAo foi testado e reconhecido como capaz de reduzir a
mortalidade e a taxa de complicações pós operatórias nos pacientes que
apresentavam dois ou mais dos fatores de risco operatório.
Objetivo - O objetivo deste estudo foi de avaliar a efetividade do BIAo,
em uso pré-operatório de cirurgia de revascularização miocárdica (CRM)
eletiva, em prevenir o infarto trans ou pós-operatório e em reduzir a
mortalidade intra-hospitalar, em pacientes com baixa fração de ejeção
ventricular esquerda.
Pacientes e Métodos - Foram analisados 239 pacientes com fração de
ejeção do ventrículo esquerdo inferior ou igual a 40%, submetidos à
CRM eletiva com circulação extracorpórea (CEC), no período
compreendido entre março de 1995 a fevereiro de 2001.
Resultados - Destes, 58 pacientes receberam BIAo pré-operatório e os
demais foram operados sem assistência circulatória (grupo controle). Os
dois grupos de pacientes tinham características semelhantes quanto a
fatores associados aos desfechos em questão. Ocorreram 5 (8,6%)

óbitos no grupo com BIAo e 21 (11,6%) no grupo controle (diferença
não-significativa). Ocorreram 2 (3,4%) infartos no grupo com BIAo 28
(15,5%) no grupo controle BIAo (P<0,05), risco relativo de 0,22 com
intervalo de confiança de 95% de 0,05 a 0,85.
Conclusão - o BIAo em uso pré-operatório reduz de forma significativa
o risco de IAM trans ou pós-operatório em pacientes com função
sistólica diminuída.
ABSTRACT
Background - Patients undergoing coronary artery bypass grafting
(CABG), with poor left ventricular function, unstable angina, reoperative
coronary surgery (redo CABG) and with severe left main stem coronary
stenosis are considered as being in higher surgical risk. In the last 10
years the intraaortic balloon pump (IABP) physiological effects have
been evaluated as being a beneficial myocardial protection for patients
at higher surgical risk. Preoperative insertion of IABP has been tested
and proved to be a valid modality, both to improve mortality and post
operative complications rates and to reduce costs, in patients presenting
two or more operative risk factors.
Objective - The objective of this study was to assess the efficiency of
preoperative use of IABP in elective CABG surgery in reducing in-
hospital mortality and postoperative myocardial infarction in patients
with left ventricular ejection fraction less or equal to 40%.
Methods - Between March 1995 and February 2001, a total of 239
patients undergoing elective CABG using cardiopulmonary bypass, with
left ventricular ejection fraction less or equal to 40% were analyzed.
Fifty eight of those patients received preoperative IABP. Remaining

patients were operated without this circulatory assistence. Both groups
were similar concerning the factors associated to the end-points.
Results - The mortality was 8,6% (5 patients) in the IABP group and
11,6%(21 patients) in the group that did not use preoperative IABP
(P>0,05). The rate of myocardial infarction in the IABP group was 3,4%
(2 patients) as opposed to 15,5% (28 patients) in the group of patients
who did not receive preoperative IABP (P<0,05).
Conclusion - The preoperative insertion of the IABP significantly
reduces the risk of trans and post operative myocardial infarction in
elective CABG patients with poor left ventricular function.
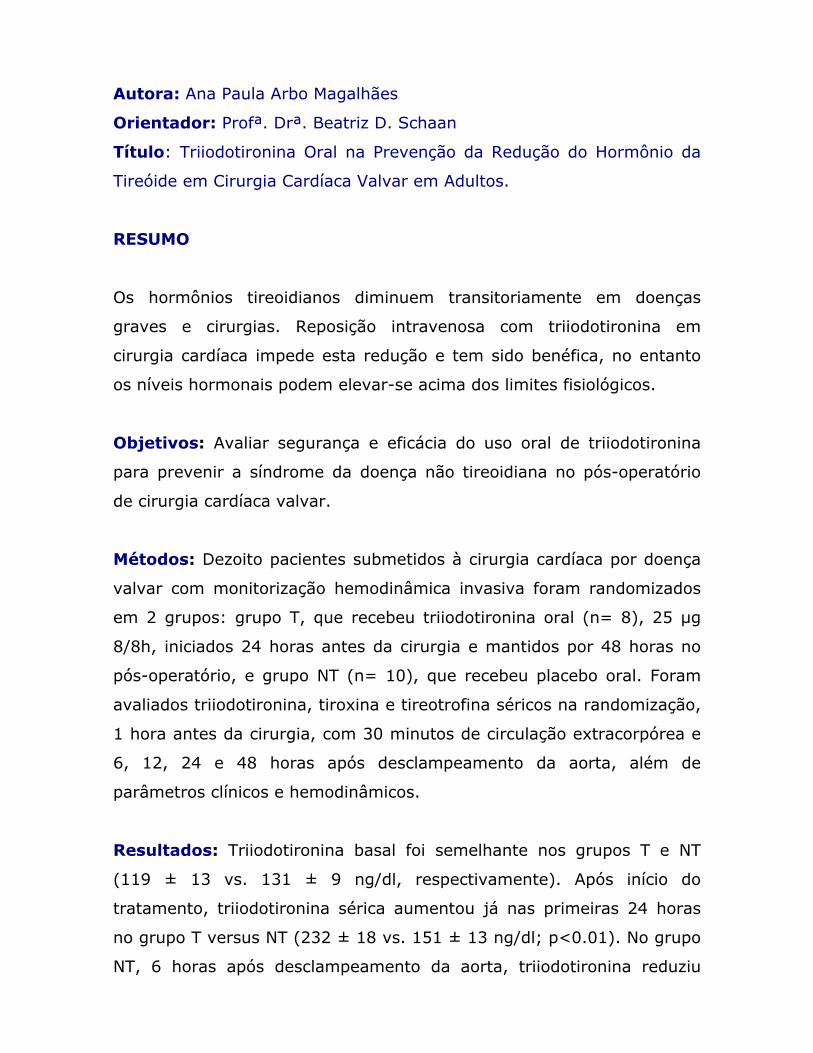
Autora: Ana Paula Arbo Magalhães
Orientador: Profª. Drª. Beatriz D. Schaan
Título: Triiodotironina Oral na Prevenção da Redução do Hormônio da
Tireóide em Cirurgia Cardíaca Valvar em Adultos.
RESUMO
Os hormônios tireoidianos diminuem transitoriamente em doenças
graves e cirurgias. Reposição intravenosa com triiodotironina em
cirurgia cardíaca impede esta redução e tem sido benéfica, no entanto
os níveis hormonais podem elevar-se acima dos limites fisiológicos.
Objetivos: Avaliar segurança e eficácia do uso oral de triiodotironina
para prevenir a síndrome da doença não tireoidiana no pós-operatório
de cirurgia cardíaca valvar.
Métodos: Dezoito pacientes submetidos à cirurgia cardíaca por doença
valvar com monitorização hemodinâmica invasiva foram randomizados
em 2 grupos: grupo T, que recebeu triiodotironina oral (n= 8), 25 µg
8/8h, iniciados 24 horas antes da cirurgia e mantidos por 48 horas no
pós-operatório, e grupo NT (n= 10), que recebeu placebo oral. Foram
avaliados triiodotironina, tiroxina e tireotrofina séricos na randomização,
1 hora antes da cirurgia, com 30 minutos de circulação extracorpórea e
6, 12, 24 e 48 horas após desclampeamento da aorta, além de
parâmetros clínicos e hemodinâmicos.
Resultados: Triiodotironina basal foi semelhante nos grupos T e NT
(119 ± 13 vs. 131 ± 9 ng/dl, respectivamente). Após início do
tratamento, triiodotironina sérica aumentou já nas primeiras 24 horas
no grupo T versus NT (232 ± 18 vs. 151 ± 13 ng/dl; p<0.01). No grupo
NT, 6 horas após desclampeamento da aorta, triiodotironina reduziu

24% (p=0.007), confirmando a síndrome da doença não tireoidiana.
Não houve diferença estatística nos parâmetros hemodinâmicos, exceto
aumento de freqüência cardíaca no grupo T 24 horas após
desclampeamento da aorta (p=0.01).
Conclusões: Administração de triiodotironina oral previne a síndrome
da doença não tireoidiana após cirurgia cardíaca valvar em adultos de
uma forma fisiológica e segura, por período maior que com uso
intravenoso.

Autora: Elizabeth Duarte
Orientador: Profª. Drª. Vera L. Portal
Título: Associação do perfil lipídico, da proteína C reativa ultra sensível,
do fibrinogênio e da glicemia com a evolução intra e pós-hospitalar de
pacientes com síndrome isquêmica agudas.
RESUMO
Objetivo – Correlacionar o perfil lipídico, a proteína C ultra-sensível
(PCR us), o fibrinogênio e a glicose com a evolução intra e pós-
hospitalar de pacientes com Síndrome Isquêmica Aguda (SIA).
Adicionalmente, descrever o perfil clínico dos pacientes e os preditores
de mortalidade nesta população.
Métodos – Estudo de coorte contemporâneo, com 199 pacientes com
SIA (Angina Instável, IAM sem supradesnivelamento de ST, IAM) que
internaram na unidade de terapia intensiva (UTI) do Instituto de
Cardiologia do Rio Grande do Sul, no período de março a novembro de
2002. Foram registradas as doenças prévias, as medicações em uso e os
fatores de risco. Os pacientes foram acompanhados, durante a
internação, considerando os seguintes eventos clínicos: Re-IAM, angina
pectoris, insuficiência cardíaca (IC), arritmia (fibrilação atrial,
taquicardia atrial paroxística, extrassístoles ventriculares e
supraventriculares, bloqueio átrio-ventricular), fibrilação ventricular
(parada cardiorrespiratória recuperada) e óbito. Após o primeiro mês da
alta hospitalar, os pacientes foram contatados por telefone e o
prontuário clínico foi revisado, buscando eventos pós-hospitalares:
angina, IC, re-internação por eventos clínicos (angina, IC, Re-IAM) e re-
internação para procedimentos (angioplastia transluminal percutânea –
ACTP e cirurgia de revascularização miocárdica – CRM).

Resultados – Neste estudo, a PCR us correlacionou-se,
significativamente, com os eventos intra-hospitalares (p=0,03), mas
não se correlacionou com os eventos pós-hospitalares (p=0,19). O perfil
lipídico e o fibrinogênio não mostraram correlação estatisticamente
significativa em nenhum dos momentos avaliados. A glicemia alterada
correlacionou-se significativamente com eventos intra (p=0,00) e pós-
hospitalares (p=0,01). Os fatores de risco clássicos presentes e a faixa
etária não mostraram associação estatisticamente significativa com os
eventos intra e pós-hospitalares. Entre as doenças prévias, apenas CRM
prévia teve diferença estatisticamente significativa entre os eventos
intra-hospitalares (p=0,005), o mesmo não ocorrendo com os eventos
pós-hospitalares (p=0,47). O uso prévio de inibidores da enzima
conversora de angiotensina (IECA) associou-se com a redução de
eventos pós-hospitalares com um risco relativo de 0,42 (IC 0,21-0,84
p=0,017). O choque cardiogênico (p=0,00), ACTP prévia (p=0,03), CRM
prévia (p=0,03), IC prévia (p=0,01) e ser tabagista (p=0,03) foram
preditores de mortalidade hospitalar.
Conclusão – Entre os fatores analisados, a PCR us correlacionou-se
com eventos intra-hospitalares, e a glicemia alterada esteve associada
com a maior incidência de eventos intra e pós-hospitalares. A CRM
prévia contribuiu para mais eventos intra-hospitalares. O choque
cardiogênico, ACTP e CRM prévias, IC prévia e tabagismo foram
preditores de mortalidade hospitalar.
ABSTRACT
Objective: To correlate the lipid panels, the ultra-sensitive C Protein,
the fibrinogen and the glucose with the intra and post hospital evolution
of patients with acute ischemic syndrome (AIS). Furthermore, to

describe the clinical profile of the patients and the mortality predictors in
this population.
Methods − A contemporary Cohort Study on 199 patients with AIS
(unstable angina, AMI without elevation of the ST segment, AMI) that
were admitted in the Intensive Care Unit (ICU) of the Cardiology
Institute of Rio Grande do Sul, from March to November of 2002. The
previous diseases, the medications in use and the risk factors have been
recorded. The patients were followed during their hospitalization, taking
into consideration the following clinical events: re- AMI, angina pectoris,
heart failure (HF), arrhythmias (atrial fibrillation, paroxysmal atrial
tachycardia, ventricular and supraventricular parasystole,
atrioventricular blocks), ventricular fibrillation ( reverted cardio-
respiratory arrest) and death. After the first month of hospital
discharge, the patients were contacted by phone and the clinical charts
were reviewed in order to find post-hospital events: angina, heart failure
(HF), re-admittance due to clinical events (angina, HF, re-AMI) and re-
admittance for some procedures (Percutaneous Transluminal
Angioplasty- PTA- and Myocadial Revascularization Surgery- MRS ).
Results − In this study, the ultra-sensitive reactive C protein has
significantly correlated with the intra-hospital events (p=0.03), but not
with the post-hospital events (p=0.19). The lipid panel and the
fibrinogen didn’t show any significant statistical correlation in none of
the evaluated moments. The altered glycemia has significantly
correlated with the intra (p=0.00) and post (p=0.01) hospital events.
The present classic risk factors and the age range didn’t show any
significant statistical association with the intra and post-hospital events.
Among the previous diseases, only the previous MRS showed a
significant statistical difference between the intra-hospital events
(p=0.05); but the same didn’t happened to the post-hospital events
(p=0.47). The previous use of angiotensin-converting enzyme risk of
0,42 (HF 0.21-0.84 p=0.017). The cardiogenic shock (p=0,00), previous
PTA (p=0.03), previous MRS (p=0.03), previous HF (p=0.01) and being
a smoker (p=0.03) were predictors for hospital mortality.
Conclusion − The ultra-sensitive reactive C protein correlated with the
intra-hospital events and the altered glycemia was associated with a
greater occurrence of intra and post-hospital events, considering all the
analyzed factors. The previous MRS contributed to more intra-hospital
events. The cardiogenic shock, the previous PTA and MRS, the previous
HF and smoking were predictors of hospital mortality.
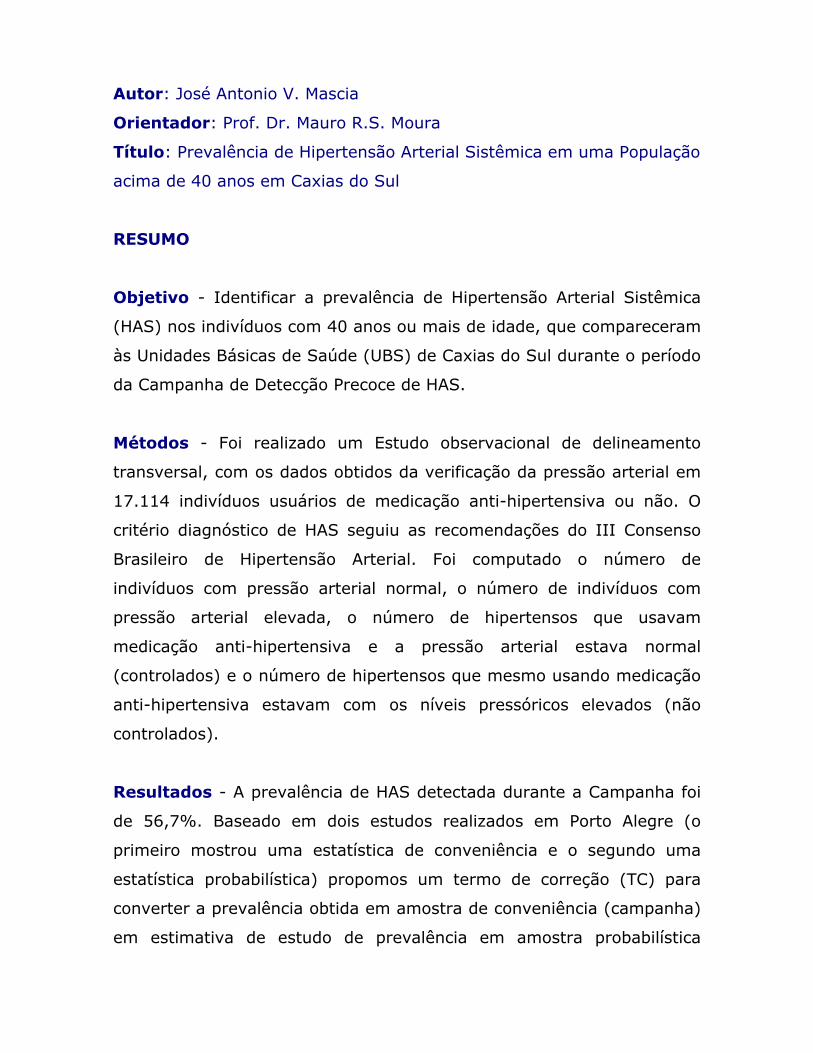
Autor: José Antonio V. Mascia
Orientador: Prof. Dr. Mauro R.S. Moura
Título: Prevalência de Hipertensão Arterial Sistêmica em uma População
acima de 40 anos em Caxias do Sul
RESUMO
Objetivo - Identificar a prevalência de Hipertensão Arterial Sistêmica
(HAS) nos indivíduos com 40 anos ou mais de idade, que compareceram
às Unidades Básicas de Saúde (UBS) de Caxias do Sul durante o período
da Campanha de Detecção Precoce de HAS.
Métodos - Foi realizado um Estudo observacional de delineamento
transversal, com os dados obtidos da verificação da pressão arterial em
17.114 indivíduos usuários de medicação anti-hipertensiva ou não. O
critério diagnóstico de HAS seguiu as recomendações do III Consenso
Brasileiro de Hipertensão Arterial. Foi computado o número de
indivíduos com pressão arterial normal, o número de indivíduos com
pressão arterial elevada, o número de hipertensos que usavam
medicação anti-hipertensiva e a pressão arterial estava normal
(controlados) e o número de hipertensos que mesmo usando medicação
anti-hipertensiva estavam com os níveis pressóricos elevados (não
controlados).
Resultados - A prevalência de HAS detectada durante a Campanha foi
de 56,7%. Baseado em dois estudos realizados em Porto Alegre (o
primeiro mostrou uma estatística de conveniência e o segundo uma
estatística probabilística) propomos um termo de correção (TC) para
converter a prevalência obtida em amostra de conveniência (campanha)
em estimativa de estudo de prevalência em amostra probabilística

(populacional). Após utilizar o TC, a prevalência de HAS resultou em
32,3%.
Conclusão – A Hipertensão Arterial Sistêmica é uma doença de alta
prevalência. O resultado da prevalência obtida após o termo de
correção, coincide com o estudo de prevalência de base populacional,
realizado recentemente em nosso Estado.
Palavras-chave: hipertensão arterial sistêmica, epidemiologia,
prevalência.
ABSTRACT
Objective – To identify the prevalence of Systemic High Blood Pressure
(HBP) in 40+ year-old individuals, who went to the Health Basic Units
(HBU) of Caxias do Sul during the period of the HBP Early Diagnosis
Campaign.
Methods - An observational study of transversal outline was made with
data from hypertension check of 17,114 individuals, whether they were
under an anti-hypertensive medication or not. The HBP diagnosis criteria
followed the recommendations of the III Brazilian Consensus of Arterial
Hypertension. The number of individuals with normal blood pressure
was computed, and also the number of individuals with high blood
pressure and the number of individuals that were under medication and
showed normal blood pressure (controlled) and the number of
hypertensive patients that, although under anti-hypertensive
medication, showed high levels of pressure (non-controlled).
Results – The HBP prevalence detected during the Campaign was of
56,7%. Based on two studies that have been made in Porto Alegre (the

first one showed a convenience statistics and the second one a
probabilistic one) we propose a correction term (CT) to convert the
prevalence obtained in the convenience sample (campaign) into an
estimate of prevalence study in probabilistic sample (populational). After
make use of CT, the HBP prevalence was resulted in 32,3%.
Conclusion – The HBP is a disease of high prevalence. The prevalence
result obtained, after the correction term, is the same as the prevalence
study with populational basis recently made in our State.
Key words: hypertension, epidemiology, prevalence.

Autor: Rafael Alcalde
Orientador: Prof. Dr. Iran Castro
Título: Alternativa Prática do Uso de Amiodarona Oral na Prevenção de
Fibrilação e Flutter Atrial no Pós-Operatório de Cirurgia de
Revascularização Miocárdica.
RESUMO
Introdução – A ocorrência de fibrilação atrial e flutter atrial após
cirurgia de revascularização miocárdica (CRM) pode ocorrer em até 53%
dos pacientes. O tempo de internação hospitalar nos pacientes que
desenvolvem este quadro é mais prolongado, devido ao maior número
de comorbidades que estas arritmias podem desencadear. Vários
métodos vêm sendo testados para diminuir a incidência destas arritmias
após cirurgia cardíaca. A amiodarona vem sendo testada, em alguns
estudos clínicos, com resultados animadores. Porém, os estudos utilizam
doses, tempos de tratamento e vias de administração diversas,
impossibilitando, muitas vezes, a aplicabilidade quando se requer um
reduzido tempo de internação pré-operatório.
Objetivos – Avaliar se amiodarona, administrada por um tempo curto
(30 a 56 horas) e com dose elevada (1800mg/dia), diminui a incidência
de fibrilação atrial ou flutter atrial em pacientes submetidos à CRM,
quando comparado com placebo; verificar se o tempo de internação na
sala de recuperação e o tempo de internação total no grupo da
amiodarona é menor do que o tempo no grupo placebo; verificar se o
tempo de internação na sala de recuperação e o tempo de internação
total no grupo que desenvolveu fibrilação ou flutter atrial é maior do que
nos pacientes que não desenvolveram esta arritmia.

Pacientes e Métodos – Estudo duplo-cego, controlado por placebo que
randomizou, consecutivamente, 100 pacientes submetidos à CRM, sendo
sete pacientes excluídos após a randomização, restando 46 pacientes no
grupo amiodarona e 47 pacientes no grupo placebo. A dose da droga do
estudo foi de 600mg, com intervalo de 8/8hs, iniciada no mínimo 30
horas e, no máximo, 56 horas antes da cirurgia. O desfecho primário foi
incidência de fibrilação e flutter atrial no pós-operatório, e os desfechos
secundários foram: tempo de internação na sala de recuperação e
tempo de internação hospitalar total.
Resultados – A dose média da amiodarona foi de 2,8g. A incidência de
fibrilação e flutter atrial no grupo amiodarona foi de 17,4% versus
40,4% no grupo placebo (RC 0,31; IC 95% 0,11 a 0,81). O tempo de
internação na sala de recuperação foi de 3,23±2,11 dias, no grupo
amiodarona, e de 4,74±5,09 dias no grupo placebo (p=0,08); o tempo
de internação total foi de 8,86±3,12 dias no grupo amiodarona e de
11,41±8,71 dias no grupo placebo (p=0,07). O tempo de internação,
entre os pacientes que desenvolveram fibrilação ou flutter atrial,
independente do tratamento recebido, foi significativamente maior,
tanto na sala de recuperação, como no tempo de internação total.
Conclusão – Amiodarona via oral, administrada por um curto espaço de
tempo no pré-operatório de CRM, com uma dose de 1800mg/dia diminui
a incidência de fibrilação e flutter atrial no pós-operatório. Os pacientes
que desenvolveram arritmia no pós-operatório mostraram significativo
maior tempo de internação hospitalar ; porém o efeito da amiodarona,
nos tempos de internação, mostrou uma tendência à redução, tanto na
sala de recuperação, como no tempo de internação total.

ABSTRACT
Introduction – The incidence of atrial fibrillation and flutter after
coronary artery bypass graft surgery (CABGS) is up to 53%. These
patients hospital length of stay is prolonged, due to the comorbidities
these arrhythmias can trigger. Many methods have been tested in order
to minimize the postoperative incidence of these arrhythmias.
Amiodarone has been used in several clinical trials with exciting results.
However, the trials use different doses, treatment periods and
administration modes, making it difficult to apply when a reduced
preoperative length of hospital stay is requested.
Objectives – Evaluate if amiodarone, administered for a short period
(30 to 56 hours) but in high dose (1800mg/day), reduces the incidence
of atrial fibrillation and flutter after CABGS, when compared to placebo;
verify if the intensive care unit stay and the overall hospital length of
stay are shorter in the amiodarone group than in the placebo group;
verify if the intensive care unit stay and overall hospital length of stay in
the patients with atrial fibrillation and flutter is greater than those
without arrhythmias.
Patients and Methods – Randomized, double-blind study, controlled
by placebo involving 100 patients submitted to CABGS, being seven
patients excluded from the study after randomization. The patients were
separated into two groups, the Amiodarone Group (46 patients) and the
Placebo Group (47 patients). The dose used in the study was 600 mg
tid, started at least 30 and until 56 hours before surgery, neither using
it perioperatively nor postoperatively. The primary enpoint was atrial
fibrillation and flutter incidence in the postoperative, and the secondary
endpoints were length of stay in the intensive care unit and overall
hospital length of stay.

Results – The mean dose of amiodarone was 2,8 g. The incidence of
atrial fibrillation and flutter in the amiodarone group was 17,4% versus
40,4% in the placebo group (RR 0,31 IC 95% 0,11 a 0,81). Intensive
care unit stay was of 3,23 + 2,11 days in the amiodarone group and of
4,74 + 5,09 days in the placebo group (p=NS) and overall hospital
length of stay was of 8,86 + 3,12 days in the amiodarone group and of
11,41 + 8,71 days in the placebo group (p=NS). Either intensive care
unit stay or overall hospital length of stay were prolonged in patients
who developed atrial fibrillation or flutter despite the treatment
received.
Conclusion – Prophylactic1800 mg/day amiodarone administered for a
short period is effective in reducing the incidence of atrial fibrillation or
flutter after CABGS. The patients that developed atrial fibrillation or
flutter in the postoperative showed larger significant times of overall
hospital length of stay, however the effect of the amiodarone in the
length of stay showed a tendency to be reduced, as much in the
intensive unit care as in the overall hospital length of stay.
Autor: Francisco Michielin Filho
Orientação: Prof. Dr. João Ricardo M. Sant’Anna
Título: Distribuição do Fluxo em Artérias Pulmonares na Anastomose de
Blalock-Taussig Modificada Conforme Modelo Computadorizado
RESUMO
Objetivo - Desenvolver modelo computadorizado da anastomose de
Blalock-Taussig modificada, à partir da observação de procedimentos
cirúrgicos realizados em pacientes. Avaliar, no modelo desenvolvido, os
fatores anatômico-cirúrgicos e geométricos, tais como diâmetro da
artéria subclávia e do enxerto de PTFE e ângulo de anastomose entre
artéria subclávia e enxerto, quanto ao seu efeito sobre o fluxo
sangüíneo de artérias pulmonares.
Métodos – Foram estudados, 10 pacientes portadores de cardiopatia
congênita com hipofluxo pulmonar, com idade entre 7 dias e 4 anos. Um
modelo geométrico parametrizado tridimensional foi desenvolvido
baseado nas medidas obtidas durante procedimentos cirúrgicos
realizados no Instituto de Cardiologia do Rio Grande do Sul. O modelo é
composto pela artéria subclávia, pela artéria pulmonar e pela prótese de
PTFE.
Os parâmetros obtidos dos pacientes foram os diâmetros e extensão do
enxerto de PTFE, da artéria subclávia e de artéria pulmonar esquerda e
os ângulos proximal e distal da anastomose do PTFE nas artérias. Estes,
foram dispostos em tabelas de contingência, com a utilização do teste T
de Student para dados pareados. O alfa crítico considerado foi 0,05.
Resultados - Nas simulações, a percentagem de fluxo desviada pelo
enxerto aumenta com a relação entre diâmetros do PTFE e da artéria
subclávia. Um ângulo de 110o na anastomose proximal mostra maior

percentagem de sangue desviado, enquanto que 30o, 60o e 90o
mostram desvios de fluxo quase similares. Contudo, ângulos de 30o e
110o tornam excessivo o fluxo pulmonar em uma das artérias
pulmonares, em detrimento da outra. O pico de pressão no PTFE varia
conforme o ângulo adotado, sendo maior em 30o . Quando o ângulo da
anastomose aumenta, a região de maior pressão se desloca do enxerto
para a artéria subclávia.
Conclusão - No modelo experimental, o diâmetro do enxerto de PTFE é
regulador principal da porcentagem de fluxo desviado. Na análise
computadorizada, um ângulo de 60o a 90o entre artéria subclávia e
enxerto de PTFE parece mais adequado para anastomose, considerando-
se percentagem de fluxo desviado, sua distribuição entre ramos
pulmonares e pico de pressão na zona da anastomose.
ABSTRACT
Objective - The influence of geometric factors upon the function of
modified Blalock-Taussig anastomosis (mBT) is study with
computacional dynamic code based upon the method of finite elements.
Methods - The mBT operation, performed in 10 patiente, was
graphically reconstructed to compose a parametrised tridimensional
geometric model. Using Streamline Upwind/Petrov-Galerkin
approximations, blood flow and distribution were evaluated in different
diameters of subclavian artery and politetrafluorethilene graft (PTFE)
and angles of proximal anastomosis.
Results - The percentage of blood flow derived through the PTFE
increases as its diameter enlarges in relation to sublavian artery
diameter. Variations in PTFE diameter do not interfere with pulmonary
arteries flow distribution. Angle of 110o in proximal anastomosis results
in large percentage of blood derivation to the graft, while angles of 30o,
60o and 90o presents almost similar flow. However, angles of 30o and
110o produce an execessive flow to one of pulmonary arteries, in
detrimental of other. Pressure peak in the PTFE is affected by proximal
angle of anastomosis, 30o resulting in higher and 110o in lower value.
As angle increases, the region of higher pressure moves from PTFE to
subclavian artery.
Conclusion - In the experimental model, percentage of flow derived to
PTFE is directly related to the diameter of the graft. Relation between
the diameters of subclavian artery and graft is an important regulator
for flow derivation to anastomosis. Angle of 60o to 90o in the
anastomosis between subclavian artery and PTFE results in favorable
pulmonary artery flow distribution and pressure peak location.

Autor: Carlos Antônio Kalil
Orientador: Prof. Dr. Renato A.K. Kalil
Título: Ablação da condução atrioventricular por cateter de
radiofreqüência em pacientes com fibrilação atrial: efeitos na qualidade
de vida.
RESUMO
Fundamentos - A ablação por cateter com radiofreqüência da condução
AV tem sido apresentada como terapia alternativa para várias formas de
arritmias supraventriculares, incluindo fibrilação atrial, por oferecer a
possibilidade de evitar palpitações recorrentes e conseqüências adversas
das drogas antiarrítmicas.
Objetivo - A proposta deste estudo foi quantificar, prospectivamente,
os efeitos dessa técnica na qualidade de vida e na performance cardíaca
de pacientes com fibrilação atrial refratária à terapia medicamentosa.
Métodos – Trinta e sete pacientes com fibrilação atrial refratária à
terapia medicamentosa foram submetidos à ablação completa do nódulo
atrioventricular com implante de marcapasso permanente. Percepção
subjetiva da qualidade de vida foi avaliada por um questionário semi
estruturado antes do procedimento e 1 e 6 meses após a ablação.
Resultados - A ablação por cateter foi associada com aumento
significativo na qualidade de vida durante os 6 meses após
procedimento. A função sistólica ventricular esquerda melhorou em
pacientes com depressão da função ventricular e manteve-se durante
esse tempo de acompanhamento.

Conclusão - A ablação do nódulo AV com implante de marcapasso
permanente, em pacientes não controlados com terapia farmacológica,
foi altamente eficaz e para controlar os sintomas e melhorar a sua
qualidade geral de vida.
ABSTRACT
Background - Radiofrequency (RF) catheter ablation of the AV
conduction has been presented as an alternative therapy for several
forms of supraventricular arrhythmias, including atrial fibrillation, as it
offers the possibility of avoiding recurrent palpitations and adverse
consequences from antiarrythmic drugs.
Purpose - The proposal of this study was to quantify, prospectively, the
effects of this technique on life quality and cardiac performance of
patients with atrial fibrillation refractory to drug therapy.
Methods - 37 patients with atrial fibrillation refractory to drug therapy
were subjected to complete ablation of the atrioventricular node with
permanent pacemaker implant. The subjective perception of life quality
was evaluated through a semi-structured questionnaire prior to the
procedure and 1 and 6 months after the ablation.
Results - Catheter ablation was associated to a significant increase in
life quality during the 6 months following the procedure. The left
ventricular systolic function improved in patients with decrease in
ventricular function and was maintained so during this follow-up period.
Conclusion - The ablation of the AV node with permanent pacemaker
implant in patients not managed with pharmacological therapy was

highly effective in controlling the symptoms and improving general life
quality.