revitalise scientific visualization in the classroom bob gotwals morehead planetarium and science...
Post on 21-Dec-2015
214 views
TRANSCRIPT

REVITALISE
Scientific Visualization in the Classroom
Bob GotwalsMorehead Planetarium and Science Center
UNC-Chapel Hill

REVITALISE
Team
• Morehead Planetarium and Science Center, UNC-CH– Bob Gotwals, Computational Science Educator, co-PI– Garrett Love, Computational Scientist– Lindsay Husted, UNC-CH Undergraduate Intern
• East Carolina University– Ken Flurchik, Computational Scientist
• NCSA– Polly Baker, Visualization Scientist– Scott Lathrop, Computational Science Educator

REVITALISE
Why this technology?
W
W
W
OW!
HAT?
HO CARES?
Scientific visualization is very engaging for scientists and lay persons alike
Scientific visualization allows for both surface and deep analysis of complex scientific phenomenon
Scientific visualization is an excellent tool for communication of results

REVITALISE
Two Approaches
Visualization (science education)
(Visualization science) education
and/or
REVITALISE
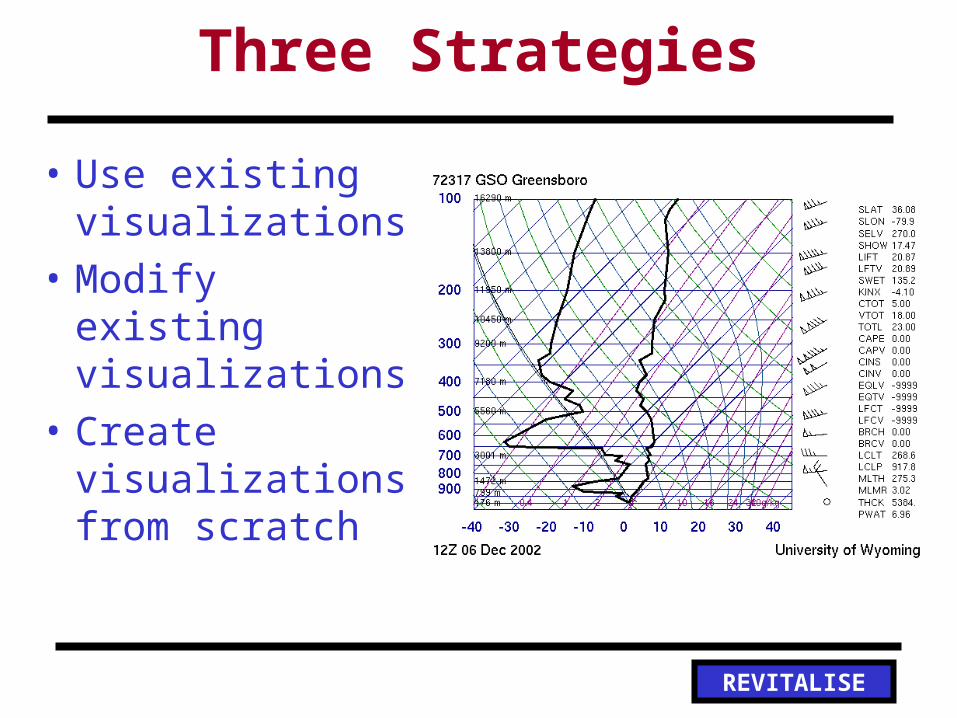
Three Strategies
• Use existing visualizations
• Modify existing visualizations
• Create visualizations from scratch

REVITALISE
Guiding Principles: Controlling the “T”
• Technologies– Scientific Visualization– Communications and
Collaboration
• Techniques– Data acquisition, filtering,
rendering– Collaboration techniques
• Tools– Visualization software– Communications tools

REVITALISE
Technologies
Observational Science
Experimental Science
Theoretical Science
Computational Science
Science: the study of natureScience: the study of how nature behaves
}SciVIz
REVITALISE
Technologies
• Scientific Visualization– SciVis is graphical representation of data for the purpose
of insight– SciVis is NOT presentation graphics or computer
graphics– General paradigm:
• Data acquisition --> data filtering --> data rendering
• Working assumption: process and product

REVITALISE
Techniques
• Data identification and acquisition
• Data analysis and filtering
• Data rendering
• Data choices– Color– Perspectives– Data subsets– Shapes
REVITALISE
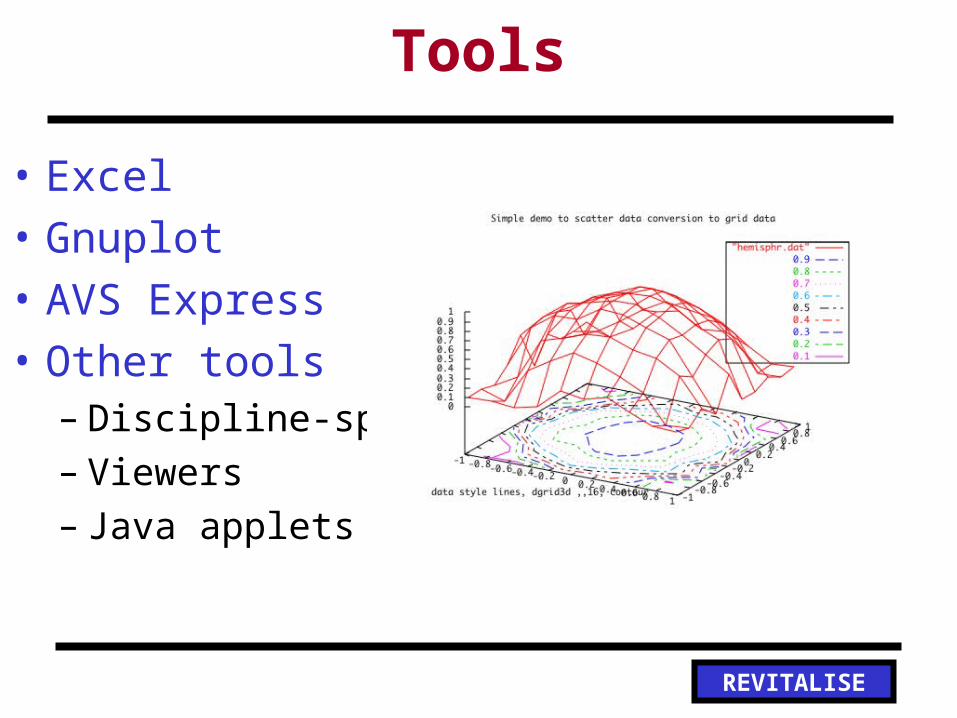
Tools
• Excel
• Gnuplot
• AVS Express
• Other tools– Discipline-specific– Viewers– Java applets

REVITALISE
Data Acquisition
• Sources– Empirical data
collection• Laboratory experiments
• Remote sensing devices
• Computational models– Endproduct of
numerical experiments

REVITALISE
Who Cares?
• 21st Century Science: The Grand Challenges– Molecular and structural biology– Cosmology– Environmental Hydrology– Warfare and Survivability– Chemical Engineering and electronic structure– Weather prediction– Nanomaterials
• Solve any PART of one of these problems, and ….

REVITALISE
You might win THIS…….
REVITALISE
Today’s Problem - Chemistry
• How closely must two atoms be to form a bond?– Li - lithium
– H - hydrogen
– form a new molecule - LiH, or lithium hydride
• Procedure– Understand the science
– Understand the model and the assumptions
– Create an input file
– Run the model
– Analyze and filter the data
– Visualize the data

REVITALISE
Input file
$CONTRL SCFTYP=RHF $END $BASIS GBASIS=STO NGAUSS=6 $END $DATALiH for plot. . . CNV 4
LITHIUM 3.0 0.0 0.0 -1.00HYDROGEN 1.0 0.0 0.0 1.00 $END $GUESS GUESS=MINGUESS $END $ELDENS IEDEN=1 WHERE=GRID OUTPUT=PUNCH MORB=2 $END $GRID ORIGIN(1)=0,-2,-2 XVEC(1)=0,-2,2 YVEC(1)=0,2,-2 SIZE=0.1 $END
REVITALISE
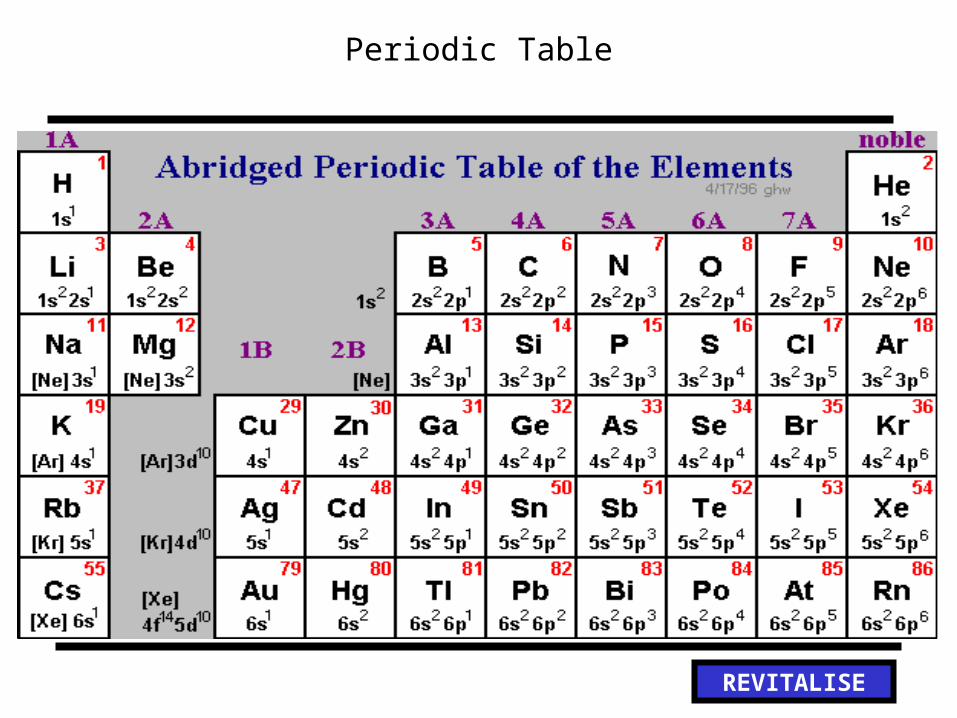
Periodic Table
REVITALISE
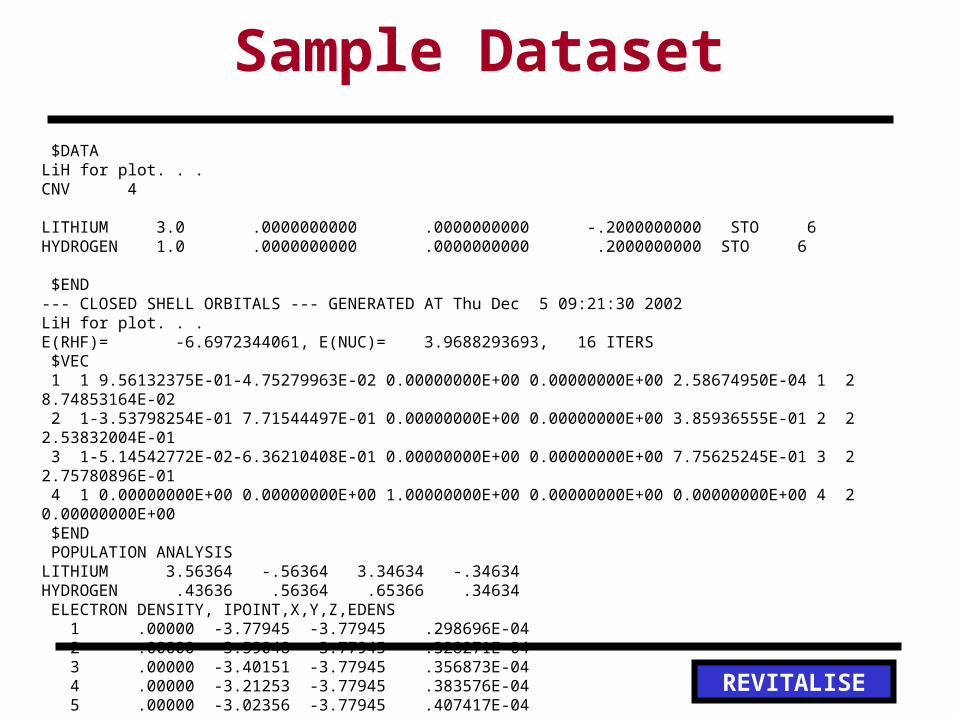
Sample Dataset
$DATA LiH for plot. . . CNV 4
LITHIUM 3.0 .0000000000 .0000000000 -.2000000000 STO 6 HYDROGEN 1.0 .0000000000 .0000000000 .2000000000 STO 6
$END --- CLOSED SHELL ORBITALS --- GENERATED AT Thu Dec 5 09:21:30 2002LiH for plot. . . E(RHF)= -6.6972344061, E(NUC)= 3.9688293693, 16 ITERS $VEC 1 1 9.56132375E-01-4.75279963E-02 0.00000000E+00 0.00000000E+00 2.58674950E-04 1 2 8.74853164E-02 2 1-3.53798254E-01 7.71544497E-01 0.00000000E+00 0.00000000E+00 3.85936555E-01 2 2 2.53832004E-01 3 1-5.14542772E-02-6.36210408E-01 0.00000000E+00 0.00000000E+00 7.75625245E-01 3 2 2.75780896E-01 4 1 0.00000000E+00 0.00000000E+00 1.00000000E+00 0.00000000E+00 0.00000000E+00 4 2 0.00000000E+00 $END POPULATION ANALYSISLITHIUM 3.56364 -.56364 3.34634 -.34634HYDROGEN .43636 .56364 .65366 .34634 ELECTRON DENSITY, IPOINT,X,Y,Z,EDENS 1 .00000 -3.77945 -3.77945 .298696E-04 2 .00000 -3.59048 -3.77945 .328271E-04 3 .00000 -3.40151 -3.77945 .356873E-04 4 .00000 -3.21253 -3.77945 .383576E-04 5 .00000 -3.02356 -3.77945 .407417E-04

REVITALISE
Stations
• Purpose– To experience different uses of visualization in core disciplines
• Procedure– 10 stations
– Team of 2-3 participants
– 8-10 minutes per station
– Short reading with short activity
• Address– http://www.morehead.unc.edu/revitalise/stations