reward preferences study - the irf
TRANSCRIPT
Reward Preferences Study
September 2020

Introduction
• During these challenging times, employees in all industries need to feel valued,
particularly those who put themselves at risk through public interactions.
• Many companies are forced to do more with less, putting an additional strain on human
resources.
• While many executives and managers want to express appreciation for outstanding
performance, they often lack insight as to which recognition strategies appeal the most
to their workers.
• A key consideration is that, sometimes, what people say they want most (e.g., cash
bonuses) may not be linked with greater engagement outcomes. Therefore, careful
consideration has to be given to stated preferences vs. latent motivation value.
• There may be times when people will not name a certain reward as a top preference, but
some recognition approaches represent ‘latent’ delighters, e.g., things that people don’t
think of as a reward priority, but nonetheless like them a lot when they receive them.
• The goals of this study are to both understand preferences, as well as the impact of
recognition/strategies and employee engagement and to identify balancing factors
between stated preferences and outcomes.
Key Questions
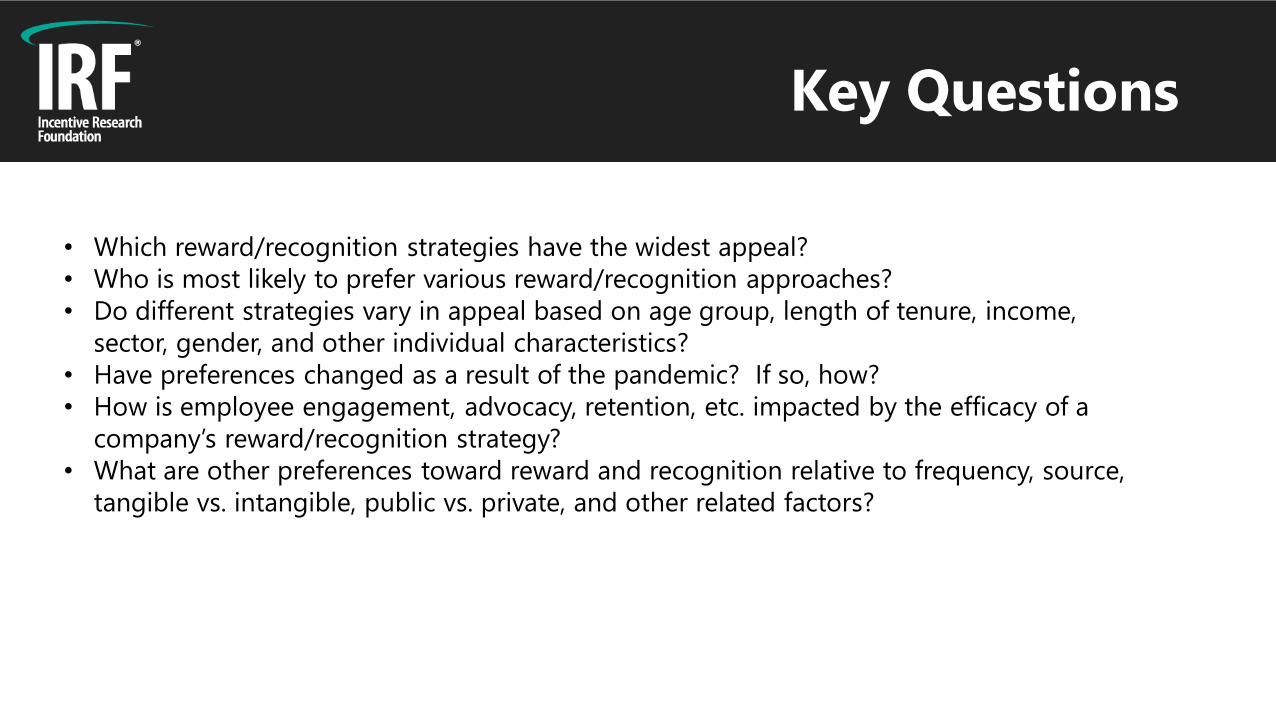
• Which reward/recognition strategies have the widest appeal?
• Who is most likely to prefer various reward/recognition approaches?
• Do different strategies vary in appeal based on age group, length of tenure, income,
sector, gender, and other individual characteristics?
• Have preferences changed as a result of the pandemic? If so, how?
• How is employee engagement, advocacy, retention, etc. impacted by the efficacy of a
company’s reward/recognition strategy?
• What are other preferences toward reward and recognition relative to frequency, source,
tangible vs. intangible, public vs. private, and other related factors?

Methodology
• 1500 US-based respondents
• Employed full-time (35 hours+ per week)
• 18+ years of age
• Cannot be self-employed, an independent contractor, or a temporary employee
• Panel supplied sample
• Approximately 15-minute survey
Sample Characteristics
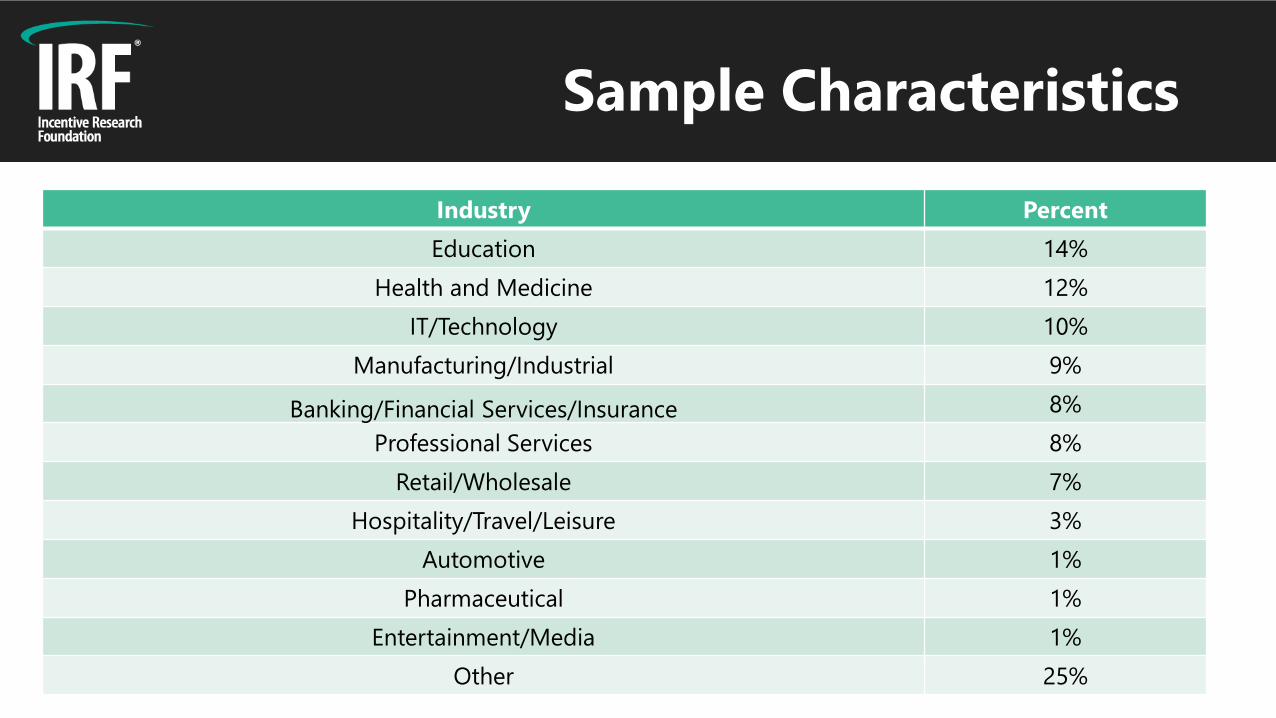
Industry Percent
Education 14%
Health and Medicine 12%
IT/Technology 10%
Manufacturing/Industrial 9%
Banking/Financial Services/Insurance 8%
Professional Services 8%
Retail/Wholesale 7%
Hospitality/Travel/Leisure 3%
Automotive 1%
Pharmaceutical 1%
Entertainment/Media 1%
Other 25%

Sample Characteristics
Generational Group Percent
Gen Z (18-22) 4%
Millennials (23-39) 30%
Gen X (40-55) 30%
Baby Boomers (56-74) 36%
Silent Generation (75+) 1%
Gender Percent
Male 51%
Female 49%

Sample Characteristics
Years in the Workforce Since High School Percent
Less than one month 1%
More than one month to 6 months 2%
More than 6 months but less than 1 year 2%
1-3 years 6%
More than 3 years but less than 5 years 5%
5-10 years 11%
11-15 years 10%
16-25 years 16%
Over 25 years 47%

Sample Characteristics
Marital Status Percent
Married 53%
Single 28%
Living with a partner 8%
Divorced/Separated 9%
Widowed 2%

Types of Recognition Strategies

Types of Recognition Strategies
• Respondents were provided a list of 24 approaches to recognizing employees, which fell into one
of four categories:
• Tangible non-cash gifts that had monetary exchange value
• Experiential gifts
• Intangible recognition
• Developmental opportunities
• Each respondent was asked to choose his/her top three preferences, as well as his/her bottom
three preferences.
• The ‘Top Three’ were assigned a value of ‘5’; the bottom three were assigned a value of ‘1’.
• The remaining unchosen options were presented, and respondents were asked to identify
their next four ‘most preferred’ recognition preferences (assigned a value of ‘4’) and their next
four ’least preferred’ recognition preferences (assigned a value of ‘2’).
• All remaining selected options not listed as a ‘top’ or ‘bottom’ preference received a ‘neutral’
rating of ‘3’.

Types of Recognition Strategies
Tangible non-cash gifts
• Gift cards redeemable for food or merchandise
• Food gifts
• Points that can be accumulated or redeemed
• Gifts of appreciation sent to family members
• Company-logoed merchandise
Intangible recognition
• Getting a paid day off
• Flexible scheduling
• Being recognized/thanked by company leadership
• Being recognized/thanked by your direct
supervisor
• Freedom from managerial oversight
• Being recognized/thanked by peers
• Being recognized in the corporate newsletter
• Being recognized in a company wide e-mail
• Getting a special parking spot at work
• Receiving a plaque, certificate, or trophy
Experiential gifts
• A company paid special event experience (e.g., concert,
ballgame)
• A company paid dinner or lunch with family
• Having lunch or dinner with your department
• Going out for an early ‘happy hour’ after work
Developmental Opportunities• Getting to work on an interesting new project
• A paid opportunity to attend a conference or seminar
• Having lunch or dinner with your supervisor or company
management
• Being given more responsibility at work
• Having the opportunity to mentor other employees

Recognition Preferences

Key Findings
• Overall, there are some clear preferences at the macro-level on how employees most
prefer to be recognized for outstanding work.
• Getting a paid day off was a ‘top three’ choice of nearly half (49%) and a ‘top seven’
choice of 70%.
• Only 4% named a paid day off in their ‘bottom three’ and only 9% named it in
their ‘bottom seven’.
• Also rated very highly were gifts cards, special experiences like concerts or ballgames
paid for by the company, flexible scheduling, and having a lunch or dinner with
family/friends paid for by the company.
• These recognition strategies emerged as easily having the broadest appeal.
• A key finding is that every strategy, even the ones ranked lower overall, appealed to
certain people, but not others.
• Recognition strategists have the opportunity to improve the effectiveness of their
programs by identifying individual recognition preferences rather than generalizing
to larger employee populations.

Recognition Preferences
Reward% Top Three
%
Next Four Top 7
Bottom 7
% Next
to Bottom
%
Bottom Three
Top
3/Bottom 3 differential
Top
7/Bottom 7 differential
Getting a paid day off 49% 21% 70% 9% 5% 4% 45% 61%
Getting a gift card for food or merchandise 33% 25% 58% 15% 9% 6% 27% 43%
Having the company pay all expenses to a special event experience 21% 30% 51% 13% 8% 5% 16% 38%
Flexible scheduling 27% 23% 50% 15% 9% 6% 21% 35%
Having lunch or dinner with your family paid for by the company 17% 30% 47% 17% 10% 7% 10% 30%
Receiving a food gift (e.g., chocolates, steaks, cheese, fruit baskets) 11% 27% 38% 26% 14% 12% -1% 12%
Being recognized or thanked by your company's leadership for outstanding work 15% 15% 30% 19% 13% 6% 9% 11%
Receiving points that can be accumulated or redeemed for a prize of your choice 11% 22% 33% 25% 15% 10% 1% 8%
Having your direct manager recognize and sincerely thank you for your work 12% 16% 28% 21% 14% 7% 5% 7%
Being given freedom from strict managerial oversight on how you do your work 13% 15% 28% 23% 15% 8% 5% 5%
Being provided an opportunity to work on an interesting new project 11% 13% 24% 25% 17% 8% 3% -1%
Having the opportunity to attend a conference or seminar paid for by your company 9% 17% 26% 27% 17% 10% -1% -1%
Being recognized or thanked by your peers for outstanding work 8% 15% 23% 25% 17% 8% 0% -2%
Having a gift or token of appreciation sent to your spouse or family members 7% 17% 24% 28% 18% 10% -3% -4%
Having lunch or dinner with your department 5% 17% 22% 33% 18% 15% -10% -11%
Going out for an early 'happy hour' after work 5% 14% 19% 37% 21% 16% -11% -18%
Getting recognized in the corporate newsletter or publication 6% 10% 16% 38% 23% 15% -9% -22%
Having lunch or dinner with your supervisor or company management 4%` 11% 15% 38% 21% 17% -13% -23%
Being given more responsibility at work 9% 10% 19% 44% 21% 23% -14% -25%
Being given the opportunity to mentor other employees 5% 10% 15% 40% 24% 16% -11% -25%
Having an email sent around your company recognizing your achievements 6% 9% 15% 41% 24% 17% -11% -26%
Getting a special parking spot at work (e.g., 'Reserved for employee of the month') 6% 11% 17% 43% 23% 20% -14% -26%
Receiving company logoed merchandise (e.g., shirts, handbags, coffee cups, etc.) 5% 12% 17% 43% 20% 23% -18% -26%
Getting a certificate, trophy, or plaque 5% 9% 14% 56% 25% 31% -26% -42%

Differences in Recognition Preferences Among Generations, Gender, and Sector

Tangible Non-Cash Gifts
Recognition Strategy Overall
Appeal
Most Preferred by… Less Preferred by….
Gift cards redeemable for food or merchandise High Gen X, Boomers
Females
Education, Health and
Medicine, Manufacturing
Gen Z, Millennials
Technology
Food gifts Moderately
High
Baby Boomers
Females
Gen Z, Millennials
Points that can be accumulated or redeemed Moderately
High
Females N/A
Gifts of appreciation sent to family members Moderate Manufacturing, Technology,
Retail
Professional Services,
Hospitality
Company-logoed merchandise Limited Gen Z, Millennials
Males
Boomers

Experiential Gifts
Recognition Strategy Overall
Appeal
Most Preferred by… Less Preferred by….
A company paid special event experience (e.g.,
concert, ballgame)
High Gen X, Boomers
Hospitality, Manufacturing,
Professional Services,
Gen Z
Education, Health and
Medicine, Technology, Retail
A company paid dinner or lunch with family High Boomers, Gen X
Females
Manufacturing, Education,
Health and Medicine, Financial
Services
Gen Z, Millennials
Technology, Hospitality, Retail,
Professional Services
Having lunch or dinner with your department Moderate Gen X, Boomers Gen Z, Millennials
Going out for an early ‘happy hour’ after work Moderate Gen Z, Millennials
Males
Gen X, Boomers

Developmental Opportunities
Recognition Strategy Overall
Appeal
Most Preferred by… Less Preferred by….
Getting to work on an interesting new project Moderate No differences by age, gender
or sector
N/A
A paid opportunity to attend a conference or
seminar
Moderate Health and Medicine,
Professional Services,
Education, Financial Services
Retail, Hospitality
Having lunch or dinner with your supervisor or
company management
Limited Gen Z, Millennials
Males
Financial Services, Retail,
Professional Services
Boomers, Gen X
Health and Medicine,
Hospitality, and Education
Being given more responsibility at work Limited Gen Z, Millennials
Males
Hospitality, Financial Services,
Technology
Boomers, Gen X
Health and Medicine,
Education
Having the opportunity to mentor other
employees
Limited Gen Z
Males
Boomers, Gen
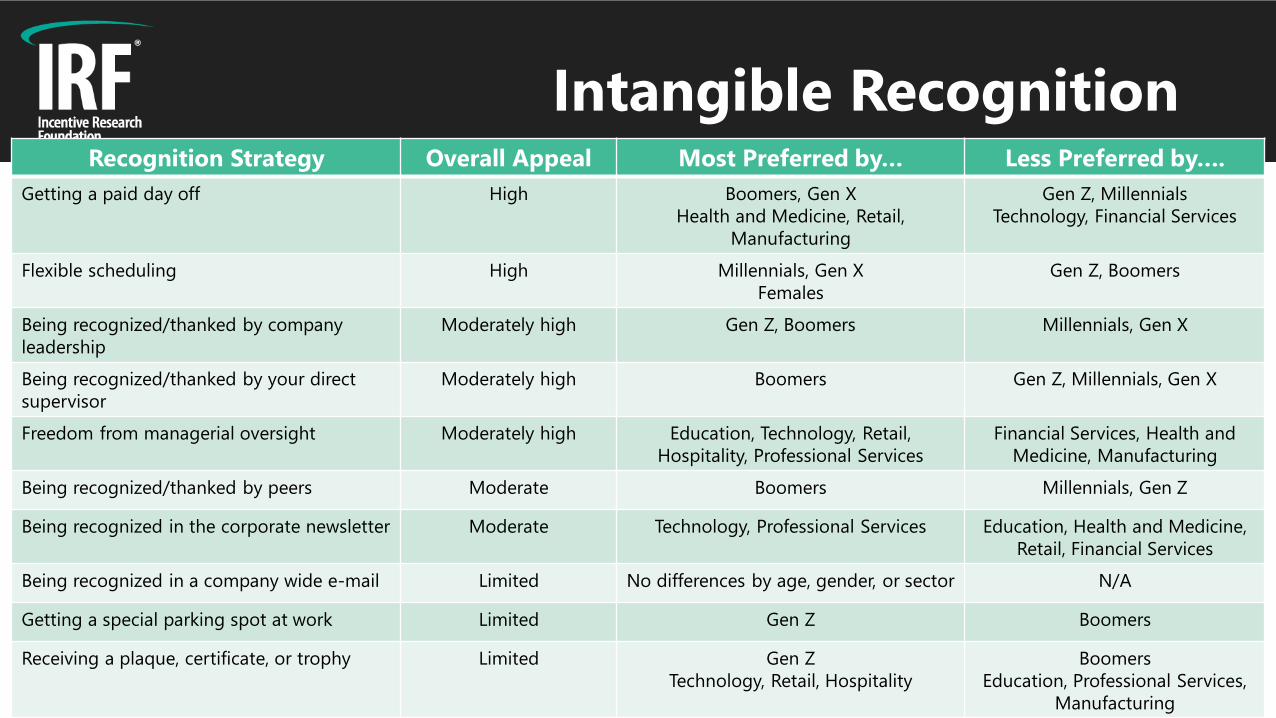
Intangible RecognitionRecognition Strategy Overall Appeal Most Preferred by… Less Preferred by….
Getting a paid day off High Boomers, Gen X
Health and Medicine, Retail,
Manufacturing
Gen Z, Millennials
Technology, Financial Services
Flexible scheduling High Millennials, Gen X
Females
Gen Z, Boomers
Being recognized/thanked by company
leadership
Moderately high Gen Z, Boomers Millennials, Gen X
Being recognized/thanked by your direct
supervisor
Moderately high Boomers Gen Z, Millennials, Gen X
Freedom from managerial oversight Moderately high Education, Technology, Retail,
Hospitality, Professional Services
Financial Services, Health and
Medicine, Manufacturing
Being recognized/thanked by peers Moderate Boomers Millennials, Gen Z
Being recognized in the corporate newsletter Moderate Technology, Professional Services Education, Health and Medicine,
Retail, Financial Services
Being recognized in a company wide e-mail Limited No differences by age, gender, or sector N/A
Getting a special parking spot at work Limited Gen Z Boomers
Receiving a plaque, certificate, or trophy Limited Gen Z
Technology, Retail, Hospitality
Boomers
Education, Professional Services,
Manufacturing

Reward Preferences

Reward Preferences
• This section of the study is focused on annual incentive rewards, rather than ongoing recognition
strategies referenced in the previous section.
• These rewards are typically given to Top Performers or those who reached specified goals on
an annual basis.
• Respondents were asked to rank ten incentive rewards in terms of preference.

Reward Preferences
Reward Average Ranking (1-
High/10=Low)
Percent ranking
‘1-3’
Percent ranking ‘8-10’
Cash bonus 1.87 88% 2%
An extra paid week of personal time off 3.64 62% 10%
Incentive travel award for yourself and a
companion
4.48 38% 11%
A significant merchandise gift 4.90 32% 15%
A large number of points that can be
redeemed for a desirable award
5.82 17% 26%
An upgrade in your job title 5.88 23% 31%
A meaningful experience customized to your
own preferences
6.08 12% 27%
A promotion involving more responsibility at
work
6.64 17% 45%
Company wide recognition as a ‘top
performer’
7.47 8% 60%
A large trophy or plaque for your wall or
office
8.22 4% 73%

Reward Preferences
Reward Most Preferred by… Less Preferred by..
Cash bonus Boomers, Gen X Millennials, Gen Z
An extra paid week of personal time off Boomers
Females
Hospitality, Health and Medicine,
Professional Services, Manufacturing
Gen Z, Millennials, Gen X
Technology, Financial Services
Incentive travel award for yourself and a companion Divorced, Married Single, Widowed
A significant merchandise gift Boomers
Retail, Manufacturing
Married, Divorced, Widowed
Gen Z, Millennials, Gen X
Professional Services, Financial Services,
Technology, Hospitality
Single, Living with a partner
A large number of points that can be redeemed for a
desirable award
No differences among individuals based
on age, gender, sector, or marital status
N/A
An upgrade in your job title Gen Z, Millennials
Single, Living with a partner
Gen X, Boomers
Married, Divorced
A meaningful experience customized to your own
preferences
Boomers
Females
Professional Services, Education,
Manufacturing
Gen Z, Millennials, Gen X
Technology, Hospitality, Retail

Reward Preferences (continued)
Reward Most Preferred by… Less Preferred by..
A promotion involving more responsibility at work Millennials, Gen Z
Males
Technology, Financial Services
Boomers, Gen X
Education, Health and Medicine,
Hospitality, Retail, Manufacturing
Divorced
Company wide recognition as a ‘top performer’ Males
Technology, Professional Services,
Health and Medicine, Financial Services,
Education
A large trophy or plaque for your wall or office Gen Z
Single, Living with a partner
Millennials, Gen X, Boomers
Married, Divorced, Widowed

Changes Since the Pandemic
Changes Since the Pandemic
• Work life has changed significantly since the COVID-19 pandemic, and this has affected reward
and recognition preferences among a relatively small percentage of people (16%)
• The findings show that, for these people, tangible gifts have taken on increased importance.
• While many among this segment express less of a desire to travel, the percentages that are
interested in travel has risen among some others, indicating the incentive travel industry has not
taken much a hit relative to interest when the percentages are netted out.
• There is more of an interest in driving trips and incentive experiences involving fewer people.

Only 16% Say Their Preferences Have Changed Since the Pandemic
Question: Since the pandemic began, have your preferences on how you prefer to be recognized and rewarded
changed?
16%
76%
8%
Yes No Unsure

Changes Since the Pandemic
• The data show only slight shifts in preferences toward incentive travel.
• While some indicated less of a preference toward incentive travel experiences, there were
others who showed more interest in incentive travel.
• When subtracting those who had less interest from those with more interest in incentive
travel experiences, there was only a net difference of less than one percent who were less
interested in travel experiences involving flights, and a gain of 2-3 percentage points
among people who preferred travel experiences where you can either drive or avoid large
crowds of people.
• The conclusion is that, overall, there has not been a significant decline relative to the
overall appeal of incentive travel, although there have been a slight shifts among
individuals relative to the design of incentive travel experiences.
Changes Since the Pandemic (continued)
• Overall, about one-in-ten showed a greater preference for cash bonuses. Primary reasons
who included…
• Many have taken pay cuts/have fewer hours and need extra money to make up the
difference
• Overall household income has been cut
• Working more hours at home and feel they should be compensated for it.
• Less interest in any type of travel award
• Cannot make the same income due to travel restrictions
• Desire to pay down debts due to uncertainty
• Essential workers who risk their health feel they should be paid more
• Groceries and household expenses have increased
• Want to help their families with additional income
• Interestingly, 84% of those more interested in cash bonuses either feel ‘very’ or ‘somewhat’
secure in their jobs. Therefore feelings of job insecurity is not driving the greater desire for
cash.

Changes Since the Pandemic (continued)
• About one-in-ten have a greater preference for flexible hours. Primary reasons include…
• Wanting to spend more time with family
• Working remotely has led to a loss of boundaries with people emailing from work at all
hours.
• Changes in routine have led to needs for greater flexibility
• Desire to avoid travel
• The following table shows the net percentages who increased/decreased interest in certain
reward types.
• The percentages in parentheses show the percentage of the total population that have
shifted.

Changes Since the Pandemic
Incentive % Interest Increased % Interest Decreased Net
An incentive travel experience
involving a flight
38% (6%) 41% (6%) -3% (-.6%)
An incentive travel experience to
which you can drive
42% (7%) 31% (5%) +11% (+2%)
An incentive travel experience
without the requirement to mingle
with large groups of people
44% (7%) 29% (4%) +15% (+3%)
A cash bonus 73% (11%) 12% (2%) +61% (+9%)
Gift cards that can be redeemed for
what you want or need
67% (10%) 12% (2%) +55% (+8%)
Merchandise you want or need 59% (9%) 18% (3%) +41% (+6%)
Flexible scheduling 70% (11%) 10% (2%) +60 (+9%)

Recognition/Reward Received

Recognition Received
• This section of the study examines the recognition and rewards people reported receiving in the
past 12 months with a comparison to how they wanted to be recognized and rewarded.
• The results show that in many cases, highly valued recognition approaches such as granting
flexible scheduling and providing paid days off are among the most frequently granted reward
types. However, there are at least four highly valued recognition approaches that are severely
underutilized. • Having the company pay all expenses to a special event experience
• Having lunch or dinner with your family paid for by the company
• Receiving a food gift (e.g., chocolates, steaks, cheese, fruit baskets)
• Receiving points that can be accumulated or redeemed for a prize of your choice
• The following tables show the percentage who ranked a particular recognition approach within
their Top 7 preferences, accompanied by the percentage that received the recognition type. • Mid-point percentages were calculated for both preference and recognition received and denoted with
an (H), if it was at or above the median, and an (L) if it fell below the median, showing the discrepancies
between preferences vs. the recognition types people received at work.
6% (L)

Recognition Received
Recognition Type Percent who listed
recognition type within their
‘Top 7’ preferred
Percent who reported
receiving the
recognition type
within the past 12
months
Flexible scheduling 50% (H) 25% (H)
Getting a paid day off 70% (H) 21% (H)
Having your direct manager recognize and sincerely thank you for your work 28% (L) 20% (H)
Being recognized or thanked by your peers for outstanding work 23% (L) 18% (H)
Being given freedom from strict managerial oversight on how you do your work 28% (L) 17% (H)
Being given more responsibility at work 19% (L) 17% (H)
Being provided an opportunity to work on an interesting new project 24% (L) 16% (H)
Getting a gift card for food or merchandise 58% (H) 15% (H)
Being recognized or thanked by your company's leadership for outstanding work 30% (H) 15% (H)
Having lunch or dinner with your department 22% (L) 9% (L)
Getting a certificate, trophy, or plaque 14% (L) 9% (L)

Recognition Received (continued)
Recognition Type Percent who listed
recognition type within their
‘Top 7’ preferred
Percent who reported
receiving the
recognition type
within the past 12
months
Having lunch or dinner with your supervisor or company management 15% (L) 8% (L)
Being given the opportunity to mentor other employees 15% (L) 8% (L)
Receiving points that can be accumulated or redeemed for a prize of your
choice33% (H) 7% (L)
Having the opportunity to attend a conference or seminar paid for by your company 26% (L) 6% (L)
Having lunch or dinner with your family paid for by the company 47% (H) 6% (L)
Receiving a food gift (e.g., chocolates, steaks, cheese, fruit baskets) 38% (H) 6% (L)
Receiving company logoed merchandise (e.g., shirts, handbags, coffee cups, etc.) 17% (L) 6% (L)
Having an email sent around your company recognizing your achievements 15% (L) 5% (L)
Going out for an early 'happy hour' after work 19% (L) 4% (L)
Getting recognized in the corporate newsletter or publication 16% (L) 4% (L)
Having the company pay all expenses to a special event experience 51% (H) 3% (L)

Recognition Received (continued)
Recognition Type Percent who listed
recognition type within their
‘Top 7’ preferred
Percent who reported
receiving the
recognition type
within the past 12
months
Having a gift or token of appreciation sent to your spouse or family members 24% (L) 3% (L)
Getting a special parking spot at work (e.g., 'Reserved for employee of the month') 17% (L) 3% (L)

Percentage Who Received Desirable Recognition
• The following tables show the percentage who received the type of recognition they desired
among their Top 7 preferences.
• The data show the rate to which people get their desired rewards is comparable to the
percentage in which people receive rewards in general.
• The data confirm that very few people who want things like special experiences, food gifts, dinner
with friends and family, or points receive these things.
• In each case, fewer than 10% who want these types of recognition receive them.
• The largest gap between wanting and receiving is getting the company to pay expenses to a
special experience.
• While 51% listed this a top preferred award, only 2% received these experiences. 6% (L)
3% (L)

Percent that Received Their Desired Recognition
Recognition Type Percent who listed
recognition type within their
‘Top 7’ preferred
Percent that Received
Desired Recognition
Getting a paid day off 70% 20% (H)
Getting a gift card for food or merchandise 58% 16% (H)
Having the company pay all expenses to a special event experience 51% 2% (L)
Flexible scheduling 50% 32% (H)
Having lunch or dinner with your family paid for by the company 47% 4% (L)
Receiving a food gift (e.g., chocolates, steaks, cheese, fruit baskets) 38% 9% (L)
Being recognized or thanked by your company's leadership for outstanding work 30% 18% (H)
Receiving points that can be accumulated or redeemed for a prize of your
choice33% 9% (L)
Having your direct manager recognize and sincerely thank you for your work 28% 29% (H)
Being given freedom from strict managerial oversight on how you do your work 28% 25% (H)
Being provided an opportunity to work on an interesting new project 24% 25% (H)

Percent that Received Their Desired Recognition (continued)
Recognition Type Percent who listed
recognition type within their
‘Top 7’ preferred
Percent that Received
Desired Recognition
Having the opportunity to attend a conference or seminar paid for by your company 26% 8% (L)
Being recognized or thanked by your peers for outstanding work 23% 23% (H)
Having a gift or token of appreciation sent to your spouse or family members 24% 2% (L)
Having lunch or dinner with your department 22% 12% (L)
Going out for an early 'happy hour' after work 19% 6% (L)
Getting recognized in the corporate newsletter or publication 16% 7% (L)
Having lunch or dinner with your supervisor or company management 15% 10% (L)
Being given more responsibility at work 19% 26% (H)
Being given the opportunity to mentor other employees 15% 15% (H)
Having an email sent around your company recognizing your achievements 15% 7% (L)
Getting a special parking spot at work (e.g., 'Reserved for employee of the month') 17% 5% (L)

Percent that Received Their Desired Recognition (continued)
Recognition Type Percent who listed
recognition type within their
‘Top 7’ preferred
Percent that Received
Desired Recognition
Receiving company logoed merchandise (e.g., shirts, handbags, coffee cups, etc.) 17% 11% (L)
Getting a certificate, trophy, or plaque 14% 15% (H)
Percentage Who Received Undesirable Recognition
• The following tables show the percentage who received the type of recognition they listed
among their Bottom 7 preferences.
• The results show that, in most cases, people are not being recognized in high percentages in
ways that are de-motivating to them.
• In some cases, the incidence of particular recognition strategies are consistent and are given
to employees proportionately within companies, whether they desire the award or not. • 6% (L)
3% (L)

Percent that Received Undesirable Recognition
Recognition Type Percent who listed
recognition type within their
Bottom 7 least preferred
Percent that Received
Undesired
Recognition
Getting a paid day off 9% 24%
Flexible scheduling 15% 18%
Having your direct manager recognize and sincerely thank you for your work 21% 15%
Being recognized or thanked by your company's leadership for outstanding work 19% 13%
Being recognized or thanked by your peers for outstanding work 25% 13%
Being given more responsibility at work 44% 13%
Getting a gift card for food or merchandise 15% 12%
Being given freedom from strict managerial oversight on how you do your work 23% 12%
Being provided an opportunity to work on an interesting new project 25% 10%
Having lunch or dinner with your family paid for by the company 17% 9%
Having lunch or dinner with your department 33% 8%
Having lunch or dinner with your supervisor or company management 38% 7%

Percent that Received Undesirable Recognition (continued)
Recognition Type Percent who listed
recognition type within their
‘Top 7’ preferred
Percent that Received
Undesired
Recognition
Getting a certificate, trophy, or plaque 56% 7%
Receiving points that can be accumulated or redeemed for a prize of your choice 25% 6%
Having the opportunity to attend a conference or seminar paid for by your company 27% 6%
Being given the opportunity to mentor other employees 40% 6%
Receiving company logoed merchandise (e.g., shirts, handbags, coffee cups, etc.) 43% 5%
Getting recognized in the corporate newsletter or publication 38% 4%
Having the company pay all expenses to a special event experience 13% 4%
Receiving a food gift (e.g., chocolates, steaks, cheese, fruit baskets) 26% 4%
Having an email sent around your company recognizing your achievements 41% 4%
Going out for an early 'happy hour' after work 37% 3%

Percent that Received Undesirable Recognition (continued)
Recognition Type Percent who listed
recognition type within their
‘Top 7’ preferred
Percent that Received
Undesired
Recognition
Having a gift or token of appreciation sent to your spouse or family members 28% 3%
Getting a special parking spot at work (e.g., 'Reserved for employee of the month') 43% 2%

Rewards Received
• This section examines annual rewards/awards typically given to Top Performers or those that have
hit specified goals on an annual basis.
• The data show that, other than cash bonuses, all other types of annual rewards are given very
sparingly, with only 3%-6% saying they received any of the other alternatives.
• Twenty-seven percent (27%) reported they have not received any type of recognition or
reward for their work within the past 12 months.• 6% (L)
3% (L)

Rewards Received
Reward Average Ranking (1-
High/10=Low)
Percent receiving the
award
Cash bonus 1.87 22%
An extra paid week of personal time off 3.64 4%
Incentive travel award for yourself and a companion 4.48 3%
A significant merchandise gift 4.90 3%
A large number of points that can be redeemed for a
desirable award
5.82 3%
An upgrade in your job title 5.88 6%
A meaningful experience customized to your own preferences 6.08 1%
A promotion involving more responsibility at work 6.64 4%
Company wide recognition as a ‘top performer’ 7.47 3%
A large trophy or plaque for your wall or office 8.22 3%

The Impact of Recognition on Employee Engagement

The Impact of Recognition on Employee Engagement
• Meaningful recognition has been consistently shown to be one of the key drivers of employee
engagement. This section examines:• The overall impact of successful recognition programs on engagement and other related outcomes.
• The recognition and reward strategies most associated with high levels of engagement.
• The differential impact of ‘meaningful’ engagement.
• The survey asked a number of ‘engagement’ items, each serving as a proxy to predict various downstream
outcomes.✓ I am completely satisfied with my job. (overall engagement, job satisfaction)✓ I look forward to coming to work every day. (absenteeism, sick days taken, retention, motivation)✓ I would be very happy to spend the remainder of my career with my present company. (retention)✓ I would absolutely recommend my employer to friends and family as a place to work. (employer advocacy)✓ I would confidently recommend my company’s products and services to friends and family. (belief in products
and services, advocacy)✓ If I was able to do so, I’d invest my own money in my company. (profitability)✓ I feel motivated every day to give my best possible effort. (productivity)✓ I am completely satisfied with my company’s reward and recognition efforts (satisfaction with recognition)
3% (L)

Overall Engagement Scores
• Here are the overall engagement scores for the items asked in the survey regardless of the type
of recognition/rewards individuals received, as well as the impact of recognition/rewards over the
past 12 months.. Average scores (1=Low/5=High) and the percentage of those ‘strongly
agreeing’ is presented in parentheses.
3% (L)
Item Overall Received some type of
recognition/reward``
Received no
recognition/reward
I am completely satisfied with my job. 3.68 (26%) 3.84` (30%) 3.24 (17%)
I look forward to coming to work every day. 3.65 (24%) 3.79 (27%) 3.28 (16%)
I would be very happy to spend the remainder of my career with
my present company.3.82 (36%) 3.98 (41%) 3.41 (25%)
I would absolutely recommend my employer to friends and
family as a place to work.3.69 (30%) 3.86 (34%) 3.21 (19%)
I would confidently recommend my company’s products and
services to friends and family.3.84 (33%) 4.00 (38%) 3.40 (21%)
If I was able to do so, I’d invest my own money in my company. 3.31 (21%) 3.51 (25%) 2.79 (11%)
.I feel motivated every day to give my best possible effort. 3.89 (33%) 4.04 (37%) 3.48 (22%)

Satisfaction with Recognition
• Approximately, one-in-five (21%) indicated they are ‘completely satisfied’ with their company’s
reward and recognition efforts, while 23% expressed dissatisfaction with reward and recognition
efforts.
• The remaining 56% were either ‘somewhat satisfied’ or neutral.
• The relationship between satisfaction with recognition and the various engagement outcomes are
presented in the table on the next page.
• The data showed the extremely strong relationship between the quality of a company’s
recognition program and key engagement outcomes.
• Of most interest is how employees responded to the item, ‘If I could, I would invest my own
money in my company.’
• While the sample methodology does not provide an opportunity to know the
profitability/success of each respondent’s employer, employees usually have a good idea of
how their companies perform financially.
• Employee responses on the ‘willingness to invest’ item provide an indication of a company’s
success.
• Employees who are completely satisfied with recognition efforts are 12X more willing to
invest their own money compared to those dissatisfied with recognition efforts (58% to 5%).

The Relationship Between Satisfaction and Engagement Outcomes
Engagement Item Dissatisfied with
Recognition
Neutral or
Somewhat Satisfied
Extremely Satisfied
with Recognition
I am completely satisfied with my job. 2.66 (5%) 3.74 (18%) 4.66 (71%)
I look forward to coming to work every day. 2.72 (6%) 3.70 (17%) 4.53 (64%)
I would be very happy to spend the
remainder of my career with my present
company.
2.89 (11%) 3.88 (31%) 4.71 (79%)
I would absolutely recommend my employer
to friends and family as a place to work.2.59 (5%) 3.78 (23%) 4.67 (77%)
I would confidently recommend my
company’s products and services to friends
and family.
3.03 (12%) 3.89 (27%) 4.62 (74%)
If I was able to do so, I’d invest my own
money in my company.2.29 (5%) 3.37 (14%) 4.29 (58%)
.I feel motivated every day to give my best
possible effort. 3.12 (14%) 3.91 (25%) 4.69 (76%)
Average Item Rating (1=Low to 5=High)/Percent ‘Strongly Agreeing’

Recognition Strategies Associated with Engagement Levels
• Given the strong consistent impact recognition has on various engagement outcomes, the
following tables display engagement scores for individuals receiving each of the following types
of recognition/rewards.
• The numbers in the columns display the average rating on the item with ‘1’ being low and ‘5’
being high.
• In parentheses is the percentage that ‘strongly agree’ with each statement.
• Highest engagement scores are highlighted in green; the lowest engagement scores are
highlighted in yellow.
3% (L)

Recognition Strategies Associated with Engagement Items
Recognition Type Received I am completely
satisfied with my
job..
I would be very
happy to spend the
remainder of my
career with my
present company.
If I was able to do so, I’d
invest my own money in my
company.
Getting a special parking spot at work (e.g., 'Reserved for
employee of the month')4.38 (49%) 4.16 (46%) 4.08 (46%)
Having the company pay all expenses to a special event
experience4.36 (52%) 4.40 (52%) 3.93 (36%)
Having a gift or token of appreciation sent to your spouse or
family members4.28 (56%) 4.37 (51%) 4.00 (40%)
Getting recognized in the corporate newsletter or
publication4.15 (48%) 4.20 (48%) 3.62 (30%)
Having lunch or dinner with your family paid for by the
company4.15 (45%) 4.28 (51%) 4.02 (33%)
Having an email sent around your company recognizing your
achievements4.11 (47%) 4.18 (47%) 3.74 (36%)
Having the opportunity to attend a conference or seminar
paid for by your company4.10 (40%) 4.19 (47%) 3.73 (37%)
Receiving company logoed merchandise (e.g., shirts,
handbags, coffee cups, etc.)4.10 (39%) 4.20 (53%) 3.62 (35%)
Being given the opportunity to mentor other employees 4.09 (38%) 4.27 (53%) 3.75 (35%)

Recognition Strategies Associated with Engagement Items
Recognition Type Received I am completely
satisfied with my
job..
I would be very
happy to spend the
remainder of my
career with my
present company.
If I was able to do so, I’d
invest my own money in my
company.
Having lunch or dinner with your department 4.04 (36%) 4.24 (50%) 3.75 (33%)
Going out for an early 'happy hour' after work 4.02 (33%) 4.21 (47%) 3.93 (35%)
Being provided an opportunity to work on an interesting
new project4.00 (37%) 4.12 (48%) 3.83 (34%)
Getting a paid day off 4.00 (34%) 4.10 (45%) 3.68 (30%)
Flexible scheduling 3.99 (37%) 4.08 (45%) 3.72 (32%)
Being recognized or thanked by your company's leadership
for outstanding work3.97 (37%) 4.12 (47%) 3.57 (27%)
Being recognized or thanked by your peers for outstanding
work3.95 (35%) 4.13 (52%) 3.54 (28%)
Having lunch or dinner with your supervisor or company
management3.95 (35%) 4.13 (43%) 3.70 (25%)
Being given freedom from strict managerial oversight on
how you do your work3.95 (35%) 4.11 (50%) 3.58 (29%)

Recognition Strategies Associated with Engagement Items
Recognition Type Received I am completely
satisfied with my
job..
I would be very
happy to spend the
remainder of my
career with my
present company.
If I was able to do so, I’d
invest my own money in my
company.
Having your direct manager recognize and sincerely thank
you for your work3.93 (32%) 4.12 (46%) 3.52 (23%)
Being given more responsibility at work 3.93 (35%) 4.10 (50%) 3.71 (34%)
Getting a trophy, certificate, or plaque 3.92 (34%) 3.98 (41%) 3.60 (29%)
Getting a gift card for food or merchandise 3.90 (34%) 4.10 (48%) 3.60 ( 30%)
Receiving a food gift (e.g., chocolates, steaks, cheese, fruit
baskets)3.88 (27%) 4.05 (41%) 3.54 (25%)
Receiving points that can be accumulated or redeemed for a
prize of your choice3.85 (33%) 3.98 (42%) 3.87 (38%)
Key Findings
• While it is important to exercise caution in implying cause-effect relationships, the data point out
some interesting things.
• Even though some types of recognition are preferred much more than others, granting these
preferences is often not sufficient for driving high job satisfaction and engagement.
• Even though some preferences might be ranked lower in importance, things like giving an
‘employee of the month’ parking spot, can be considered ‘latent’ satisfiers.
• ‘Latent’ satisfiers are things people say are not important but are very nice to receive.
• It is also interesting to see which recognition practices are associated with the highest ratings
among those indicating a strong willingness to invest in their companies.
• The ‘willingness to invest’ item is a proxy for company profitability, so there are some
important implications we can take from the data.
• Profitable companies support a culture that support the family and experiences
surrounding the family.
• Successful companies engage in recognition practices that are relatively uncommon
such as picking up the tab for special experiences and sending tokens of appreciation
to employee family members.

Impact of Recognition Strategies on Motivation
Recognition Type Received Overall Rating on ‘I feel
motivated every day to
give my best possible
effort’
Overall Rating on ‘I look
forward to coming to
work every day’
Having the company pay all expenses to a special event experience 4.43 (55%) 4.31 (55%)
Having a gift or token of appreciation sent to your spouse or family
members4.37 (54%) 4.05 (44%)
Receiving company logoed merchandise (e.g., shirts, handbags, coffee
cups, etc.)4.34 (49%) 3.92 (33%)
Having an email sent around your company recognizing your achievements 4.33 (50%) 3.97 (40%)
Getting a special parking spot at work (e.g., 'Reserved for employee of the
month')4.32 (57%) 3.86 (35%)
Being given the opportunity to mentor other employees 4.32 (52%) 4.05 (35%)
Having lunch or dinner with your department 4.30 (50%) 4.03 (34%)
Being recognized or thanked by your peers for outstanding work 4.29 (48%) 3.97 (36%)
Being given more responsibility at work 4.27 (51%) 3.97 (35%)

Impact of Recognition Strategies on Motivation
Recognition Type Received Overall Rating on ‘I feel
motivated every day to
give my best possible
effort’
Overall Rating on ‘I look
forward to coming to
work every day’
Getting recognized in the corporate newsletter or publication 4.25 (48%) 4.08 (38%)
Being recognized or thanked by your company's leadership for
outstanding work4.22 (47%) 3.93 (34%)
Having your direct manager recognize and sincerely thank you for your
work4.21 (46%) 3.85 (29%)
Being provided an opportunity to work on an interesting new projects 4.21 (45%) 4.03 (40%)
Going out for an early 'happy hour' after work 4.16 (40%) 4.03 (33%)
Getting a paid day off 4.14 (41%) 3.91 (32%)
Being given freedom from strict managerial oversight on how you do your
work4.12 (42%) 3.87 (33%)
Flexible scheduling 4.12 (41%) 3.92 (33%)
Getting a gift card for food or merchandise 4.10 (41%) 3.89 (33%)
Having the opportunity to attend a conference or seminar paid for by your
company4.10 (38%) 4.00 (31%)

Impact of Recognition Strategies on Motivation
Recognition Type Received Overall Rating on ‘I feel
motivated every day to
give my best possible
effort’
Overall Rating on ‘I
look forward to coming
to work every day’
Getting a certificate, trophy, or plaque 4.09 (38%) 3.93 (33%)
Having lunch or dinner with your family paid for by the company 4.09 (36%) 4.12 (35%)
Having lunch or dinner with your supervisor or company management 4.08 (39%) 3.93 (39%)
Receiving a food gift (e.g., chocolates, steaks, cheese, fruit baskets) 4.08 (38%) 3.82 (30%)
Receiving points that can be accumulated or redeemed for a prize of
your choice3.98 (37%) 3.78 (27%)

The Impact of Rewards on Engagement
• The following table shows the impact of various rewards on engagement outcomes.
• Cash bonuses were, by far, the annual reward that people wanted—and received—most
often.
• There were no instances where people received cash bonuses without receiving other
types of recognition, making it difficult to isolate the unique impact of cash bonuses on
engagement outcomes.
• The table compares other types of annual awards to show the relative association of each
to employee engagement and motivation.
• Although sample sizes were often small in some cases, other rewards tended to be
associated with higher job satisfaction, greater intention to recommend the company as a
prospective employers, greater interest in remaining with the company long term,
stronger willingness to invest, and higher likelihood of daily motivation.
• Paid days off, incentive trips, award points, and merchandise were all associated with
high engagement outcomes more so than cash bonuses. An extra paid week of time off
3% (L)

The Impact of Rewards on Engagement
3% (L)
Condition Job satisfaction Happy to stay
entire career
Willingness to
invest
Willingness to
recommend as
employer
Motivated to do
best work
Baseline (everyone) 3.68 (26%) 3.82 (36%) 3.31 (21%) 3.69 (30%) 3.89 (33%)
An extra paid week of time off 4.31 (48%) 4.10 (38%) 3.75 (36%) 4.21 (43%) 4.30 (46%)
Incentive trip for yourself and a companion 4.29 (50%) 4.24 (47%) 4.03 (42%) 4.13 (40%) 4.29 (45%)
A large number of award points 4.26 (41%) 4.23 (51%) 4.03 (39%) 4.15 (41%) 4.15 (46%)
A significant merchandise gift 4.22 (41%) 4.24 (39%) 3.76 (31%) 4.16 (43%) 4.29 (49%)
A promotion with more responsibility 4.09 (39%) 4.08 (45%) 3.78 (36%) 3.94 (38%) 4.38 (52%)
Received a cash bonus 4.08 (39%) 4.19 (48%) 3.62 (26%) 4.06 (41%) 4.20 (45%)
An upgrade in job title 4.01 (40%) 3.85 (35%) 3.79 (35%) 4.04 (38%) 4.18 (45%)
A trophy or plaque for your wall 4.00 (38%) 4.05 (38%) 3.60 (35%) 3.93 (38%) 4.05 (45%)
A meaningful experience* 3.93 (40%) 3.80 (20%) 3.33 (33%) 3.40 (20%) 4.13 (47%)
Company wide recognition as a Top
Performer3.89 (41%) 3.97 (43%) 3.65 (30%) 3.78 (32%) 4.24 (49%)
*Extremely small sample size

Other Related Topics

Key Findings
• Despite the pandemic, job security is anything but guaranteed. Despite this, nearly eight out of
ten (78%) indicated they are feeling either ‘very secure’ or ‘somewhat secure’ about their current
employment situation.
• Only 8% indicated they felt either ‘somewhat’ or ‘very’ insecure about their jobs, with the rest
uncertain.
• While 24% of the ‘secure’ employees reported they had not received any type of recognition
within the past 12 months, the percentage was nearly double (42%) among those feeling job
uncertainty.
• Half of those that receive points as awards tend to find a middle ground between redeeming
them quickly and saving up for a long time.
• Fifty-percent (50%) indicate they accumulate their points for a while, but then redeem them
for something of ‘moderate’ value.
• The remainder are pretty evenly split between redeeming points quickly for something of
smaller value (26%) or saving them for a long time to obtain a high value item (21%).
• Three percent (3%) of those that get points awards tend to forget about them and not
redeem them.

Key Findings
• Over half (53%) expressed a clear preference for tangible rewards over intangible rewards.
• While 39% share an equal preference for tangible and intangible rewards, only a small
minority (9%) showed a preference for intangible rewards.
• Employees are evenly divided as to whether they’d like the source of their recognition to primarily
come from senior leadership (39%) or their direct supervisor (39%).
• A much smaller percentage preferred their primary source of recognition come from their
peers.
• People prefer private recognition over public recognition by a two-to-one margin (44% to 23%),
although one-third (32%) have an equal preference for both public and private recognition.
• The data show that, for the most part, if you prefer to be recognized privately, you are most likely
to avoid the glare of public recognition.
• Only 16% of those that want to be recognized privately, received public recognition.
• However, if you prefer public recognition, you are equally likely to be recognized both
publicly and privately.

Key Findings
• Having a choice of rewards rather than a fixed reward, was ‘very’ or ‘somewhat’ important to
nearly two-thirds (62%).
• Only 11% indicated that having a choice was unimportant.
• There was quite a split on how often people want to be recognized.
• While the largest percentage indicated they wanted to be recognized ‘frequently’ (33%),
there was no consensus on the optimal timing of awards.
• Nearly half (46%) indicated they recently transitioned from working in an office to working at
home remotely.
• The transition to working at home was seen as overwhelmingly positive, with only 8%
describing the transition to working at home in negative terms.
• Nearly two-thirds (64%) are either certain or unsure if the transition will be permanent.
• Interestingly, those who transitioned to working at home had a higher percentage of
receiving at least some kind of recognition in the past 12 months (79%) compared to those
remaining in an office (68%).
3% (L)

Job Security
How secure do you feel about your present employment situation?
3% (L)
3%5%
14%
36%
42%
0%
5%
10%
15%
20%
25%
30%
35%
40%
45%
Not secure at all Somewhat insecure Neither secure nor
insecure
Somewhat secure Very secure

Use of Points
When you received points, did you cash them in right away or accumulate them for a
bigger purchase later? *
3% (L)
26%
50%
21%
3%
0%
10%
20%
30%
40%
50%
60%
I tend to redeem
them for smaller
rewards
I accumulate them
for a while and tend to
redeem them for more
moderate rewards
I hold on them for
a long time to redeem
them for something
big I really want
I tend to forget
about them and often
fail to redeem them
* Asked only of those that received points as a form of recognition and reward (9%)
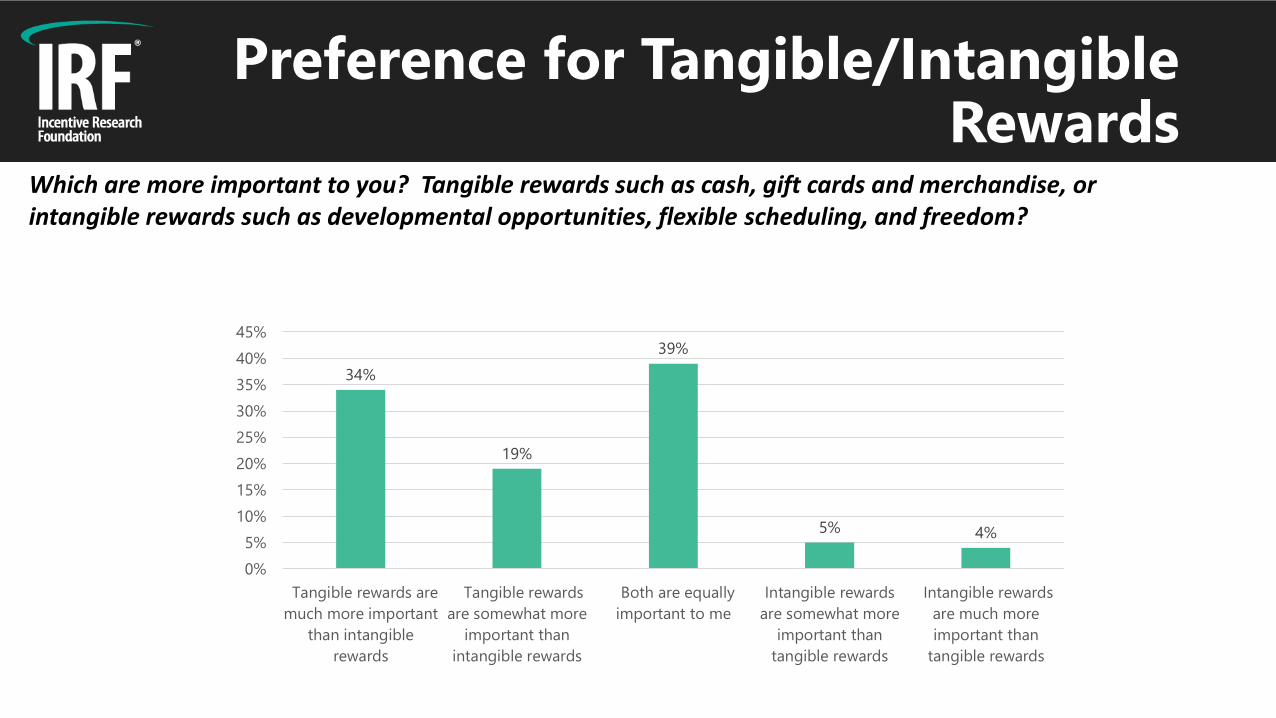
Preference for Tangible/Intangible Rewards
Which are more important to you? Tangible rewards such as cash, gift cards and merchandise, or intangible rewards such as developmental opportunities, flexible scheduling, and freedom?
3% (L)
34%
19%
39%
5% 4%
0%
5%
10%
15%
20%
25%
30%
35%
40%
45%
Tangible rewards are
much more important
than intangible
rewards
Tangible rewards
are somewhat more
important than
intangible rewards
Both are equally
important to me
Intangible rewards
are somewhat more
important than
tangible rewards
Intangible rewards
are much more
important than
tangible rewards

Preferred Source for Recognition
From whom do you most like to be recognized? (Choose one)
3% (L)
39% 39%
17%
5%
0%
5%
10%
15%
20%
25%
30%
35%
40%
45%
Senior leadership Your direct manager Your peers Other

Preference for Public vs. Private Recognition
When you are recognized, do you prefer to be recognized publicly or privately?
3% (L)
21%23%
32%
15%
8%
0%
5%
10%
15%
20%
25%
30%
35%
Greatly prefer private
recognition
Somewhat prefer
private recognition
Like public or private
recognition equally
Somewhat prefer
public recognition
Greatly prefer public
recognition

Public/Private Recognition Received
Which of the following have you received in the past 12 months?
3% (L)Type of recognition
received
Overall % of Those that
preferred private
recognition
% of those that
prefer public and
private recognition
equally
% of those that
prefer public
recognition
Public 27% 16% 30% 44%
Private 47% 49% 45% 43%
Electronic 24% 19% 24% 33%
Handwritten 15% 15% 15% 15%

Importance of Choice
How important to you is the opportunity to choose among a variety of awards options, as
compared to one pre-determined award?
3% (L)
6% 5%
23%
38%
24%
4%
0%
5%
10%
15%
20%
25%
30%
35%
40%
Not important at
all
Somewhat
unimportant
Niether important
nor unimportant
Somewhat
important
Very important Don't know

Preferred Frequency of Recognition
How often do you like to be recognized when you do outstanding work?
3% (L)
20%
33%
17% 16%
12%
2%
0%
5%
10%
15%
20%
25%
30%
35%
Timely or
immediately
Frequently Once a month Quarterly Annually None of the
above

Transition to Remote Work
Have you recently transitioned from working full time at a corporate location to working from your
home office?
3% (L)
46%
48%
6%
Yes No Had already been working at home

Transition to Remote Work
Is the transition intended to be permanent for the foreseeable future?*
3% (L)34%
36%
30%
Yes No Unsure
* Asked only of those that transitioned to remote work (46%)

Transition to Remote Work
Would you describe the transition to working remotely as…?*
3% (L)
32%
42%
18%
7%
1%
0%
5%
10%
15%
20%
25%
30%
35%
40%
45%
Extremely positive Somewhat positive Neither positive nor
negative
Somewhat negative Extremely negative
*Asked only of those that transitioned to remote work (46%)
Key Takeaways from the Study
• The study provides strong evidence for the quality of a company’s recognition program on
employee engagement outcomes such as job satisfaction, motivation, intention to remain
employed, willingness to advocate for the company as both an employer and its product and
services, and even profitability.
• Employees differ in how they like to be recognized for their work contributions.
• ‘One size does not fit all’
• Different preferences exist among the preferred source and delivery of recognition.
• There are some things that are more widely preferred than others.• Paid days off is easily the most preferred type of recognition.
• Other highly desired type of recognition included gifts cards, special experiences like concerts or
ballgames paid for by the company, flexible scheduling, and having a lunch or dinner with
family/friends paid for by the company.
• In some cases, highly desired recognition approaches are severely under-utilized.• Having the company pay all expenses to a special event experience
• Having lunch or dinner with your family paid for by the company
• Food gifts
• Award points that can be redeemed

Key Takeaways from the Study
• In some cases, the recognition people most prefer does not appear as strongly associated with
engagement outcomes as other less preferred recognition.• While you must be careful with cause-effect conclusions, particularly with relatively low sample sizes,
it’s possible that some other approaches, while de-prioritized, represent things people don’t
necessarily say are important, but appreciate when they receive them
• Cash bonuses are an example of a reward nearly everyone prefers, but which tends to have less
of an association with engagement outcomes compared to other annual rewards such as
incentive travel or merchandise awards.
• In the current pandemic, a relatively small portion of the workforce (16%) has changed its
recognition preferences, generally having a greater preference for cash bonuses, gift cards, and
merchandise than for incentive travel or other awards.• The data show, however, that others have shifted toward having a greater preference toward incentive
experiences that are within driving distance and have less interaction with other people.
• Having a choice in rewards/recognition is a very important aspect to the majority of individuals.