reynolds number effects in transonic flowrelated reynolds number regimes - sub-critical, critical,...
TRANSCRIPT

AGARD-IAG-303-
AGARDograph No.303
Reynolds Number Effects inTransonic Flow
DISTRIBUTION AND AVAILABILITYON BACK COVER

AGARD-AG-303
NORTH ATLANTIC TREATY ORGANIZATION
ADVISORY GROUP FOR AEROSPACE RESEARCH AND DEVELOPMENT
(ORGANISATION DU TRAITE DE L'ATLANTIQUE NORD)
AGARDograph No.303
REYNOLDS NUMB3ER EFFECTS IN TRANSONIC FLOW
by
A.ElsenaarNational Aerospace Laboratory NLR
Anthony Fokkerweg 2, 1059 CM AmsterdanmThe Netherlands
T.W.Binion, JrCaispan Corporation/AEDC OperationsArnold Air Force Base, TN 37389, USA
and
E.StanewskyDeutsche Forschungs- und Versuchsanstalt
fiir Luft- und Raumfahrt e.V.Institut ftir Expenimentelle Stromungsmechanik
D-3400 Gottingen, F.R. Germany_______
Edited by IS -~ GRA&II T TAB
H.G.Hornung I nanounced [Graduate Aeronautical Laboratories J tifleation
California Institute of TechnologyPasadena, CA 91125, USA B
Distri-bution/
Availability CodesjAvail and/ar
Dist Special
This AGARDograph has been produced at the request of the Fluid Dynamics Panel of AGARD.

THE MISSION OF AGARD
According to its Charter, the mission of AGARD is to bring together the leading personalities of the NATO nations inthe fields of science and technology relating to aerospace for the following purposes:
- Recommending effective ways for the member nations to use their research and development capabilities for thecommon benefit of the NATO community;
- Providing scientific and technical advice and assistance to the Military Committee in the field of aerospace researchand development (with particular regard to its military application);
- Continuously stimulating advances in the aerospace sciences relevant to strengthening the common defence posture;
- Improving the co-operation among member nations in aerospace research and development;
- Exchange of scientific and technical information;
- Providing assistance to member nations for the purpose of increasing their scientific and technical potential:
- Rendering scientific and technical assistance, as requested, to other NATO bodies and to member nations inconnection with research and development problems in the aerospace field.
The highest authority within AGARD is the National Delegates Board consisting of officially appointed seniorrepresentatives from each member nation. The mission of AGARD is carried out through the Panels which are composed ofexperts appointed by the National Delegates, the Consultant and Exchange Programme and the Aerospace ApplicationsStudies Programme. The results of AGARD work are reported to the member nations and the NATO Authorities throughthe AGARD series of publications of which this is one.
Participation in AGARD activities is by invitation only and is nurmally limited to citizens of the NATO nations.
The content of this publication has been reproduceddirectly from material supplied by AGARD or the authors.
Published December 1988
Copyright 0 AGARD 1988All Rights Reserved
ISBN 92-835-0492-5
HPrinted by Specialised Printing Services Limited40 Chigwell Lane, Loughton, Essex IGIO 317Z
iit
PREFACE
Reynolds number effects in transonic flow are critically reviewed. In this review, the following geometries areconsidered: Airfoils and high aspect ratio wings typical of transport aircraft, fighter-type low aspect ratio delta wings, two-and three-dimensional bodies characteristic of missiles and combat aircraft fuselages, and afterbodies. Also discussed are.pseudo"-Reynolds number effects which may arise, for instance, due to the influence of the Reynolds number on the windtunnel environment which may, in turn, affect the flow about a model. As an introduction to the AGARDograph, a briefretrospect of the "history" of Reynolds number effects is presented. There are two aspects closely related to viscous changeswhich are not discussed herein: the extrapolation of low Reynolds number wind tunnel results to flight conditions andfundamental Reynolds number effects, i.e., for instance, the influence of the Reynolds number on the boundary layerdevelopment and on basic viscous/invi,--id interactions such as shock boundary layer interaction and trailing edgeseparation. Both topics are comprehensively treated in the report of the AGARD Working Group 09 "Boundary LayerSimulation and Control in Wind Tunnels" whose task it was to provide a methodology for transonic wind tunnel testing andthe extrapolation of low Reynolds number wind tunnel results to flight conditions. The present AGARDograph, mainlyconcerned with a discussion of viscous effects actually observed on realistic configurations, can be considered a supplementto the report of AGARD WG 09.
Systematic study of Reynolds number (scale) effects, which obtained new impetus with the introduction of advancedtransonic airfoils and wings, frequently revealed "anomalies" which could be traced to the wind tunnel environment andmeasuring techniques and their response to Reynolds number changes. These "anomalies", sometimes labelled "unit"-Reynolds number effects, are best described as "pseudo'-Reynolds number effects. Factors which have the potential ofintroducing pseudo-Reynolds number effects include: wall interference, tunnel Mach number calibration, noise, turbulence,humidity, non-uniform flow, flow contamination, side wall effects in two-dimensional tests, model deformation and transitionfixing. True Reynolds number effects on transport-type airfoils and wings were found to be mainly related to twophenomena: transition point movement and the development of separation. Especially large variations in pressuredistributions and corresponding force and moment coefficients were observed with varying Reynolds number whenseparation extended from the foot of the shock to the airfoil trailing edge and when the flow changed from a separated to anattached state as Reynolds number was increased (or vice versa). For conditions with attached or almost attached flow,Reynolds number effects appear to be smaller, though certainly not insignificant. Available data for low aspect ratio fighter-type configurations depicting Reynolds number effects are sparse. The data which are available, however, suggest for most ofthe flight regime of interest that Reynolds number effects are small.
The Reynolds number sensitivity of bodies is also strongly related to flow separation. Considering the classical body-related Reynolds number regimes - sub-critical, critical, supercritical and hypercritical - viscous effects are especiallystrong in the critical Reynolds number range, where large changes in the aerodynamic forces occur due to the sensitivity oftransitional separation to viscous changes. The flow is not very sensitive to Reynolds number variations in the subcritical(laminar) and hypercritical (fully turbulent) Reynolds number domains in which separation is essentially fixed by pressuregradient. With increasing Mach number, the Reynolds number sensitivity also diminishes rapidly in the critical andsupercritical domains due to the development of local supersonic regions with terminating shock waves strong enough toseparate even the turbulent boundary layer. Significant changes in afterbody drag were consistently observed for subsonicMach numbers above the transonic drag rise as result of the influence of viscous changes on the expansion around theshoulder of the afterbody and/or the pressure recovery downstream. The direction of the Reynolds number influence, i.e.,increasing or decreasing boattail drag with Reynolds number, seems to be dependent on whether viscous changespredominantly alter the shoulder expansion or the pressure recovery, the latter being closely coupled with the developmentof separation over the rear of the afterbody.
Cette AGARDographie pr~sente un examen des effets du nombre de Reynolds dans les icoulements transsoniques.Les geometries suivantes sont examinees: les profiles et les ailes i grande allongement caracteristiques des adronefs detransport, les voilures en delta i faible allongement typiques des avions de chasse, les corps bi- et tri-dimensionnelscaractifistiques des fuselages de missiles et d'a~ronefs de combat, et les arrire-corps.
Les effets des "pseudo" nombres de Reynolds sont 6galement examin6s. Ces effets peuvent se produire, par exemple, enraison de l'influence du nombre de Reynolds sur le millieu ambiant de la soufflerie, ce qui risque, A son tour, de modifier lesicoulements autour d'un modle. Un bref risum de 1'historique" des effets du nombre de Reynolds est prdsent6 enpreambule i 'AGARDographie.
Deux aspects 6troitement his aux changements de viscositi ne sont pas traitds: il s'agit de rextrapolation aux conditionsde vol des resultats obtenus en souffleie A des nombres de Reynolds peu dlevds et des effets fondamentaux du nombre deReynolds, c'est & dire, par exemple: ['influence du nombre de Reynolds sur ce ddveloppement de la couche limite et sur lesinteractions visqueuse/non visqueuse de base, telles que l'interaction choc/couche limite et le decohlement au bord de fuite.Ces deux sujets sont traits de faqon complete dans le rapport du groupe de travail 09, intituld "La simulation et le contr6lede la couche limite en soufflerie" qui a pour objectif de fournir une mithodologie pour le essais en souffierie transsonique etpour V'extrapolation au condition de vol des risultats obtenus en soufflerie, i des nombres de Reynolds peu ilevds.
iii
La prisente AGARDographie, qul concerne rincipalement des effets visqueuui examines in-situ et produits par desconfigurations r~elles, peut tre consideree comnme un supplement au rapport du groupe de travail AGARD 09.
U'tude syst~natique des effets dui nombre de Reynolds (effets d'echelle qui a reiu une nouvelle impulsion avec:l'arivie de profis airodynarniques; et de voilures transsoniques avancdes, a souvent r~vel6 des "anomalies" parfois appeleesdes effets de nombre de Reynolds -unite" seraient mieux definies par le tenne "effets de pseudo-nombre de Reynolds".
Les phinomi~nes susceptibles de crder des effets de pseudo-nombre de Reynolds sont les suivants: 1'effet de paroi,l'tallonage du nombre de Mach de la soufflerie. le bruit, la turbulence, l'humidit6, le6coulement non-uniforme, lacontamination de H'coulement, les effets des parois lat~rales iors des essais bi-dimensionnels, les deformations de lamaquette et le d&Ilenchement de la transition.
Lea effets des nombres de Reynolds riels sur les profils aerodynamiques et les voilures des adronefs de transport,dependent principalement de deux phenonsenes: le deplacement du point de transition et le declenchement de Ia separation.Des ecarts particuli~rement importants de la repartition des pressions et des coefficients de force et de moment ont Wtobserv6s en fonction de la variation du nombre de Reynolds, lorsque le decollement s'~tendait dui pied du choc jusqu'au bordde fuite du profil a~rodynamique ct Iorsqu'une ecoulement detache changeait d'6tat pour devenir in ecoulement attache aufur et mesure de l'augmentatic'n du nombre de Reynolds (ou vice-versa)
Dans Ic cas d'une 6coulement attachd ou quasi-attach6. Ivs cifets du nunibre dc Reynolds semblent momns importants.sans &tre insignifiants pour autant.
Tr~s peu de donn&s sont disponibles concernant les configurations du type avion de chasse h faible allongementrelatant les effets dui nombre de Reynolds. Pourtant. les; donn~cs existante indiquent que les effets dui nombrc de Reynoldssont pcu marques dans la majeur partie du regime de vol en question.
La reaction des corps au nombre de Reynolds est 6galement 6troitement li~e au decollement. En considerant lesregimes classiques du nombre de Reynolds associ~s au corps, soit, sous-coitique, critique, SUrcritique et hypercritique, leseffets visqucux sont particulierement forts dans le domaine des nombres de Reynolds critiques. ou d'importantestransformations dans les forces a~rodynamiques se prodoisent, en raison des effets du decollement en regime de transitionprovoqu~s par les changements de viscosit6.
L'dcoulement W'est que peu sensible A des variations dui nombre de Reynolds dans les domaines Reynolds sous-critiques (laminaires) et hypercritiques (entierement turbulents), oo le point de decollement est essentiellement regi par legradient de pression. L'effet dui nombre de Reynolds dans les domaines critiques et sorcritiques diminue rapidement aussi.au fur et a mesure de l'augmentation dui nombre de Mach, en raison de l'tablissement de zones locales supersoniques,engendrant des ondes de choc terminales d'une puissance telle a provoquer m~me le decollement de la couche limitetoorbillormaire.
Des modifications non-negligeables de la trainee de l'arri~re corps ont kt6 observees de fagon systematique, pour desnombres de Mach sub-soniques qoi correspondent A l'accroissement de la trainee en regime transsonique, par suite del'influence des changements de viscosit6 sur la detente de N'coulement autour de I'paulement de I'arri~re corps et/ou larecuperation de pression en aval. La direction de I'nfluence dui nombre de Reynolds, c'est A dire, l'augrnentation ou Iadiminution de la trainee de retreint en fonction du nombre de Reynolds, semble dipendre des changements de viscosit6, quimodifient d'une mani~re pT~dominante soit Ia detente de 1'6coulement autour de 1'6paulement, suit la r~cuperation depression, cette demniere etant 6troitement Iiee au developpement dui decollement sur la partie arriere de l'arriere corps.
iv
CONTENTS
Page
SUMMARY i
NOMENCLATURE vi
CHAPTER 1: INTRODUCTIONby A. Elsenaar 1
1.1 HISTORICAL REVIEW 11.2 SCOPE OF REPORT 2
1.2.1 Classification 21.2.2 Direct versus indirect Reynolds number effects 31.2.3 The sensitivity to Reynolds number: A matter of definition? 3
CHAPTER 2: POTENTIALS FOR PSEUDO-REYNOLDS NUMBER EFFECTSby T.W. Binion, Jr. 7
2.1 INTRODUCTION 72.2 WALL INTERFERENCE 72.3 NOISE AND TURBULENCE 82.4 HUMIDITY EFFECTS 92.5 TUNNEL CONTAMINATION 102.6 TUNNEL CALIBRATION 102.7 SIDEWALL EFFECTS IN 2-D TESTS 112.8 NON-UNIFORM FLOW 112.9 THERMAL NONEQUILIBRIUM 112.10MODEL DEFORMATION 122.11TRANSITION FIXING 12
CHAPTER 3: OBSERVED REYNOLDS NUMBER EFFECTS: AIRFOILS AND HIGHASPECT RATIO WINGS
by A. Elsenaar 17
3.1 INTRODUCTION 173.2 EFFECTS RELATED TO PARTLY LAMINAR BOUNDARY LAYER FLOW 17
3.2.1 The direct effect on drag 173.2.2 Indirect effects on the pressure distribution 183.2.3 Effects on lift and pitching moment 18
3.3 FLOWS WITH (ALMOST) ATTACHED TURBULENT BOUNDARY LAYERS 223.3.1 The pressure distribution - overall effects 222.3.2 The pressure distribution - local effects 223.3.3 Lift and pitching moment 233.3.4 Drag and drag-divergence 24
3.4 FLOWS WITH TURBULENT BOUNDARY LAYER SEPARATION 323.4.1 The classical distinction between type "A" and "B" separation 323.4.2 The flow break-down boundary revised 323.4.3 Post stall behaviour 34
3.5 THREE-DIMENSIONAL EFFECTS 393.5.1 The correspondence between two- and three-dimensional flow 393.5.2 Some examples of three-dimensional effects 39
3.6 CONCLUDING REMARKS: FROM WIND TUNNEL TO FLIGHT 45
CHAPTER 4: OBSERVED REYNOLDS NUMBER EFFECTS: LOW ASPECT RATIO WINGS AND BODIESby T.W. Binion, Jr. and E. Stanewsky 51
4.1 LOW ASPECT RATIO WINGS 514.1.1 Zero-lift-drag 514.1.2 Delta wings 514.1.3 Aerodynamic derivations 524.1.4 Buffet 524.1.5 Transonic technology wing program 53
4.1.6 Summary 534.2 BODIES 56
4.2.1 Introduction 56
4.2.2 Cylinders in normal flow 564.2.3 Cylinders in oblique flow 57
4.2.4 Three-dimensional bodies 584.2.5 Afterbody and base flow 604.2.6 Conclusion 62
CHAPTER 5: CONCLUDING REMARKS 71
REFERENCES 75
V

NOMENCLATURE
b Wing span
Bi/2 Viscous flow parameter, see Ref. [79/1]
ccav Average or mean aerodynamic chord
CA Axial-force coefficient
C,c,co Aerodynamic chord
Es Steady bending moment coefficient
CB Unsteady bending moment coefficient
CO Drag coefficientCnA Afterbody pressure drag coefficient
C~o Base drag coefficient
CDJ Induced drag coefficientCD. Zero lift drag coefficient
Cd Section drag coefficient
CFF Lockheed Compressible Flow Facility
Cdoup Experimental section drag coefficient
Cdrjr Section drag coefficient based on form factorCf Skin friction coefficient
CL,CL Lift coefficient
Ci,Ce Wing section lift coefficient
CN,CE Pitching moment coefficient
C.,C Normal force coefficient
C11 Normal force coefficient based on fuselage plan area
Cap Slope of normal force vs yaw angle curveCp* Pressure coefficient at local sonic velocity
Cp Pressure coefficient
Cp5 Base pressure coefficient
Cpt.,CPTE Trailing edge pressure coefficient
C, Side force coefficient
d Porous wall hole diameter
D Diameter of cylinder on body
f Frequency
FF Form factor
H, H Shape factor
Ho Total pressure
HST NLR High Speed Tunnel
K, "Each" factor
I Chord
16 Shock induced separation bubble length
L Lower, or length
L.E. Leading edge
M Mach number
M&,MoM. Free stream Mach number
14D Design Mach number
NL,MKe,Noc Local Mach number
14ss Mach number just upstream of shock
M-c Cross flow Mach number
p Pressure
P., PT Total pressure
P., Sound pressure
Per Pressure coefficient at sonic velocity
q, q. Free-stream dynamic pressure
R, Re, Ry Reynolds number
RD, ReD Reynolds number based on body diameter
Ree, Rec Reynolds number based on chord
AI
Recm Reynolds number based on tunnel contraction and nozzle surface length
Reeff Effective Reynolds number, ReD - X.
ROL Reynolds number based on body length
Re? Reynolds number at the beginning of boundary-layer transition
Reya Transition Reynolds number with adiabatic wall
Re/? Unit Reynolds number, ft-I
ReO. Reynolds number based on displacement thickness
Re,., Reynolds number based on displacement thickness at the beginning of
the test section
Re, Reynolds number based on momentum thickness
Reea Reynolds number based on momentum thickness just upstream of shock
R, Reynolds number based on body width
RwT Roughness height or corner radius of non-circular cylinder
S Surface distance
S/C Ratio of model reference area to tunnel cross-section area
ST Stroubal number
STN Station
T.E. Trailing edge
Taw Adiabatic wall temperature
TT Total temperature
T Wall temperature
t Thickness
u, Velocity at the edge of the boundary layer
U Upper
u. Fluctuating component of axial velocity
ue Boundary laymr edge velocity
V Velocity
X,x Axial distance
XT, X/Ctr Transition location
XCSH, X/csH Shock location in terms of chord
y Spanwise coordinate
a Angle of attack
(Odi, Incidence angle for divergence of trailing edge pressure
of Fuselage angle of attack
0Compressibility factor
y Ratio of specific heats
A Sweep angle
ARatio of test section height to width
Displacement thickness
Lift interference factor
qSemi-span ratio
Os Momentum thickness just upstream of shock
6 Momentum thickness
Azimuth angle at separation
a Specific humidity
T Wall porosity or skin friction
* Flow angle at porous wall on roll angle
vii
I4

1. INTRODUCTIONby
A. ElsenaarNational Aerospace Laboratory NLR
Anthony Fokkerveg 2. 1059 CM AmsterdamThe Netherlands
1.1 Historical reviewIt is of considerable interest to exam ne the lines cf thought with respect to Reynolds number ef-
fects in the past. This review, however, is not intended to be a complete coverage, the main intentionbeing to highlight some of the more important events and related publications that increased the under-standing or have changed the attitude of the scientific comunity towards what is called quite generally"Reynolds number effects". In this AGARDograph the discussion of Reynolds number effects is restricted totransonic flows. Thus, one should look for the earliest evidence at the end of the second world war whentransonic flight became a topic of systematic scientific study.
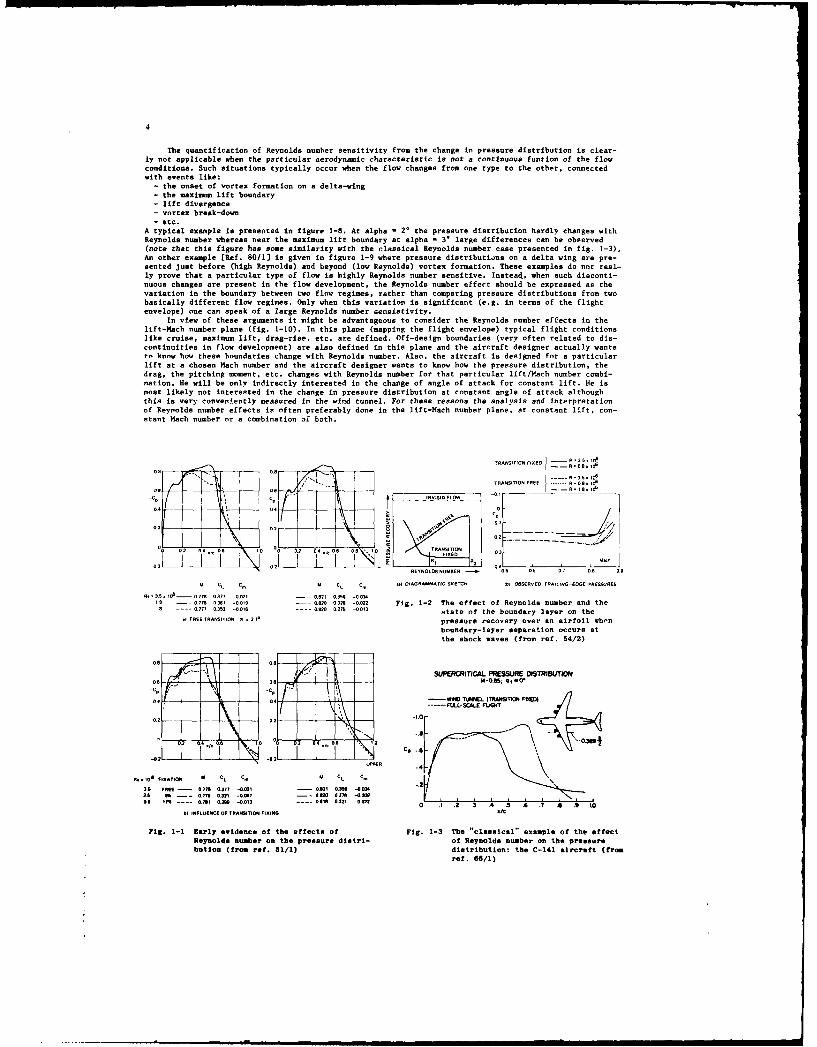
Indeed, in the early fifties almost simultaneously a NACA [Ref. 52/2] and a RAE [Ref. 51/1] reportwere published that dealt with Reynolds number effects on swept wing configurations. Both studies hadbeen initiated to investigate the cause of previously observed Reynolds number effects on lift and pitch-ing moment of balance mounted models. These studies indicated, on the evidence of measured pressure dis-tributlons, that the region of shock-wave boundary layer interaction decreased with increasing Reynoldsnumber. In the NACA report it was argued that the typical lambda shock pattern for laminar shock-waveboundary layer interaction as observed at a Reynolds number of 2 x 10**6 disappeared at a Reynolds numberof 4 - 6 x 10**6 due to turbulent boundary layer flow. This was less clear in the RAE tests in which lami-nar boundary layer flow was still observed at the highest Reynolds number of 3.5 x 10a*6. However, atthat condition the size of the shock interaction region was much smeller as compared with the Re - 0.8 x10*e6 results (see fig. 1-1a). The resulting change in the pressure distribution significantly affectedthe section lift and pitching moment which was further amplified in the wing pitching moment due to theswept wing configuration. The prevailing thought at that time was that, since a laminar boundary was verysusceptible to (pressure or shock induced) separation, the turbulent boundary layer development at higherReynolds number would result in higher lift values. Instead, a decrease in lift was observed.It was argued In the RAE report that fixing transition at low Reynolds number would remove the main pro-blem caused by a thick laminar boundary layer. The results might then be comparable with the actual pres-sure distribution at flight Reynolds number. It was already indicated in the report, however, that for-ward fixation can produce premature trailing edge separation and a more forward shock (see fig. 1-1b). Itis of interest to note here that the same figure shows a nice example of what is now called the "aft-fixation" technique.
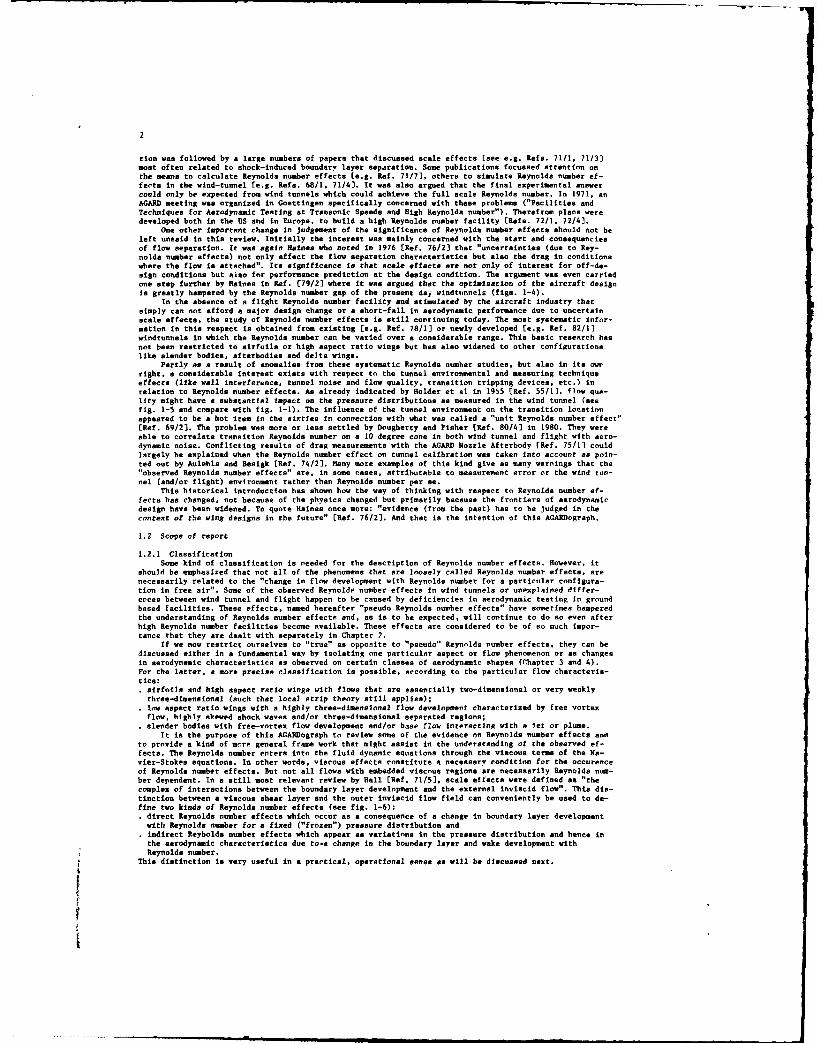
In 1954 a review written by Pearcey and Holder [Ref. 54/1] was devoted to a discussion of adverseaerodynamic effects that severely limited flight handling qualities at transonic speeds, i.e. high speedbuffet, aileron floating, wing-drop and pitch-up. It was argued that the effects were related to shockinduced separation. The analysis is based largely on the interpretation of trailing edge pressures thatappeared to rise quite suddenly for shock Mach numbers between 1.22 and 1.24. The problem of scale effectwas not specifically addressed, although it was mentioned in a footnote that for a proper comparison withflight "the tunnel tests should, of course, be made with transition fixed". The case for transition fixingwas discussed in much more detail at about the same by Haines, Holder and Pearcey [Ref. 54/2) who statedthat "the major scale effects at highsubsonic and transonic speeds arise from differences between theconditions under which laminar and turbulent boundary layers separate, and in how they behave after separa-tion".
As can be inferred from the "diagrammatic" sketch in figure 1-2 taken from Ref. (54/2), it was ex-pected that scale effects were much less severe with turbulent boundary layer development and the result-ing message was a clear one: fix the boundary layer in wind tunnel tests. Techniques discussed for doingso are distributed roughness (carborundum and ballotini), wires, adhesive tape and blowing, and remind usthai there is -,*,Ing new today in t:,Is respect.
The noted difference between laminar and turbulent shock-wave boundary layer interactions was not atall unknown at that time as fundamental studies [see e.g. Ref. 46/11 had already indicated the phenomenayears before. The new aspect was the notion that the differences could be related to adverse aerodynamiceffects in high speed flight due to separation and scale effects. This notion stimulated basic researchof shock-wave boundary layer interaction thereafter as reflected In a number of publications [e.g. Refs.52/1, 55/1 and 55/2]. At the same time, control of the shock-wave formation on airfoils was attemptedleading finally to the design of shock free supercritical airfoils [see e.g. Ref. 62/1]. The classicalairfoil designs like the NACA ;-series with laminar flow (provided the wing surface was smooth enough)and without any appreciable rear loading, were replaced by designs of the "pesky" type (moving transitionnear the nose) and with a substantial amount of rear loading.
In 1966 a NASA report tRef. 66/1) written by Loving was published that shoved large differences be-tween wind tunnel and flight data for the C-141 aircraft (fig. 1-3). As he wrote: "the purpose of thediscussion is to caution experimenters concerning the use of wind-tunnel results in predicting flight
• loads and momenta when supercritical separated flow is present". This event (or at least his figures.judged by the number of times they have been referenced) swept through the aerodynamic community like ashock wave, bringing a number of researchers and aircraft designers into a state of buffeting. Lovinghimself reported that "the results disclosed herein should not come as i surprise; they are merely addi-tional evidence of the problem associated with separating flows". Scale effects had again become an areaof considerable concern.
* In a 1968 paper by Pearcey, Osborn and Haines [Ref. 68/2), a physical model was postulated that ex-plained the aspect of the problem in more detail. The flows about the mid-fifties type airfoils were eles-sified as type "A" separation, dominated by strong shock waves with separation rapidly developing fromthe shock to the trailing edge. This kind of flow was considered to be veakly Reynolds number dependent.However, the larger load carried by the aft part of modern airfoils could provoke "classical" (low speed)trailing edge separation even in the absence of shock waves which is considered to be Reynolds numberdependent. They noted: "It is not surprising, therefore, to find these sensitivities carried over intoflows in which rear separation and the local effects of the shock interact with one another, nor indeedto find them amplified by the interaction". They named this phenomenon type "B" separation. The publics-
2
tlon was followed by a large numbers of papers that discussed scale effects (see e.g. Refs. 71/1, 71/3]most often related to shock-induced boundary layer separation. Some publications focussed attention onthe means to calculate Reynolds number effects (e.g. Ref. 71/7), others to simulate Reynolds number ef-fects in the wind-tunnel [e.g. Refs. 68/1, 71/43. It was also argued that the final experimental answercould only be expected from wind tunnels which could achieve the full scale Reynolds number. In 1971, anAGARD meeting was organized in Goettlngen specifically concerned with these problems ("Facilities andTechniques for Aerodynamic Testing at Transonic Speeds and High Reynolds number"). Therefrom plans weredeveloped both in the US and in Europe, to build a high Reynolds number facility (Refs. 72/1, 72/41.
One other Important change in judgement of the significance of Reynolds number effects should not beleft unsaid in this review. Initially the interest was mainly concerned with the start and consequenciesof flow separation. Ir was again Raines who noted in 1976 [Ref. 76/2) that "uncertainties (due to Rey-nolds number effects) not only affect the flow separation characteristics but also the drag in conditionswhere the flow is attached". Its significance is that scale effects are not only of interest for off-de-sign conditions but also for performance prediction at the design condition. The argument was even carriedone step further by Raines in Ref. (79/23 where it was argued that the optlmisation of the aircraft designis greatly hampered by the Reynolds number gap of the present day windtunnels (figs. 1-4).
In the absence of a flight Reynolds number facility and stimulated by the aircraft industry thatsimply can not afford a major design change or a short-fall in aerodynamic performance due to uncertainscale effects, the study of Reynolds number effects is still continuing today. The most systematic infor-mation in this respect is obtained from existing [e.g. Ref. 78/1] or newly developed [e.g. Ref. 82/1)windtunnels in which the Reynolds number can be varied over a considerable range. This basic research hasnot been restricted to airfoils or high aspect ratio wings but has also widened to other configurationslike slender bodies, afterbodies and delta wings.
Partly as a result of anomalies from these systematic Reynolds number studies, but also in its owrright, a considerable interest exists with respect to the tunnel environmental and measuring techniqueeffects (like wall interference, tunnel noise and flow quality, transition tripping devices, etc.) inrelation to Reynolds number effects. As already indicated by Holder et at in 1955 (Ref. 55/13. flow qua-lity might have a substantial impact on the pressure distributions as measured in the wind tunnel (seefig. 1-5 and compare with fig. 1-1). The influence of the tunnel environment on the transition locationappeared to be a hot item in the siriles in connection with what was called a "unit Reynolds number effect"[Ref. 69/23. The problem was more or less settled by Dougherty and Fisher (Ref. 80/4) in 1980. They wereable to correlate transition Reynolds number on a 10 degree cone in both wind tunnel and flight with aero-dynamic noise. Conflicting results of drag measurements with the AGARD Nozzle Afterbody (Ref. 75/1) couldlargely be explained when the Reynolds number effect on tunnel calibration was taken into account as poin-ted out by Aulebla and Besigk (Ref. 74/2). Many more examples of this kind give as many warnings that the"observed Reynolds number effects" are, in some cases, attributable to measurement error or the wind tun-nel (and/or flight) environment rather than Reynolds number per se.
This historical introduction has shown how the way of thinking with respect to Reynolds number ef-fects has changed, not because of the physics changed but primarily because the frontiers of aerodynamicdesign have been widened. To quote Haines once more: "evidence (from the past) has to be judged in thecontext of the wing designs in the future" [Ref. 76/2). And that is the intention of this AGARDograph.
1.2 Scope of report
1.2.1 ClassificationSome kind of classification is needed for the description of Reynolds number effects. However, it
should be emphasized that not all of the phenomena that are loosely called Reynolds number effects, arenecessarily related to the "change in flow development with Reynolds number for a particular configura-tion in free air". Some of the observed Reynolds number effects in wind tunnels or unexplained differ-ences between wind tunnel and flight happen to be caused by deficiencies in aerodynamic testing In groundbased facilities. These effects, named hereafter "pseudo Reynolds number effects" have sometimes hamperedthe understanding of Reynolds number effects and, as is to be expected, will continue to do so even afterhigh Reynolds number facilities become available. These effects are considered to be of so much impor-tance that they are dealt with separately in Chapter 2.
If we now restrict ourselves to "true" as opposite to "pseudo" Reynolds number effects, they can bediscussed either in a fundamental way by isolating one particular aspect or flow phenomenon or as changesin aerodynamic characteristics as observed on certain classes of aerodynamic shapes (Chapter 3 and 4).For the latter, a more precise classification is possible, according to the particular flow characteris-tics:
airfoils and high aspect ratio wings with flows that are essentially two-dimensional or very weaklythree-dimensional (such that local strip theory still applies);low aspect ratio wings with a highly three-dimensional flow development characterized by free vortexflow, highly skewed shock waves and/or three-dimensional separated regions;slender bodies with free-vortex flow development and/or base flow Interacting with a let or plume.
It is the purpose of this AGARDograph to review some of the evidence on Reynolds number effects andto provide a kind of more general frame work that might assist in the understanding of the observed ef-fects. The Reynolds number enters into the fluid dynamic equations through the viscous terms of the Na-vier-Stokes equations. In other words, viscous effects constitute a necessary condition for the occurenceof Reynolds number effects. But not all flows with embedded viscous regions are necessarily Reynolds num-ber dependent. In a still most relevant review by Hall (Ref. 71/5], scale affects were defined as "thecomplex of interactions between the boundary layer development and the external inviscid flow". This dis-tinction between a viscous shear layer and the outer inviscid flow field can conveniently be used to de-fine two kinds of Reynolds number effects (see fig. 1-6):
direct Reynolds number effects which occur as a consequence of a change in boundary layer developmentwith Reynolds number for a fixed ("frozen") pressure distribution andindirect Reybolds number effects which appear as variations in the pressure distribution and hence inthe aerodynamic characteristics due to-a change In the boundary layer and wake development withReynolds number.
This distinction Is very useful in a practical, operational sense as will be discussed next.

1.2.2 Dire, eruus indirect Reynolds number effectsAtcorditng to its definition direct Reynolds number effects can be calculated or estimated with the
help of undary layer calculation methods and/or semi-empirical correlations. However, the so calculateddirect Reynolds number effects are only relevant for the prediction of scale effects in so far as theIndirect Reynolds number effects are absent or negligible small. This is to some extent true for attachedflow conditions but as soon as local effects of separation (e.g. near the trailing edge or at the foot ofa shock wave) are present significant changes in pressure distribution might result. For larger separatedflow regions the distinction is even less relevant: direct and indirect Reynolds number effects are es-sentially coupled.
This is all very similar to the distinction between weak and strong interactions as used by Hall inthe above referenced paper. More recently this classification is also used in computational fluid dyna-mics to describe the mathematical approach of the coupling of viscous and inviscid fluid flow (see e.g.Ref. 83/2]. Basically, the strong interaction approach removes the so called Goldstein singularity forseparated flows and involves a (quasl-)simultaneous solution of outer (inviscid) and inner (viscous) flowfields. In other words: for separated flows the direct and indirect Reynolds number effects are formalycoupled.
The moat simple and very regular dlrecr Reynolds number effect is related to the change in boundarylayer development fora well developed laminar or turbulent boundary layer. The boundary layer propertiesgenerally vary as Re with n - 2 for laminar and n a 5 for turbulent flow. Skin friction drag, beingthe best observable example of a direct Reynolds number effect, varies accordingly. Equally important isthe change in displacement thickness with Reynolds number. This change modifies the external invlscidflow field and is therefore, by definition, the cause of indirect Reynolds number effects. It is to beexpected that a regular and continuous change in displacement thickness results in comparable smooth chan-ges in the outer flow field.
A very significant and irregular direct Reynolds number effect stems from the transition from laminarto turbulent boundary layer flow. For swept wings the attachment line flow can be either laminar or turbu-lent, depending on Reynolds number, sweep angle and leading edge shape. For flat plate (subsonic or tran-sonic) flow, a situation somewhat similar to the boundary layer develpment ahead6of the shock on trans-port-type wings, the transition Reynolds number varies between 2 x 10 and 5 x 10 depending on noiselevel and free-stream turbulence. The corresponding chord Reynolds number Is often just in between theReynolds numbers of the wind tunnel model and the flying aircraft. These variations in transition locationmay interact with the outer field in a highly non-linear way. They are very often clearly discernable inthe development of the aerodynamic characteristics. Even more important: laminar boundary layers fundamen-tally behave differently compared with turbulent boundary layers. As a typical example, s much smallerpressure gradient is needed for a laminar boundary layer to separate than for a turbulent boundary layer.Consequently, transition point changes might trigger significant changes in boundary layer separation aswill be discussed next.
The moat important direct Reynolds number effect is the Reynolds number influence on the start ofseparation (separation onset or incipient separation) and the subsequent separation development. Vortexburst or wake-stall are similar, but probably less critical phenomena in this respect. In all theme casesone deals essentially with an interaction between the vicous flow development and the inviscid outer flowfield, with large consequences for the pressure dfstrhutin. They are, for that reason, the cause ofsignificant Indirect Reynolds number effects. The onset of separation is very often described in terms ofa viscous flow parameter (shape factor, Reynolds number based on displacement thickness etc.), althoughstrictly speaking, locally a strong interaction approach may be more appropriate. When separations areconfined t a small part of the flow field (e.g. a leading edge separation bubble or a local trailingedge separation) the effects on the outer flow field are only felt by a change in Kutta condition. Thisin turn affects the circulation and hence the overall flow field. In some cases, the resulting flow deve-lopes continuously, though sometimes highly non-linearly from the attached to partly separated flow condi-tions. In other cases, however, the separation might set-off a chain of reactions, leading finally to acomplete and sudden break down of the flow field.
The direct Reynolds number effects will not be discussed in great depth in this AGARDograph. A verythorough discussion of these effects can be found in the report of the Research Committee of the ACARDworking group 09 "Wind Tunnel Boundary Layer Simulation end Control" (Ref. 88/1.
1.2.3 The sensitivity to Reynolds number: A meatter of definition?Some configurations or types of flow are reported to be highly sensitive to changes in Reynolds num-
ber. But what precisely Is meant with such a qualification?Reynolds number sensitivity can be defined as the vatiation in aerodynamic ch.racteristics (like
lift, drag. pitching moment, pressure distribution ...) with Reynolds number for a particular configura-tion (shape) at constant flow conditions (like Kach. alpha ...). This sensitivity can in principle beobtained by plotting the particular aerodynamic characteristic versus Reynolds number. Unfortunately, Itis not an easy matter to do an experiment in which only the Reynolds number is varied and all other flowconditions are kept constant. Even apart from tunnel environmental effects, that might introduce the"pseudo" Reynolds number effects to be discussed in chapter 2, the nominal flow conditions in Kach andincidence are rarely reproduced exactly. Also, in wind tunnel flight comparisons small configuration dif-ferences are almost inevitable. Por these reasons the analysis of Reynolds number effects often requiressome kind of interpolation or, at least, an estimation of the involved accuracies.
If it is assumed that the derivative with respect to Reynolds number can be defined for a particularaerodynamic characteristic, it still remains to be Judged if the Reynolds number sensitivity is large orsmell. A very pragmatic criteria is: Reynolds number effects are large when they affect significantly thedesign (performance) of an aircraft as derived from sub-scale wind tunnel testing. Three drag-counts vari-ation in drag-creep will be significant for a transport type aircraft, but irrelevant for a manoeuvringcondition of a fighter configuration. An other, slightly different view is that Reynolds number effectsshould be considered large when the indirect Reynolds number effects are large. Most direct Reynolds num-ber effects (like skin-friction) follow well established rules. One should only worry when the indirectReynolds number effects are significant. Indeed. very often changes in pressure distribution are presen-ted to emphasize that a particular kind of flow is Reynolds number sensitive. Unfortunately, such a proofis not sufficient since some pressure distributions are sensitive to changes In other flow conditions aswall. A typical example is the design condition of certain supercritical airfoils that are known to bevery sensitive to small Mach number and angle of incidence changes (see fig. 1-7; note that these resultshave been obtained in an adaptive wall wind tunnel where flow conditions ere exceptionally well definedClef. 65/1]).
4
The quantification of Reynolds number sensitivity from the change in pressure distribution is clear-ly not applicable when the particular aerodynamic characteristic is not a continuous funtion of the flowconditions. Such situations typically occur when the flow changes from one type to the other, connectedwith events like:- the onset of vortex formation on a delta-wing- the maximum lift boundary- lift divergence- vortex break-dorn- etc.
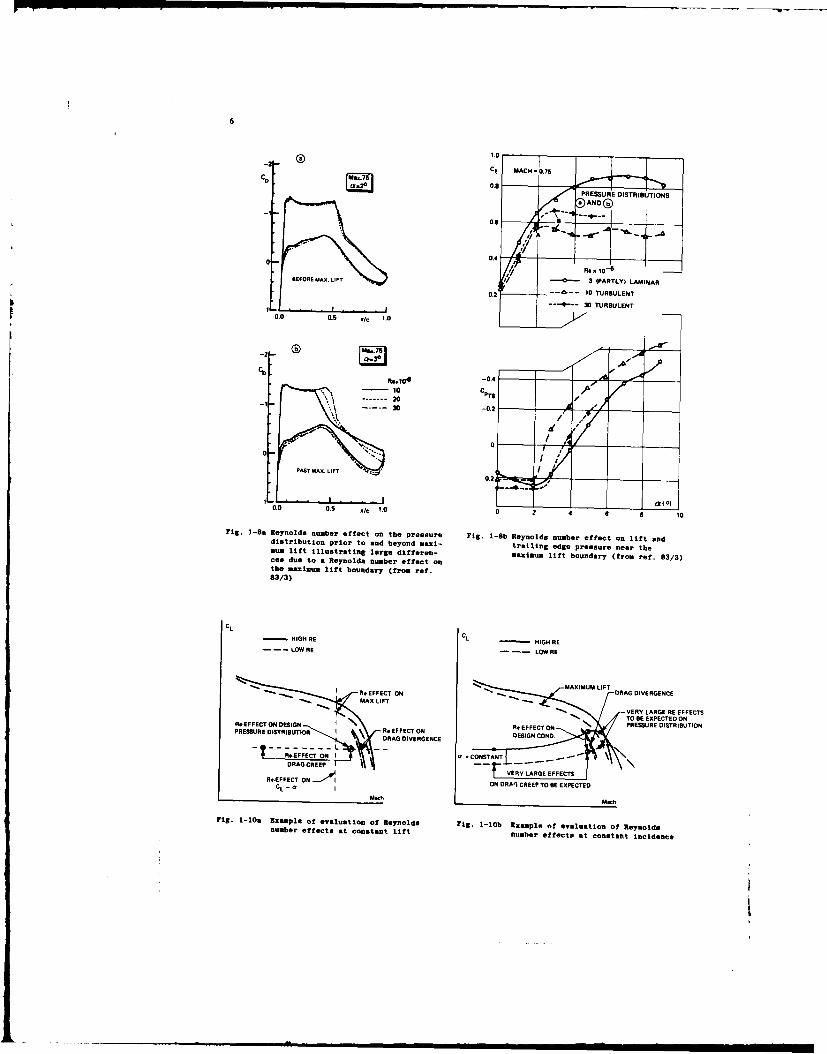
A typical example is presented in figure 1-8. At alpha - 2* the pressure distribution hardly changes withReynolds number whereas near the maximum lift boundary at alpha - 3' large differences can be observed(note that this figure has some similarity with the classical Reynolds number case presented in fig. 1-3).An other example [Ref. 80/1) is given in figure 1-9 where pressure distributions on a delta wing are pre-sented just before (high Reynolds) and beyond (low Reynolds) vortex formation. These examples do not real-ly prove that a particular type of flow is highly Reynolds number sensitive. Instead, when such disconti-nuous changes are present in the flow development, the Reynolds number effect should be expressed as thevariation In the boundary between two flow regimes, rather than comparing pressure distributions from twobasically different flow regimes. Only when this variation is significant (e.g. in terms of the flightenvelope) one can speak of a large Reynolds number sensistivity.
In view of these arguments it might be advantageous to consider the Reynolds number effects in thelift-Mach number plane (fig. 1-10). In this plane (mapping the flight envelope) typical flight conditionslike cruise, maximum lift, drag-rise, etc. are defined. Off-design boundaries (very often related to dis-continuities in flow development) are also defined in this plane and the aircraft designer actually wantsrc know how these boundaries change with Reynolds number. Also, the aircraft is designed for a particularlift at a chosen Mach number and the aircraft designer wants to know how the pressure distribution, thedrag, the pitching moment, etc. changes with Reynolds number for that particular lift/Mach number combi-nation. He will be only indirectly interested in the change of angle of attack for constant lift. He ismost likely not interested in the change in pressure distribution at constant angle of attack althoughthis is very conveniently measured in the wind tunnel. For these reasons the analysis and interpretationof Reynolds number effects is often preferably done in the lift-Mach number plane, at constant lift, con-stant Mach number or a combination of both.
rOANslrrou c70Eo I Z2--: '.3s.i
TRNITO FREI o.d
0$' 0. "_ -.- AsI 0 ..._o .*, I-Co _ _k
444
0•--- 02 0 REYNOLDS NUMBER - .3 05 0 00 0 I0.
CL III CL, a1 D1
c, IAGRAMATIC 00070o mi mE00500 TOAILNG0000R PRESURE$
III '0n Dt 0S 77, 03. -. 03- O 358 --0 034 -S --- 07 036 -0019 --- 00 002 -0on Fig. 1-2 The effect of Reynolds number and the
007 0053 I0. ---- 0.50 0.275 013 state of the boundary layer on the
0FREE TRANSITION 2,7 pressure recovery over an airfoil whenboundary-layer separation occurs atthe shock waves (from ref. 54/2)
Wr- UNNEL (TRAGTK )1 FD,
OC -2.0
s.104 1sanos M CL C,, II CL c 5 :.0 IRE 0- o 0. 0 . 0.2 .-5 \ .\-50 -02 PP
05, WE5 - 0I7n a.072 0.001 - v 0.307 A.= 0040.5 5 -..- 0078 0.30' -06 -.. 0200 0271 -2.i2n I , i5o In -- 0 0,I A007 0658 053 -Cm _= .2 . 4 .7 A . to
II INFLUENCE OF TRANSITIO FIXING ./c
Fig. 1-1 Early evidence of the effects of Fig. 1-3 The "classical" example of the effectReynolds number on the pressure distri- of Reynolds number on the pressurebution (from ref. 51/1) distribution: the C-141 aircraft (from
ref. 66/1)

5
.2CS7 FIXED TRANS- X/C - 3ii
-GA -2.0
-0.4IE
.29 1 i~a 0 O'S XIC I- 0.5 1. MACH CONSTANT, REYNOLDS VARIABLEx" UPPER SURFACE
___ Oty TRAILING EDGE/ . A * C~10 CONDITIONS
I - o R.I#SECTION AT R- tI#0 -C,-.7. M-0OS
2. RU.,,10 SECTION AT R-.100It CL-()TO. M0015 ML0.8=MC3 5IH
8SECTION AT R-.3Gd CL-.H.T. MRi.75 0.72 74, 0.76
1 AND 3 SAME SHOCK STRENGTH AND VISCOUS STANDARD0.
Fig. 1-4 Example of the achievable gain Indesign lift through design for a higher
Reynolds number (from ref. 79/2) .
t/C
REYNOLDS CONSTANT. MACH VARIABLE
PeFig. 1-7 Exampie of the sensitviy o.1 HHIS, I SI' supercriticai airfoil at the design
__1 condition for variati ons in flowconditions (from ref. 85/1)
0 i1 G2 113 dHy HH~VR.
0-2.0 "-ST EAMwlS E SECTIONFig. 1-5 Ear~lytexample of the effect of flow -
quality on the pressure distribution(from ref. 55/1)
S.OCp
BOUNDARY ONSRENGTH.
INTERACTION -.
SEPARAION5S CM
EFFET ONFig. 1-9 eynolds nuaher affect oB the pressure
OVERALL CIRCULATION distriution prior to and beyond vortexANDFPRESSURE DISTRIBUTION formation illustrating large differen-
ces due io a Reynolds number effect on-W DIRECT REYNOLDS NUMBER EFFECT the boundary for vortex formation (from
INDIRECT REYNOLDS NUMBER EFFECT ref. 80/1)DOMINANT RE.NOMR1ER EFFECT
CHARACTERISTIC DIRECT INDIRECT
LIFT ANO PITCHING MOMENT
VISCOUS DRAG II
WAVE DRAG
DRAG DIVERGENCE
C SOUBR:ARYAER EPARATION X
O SBUFFlET NAA 0 0
Fig. 1-6 Scheatic rspresentmti on of direct andindirect Reynolds number effects
-- ----6
0.
P EFORE MAX. LIFT R.- 30- __RTY LMA
0.0 0.5 WX 1.0
R.104 -0.4 ___
-10 c----- - 20
30 -0.2
PAST MAX. LIFT N
0.0 0.5 IC 1.0 0 2 4 6 10
Fig. 1-8. Reynolds number effect On the pressure Fig. 1-Sb Reynolds number effect on lift anddistribution prior to and beyond mazij- trailing edge pressure near theRun lift I llustratilng l arge differen- maximum lift boundary (from ref. 83/3)te du ;oaRynolds numberefetothe maximum lit boundary (from ref.83/3)
CIL
- HIGH RE CI HIIGH RELOW HE LGW RE
-MAXIMUM LIFTz I . EFFECT GM DRAG DIVERGENCEMAX LIFTVEYLGEREFCT
.- TO BE EXPECTED ONR.EF FECT ON DESIGN R.EFC M N PRESSURE DISTRIBUTION
PRESUR DSTRRUTONDRAG DIVERGENCE DESIGN CONO.
~L -R.EFFECT ON 1 0 -CONSTANT \~DRAG CREEP - --
R.-EFVERY ONAR1GE EFFECTSR.EC T- ON I
Gh N .ORM1 CREEP TO E EXPECTED h
rig. 1-loa Example Of evaluation of Reynolds rig. 1-l0b ixample Of evaluation of Reynoldsnumber effects at Constant lift number effects at constant incidence
7
2.0 POTENTIALS FOR PSEUDO-REYNOLDS NUMBER EFFECTSby
T. W. Binion, Jr.Calspan Corporation/AEDC Operations
Arnold Air Force Base, TN 37389
2.1 INTRODUCTION
Reynolds number effects have been traditionally determined by testing a given modelin a variable Reynolds number tunnel, testing a given model in several wind tunnels withdifferent Reynolds number capabilities, testing similar models of different scale in agiven or different wind tunnels, or a combination of the three. The data are thenextrapolated to flight using various semi-empirical correction techniques. Almost everyparameter which can introduce spurious effects into wind tunnel data has the potential tovary from tunnel to tunnel at the same nominal test condition or from one Reynolds numberto another in a given tunnel. Factors which have the potential of introducing pseudo-Reynolds number effects include wall interference, tunnel Mach number calibration, noise,turbulence, humidity, nonuniform flow (flow angle, tem-perature and pressure gradients),flow contamination, sidewall effects in two-dimensional tests, thermal non-equilibrium,model deformation, and transition fixing. In some instances not only are the effects ofthe parameters not well understood, their influences may be coupled and not easilyseparated by experimental techniques. At present, the theoretical capability does notexist to evaluate the individual effects of the above factors with confidence much lesstheir potential coupling. Thus, some of the discussion below is somewhat speculative.Nevertheless, the evidence presented is strong enough to elicit a degree of caution inascribing the cause of variations of data with Reynolds number solely to Reynolds number.
2.2 WALL INTERFERENCEI
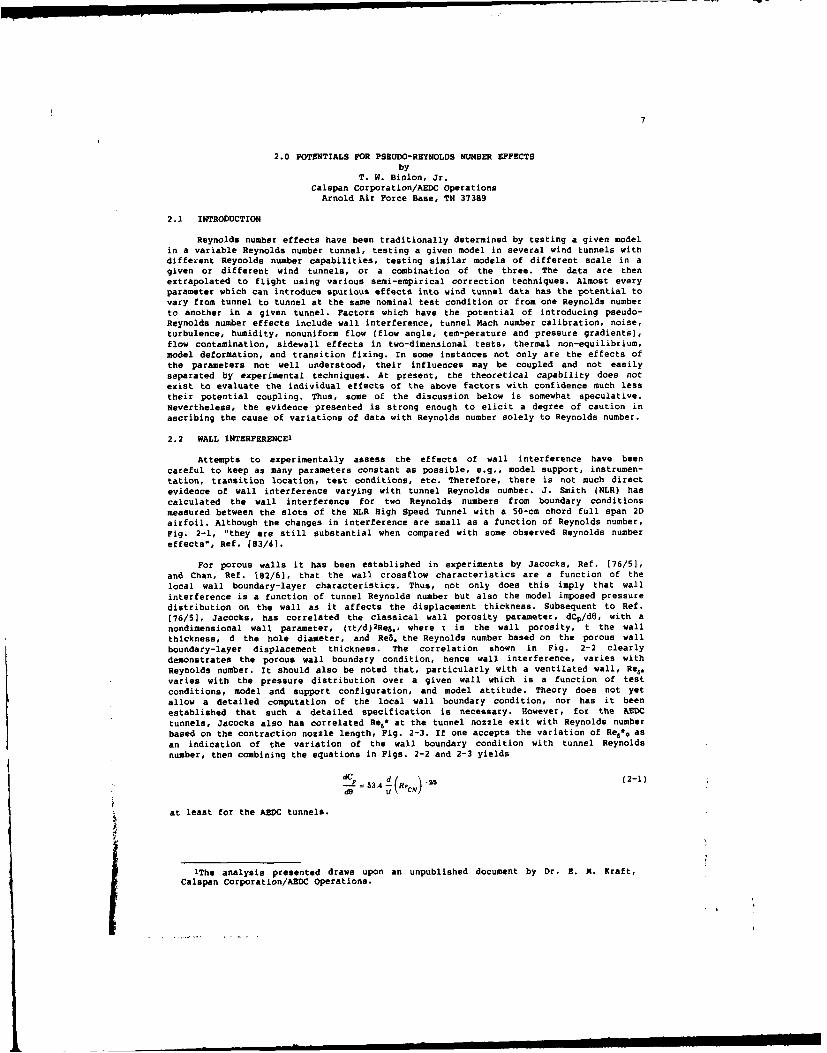
Attempts to experimentally assess the effects of wall interference have beencareful to keep as many parameters constant as possible, e.g., model support, instrumen-tation, transition location, test conditions, etc. Therefore, there is not much directevidence of wall interference varying with tunnel Reynolds number. J. Smith (NLR) hascalculated the wall interference for two Reynolds numbers from boundary conditionsmeasured between the slots of the NLR High Speed Tunnel with a 50-cm chord full span 2Dairfoil. Although the changes in interference are small as a function of Reynolds number,Fig. 2-1, "they are still substantial when compared with some observed Reynolds numbereffects", Ref. [83/4).
For porous walls it has been established in experiments by Jacocks, Ref. [76/5],and Chan, Ref. [82/6], that the wall crossflow characteristics are a function of thelocal wall boundary-layer characteristics. Thus, not only does this imply that wallinterference is a function of tunnel Reynolds number but also the model imposed pressuredistribution on the wall as it affects the displacement thickness. Subsequent to Ref.(76/5], Jacocks, has correlated the classical wall porosity parameter, dCP/d0, with anondimensional wall parameter, (xt/d)
2Re8,, where x is the wall porosity, t the wall
thickness, d the hole diameter, and eE. the Reynolds number based on the porous wallboundary-layer displacement thickness. The correlation shown in Fig. 2-2 clearlydemonstrates the porous wall boundary condition, hence wall interference, varies withReynolds number. It should also be noted that, particularly with a ventilated wall, Re..varies with the pressure distribution over a given wall which is a function of testconditions, model and support configuration, and model attitude. Theory does not yetallow a detailed computation of the local wall boundary condition, nor has it beenestablished that such a detailed specification is necessary. However, for the AEDCtunnels, Jacocks also has correlated Rea* at the tunnel nozzle exit with Reynolds numberbased on the contraotion nozzle length, Fig. 2-3. If one accepts the variation of Re,*0 asan indication of the variation of the wall boundary condition with tunnel Reynoldsnumber, then combining the equations in Figs. 2-2 and 2-3 yields
dc d( (_ 2-1)= 53.4 - Re,)
at least for the AEDC tunnels.
IThe analysis presented draws upon an unpublished document by Dr. E. N. Kraft,Calspan Corporation/AEDC Operations.

The potential effect of Re on wall interference may be estimated from the classicaltheory of Ref. [69/1. Shown in Fig. 2-4 is the variation of the lift interference factorwith the wall porosity parameter, Q, defined for incompressible flowl as
Q=1 ,11 --'22where
-=1/2dC Id..
The change in the lift interference factor caused by variations in unit Reynolds numberfor Tunnel 4T is indicated in the figure and accompanying table. The tunnel Reynoldsnumber effects are substantial.
Experiments -onducted on an A-10 aircraft model, Fig. 2-5, in Tunnels 16T and 4T byJ. M. Whoric, yielded some information on the effect of Reynolds number on wallinterference. The model blockage was 0.13 and 2.11 percent in 16T and 4T, respectively.Because of the small blockage ratio, the 16T data are considered wall interference free.The two tests were conducted with the same instrumentation, support sting, and testconditions. The difference between the 16T and 4T angle of attack, pitching moment, andinduced drag at constant lift is shown in Fig. 2-6 for two unit Reynolds and Machnumbers. Even though the tests were conducted transition free, the transition Reynoldsnumbers based on Dougherty's cone data, Ref. (82/7], at the conditions of the comparisonare almost identical in the two tunnels. Furthermore, the A-10 data from 16T exhibited noReynolds number effects. Thus, the data variations with Reynolds number are the result ofphenomena in 4T. The Au is not zero at CL = 0 because the tail incidence is 6 deg withrespect to the wing. Therefore, both the wing and tail are lifting, albeit in oppositedirections at CL = 0, which causes lift interference in Tunnel 4T resulting in an effec-tive angle change for zero lift. The classical lift interference applicable to the A-10was shown in the table accompanying Fig. 2-4. While classical theory would not beexpected to produce accurate results for such a large and complicated model or evennecessarily the correct trends at transonic Mach numbers, the theoretical liftinterference slopes, da/dCL, agree rather well with the data in Fig. 2-6a, particularlyat low lift. Theory aside, if wall interference is the dominant variable between the twodata sets, then the data in Fig. 2-6 strongly suggest that wall interference is afunction of Reynolds number for both Mach numbers since the variation of the coefficientdifferences is corsiderably different for each Reynolds number Furthermore, the factthat Ao is not jinear with CL suggests that the wall interference boundary condition isnot constant with CL which is not inconsistent with the hypothesis that the boundary con-dition is a function of the model imposed pressure distribution.
2.3 NOISE AND TURBULENCE
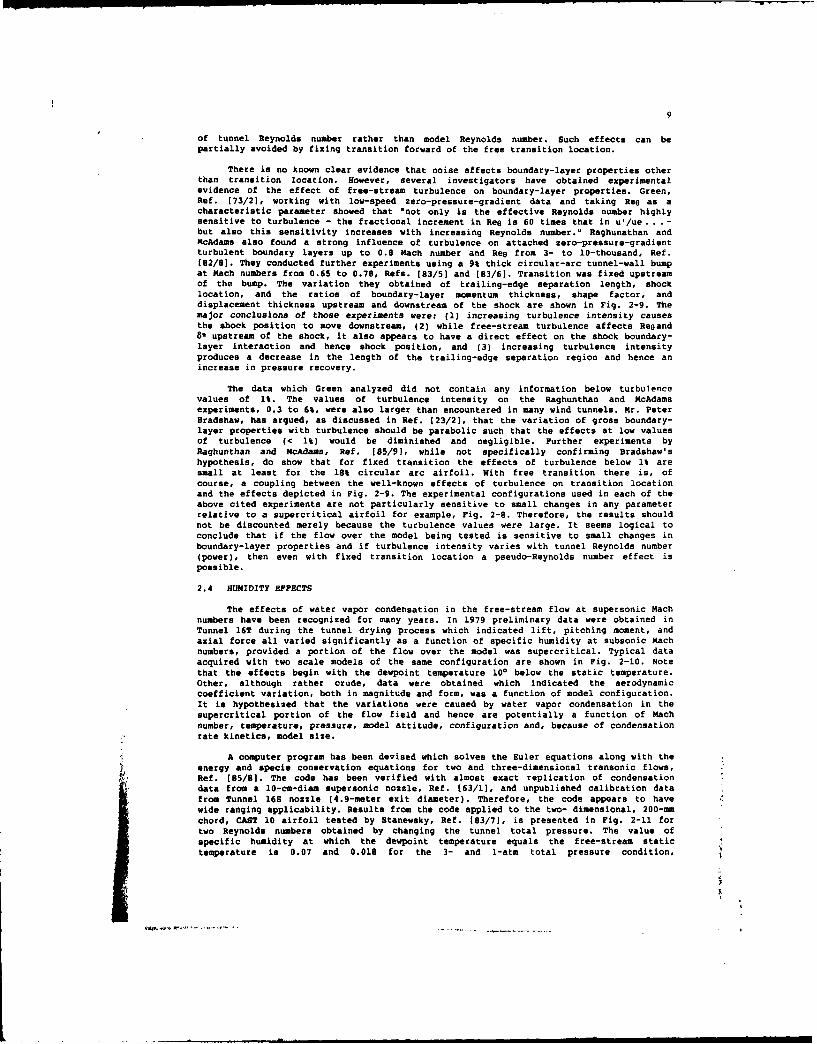
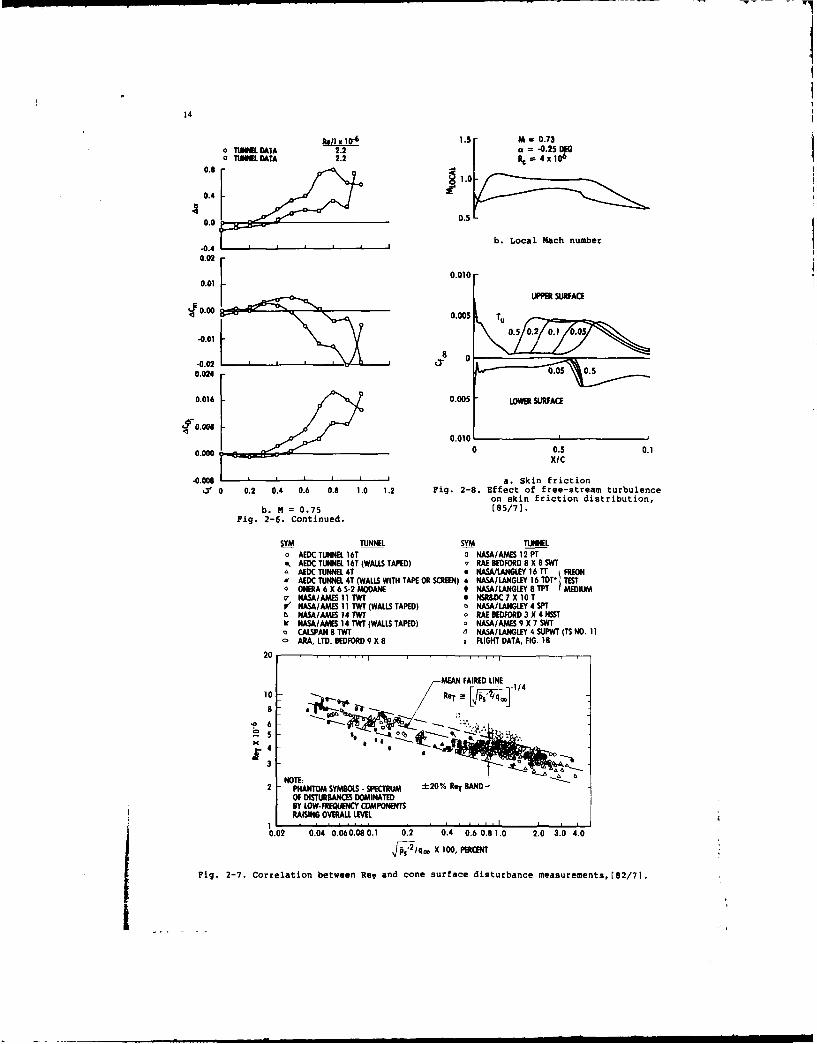
Pate and Schueler, Ref. [69/2], and Dougherty, Ref. (82/7), have shown that thelocation of boundary-layer transition is influenced by aerodynamic noise. Doughertydevised a correlation function between transition Reynolds number and root-mean-squarepressure fluctuation shown in Fig. 2-7. Recently, however, Murthy and Steinle, Ref.(86/21, have re-examined Dougherty's and other data and suggested that at transonicspeeds, if the tunnel noise is less than about 1% rme Cp, noise may not affect transitionat all, the real mechanism being turbulence. For Tollmien-Schlichting type transition,the spectral content of the disturbances in relation to the laminar instability frequencyis probably the factor in producing premature transition [87-31. While it is difficult todecouple the effects of noise and turbulence in wind tunnel data, free-stream turbulenceby itself can exert a substantial influence on transition location. For example, Mignosi,Ref. (85/7], has calculated the effects of free-stream turbulence on the skin frictiondistribution for a supercritical airfoil, Fig. 2-8. The calculations indicate thattransition location on the upper surface is a strong function of rather small variationsin turbulence. The laminar boundary layer on the lower surface separates at about 60%chord and transition occurs at the end of the separation zone. In a given non-cryogenicwind tunnel, the amplitude and spectra of the noise and turbulence, hence transitionlocation, is a function of unit Reynolds number, i.e., tunnel power. For models with freetransition, variation of free-stream noise and/or turbulence with tunnel power couldproduce a pseudo-Reynolds number effect by causing transition location to be a function
lEven though the theories in Ref. (69/11 claim applicability to compressible flow,experience does not substantiate such a claim.
9
of tunnel Reynolds number rather than model Reynolds number. Such effects can bepartially avoided by fixing transition forward of the free transition location.
There is no known clear evidence that noise affects boundary-layer properties otherthan transition location. However, several investigators have obtained experimental
evidence of the effect of free-stream turbulence on boundary-layer properties. Green,Ref. [73/2], working with low-speed zero-pressure-gradient data and taking Reg as acharacteristic parameter showed that "not only is the effective Reynolds number highly
sensitive to turbulence - the fractional increment in Ree is 60 times that in ul/ue . . -but also this sensitivity increases with increasing Reynolds number." Raghunathan andMcAdams also found a strong influence of turbulence on attached zero-pressure-gradientturbulent boundary layers up to 0.8 Mach number and Re0 from 3- to 10-thousand, Ref.
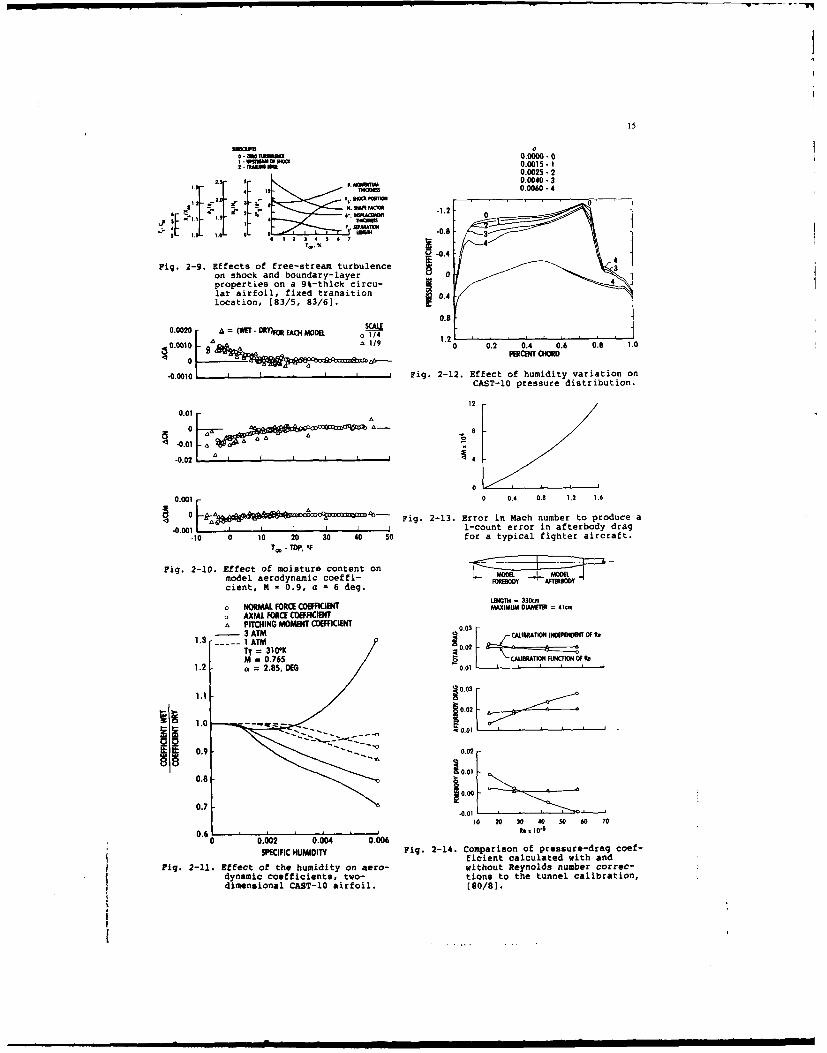
[82/81. They conducted further experiments using a 9% thick circular-arc tunnel-wall bumpat Mach numbers from 0.65 to 0.78, Refs. [83/5] and [83/6]. Transition was fixed upstreamof the bump. The variation they obtained of trailing-edge separation length, shocklocation, and the ratios of boundary-layer momentum thickness, shape factor, anddisplacement thickness upstream and downstream of the shock are shown in Fig. 2-9. Themajor conclusions of those experiments were: (1) increasing turbulence intensity causesthe shock position to move downstream, (2) while free-stream turbulence affects Reeand
8* upstream of the shock, it also appears to have a direct effect on the shock boundary-layer interaction and hence shock position, and (3) increasing turbulence intensity
produces a decrease in the length of the trailing-edge separation region and hence an
increase in pressure recovery.
The data which Green analyzed did not contain any information below turbulencevalues of 1%. The values of turbulence intensity on the Raghunthan and McAdamsexperiments, 0.3 to 6%, were also larger than encountered in many wind tunnels. Mr. PeterBradshaw, has argued, as discussed in Ref. (23/2), that the variation of gross boundary-layer properties with turbulence should be parabolic such that the effects at low valuesof turbulence (< 1%) would be diminished and negligible. Further experiments by
Raghunthan and McAdams, Ref. [85/9], while not specifically confirming Bradshaw'shypothesis, do show that for fixed transition the effects of turbulence below 1% aresmall at least for the 18% circular arc airfoil. With free transition there is, ofcourse, a coupling between the well-known effects of turbulence on transition locationand the effects depicted in Fig. 2-9. The experimental configurations used in each of theabove cited experiments are not particularly sensitive to small changes in any parameterrelative to a supercritical airfoil for example, Fig. 2-8. Therefore, the results shouldnot be discounted merely because the turbulence values were large. It seems logical toconclude that if the flow over the model being tested is sensitive to small changes inboundary-layer properties and if turbulence intensity varies with tunnel Reynolds number(power), then even with fixed transition location a pseudo-Reynolds number effect ispossible.
2.4 HUMIDITY EFFECTS
The effects of water vapor condensation in the free-stream flow at supersonic Machnumbers have been recognized for many years. In 1979 preliminary data were obtained inTunnel 16T during the tunnel drying process which indicated lift, pitching moment, andaxial force all varied significantly as a function of specific humidity at subsonic Machnumbers, provided a portion of the flow over the model was supercritical. Typical dataacquired with two scale models of the same configuration are shown in Fig. 2-10. Notethat the effects begin with the dewpoint temperature 100 below the static temperature.Other, although rather crude, data were obtained which indicated the aerodynamiccoefficient variation, both in magnitude and form, was a function of model configuration.It is hypothesized that the variations were caused by water vapor condensation in thesupercritical portion of the flow field and hence are potentially a function of Machnumber, temperature, pressure, model attitude, configuration and, because of condensationrate kinetics, model size.
A computer program has been devised which solves the Euler equations along with theenergy and specie conservation equations for two and three-dimensional transonic flows,Ref. [85/8]. The code has been verified with almost exact replication of condensationdata from a 10-cm-diam supersonic nozzle, Ref. [63/1], and unpublished calibration datafrom Tunnel 16S nozzle (4.9-meter exit diameter). Therefore, the code appears to havewide ranging applicability. Results from the code applied to the two- dimensional, 200-mmchord, CAST 10 airfoil tested by Stanewsky, Ref. [83/7], is presented in Fig. 2-11 fortwo Reynolds numbers obtained by changing the tunnel total pressure. The value ofspecific humidity at which the dewpoint temperature equals the free-stream static
temperature is 0.07 and 0.018 for the 3- and 1-atm total pressure condition,
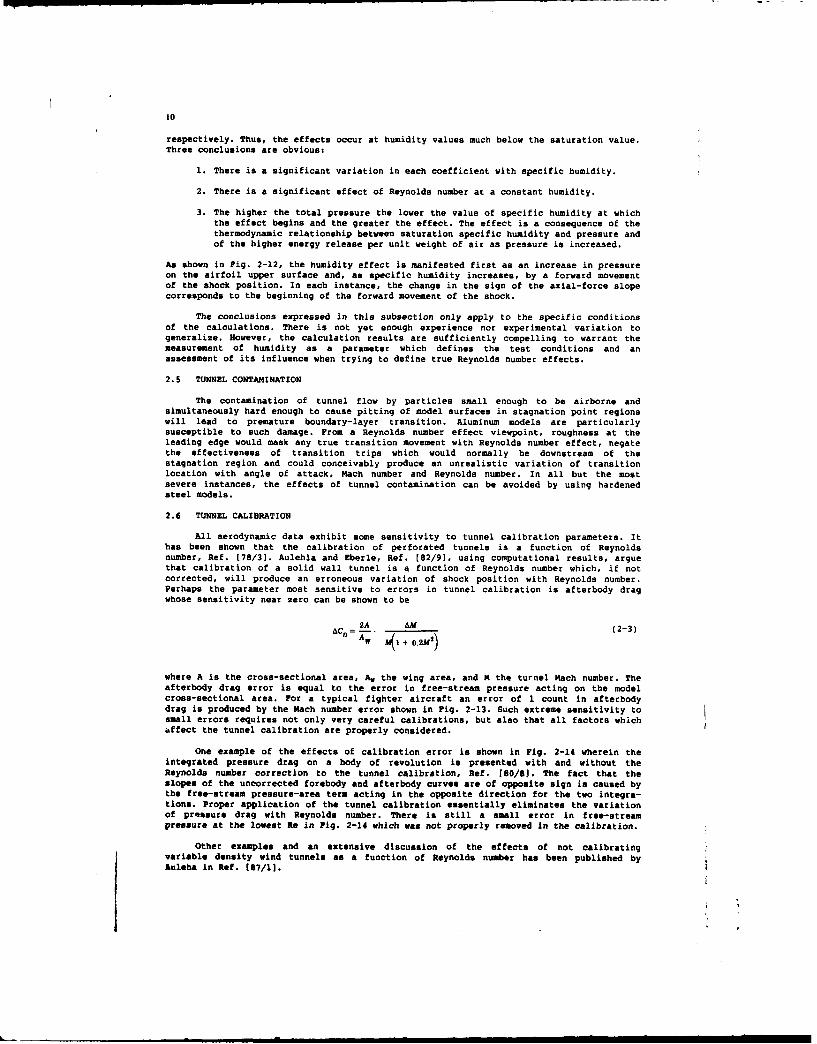
10
respectively. Thus, the effects occur at humidity values much below the saturation value.Three conclusions are obvious;
1. There is a significant variation in each coefficient with specific humidity.
2. There is a significant effect of Reynolds number at a constant humidity.
3. The higher the total pressure the lower the value of specific humidity at whichthe effect begins and the greater the effect. The effect is a consequence of thethermodynamic relationship between saturation specific humidity and pressure andof the higher energy release per unit weight of air as pressure is increased.
As shown in Pig. 2-12, the humidity effect is manifested first as an increase in pressureon the airfoil upper surface and, as specific humidity increases, by a forward movementof the shock position. In each instance, the change in the sign of the axial-force slopecorresponds to the beginning of the forward movement of the shock.
The conclusions expressed in this subsection only apply to the specific conditionsof the calculations. There is not yet enough experience nor experimental variation togeneralize. However, the calculation results are sufficiently compelling to warrant themeasurement of humidity as a parameter which defines the test conditions and anassessment of its influence when trying to define true Reynolds number effects.
2.5 TUNNEL CONTAMINATION
The contamination of tunnel flow by particles small enough to be airborne andsimultaneously hard enough to cause pitting of model surfaces in stagnation point regionswill lead to premature boundary-layer transition. Aluminum models are particularlysusceptible to such damage. From a Reynolds number effect viewpoint, roughness at theleading edge would mask any true transition movement with Reynolds number effect, negatethe effectiveness of transition trips which would normally be downstream of thestagnation region and could conceivably produce an unrealistic variation of transitionlocation with angle of attack, Mach number and Reynolds number. In all but the mostsevere instances, the effects of tunnel contamination can be avoided by using hardenedsteel models.
2.6 TUNNEL CALIBRATION
All aerodynamic data exhibit some sensitivity to tunnel calibration parameters. Ithas been shown that the calibration of perforated tunnels is a function of Reynoldsnumber, Ref. (78/3]. Aulehla and Eberle, Ref. [82/9], using computational results, arguethat calibration of a solid wall tunnel is a function of Reynolds number which, if notcorrected, will produce an erroneous variation of shock position with Reynolds number.Perhaps the parameter most sensitive to errors in tunnel calibration is afterbody dragwhose sensitivity near zero can be shown to be
2A AM (2-3)"C = A M( + .2M )
where A is the cross-sectional area, A., the wing area, and M the turnel Mach number. Theafterbody drag error is equal to the error in free-stream pressure acting on the modelcross-sectional area. For a typical fighter aircraft an error of 1 count in afterbodydrag is produced by the Mach number error shown in Fig. 2-13. Such extreme sensitivity tosmall errors requires not only very careful calibrations, but also that all factors whichaffect the tunnel calibration are properly considered.
One example of the effects of calibration error is shown in Fig. 2-14 wherein theintegrated pressure drag on a body of revolution is presented with and without theReynolds number correction to the tunnel calibration, Ref. [80/8]. The fact that theslopes of the uncorrected forebody and afterbody curves are of opposite sign is caused bythe free-stream pressure-area term acting in the opposite direction for the two integra-tions. Proper application of the tunnel calibration essentially eliminates the variationof pressure drag with Reynolds number. There is still a small error in free-streampressure at the lowest Re in Fig. 2-14 which was not properly removed in the calibration.
Other examples and an extensive discussion of the effects of not calibratingvariable density wind tunnels as a function of Reynolds number has been published byAulehS in Ref. [87/1].
I . m -

2.7 SIDEWALL EFFECTS IN 2-D TESTS
There has been a lot of attention paid to the effect of the sidewall boundary layeron two-dimensional test data, Refa. [82/10] and [83/8] for example. However, no one seemsto have considered the effect tunnel Reynolds number has on the sidewall boundary layerand hence its influence on the model data. The effect the sidewall boundary layer canhave is illustrated in Fig. 2-15, which presents data wiui "adequate" sidewall boundarylayer removal (according to the authors of Ref. [83/8]) and none. The effects areobviously large, leading to the hypothesis that anless the boundary layer receives theproper conditioning or the aspect ratio is large (greater than 2.5), tests defining thevariation of two-dimensional data with Reynolds number contain large pseudo-Reynoldsnumber effects. The definition of what constitutes proper conditioning has not beentotally agreed upon by the testing community and may vary from facility to facility.However, the procedures summarized in Ref. [87/2], which are being used in the Langley0.3m TCT Facility, significantly improve data comparisons.
2.8 NON-UNIFORM FLOW
Obviously a tunnel-empty spatial gradient of any free-stream flow property canaffect model data depending upon its magnitude and the model configuration. There islittle information known which indicates if the gradient of parameters normally con-sidered in this category, pressure, temperature, and flow angle vary with tunnel Reynoldsnumber. Considering the mechanisms which could cause gradients to vary with Reynoldsnumber, only the variation of the wall boundary layer influencing buoyancy appearsplausible. Such is possible in a solid wall wind tunnel but not likely in a ventilatedtest section. Unpublished data from a porous tunnel indicate buoyancy is not a functionof Reynolds number. Also, there is no reason to expect either tunnel temperature or flowangle is a function of Reynolds number. It should be noted that buoyancy-like gradientsin x, y, and z due to wall interference can exist and be a function of Reynolds number.
2.9 THERMAL NONEQUILIBRIUM
Although not as severe a problem in a continuous flow tunnel as in a short durationfacility, heat transfer into or out of the model can produce spurious effects on datawhich are sensitive to the boundary-layer properties. In short duration facilitiessignificant differences are likely to arise between the temperature of the model and therecovery temperature of the stream. Since the temperature of the stream is influenced bythrottling the flow from the reservoir to tunnel total pressure, the stream temperatureis generally a function of tunnel Reynolds number, i.e., of the throttling pressureratio. Unless provisions are made to cool the model prior to each test, the stream willbe appreciably cooler than the model. The resulting heat transfer will significantlyalter the boundary-layer properties and appear as a spurious scale effect. A brief studyof this phenomena, Ref. [72/6], concluded that an increase of 1% in model-to-free-streamtemperature ratio would produce an effect roughly equivalent to a 31% reduction inReynolds number. For Reynolds number variations within a given tunnel, the problem maynot be significant. For example, expanding air from a 300-atm pressure reservoir at 300*Kto 50 atm reduces the stagnation temperature to about 270*K; whereas, expanding to 1 atmreduces the temperature another 10oK. At a constant Mach number the real gas effectsbetween conditions at 50 atm and 1 atm would be equivalent to a 13% Reynolds numberchange within the tunnel. However, if the data from a blowdown facility with the model atroom temperature were compared to a similar condition wherein the model was in thermalequilibrium, the data at 1 atm would contain an effect equivalent to a 53% change inReynolds number because of the effect of heat transfer on the boundary layer of the modelin thermal non-equilibrium. While the numbers given are very approximate, the effects aresignificant and should be considered when comparing Reynolds number data from short-duration facilities.
Dougherty and Fisher, Ref. [80/4], deduced the effect of non-adiabatic walltemperature on transition Reynolds number measured on a 10-deg cone both in flight andthe AEDC Tunnel 4T. The empirical relationship derived from their data
ReT/ReT=(T/T) (2-4)
encompasses at least a Mach number range from 0.55 to 2.0 and temperature ratios from0.95 to 1.08. Such a large sensitivity could introduce pseudo Reynolds number effectsdepending upon how a particular test was conducted and the sequential relationshipbetween Re, Ta., and time.
II

12
It has long been recognized that temperature changes in continuous tunnels canmanifest as balance shifts. Strain gages have been temperature compensated to minimizethe effect. However, work by Ewald and Krenz, Ref. [86/6], has shown significant sensi-tivity (80 pv) of axial-force gages to moderate thermal gradients (8*C) within thebalance structure. Since the mechanism producing the effect is heat transfer into one endof an internal balance, the time constant is measured in hours requiring long times toreach thermal equilibrium. Such effects will be very pronounced in cryogenic facilities.If the tunnel temperature is varied systematically as a function of Reynolds number, thedata from an internal balance may well contain a pseudo-Reynolds number effect.
2.10 MODEL DEFORMATION
While it is recognized that wind tunnel model support systems deflect under load,the models themselves are generally considered to be rigid. However, to comply with thepresent day accutacy requirements such assumptions may not be valid. As an example, thedeflections of the two-dimensional model reported in Ref. (83/7] were computed. The modelhas a 200-m chord and a 510-mm span. It was assumed to be rigidly constrained at thetunnel walls and made of solid steel. The calculated change in the mid-span angle ofattack caused by torsional bending for Re = 30 x 106 and 2-deg incidence varied between0.07 and 0.10 deg in the Mach number range 0.6 to 0.8. The effect of such changes isshown in Fig. 2-16. The data at 30 x 106 Reynolds number have been corrected to accountfor the computed torsional deflection of the airfoil. The correction reduces the differ-ence between the 10 x 106 and 30 x 106 curves by more than a factor of two except at Machnumber 0.8 at which the wing is almost completely stalled and there is little variationof lift with incidence. Model deformation does not significantly influence the data atthe 10 x 106 and 4 x 10⁶ Reynolds number since the loads are relatively low.
As another example, the wing torsional bending of the ONERA calibration model M5,Fig. 2-17, was also calculated. A solid steel wing was assumed although the wing doescontain pressure orifices. The change in incidence as a function of semi-span location isshown in Fig. 2-18 for Mach number 0.84, lift coefficient 0.4, and various Reynoldsnumbers. The deflections at the higher values are large enough to cause variations whichcould be interpreted erroneously as Reynolds number effects. In this instance, the wingdihedral also changes with Reynolds number. However, the dihedral effects should be lessthan those caused by the change in wing twist.
2.11 TRANSITION FIXING
A final word is needed on transition fixing as it relates to Reynolds numbereffects. A boundary-layer trip is sized for a particular Reynolds number, Mach number,pressure gradient condition. Substantial deviation from that condition results in eitheran over- or under-fixed boundary layer. The necessary variable range for the deviation tobe substantial is not very well defined. A systematic study has not been published.Nevertheless, the necessary range seems to be several times less than the range of mosttest condition variables. Most studies have indicated one must change grit size with Re.The consequences of overfixing is that the turbulent boundary layer may be thicker thandesired and the drag higher because of grit drag. The consequences of under-fixing arethat the transition zone is either longer than for a just adequate trip height or thetransition is downstream of the desired location. In each situation consequences canaccrue in all aerodynamic parameters. An example of the consequences of over-, under-fixing is given in Fig. 2-18 taken from Ref. (84/6). Obviously, if Reynolds number isvaried with fixed transition without changing grit size appropriately with Re or with anon-hydraulically smooth surface, the resulting variation in aerodynamic coefficientswith Reynolds number is not a true scale effect.

13
2-0 AIRFOIL IN HST ). = h/b= 0.5m 0.2 L1-.cL CL RCC =03.6 x 16 h --.
-AMD Rec 12.5x10⁶ 01
Re- 0.1
Ah =0.60 lA Mo0.73 X=1.
1.0.3 o~ __ I I I I
01 0.2 0.3 0.4 05 06 0.7 0.9 100.02 ~ ~ ~ ~ ~ -. 3.60.0 OOIT AAV1,O
0 0.4 0.8 1.2 0" 00.4 0.8 1.2 AJDEG) A-10, M 0.3,.r= 5%R.Ifx 10-6 dC~plde Q 6o Ac = 57.3 (5/C)6CL
rig 2-1. Blockage (A4ach) and incidence
(Au) corrections calculated from 1.10 1.90 0.51 -0.020 -0.090CLmeasured top and bottom wall 1.44 1.59 3).56 -0.035 .0.159CLpressure distributions, [84/3]. 2.16 1.35 0.60 -0.050 -0.227 C3.60 1.10 0.64 -0.065 -0.295 L
10.0 _I 1/10. W =2.103 ,(R6.-I,2 Fig. 2-4. Variation of the upwash interfer-
5.0 ence with changes in unitReynolds number.
2.0 Aile eSIDtM
o .0 0.2 0.125 6.0 All NDIM O IRX1.0 -% 7.0 0.125 0.213 4.1 -I
T
o 10.0 0.125 0.166 7.5 -FLAP -Z-L TAIII10.5 0 1.0 0.250 0.166 1.5 2 R_ _ Ro0
v 2.5 0.250 0.166 3.8 1 7t)I___- "'"1 5.0 0.250 0.166 7.5 V Re6* ELEVATOR
0.2 , 10.0 0.250 0.166 15.1 . ..0.2 It 104 1.x105 1 x 10⁶ -[ L
Fig. 2-2. Correlation of porous wall char- LANDINGDPOD CLLacteristics with displacementthickness Reynolds numbers.
T Fig. 2-5. The A-10 model.
16T Re /x 10-6-R*0= 0.0267 (RO)
1 .8r 0 TUNNEL DATA 1.1
a TUN NEL DATA 1.9
I1 X 108 0.4 - 1OY
0.00.03
/0 0.022 x 10
7 I1 104 1 1
5 5 X 10⁵
Fig. 2-3. Correlation of nozzle exit die- 0.00placement thickness Reynoldsnumber with tunnel contraction- Inozzle Reynolds number. -0.010.008
0.0W
.0.M0
0 0.2 0.4 0.6 0.8 1.0 1.2
a. M= 0.3
Fig. 2-6. Comparison of theoretical and
experimental results for the A-
10 model.
14
R/lx 106 I.S M = 0.73o TUNEL DATA 2.2 cc
= -0.2
a TUNNEL DATA 2.2F. -0.1.0-
00 -O.5
-0.4 b. Local Mach number
0.01 F.100.000.0
-0.01
-0 .02 .0O.O_ _0.024
0.016 0.005 LOWER SURFACE
'- .0.1
0.000 . 0 a. 0.1X/C
-0.006 17 : e a . Skin friction
t.y 0 0.2 0.4 0.6 0.8 1.0 1.2 Fig. 2-8. Effect of free-stream turbulenceon skin friction distribution,
b. M = 0.75 (85/7].
Fig. 2-6. Continued.
SYM TUNNEL SYM TUNNELo AEDCTUNNEL16T a NASA/AMES12PT., AEDC TUNNEL 16T (WALLS TAPED) v RAE BEDFORD 8 X 8 SWF
AEDC TUNNEL 4T - NASA/LANGLEY 16 TT FREONSAEDC TUNNEL 4T (WALLS WITH TAPE OR SCREEN) & NASA/LANGLEY 16 TT* TEST
9 ONERA 6 X 6 S-2 MODANE # NASA/LANGLEY B TPT IMEDIUMv NASA/AMES11TWT e NSR&DC7X1OT
NASA/AMES 11 TWT (WALLS TAPED) m NASA/LANGLEY 4 SPTNASA/AMES 14 TWT o RAE BEDFORD 3 X 4 HSST
hr NASA/AMES 14 TWT (WALLS TAPED) - NASA/AMES 9 X 7 SWTCALSPAN 8 TWT 1 NASA/LANGLEY4SUPWT(TSNO. 1)
o ARA, LTD. BEDFORD 9 X 8 FLIGHT DATA, FIG. 18
20 ' I ' I ' , I I .I
MEAN FAIRED LINE-10- - R-1/4
2 PNANTOM SYMBOLS -SPECTRUM ±20% RT BAND-
OF DISTUIANUS DOMINATEDBY LOW-FREQUENO' COAMPONTS¢
J RAISING OVERALL LEVEL
0.02 0.04 0.060.080.1 0.2 0.4 0.6 0.8 1.0 2.0 3.0 4.0
I Fig. 2-7. Correlation between ReT and cone surface disturbance measurements, (82/7].
I
t8
15
00000IMAMUP-O OF 9Wu~ 0.0000 - 0
2- ejesgem 0.0015-10.0025 - 2
.10 n-1,00040-3
" Fl - t41- 0.0060-4
F"a -1.2
Fig. 2-9. Effects of free-stream turbulence 4on shock and boundary-layer 0properties on a 9%-thick circu-lar airfoil, fixed transition 0.location, [83/5, 83/6].
0.8
SCALE0.0020 A = (WET- DRY)FOR EACH MODEL 0 -1 _.2
0.0010 0090 0.2 0.4 0.6 0.8 1.0
0 PECENT 04010
-0.0010 Fig. 2-12. Effect of humidity variation onCAST-10 pressure distribution.
120.01
00
-0.01o
0 .001 0 0.4 0.8 1.2 1.6
:EP n h- Fig. 2-13. Error in Mach number to produce a
-0 ha* 1-count error in afterbody drag
-10 0 10 20 30 40 50 for a typical fighter aircraft.
T,7- TOP, F
Fig. 2-10. Effect of moisture content onmodel aerodynamic coeffi- - - AFMODELcient, M = 0.9, a = 6 deg.
LENGTH = 330cio NORMAL FORCE COEFFICIENT MAXIMUM DIAZUEIU = 41 ,.
o AXIAL FORCE COEFFICIENT4 PITCHING MOMENT COEFFICIENT 0.03
I ATM o.02TT = 3101K /" L S
M = 0,765 / M N 0 0 3e
0.03
0.9 - 0.02
10 01
0 .8 -o . 0 0
0.6 ' 2' DE" 4 'I 10.0.002 0. 0.006
1 0 20 30 40 50 60 70
SPECIFIC HUMIDITY Fig. 2-14. Comparison of pressure-drag coef-ficient calculated with and
Fig. 2-11. Effect of the humidity on aero- without Reynolds number correc-dynamic coefficients, two- tions to the tunnel calibration,dimensional CAST-10 airfoil. [80/8].

16
M, or C" SIDEWALL _Mzb
0- .794 4.65 0,826 "ADEQUATE" ~''A 0.790 4.62 0.636 "20 .W01 If ~ Q'' 021
0.0~.1 Of 4A AA~
-0.5 - hr ----
2. 0.u 4 12 V.5
0 0.1 0.2 0.3 0.4 0.5 0.6 0.7 0.8 0.9 1.0 ANN
:,0.,32Fig. 2-15. Effect of sidewall boundary-layer M.$ Ws-4()10
removal on two-dimensional air- FM OWO W .foil pressure distribution,VA.aNM ).09
(83/8).Fig. 2-17. Onera M-5 model.R, x 10-6
2: FO RNSTO 0.3 rRe x 10-630 CORRICIED FOR TORSION DEFLECTION 3.60.8 0.2 2.6
1.80.7 - 0.1 -
UCREIDFR3C . 0.7
0. ORETD O ORIN0 20 40 60 80 100% SEMI-SPAN
0.5
0.4-01Pig. 2-18. wing twist, ONERA M-5
.4 0 0:, 0 model, Mach number0.0 06 .8 0.72 0.76 0.80 0.64 0.84, CL = 0.4.
MACNUBE
Pig. 2-16. Variation of lift coefficientwith Mach number at 2-dogincidence and various Reynoldsnumbers, 2D CAST-10 airfoil in20-in, span wind tunnel.
OVER FIXED, 100 GRITuOVER FIXED, 120 GRIT AIRFOIL 1 UNDER FIXED, 160 GRIT
0.1 ADEQUATE TRIP, 150O GRIT
TRAN!rnON FREE iso GRIT OE IE
LIFT COEFFICIENT ANGE OF ATTACK
Fig. 2-19. Effect of over, under fixing boundary layer, cruise Mach number,grit a 7% chord, (84/6).

17
3. OBSERVED REYNOLDS NUMBER EFFECTS: AIRFOILS AND HIGH ASPECT RATIO WINGSby
A. ElsenanrNational Aerospace Laboratory NLR
Anthony Fokkerweg 2. 1059 CM AmsterdamThe Netherlands
3.1 IntroductionAfter the preceding discussion of the pseudo-Reynolds number effect, this and the following chapters
are concerned with the Reynolds number effects as actually observed on various Aerodynamic configurations.In doing this, the classification as discussed in section 1.2.1 will be followed. The experimental infor-mation has been selected from the open literature and from unpublished results of the National AerospaceLaboratory NLR in the Netherlands. As far as possible results that were part of a larger systematic studyhave been used. In this way the internal consistency of the data could be checked to some extend. More-over, only results with transition close to the leading edge have been used (with the exception, of cour-se, of section 3.2). But it can not be excluded completely that part of the data still contain some measu-rement error or "pseudo-Reynolds number effects", as discussed in chapter 2.
The flow about two-dimensional airfoils has drawn a lot of attention in respect to Reynolds numbereffects. The attention is caused by the fact that the first high Reynolds number facilities were, becauseof their size, mainly used for two-dimensional testing. But also two-dimensional flow is relevant forhigh aspect ratio wings. Thus two-dimensional and high aspect ratio configurations are discussed togetherin one chapter.
To obtain a better understanding of the problems involved, this chapter has been sub-divided into anumber of sections. As a first distinction the state of the boundary layer is used. Flows with a substan-tial Amount of laminar boundary layer development are discussed separately from flows with a fully turbu-lent boundary layer. The reason is that transition location variations, laminar shock-wave boundary layerinteractions and, in some cases, laminar separation bubbles introduce typical flow phenomena that areabsent in flight where normally well developed turbulent boundary layers are found. Helicopter blades andthe flow on propeller blades are an exception (due to the low chord Reynolds number), but they can betested at their full scale Reynolds number in ground based facilities and do not represent an extrapola-tion problem. One other class of airfolla is excluded: the (either forced or natural) laminar flow air-foil. They deserve a very special attention from the point of view of Reynolds number effects which isbeyond the scope of this AGARDograph. In section 3.2 a number of examples related to drag, maximum liftand pitching moment will be discussed to illustrate the point that tests with free transition behave quali-tatively different from flows with mostly turbulent boundary layer development (whether caused by naturaltransition close to the leading edge or by artificial means such as fixation). Free transition resultscan even by very misleading for flight conditions.
The next two sections are only concerned with Reynolds number effects observed on configurationswith fully turbulent boundary layer flow. This allows a systematic discussion of the problem. Use willalso be made of the distinction (as discussed in section 1.2) between direct Reynolds number effects (re-sulting from changes in boundary layer development) and indirect Reynolds number effects (that appear aschanges in pressure distribution). In section 3.5 the question how relevant two-dimensional flows are tohigh aspect ratio wings will be addressed. It will be argued that certain conditions must be met beforeone can speak of a good correspoi.dence between two- and three-dimensional flows.
The last section of this chapter summarizes the preceding discussions especially in view of the use-fulness of wind tunnel tests for flight prediction. The AGARD working group W-09 addresses this topicspecifically and for more information their final report should be consulted (see ref.00/1). However, theanalysis presented in this chapter is hopefully useful in reducing the uncertainty implied in the fullscale prediction on the basis of sub-scale wind tunnel tests.
3.2 Effects related to partly laminar boundary layer flow
3.2.1 The direct effect on dragBoundary layer transition appears to be a function of Reynolds number, pressure distribution, sweep
angle, flow quality. etc. On the basis of empirical criteria, it can be determined in principle if theboundary layer will be laminar or turbulent in the wing tunnel or in flight. For a smooth flat plate boun-dary layer the transition Reynolds number Is 2 to 5x10 depending on noise level and turbulence intensity.This indicates that an airfoil with a flat pressure distribution might experience substantial regions oflaminar flow for chord Reynolds numbers below IOx10 . This will be even more true for laminar flow air-foils (like the NACA 6-series). For "peaky"-type pressure distributions the pressure gradient near thenose will trigger transition, almost independent of Reynolds number. Leading edge contamination complica-tes the situation even mole for wings with an appreciable wing sweep. Therefore, at tunnel Reynolds num-bers of the order of 3xlO laminer or turbulent boundary layer flow will be found, depending n wing geo-metry and flow conditions. For the same reason appreciable transition location variations might be foundon wind tunnel models as the Mach number or the incidence is changed. On the other hand it is generallyassumed that the boundary layer will be predominantly turbulent at flight Reynolds numbers (say in excessof 20x10 ) unless the airfoil has been designed specifically for laminar flow. By and large, appreciabledifference* in transition location are possible between wind tunnel and flight.
The skin fraction drag of a laminnr boundary layer is significantly lass than that of a turbulentboundary layer. Therefore, transition location variations have a very pronounced effect on drag. As arule of the thumb one can state that a 12 chord transition point variation corresponds roughly with halfa drag count. Consequently, transition point variations play a dominant role in the variation of dragwith Reynolds number as is well illustrated when comparing test results with fixed and free transition(Fig. 3.2-1). Along the laminar lower-left branch of the drag6 curve in this figure transition moves clo-ocr to the airfoil nose till a Reynolds number of about I0xlO . In this case the transition variation hasbeen caused by a Reynolds number increase either In a direct way or by an increase in noise level or tur-bulence intensity. At constant Reynolds number the transition point might move as a result of a changingpressure distribution, e.g. with Mach number. Thl is typirxly -- ned on the upper surface of supercri-tical airfoils with a roof-type pressure distribution. A rather extreme case (18 thick supercriticalairfoil) Is presented in figure 3.2-2. The transition movement is coupled with the rearward movement ofthe shock (Fig. 3.2-3). The resulting effect on drag is strongly felt at Mach numbers in excess of 0.7
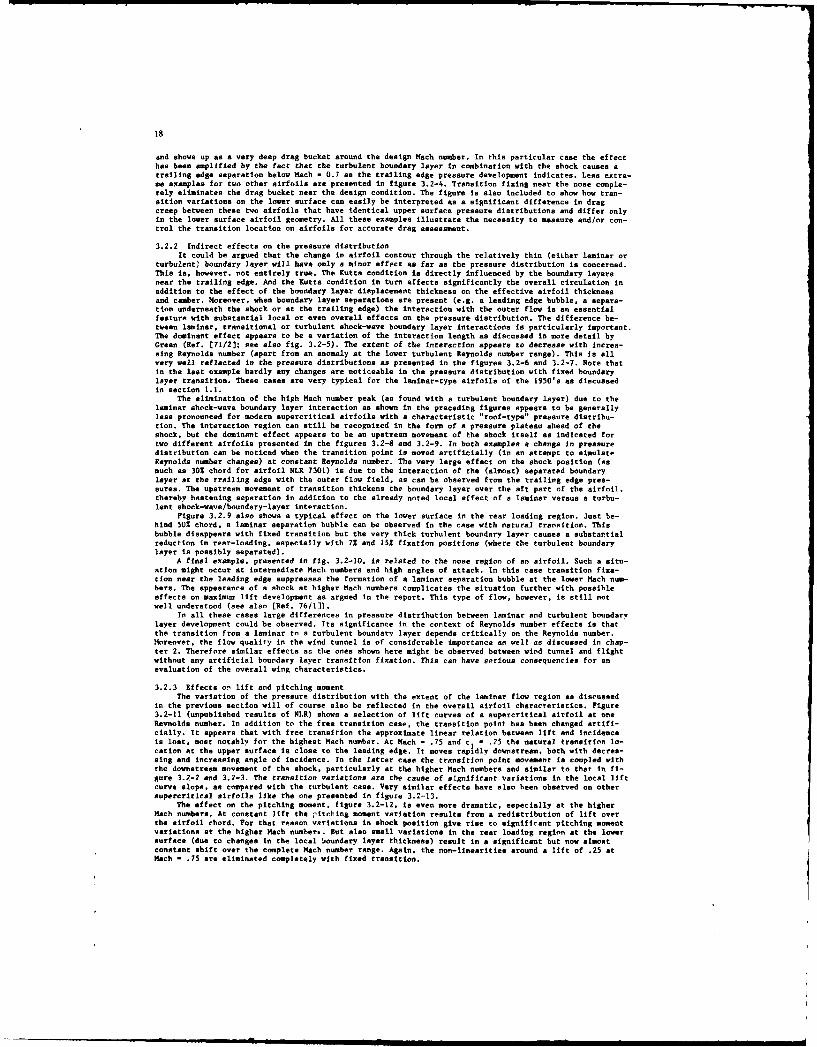
18
and shove up as a very deep drag bucket around the design Mach number. In this particular case the effecthas been amplified by the fact that the turbulent boundary layer in combination with the shock causes atrailing edge separation below Mach - 0.7 as the trailing edge pressure development indicates. Less extre-me examples for two other airfoils are presented in figure 3.2-4. Transition fixing near the nose comple-tely eliminates the drag bucket near the design condition. The figure is also included to show how tran-sition variations on the lower surface can easily be interpreted as a significant difference in dragcreep between these two airfoils that have identical upper surface pressure distributions and differ onlyin the lower surface airfoil geometry. All these examples illustrate the necessity to measure and/or con-trol the transition location on airfoils for accurate drag assessment.
3.2.2 Indirect effects on the pressure distributionIt could be argued that the change in airfoil contour through the relatively thin (either laminar or
turbulent, boundary layer will have only a minor effect as far as the pressure distribution is concerned.This is, however, not entirely true. The Kutta condition is directly influenced by the boundary layersnear the trailing edge. And the Kutta condition in turn affects significantly the overall circulation inaddition to the effect of the boundary layer displacement thickness on the effective airfoil thicknessand camber. Moreover, when boundary layer separations are present (e.g. a leading edge bubble, a separa-tion underneath the shock or at the trailing edge) the interaction with the outer flow is an essentialfeature with substantial local or even overall effects on the pressure distribution. The difference be-tween laminar, transitional or turbulent shock-wave boundary layer interactions is particularly important.The dominant effect appears to be a variation of the interaction length as discussed in more detail byGreen (Ref. (71/23; see also fig. 3.2-5). The extent of the interaction appears to decrease with increa-sing Reynolds number (apart from an anomaly at the lower turbulent Reynolds number range). This is allvery well reflected in the pressure distributions as presented in the figures 3.2-6 and 3.2-7. Note thatin the last example hardly any changes are noticeable in the pressure distribution with fixed boundarylayer transition. These cases are very typical for the laminar-type airfoils of the 1950's as discussedin section 1.1.
The elimination of the high Mach number peak (as found with a turbulent boundary layer) due to thelaminar shock-wave boundary layer interaction as shown in the preceding figures appears to be generallyless pronounced for modern supercritical airfoils with a characteristic "roof-type" pressure distribu-tion. The interaction region can still be recognized in the form of a pressure plateau ahead of theshock, but the dominant effect appears to be an upstream movement of the shock itself as indicated fortwo different airfoils presented in the figures 3.2-8 and 3.2-9. In both examples a change in pressuredistribution can be noticed when the transition point is moved artificially (in an attempt to simulateReynolds number changes) at constant Reynolds number. The very large effect on the shock position (asmuch as 301 chord for airfoil NLR 7301) is due to the interaction of the (almost) separated boundarylayer at the trailing edge with the outer flow field, as can be observed from the trailing edge pres-sures. The upstream movement of transition thickens the boundary layer over the aft part of the airfoil,thereby hastening separation in addition to the already noted local effect of a laminar versus a turbu-lent shock-wave/boundary-layer interaction.
Figure 3.2.9 also shows a typical effect on the lower surface in the rear loading region. Just be-hind 501 chord, a laminar separation bubble can be observed in the case with natural transition. Thisbubble disappears with fixed transition but the very thick turbulent boundary layer causes a substantialreduction in rear-loading, especially with 7I and L5% fixation positions (where the turbulent boundarylayer is possibly separated).
A final example, presented in fig. 3.2-10, is related to the nose region of an airfoil. Such a situ-stion might occur at intermediate Mach numbers and high angles of attack. In this case transition fixa-tion near the leading edge suppresses the formation of a laminar separation bubble at the lower Mach num-bers. The appearance of a shock at higher Mach numbers complicates the situation further with possibleeffects on maximum lift development as argued in the report. This type of flow, however, is still notwell understood (see also [Ref. 76/1).
In all these cases large differences in pressure distribution between laminar and turbulent boundarylayer development could be observed. Its significance in the context of Reynolds number effects is thatthe transition from a laminar to a turbulent boundary layer depends critically on the Reynolds number.Moreover, the flow quality in the wind tunnel is of considerable importance as well as discussed in chap-ter 2. Therefore similar effects as the ones shown here might be observed between wind tunnel and flightwithout any artificial boundary layer transition fixation. This can have serious consequencies for anevaluation of the overall wing characteristics.
3.2.3 Effects on lift and pitching momentThe variation of the pressure distribution with the extent of the laminar flow region as discussed
in the previous section will of course also be reflected in the overall airfoil characteristics. Figure3.2-11 (unpublished results of NIR) shows a selection of lift curves of a supercritical airfoil at oneReynolds number. In addition to the free transition case, the transition point has been changed artifi-cially. It appears that with free transition the approximate linear relation between lift and incidenceis lost. most notably for the highest Mach number. At Mach - .75 and c - .25 the natural transition lo-cation at the upper surface is close to the leading edge. It moves rapidly downstream, both with decrea-sing and increasing angle of incidence. In the latter case the transition point movement is coupled withthe downstream movement of the shock, particularly at the higher Mach numbers and similar to that in fi-gure 3.2-2 and 3.2-3. The transition variations are the cause of sgnificant variations in the local liftcurve slope, as compared with the turbulent case. Very similar effects have also been observed on othersupercritical airfoils like the one presented in figure 3.2-13.
The effect on the pitching moment, figure 3.2-12, is even sore dramatic, especially at the higherMach numbers. At constant lift the pitching moment variation results from a redistribution of lift overthe airfoil chord. For that reason variations in shock position give rise to significant pitching momentvariations at the higher Mach number.. But also small variations in the rear loading region at the lowersurface (due to changes in the local boundary layer thickness) result in a significant but now almostconstant shift over the complete Mach number range. Again, the non-linearities around a lift of .25 atMach - .75 are eliminated completely with fixed transition.
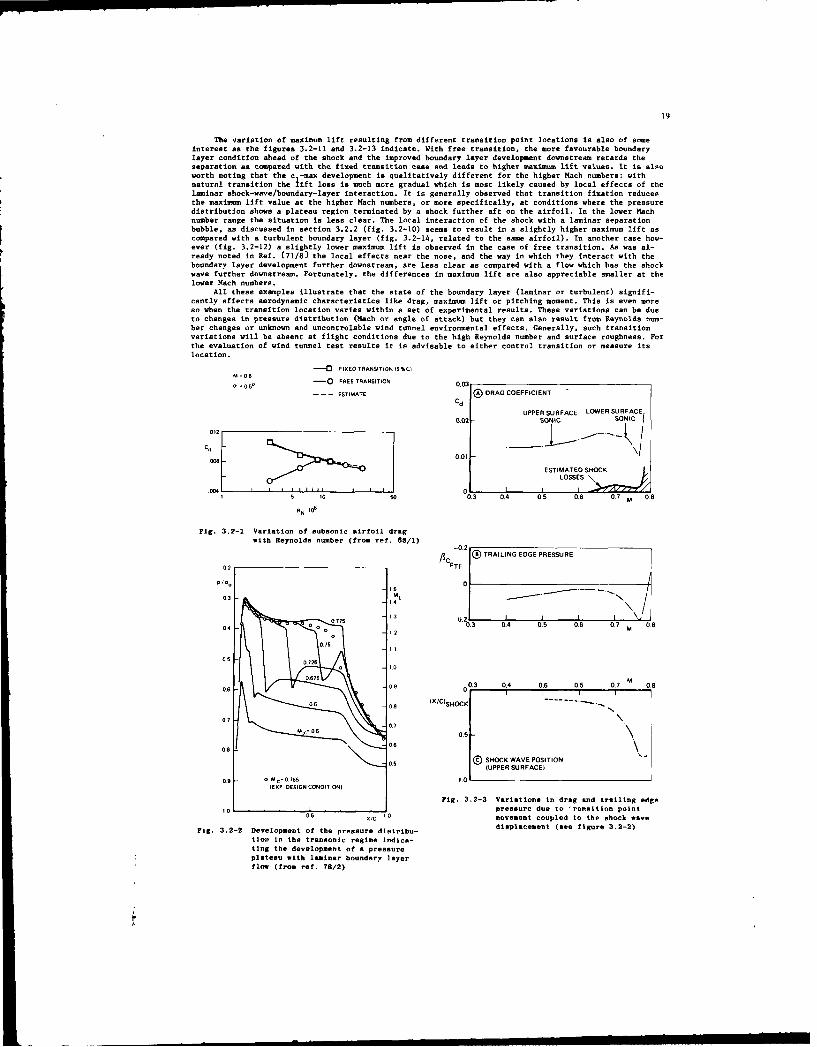
19
The variation of maximum lift resulting from different transition point locations is also of someinterest as the figures 3.2-11 and 3.2-13 indicate. With free transition, the more favourable boundarylayer condition ahead of the shock and the improved boundary layer development downstream retards theseparation as compared with the fixed transition case and leads to higher maximum lift values. it is alsoworth noting that the c -max development is qualitatively different for the higher Mach numbers: withnatural transition the lift loss is much more gradual which is most likely caused by local effects of thelaminar shock-wave/boundary-layer interaction. It is generally observed that transition fixation reducesthe maximum lift value at the higher Mach numbers, or more specifically, at conditions where the pressuredistribution shows a plateau region terminated by a shock further aft on the airfoil. In the lower Machnumber range the situation is less clear. The local interaction of the shock with a laminar separationbubble, as discussed in section 3.2.2 (fig. 3.2-10) seems to result in a slightly higher maximum lift ascompared with a turbulent boundary layer (fig. 3.2-14, related to the same airfoil). In another case how-ever (fig. 3.2-12) a slightly lower maximum lift is observed in the case of free transition. As was al-ready noted in Ref. E71/81 the local effects near the nose, and the way in which they interact with theboundary layer development further downstream, are less clear as compared with a flow which has the shockwave further dowTstream. Fortunately, the differences in maximum lift are also appreciable smaller at thelower Mach numbers.
All these examples illustrate that the state of the boundary layer (laminar or turbulent) signifi-cantly affects aerodynamic characteristics like drag, maximum lift or pitching moment. This is even moreso when the transition location varies within a set of experimental results. These variations can be dueto changes in pressure distribution (Mach or angle of attack) but they can also result from Reynolds num-ber changes or unknown and uncontrolable wind tunnel environmental effects. Generally, such transitionvariations will be absent at flight conditions due to the high Reynolds number and surface roughness. Forthe evaluation of wind tunnel test results It is advisable to either control transition or measure itslocation.
-0f FIXEO TRANSITION (5 %C
M. 06
0.5 -O FREE TRANSITION 0.03
- - - ESTIMATE ( DRAG COEFFICIENT
CdUPPER SURFACE LOWER SURFACE
0.02- SONIC SONIC
S0.01
ESTIMATED SHOCK
1 5 10 so 0.3 0.4 0.5 0.6 0.7 M 0.8
RN
10,
Fig. 3.2-1 Variation of subsonic airfoil dragwith Reynolds number (from ref. 68/1)
AC, -0.2 ( TRAILING EDGE PRESSURE02TE
04 0775 13 oI I I "0.
30.3 04 0.5 0.0 0.? M 0.8
12
07 5
0.5 0.1J25o 10
0.6 09 03 0.4 0.6 0.5 0.7 08i i i I
0 .8 (X /C IS H O C K - - -- - --
o~ e\s07
M- O'S 0.5
08 06
05 SHOCK WAVE POSITION
(UPPER SURFACE)
09 5 M OI5 1.0
(ERR DESIGN CONDITIONI
Fig. 3.2-3 Variations in drag and trailing edgepressure due to 'ransition point
05 0 Imovement coupled to the shock waveFig. 3.2-2 Development of the pressure distribu- displacement (see figure 3.2-2)
tion in the transonic regime indica-ting the development of a pressureplateau with laminar boundary layerflow (from ref. 78/2)
r/ 1 1n lHII INl lUli i i I I

20
0-o AIRFOIL A IDENTICAL UPPER SURFACE. -0. 1.&Sio h--6AIRFOILS DIFFERENT LOWER SURFACE R06 t-. 106
-.0 R10-XI T.EaIN LE
6 TRANSITION POSITION EFFECTED -0-4A~\'s~7 BYACE APHTENE j
-02 about -b chord
0,LE. LOWER SURFACE TRANSITION PODINT VARIATION
C 10 COUNTS -O
DRAG WITH FREE TRANSITION-04e
0/
W I~bI1 I.roTg
DRAG WITH FIXED 110%) TRANSITION
MACH NUMBER 0 .2 .4 .6 B8 1.0
Fig. 3.2-4 The effects of transitiono point varts- Fig. 3.2-7 Effect of Reynolds =hmer end arti-
tons on drag creep (from ref. 84/2) ficial boundary lau fat on o
tihe pressure distribution (from ref.55/1)
TRANSITIONAL TURBULENT ,
TURBULENT.
PRESSURE RISE
FSEPARATION - z10 102 103 10 105 11 04
Fig. 3.2-B Effect of transition point changes
Fig. 3.2-S Effect of.Reynolds number on some on the pressure distributilon of aproperties of sbock-induced separm- supercritical arfoil (from ref.
tion at Hach = 1.5 (conjectural; B1/l)
ref . 71/2)
-1.2
-C.0050.0-0.86
--CCRITICAL C.*=.
C.,-,0 SEPARATION
0.4 ---- 30% A RNIIN ',~So w0 so so w0 0 80 10 so so me 0 Me do so 0 0 go% FIXED
0.8Fig. 3.2-6 Effect of a Reynolds number Increase0
on, the pressure distribution presuma-bly caused be achange from laminar 1.2 Lto turbulent shock-wave/bounftry- Pig. 3.2-B Effect of transition point changeslayer interaction (fromt ref. $2/2) 01 the pressure distribution of a
supercritical airfoil (from ref.84/2)
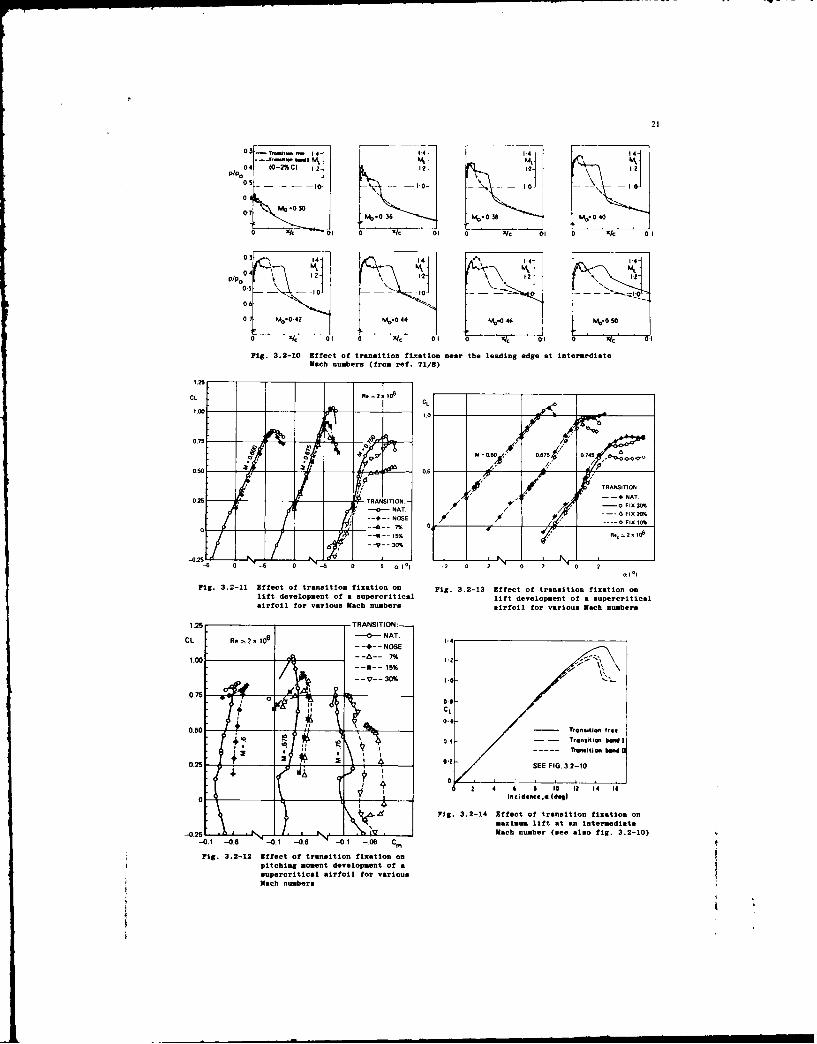
21
P/o04 (0-2% C) z iI 1
0 0 / 1 0 1~ 01 k 0
M M]
I J I "04 k-- 3- k0 M- -4
0 301 0-x 1 0 0 IqC J. 1 0 . C 14 N
05~~ 4-g-] -
061
0 o- 4.04 ;M0 44 M84.046 N10 -0so
0 , of 0 XC -~ 0I 0 C 01 I
Fig. 3.2-10 Effect of transition fixation near the leading edge at intermediateMach numbers (from ref. 71/B)
1.25
CIL R. .o106
1.0
0.75
0.25TRANITIN:- l-NT-I_ _ - -NAT _ ': 0
021 ....... TOAOIT~N - FIX 20%
NOSEz: ~ c ---- 0FIX 10%--a-- R., 8~2.10'
--- 0%
-02,-0 0 6 0 - 0 t (0 -2 0 -2 0 2 0 2
Fig. 3.2-11 Effect of transition fixation on Fig. 3.2-13 Effect of transition fixation onlift development of a supercri I cal lift development of a muperriticalairfoil for various Mach numbers airfoil for variou Mah numbers
1.25 -TRANSITION:
CIL Re= 2x 10⁸ NAT. .-- NOSE
___________m__ 15%
-- 17--315%
0.75
0.-0.50 CLntn 1,ee
4 -Trasutiwl 655 I
0.5 .2 4 SE FIG 1014 I
0.25 I 00SEE FIG. 3.2-10
0 Incidaalcq~a (dog)
F9g 3.2-14 Effect of transition fixation onmimum lift at an Intermediate
-0.25 Ma--J I :chanumber (see also fig. 3.2-10)-0.1 -.6 -0.1 -0.6 -0.7 -. 06 C,.
Fig. 3.2-12 Effect of transition fixation onpitching moment de velopment of a
supercritical airfoil for vari ousMch numbers
22
3.3 Flows with (almost) attached turbulent boundary layers
3.3.1 The pressure distribution - overall effectsIn this and the following sections only results with turbulent boundary layer flow (either natural
or artificially tripped) will be considered. They constitute a class of flows with a Reynolds number ef-fect in the most pure way. A very obvious, but unfortunately not so easy, comparison can be made betweenwind tunnel and flight. Some examples are shown in the figures 3.3-1. (a) to (a) taken from the referen-ces (66/1], C68/2] and [72/3]. In the subcritical case (a) and the supercritical cases (c) and (d) thedifferences in pressure distribution are small with, for the latter cases, variations in shock positionof 5% chord at most. The cases (b) and (e) seem to Indicate a separation in the wind tunnel that van notobserved in flight and vica-versa. In case (b) this separation is connected with a large shift in shockwave position: this case is the almost classical example how Reynolds number can change the pressure dis-tribution. In case (e) the shock position remains virtually unchanged. In reference (72/3] it was repor-ted that interference effects from the pressure tubing as used in flight were believed to have influencedthe pressure readings here, although three-dimensional separation effects (see section 3.5) were not ex-cluded. This may be another example (see chapter 2) that Reynolds number effects and measuring problemsare not always easy to separate. Case (b) seems to suggest that separation of the boundary layer is ofimportance. Separation effects will be discussed more extensively in the next section. In this section wewill be concerned mainly with attached or almost attached (only local trailing edge separation) flow con-ditions.
The example (e) illustrates that wind tunnel/flight comparison is not always an easy matter. Fortu-nately, pressurized wind tunnels provide the means for systematic studies and some typical results arepresented on the figure 3.3-2 to 3.3-7. They are mainly taken from unpublished work at NLR. studies madeby Stanewsky at DFVLR [Ref. 81/1] and studies made by Blackwell [Ref. 76/4]. Reynolds numbe effects asreflected in the pressure distribution are (by definition: see section 1.2.1) "indirect Reynolds numbereffects": the change in pressure distribution due to a variation in the (turbulent) boundary layer deve-lopment. The "regular" part of the pressure distribution change is due to the thinning of the boundfyglayer with increasing Reynolds number (the displacement thickness being roughly proportional to Re ).Consequently the effective airfoil thickness decreases and the effective camber increases. Of these twoeffects, the latter appears to be the most important, especially over the rear part of the airfoil, resul-ting in a local load increase. For a comparison at constant lift, as shown in figure 3.3-2, the increasein load over the aft part of the airfoil must be compensated by a decrease in load over the front of theairfoil, that is realized by a decrease in angle of incidence. This feature is common to all pressuredistributions of figure 3.3-2. The shock wave movement appears to be less consistent. With the lesseningof viscous effects over the rear of the airfoil the shock wave moves downstream (in the limiting case ofinviscid flow the shock will be farthest downstream). The decrease in angle of incidence (to keep thelift the same) moves the shock, in general, more upstream. The final outcome of these opposite effectswill depend on their relative strength: a downstream movement in the figures 3.3-2 (b) and (d). an up-stream movement in case (c). The change from an upstream to a downstream shock movement is very regularas figure 3.3-3 (b) indicates. In this case the variations In shock position at constant lift appear tobe rather small. Near the design condition, however, larger differences can be observed as discussed insection 1.2.3 (figure 1-7). It is due to the fact that the flow is often sensitive to any small changenear the design condition. Figure 3.3-2 (a) provides an other example: a similar change from a double toa single shock can be obtained at constant Reynolds number with a small increase in angle of incidence.These moderate changes in pressure distribution (except for the design condition) are also reflected inthe small decrease in shock strength at constant lift (fig. 3.3-3 (a)). Is the airfoil of figure 3.3-2possibly a not so extreme case from the point of view of aerodynamic loading? The pressure distributionreveals a moderate amount of rear loading and the airfoil does not show appreciable variations in trai-ling edge pressure with Reynolds number. Such variations do appear to be much larger for another super-critical airfoil, CAST-10, as reported in [Ref. 81/1] and corresponding with the pressure distribution asalready presented in figure 3.2-8. However, when the variation of shock wave strength and position isplotted for the two airfoils as a function of lift and/or Mach number, rather similar variations are ob-served (see fig. 3.3-3 and 3.3-4). Also the results of other airfoils (this time at constant incidence)as given in the figures 3.3-5 to 3.3-7 and reported by Blackwell [Ref. 76/] reflect rather small changesin pressure distribution. Note also that the Reynolds number effect on the NACA airfoil at high lift issimilar to those observed on the two supercritical airfoils.
These moderate variations in pressure distribution should not come as a surprise. All the examplesare related to attached, or almost attached (limited trailing edge separation at most) flow conditions.When separations are present the variations in pressure distribution are considerably larger as was al-ready illustrated with figure 3.3-lb. Moreover. variations with Reynolds number at constant angle ofincidence may be a little bit larger.
3.3.2 The pressure distribution - local effectsIn combination with the rather regular and global Reynolds number effect on the pressure distribu-
tion due to effective thickness and camber variations a number of local effects should be noted.
s Local separation underneath the shockThe interaction between the shock wave and the (turbulent) boundary layer will depend on Reynolds
number. A very good review is given by Delery and Marvin [Ref. 85/12] and they indicate that incipientseparation occurs at a shock Mach number close to 1.3 almost independent of Reynolds number. However,beyond incipient separation a local separation at the foot of the shock Is sometimes clearly visible inthe pressure distribution (see e.g. figure 3.4-4). Rxtensive correlations made by Fulker and Ashill [Ref.85/4] indicate that the length of the separation bubble roughly scales wi:h the thickness of the incomingboundary layer and will therefore be Reynolds number dependent. The development of this separation bubbleis of prime importance for defining the location of the separation boundaries in the C1-Mach plane (see3.4).
5 Second expansion behind the shockIn some cases, depending on the local curvature of the airfoil, the second expansion behind the
shock can be so strong that locally a second shock is generated. A thick turbulent boundary layer in thisregion will reduce the local surface curvature, but at higher Reynolds numbers this second shock may very

23
well increase in strength, possibly with significant consequencies for the drag development; see fig.3.3-9 taken from Ref. (76/2) as a typical example. (It was noted later that some of the high Reynoldsnumber data are invalid because of inadequate side-wall auction). The effect might be important when lar-ge variations in surface curvature occur just downstream of the shock position as measured in the windtunnel.
a Lower surface separationA third local effect in the pressure distribution, already mentioned in section 3.3.2 (fig. 3.2-9),
can be noted on the lower surface of the airfoil in the rear loading region as typically found on modernsupercritical airfoils. The steep local pressure gradient might provoke boundary layer separation at lo-wer Reynolds numbers. In the concave airfoil contour this separated boundary layer will most likely re-attach a bit further downstream. For this reason this kind of separation Is sometimes hardly visible inthe pressure distribution and difficult to detect. In more extreme cases it will cause an appreciableloss of lift in the lower surface rear loading region. In that case the effect on drag can be consider-able, in a direct way through lower surface separation drag and in an indirect way through increasedshock strength at the upper surface to keep the total lift constant. The effect can be assessed experi-mentally by comparing drag of a forward and rear fixation position after a correction for the length ofthe laminar boundary layer.
Local trailing edge separationThe last and most important local effect on the pressure distribution is a limited or local separa-
tion near the trailing edge. When the "load" on the boundary layer increases (higher lift or Mach number,lower Reynolds number) a small separation will start to develop at the trailing edge and will graduallymove upstream. The term "local" is used here to distinguish this separation from one that extends fromshock to trailing edge as will be discussed later. The extent of this separation is difficult to esta-blish both experimentally and theoretically. In fact one might argue that there is hardly any differencebetween a locally separated boundary layer and a thick turbulent boundary layer in this region. This ispartly due to a stabilizing effect of the interaction with the outer flow: the thick turbulent boundarylayer over the rear of the airfoil decreases the trailing edge pressure and reliefs the severity of thepressure gradient. This separation will modify the Kutta condition and hence the circulation around theairfoil. It is to be expected that the local separation will therefore contribute to some loss of lift atconstant angle of incidence with decreasing Reynolds number. As long as the separation is restricted to asmall part of the chord (say 10 of chord), the effects will be gradual. However, at a certain stage inthe separation development a sudden and complete flow break-down can occur as indicated by a rapid in-crease in trailing edge pressure. This situation Is complicated further by the interaction between thetrailing edge separation and the bubble underneath the shock. This process will be discussed in more de-tail in section 3.4. Here only conditions with a small and localized separation (either underneath theshock or at the trailing edge) will be considered. It is believed, and to some extend justified by theevidence presented till now and still to come, that such local separations will have, in general, a minorand gradual effect on the pressure distribution. Some indication of local trailing edge separation can beobtained by plotting trailing edge pressure versus lift or Mach number as illustrated in the figures3.3-10, 11 and 12. The low trailing edge pressures seem to indicate that the HACA airfoil at 3* angle ofattack (fig. 3.3-10) has developed a trailing edge separation at low Reynolds number that disappears athigher Reynolds number. This is also the case for the CAST-10 airfoil (fig. 3.3-12) at the lowest Reynoldsnumber (and prior to flow break-down as indicated by the rapid decrease on trailing edge pressure). It isbelieved that these local separations are of particular significance for the evaluation of drag and pit-ching moment as will be presented in the next sections.
3.3.3 Lift and pitching momentThe lift curves related to the two supercritical airfoils as discussed in the previous section (see
fig. 3.3-2 to 3.3-4) are presented in the figures 3.3-13 and 3.3-14. The decrease in angle of incidencefor constant lift is more pronounced when the viscous effects are stronger e.g. at higher lift and Machnumbers. This appears as a shift and a rotation of the cI-alpha curves. Note also that the largest varia-tions in a with Reynolds number are found at low Reynolds numbers. The results of airfoil CAST-I andmodel "A' are similar in this respect.
The variation of lift, pitching moment and trailing edge pressure with Mach number (this time atconstant incidence) for both airfoils is presented in the figures 3.3-11 and 3.3-12. Both lift and pitch-Ing moment show an appreciable variation with Reynolds number, this being the most extreme for CAST 10-2.This is only partly due to the indirect Reynolds number effect on shock wave position. An equally impor-tant contribution arises from a loss of lift with decreasing Reynolds number over the aft part of theairfoil due to the local decambering effect of the thick boundary layer. As discussed before, the trail-ing edge pressure development might be viewed as an indicator for the severity of the viscous effects.A comparison of its development for the two airfoils is therefore of interest. In both cases a very regu-lar variation of trailing edge pressure with Mach number is observed. The CAST-la airfoil, being closerto separation at the design condition as boundary layer calculations reveal, shows at the lowest Reynoldsnumber even a decrease in trailing edge pressure with increasing Mach number (where the Prandtl-Glauertrule would suggest an increase), a situation that is often indicative of local trailing edge separation.It is of interest to note here that the lift and pitching moment variations correlate well with the trai-ling edge pressure development before as well as after flow breakdown as indicated by the rapid decreasein trailing edge pressure.
The increase in lift at constant incidence with Reynolds number has already been discussed. Withrespect to its variation with Mach number, theory suggests a development that follows approximately thePrandtl-Clauert rule. The results as presented in the top of figures 3.3-11 and 3.3-12 illustrate verywell that viscous effects modify this development in a Reynolds dependent way and for the CAST-I airfoil(low Re) even to such an extent that an almost constant lift is found. Also the pitching moment (up tolift-divergence) is in this case almost constant. One can conclude that the viscous effects appear to bestronger on the CAST-10 airfoil. Nevertheless, the two airfoils behave qualitatively very similar.
The study of Blackwell [Ref. 76/4) supports this view as the figures 3.3-6 and 3.3-7 and 3.3-10 in-dicate. In all cases the lift and pitching moment varies very regular with Reynolds number. The largestchanges with Reynolds number are observed at higher lift or Mach number conditions and at the lowest Rey-nolds nusber range where viscous effects are more pronounced.

24
3.3.4 Drag and drag-divergenceIn the analysis of drag it is useful to distinguish between flat-plate skin friction drag, subsonic
minimum airfoil drag, subsonic lift dependent drag, compressibility drag and drag-divergence.
s Flat plate skin friction dragThere are many expressions for the Reynolds number dependence of flat 2}ste skin friction drag as
indicated in fig. 3.3-15. Skin friction is approximately proportional to Re n with n - 2 for a laminarand n 5 for a turbulent boundary layer. As a result of this large difference in Reynolds number depen-dence, the transition location must be accurately known for drag evaluation as already discussed in sec-tion 3.2. All results presented in this section are obtained with artificial fixation near the nose orfor conditions at which the Reynolds number was so high that natural transition could be expected in thenose region. When necessary corrections for a (small) region of laminar flow have been made.
a Subsonic minimum airfoil dragIt is con practice in drag evaluation studies to split-up the subsonic drag in a zero lift and a
lift-dependent (viscous and induced drag) contribution. However, modern airfoils are designed for a par-ticular lift and for that reason far from symmetric. Consequently, zero-lift drag is not necessarily mini-mum drag. The airfoil might even show separation at zero liftl Also the induced drag of a wing of finitespan is not necessarily zero at zero lift. For that reason the term subsonic minimum airfoil drag is usedin a rather pragmatic way.
Minimum airfoil drag is often estimated with so-called form factor methods. They express essentiallythe airfoil drag as the flat plate skin friction drag multiplied by the form factor that depends on theairfoil thickness. The form factor accounts, in fact, for some kind of average of the flow velocity overthe airfoil. Typical examples of the variation of experimentally observed drag values are presented infigure 3.3-16. Although drag is not accurately predicted, the variation with Reynolds number follows close-ly a skin friction law.
* Subsonic lift dependent dragA sumary of some lift dependent drag values is presented in figure 3.3-17. In this figure the mini-
mum drag as estimated with a from factor method has been subtracted from the experimental values. More-over, the results have been divided into a low and a (moderately) high Reynolds number range. This parti-cular representation has been chosen to show the much larger variation in lift dependent drag for the lowReynolds number cases. It should also be noted that the most "extreme" airfoils (CAST-IO and model "B".as established from boundary layer calculations) show the largest deviations. For that reason it is sug-gested that local trailing edge separation (or at least a very thick boundary layer) increases the dragsignificantly. "is is of some practical importance when low Reynolds number wind tunnel data have to beextrapolated to flight values on the basis of a well established skin friction trend; the drag might thenbe over-estimated by as much as IOZ. Also, a particular airfoil, disregarded since it had a relativelyhigh drag at the tunnel Reynolds number might very well be acceptable or even superior to other airfoilsthat apparently performed much better in the tunnel. This is another illustration of the point raised byHaines [Ref. 79/2) in his plea that high Reynolds number facilities are important for aircraft design anddrag optimization. Although trailing edge separation can be detected in the wind tunnel or (approximately)calculated from boundary layer theory, it seems hardly possible, at present, to either correct or predictthe resulting drag penalty of such a local separation.
* Compressibility dragThe compressibility drag is often defined as the drag increase at constant lift relative to a sub-
sonic condition. Compressibility drag is partly the result of a (slight) decrease in flat plate skin fric-tion drag with increasing Mach number and an adverse effect on the boundary layer development due to sub-stantial changes in the pressure distribution as a result of transonic effects. Both effects are represen-ted rather crudely in some form factor methods (by a compressible skin friction law and by Prandtl- Clau-ert scaling of the airfoil thickness). This drag creep contribution can be calculated more accuratelyfrom a boundary layer calculation. However, when the boundary layer is separated or close to separation(as is very often the case) such a simple calculation will under-estimate the drag and hence also itsReynolds number dependence due to the pressure gradient "relief" of the thick boundary layer. Only morerecently, calculation methods that model in a fundamental way the interaction between the boundary layer(including separation) and the outer flow field (so called strong interaction) are ale to give good quan-titative results for not so strong shock waves [see Ref. 85/10 and 85/11). The other major contribu-tion to compressibility drag results from the shock wave development and the Interaction with the bound-ary layer. The Reynolds number effect on the shock wave development is by definition an indirect Reynoldsnumber effect. In the figures 3.3-2 to 3.3-7 it was already noted that the Reynolds number effect on shockwave strength at constant lift is small. Nevertheless, in view of the large sensitivity of the wave dragto the shock Mach number, quite small changes in pressure distribution may lead to a substantial increaseor decrease in compressibility drag. The existing evidence does not indicate that such large variationsin compressibility drag are generally found as the figures 3.3-5, -7, -8, -18, -19 illustrate. Supercriti-cal airfoils are designed for a low drag creep by restricting through design the shock wave developmentwith Mach number. Figure 3.3-18 suggests that the drag creep closely follows the form factor estimate forlift values slightly below the design lift, with little room for wave drag. The wave drag contributionincreases with lift, but even then the Reynolds number dependence appears to be almost nil for airfoil"A". The CAST-IO airfoil on the other hand (fig. 3.3-19) reveals a much larger dependence on Reynoldsnumber. Since, however, the shock wave development is not to different for these two airfoils (see fig.3.3-3 and 3.3-4) it is suggested that local trailing edge separation it also of importance for this dif-ferent behaviour. Like the lift dependent subsonic drag, the affect is most pronounced for the lowestReynolds number.
The drag creep results as presented in the figures 3.3-5 up to 3.3-8 generally seem to confirm thisview. The variation with Reynolds number is small except for the 211 thick airfoil of figure 3.3-7. Notehowever that for this extreme thick airfoil a subsonic (below Mach - .5) drag increase of 10 counts (re-lative to a form factor estimate) is observed when the Reynolds number is changed. This is somewhat simi-lar to the observations of the lift dependent drag for the CAST-10 airfoil.

25
Although these results seem to indicate a rather consistent view with respect to compressibilitydrag, one should be careful in generalizing these findings. The airfoil discussed in section 3.3.2 andfor which the pressure distribution is presented in figure 3.3-9 experiences an unfavourable Reynoldsnumber effect on drag creep due to a very pronounced secondary expansion at higher Reynolds numbers. Another extrem case is presented in the figures 3.3-20 to -22. This airfoil (the same one as shown in fi-gure 1-8) shows a dramatic increase in drag with Reynolds number when evaluated at constant incidence (0- 1.3"), whereas a favourable development is found at constant lift (fig. 3.3-20). This behaviour can beunderstood from the development of the pressure distributions (fig. 3.3-21 and -22). Due to trailing edgeseparation at the lowest Reynolds number the shock moves aft when the Reynolds number is increased. Thisis accompanied with a pronounced increase in shock strength at constant incidence leading to an increasein wave drag that, at the highest lift values, more than compensates the decrease in viscous drag. Atconstant lift, however, the shock still moves aft, but the lower incidence (to keep the lift constant)reduces the shock strength such that the total drag decreases (note the revised trend in suction peaklevel with increasing Reynolds number). The example nicely illustrates the importance of evaluating Rey-nolds number effects, especially as far as drag is concerned, at constant lift as discussed in section1.2.3. (fig. 1-10). In all cases a very careful examination of the pressure distribution is requiredbefore a high Reynolds number estimate can be made with some confidence.
* Drag divergenceThe sharp rise in drag with increasing Mach number as experienced in the transonic regime is often
called drag divergence. Its boundary in the C -Mach number plane limits the region of economic flight.Drag divergence is distinct from drag creep: ihe gradual increase of drag prior to drag divergence andalso due to compressibility effects. The drag divergence boundary can be derived from plots similar tofigure 3.3-18. Various definitions are possible here like d CD/d Mach (at constant lift) - 0.1 as used infigure 3.3-23. Drag divergence is basically an inviscid flow phenomenon caused by a rapid, non-linearincrease in shock strength. Viscous effects will modify the drag divergence boundary to the extent thatthey modify the pressure distribution. For that reason Reynolds number effects on drag divergence will besmall when the indirect Reynolds number effects (changes in pressure distribution due to Reynolds number)are small. Figure 3.3-23 shows some typical examples of the Reynolds number effect on drag divergence inaddition to the drag results as shown in the figures 3.3-5, -7 and -8. In general, the effects appear tobe very small. Only the results of the CAST-1O airfoil show a much stronger effect. This is not well un-derstood, but it is possible that local trailing edge separation is also to blame.
SUPERCRMC L FFESSn DOlf0NS U B O Ar T C A L P F W R D Ts R WTm I OG N M. G S ; e m "
-la5;Ofa-
-.5 -
C, -.6 Co .6
-A o
-.2 -. a
.0 .I1 I LO 0 .1 .2 .5 .63/ .7 a .9 U)II,',aft
Fig. 3.3-la Cosprisons of pressure distrlbu- Fig. 3.3-lb Comparisons of pressure distribu-tions for wind tunnel and flight time for wind tunnel and flight- C-141, subcritical - - C-141, supercritical -
0.7- -. MLLOAEXlaso~0.- 1.
... WIND-TUNNEL;AIROFOIL0.,-
0.9-
0€ 0.1 02 0.3 04 6 0Ae 07 0.9 0.9 .0
xx
Fig 3.-1cComarionsof resuredistribu-
tions for wind tunel iaed flight- X1-1 aircraft-

26
-.. c , c, -.{ 0-4212.Tunnel 0 4M .o
0.517 MESRD HT
Flight ------- 0462
-C.0 -- C-0 __I) - 0
-0.8
-o.6 -I , f ,To I AT W__
2 2
W ct ¢. c M.l°00 W a c, c , €, .- ,0--0'4 X M -W - 12. -7 . :: -.I _ 1 -
-0.2 - __ __ ____
I DI .80 0 4 " ,0 XlC
,
0-4 .-
Station 576 M-011 0*40 3I A701 (T-IT23AW
0"6 2 4 .4 . 0 0 4 2 .2.0
Fig. 3.3-2 Example of indirect Reynolds numberFIg. 3.3-1d Comparisons of pressure distribu- effects on a supercritical airfoil
tions for wind tunnel and flight- VC-10 -
MEASURED HST )-R . 12 6'] 1
CL
-14 Tunnel 043
Cp 0-479
Flight -431-1-2 12 .A
-I0 C
-0. 0 . C , 0 ,.4 .0 .0 2.0 1 Iv1 .
Fig. 3.3-3 Development of shock strength and-0-6 position with lift for two Reynolds
numbers (unpublished results oflIlA/lIST, model "A"
2)
-0-4___"' %. o ,CAST 10-2
1. 4. MEASUREDICFr)
-0-2 - -*__ 1.4 2
O'4__ 4
0-6®
Fig. 3.3-1e Comparisons of pressure distribu- W3*tions for wnd tunnel and flight Fig. 3.3-4 Development of shock strength and
position with Mach number (CAST 10-2
airfoil)
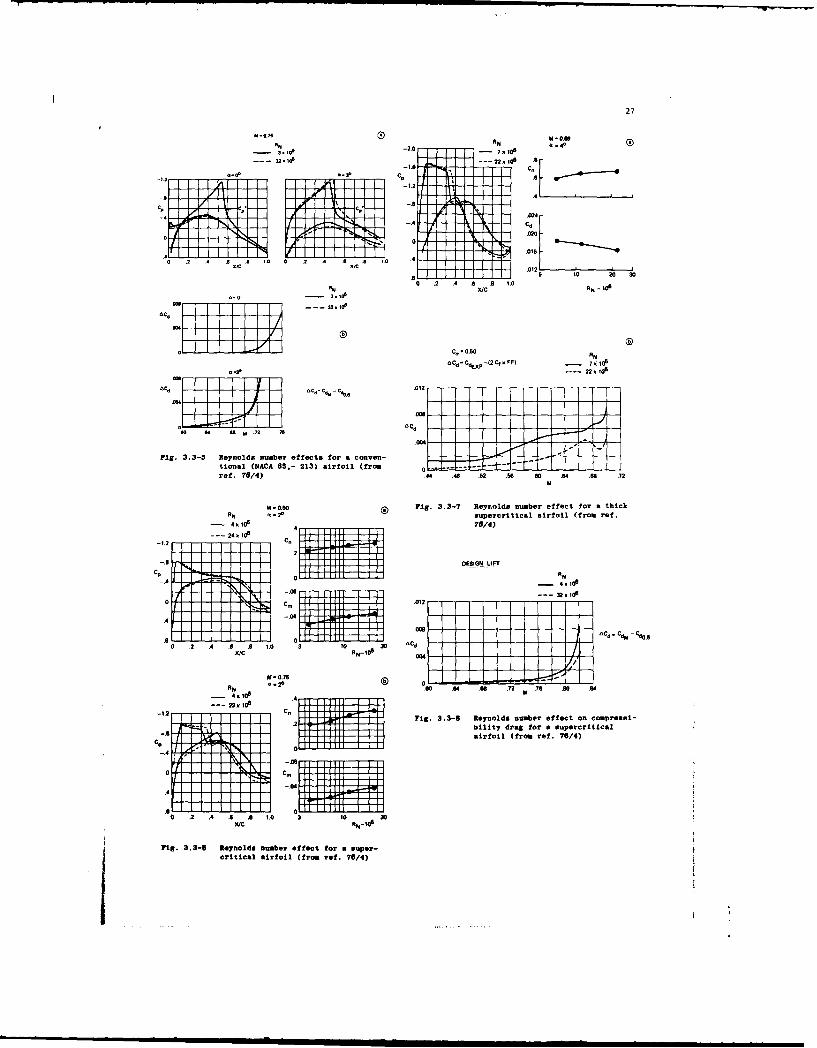
27
-M -0.. 4-Id' , -2.0 E"( (I ' 8
-. 0.0
.. .. p Il... . I
CC
xx .0125 30 0 300 .2 .4 .6 .8 1.0
"N 63C RN - 0- 3.6o0-- -0
3.10
.,¢, -- 1x -1( L L 32.1-- 7 0.M - -- L L2 [A
0 . 0.50 A0
ac, -4 C4 -42 CfFF) 7Ci39
-33 22. Id'
60 6 I 0 Lc. - c% - - -o4
.E
.
Fig. 3.3-5 Reynolds number effect for a conven- .tional (NACA 68,- 213) airfoil (from 0 . -ref. 76/4) .44 .48 .52 .56 .00 .64 .68 .72
M
M-0.60 * Fig. 3.3-7 Reynolds number effect for a thick
RN 2.2o supercritical airfoil (from ref.- 4. ' . 76/4)
--243 100-1.2 CDESIGN LIFT
- 4.106
-'00I ----- 32.1060,, - I L I ( 1 .012
I ~7 - ILI -1d -_- .
0 .2 .4 .6 .8 1.0 3 1O 0 30 CI0/'C 0 .0,
2ON .00 .64 .66 .72 .70 AD
23 0 .4301
J-2 C. Fg. 3.3- Reynolds number effect on compreesi-.2 Ibility drug for a supercritical
cAirfoil (from ref. 76/4)
-4 0 I I .
,8 r L I I Lp
0 . .4 .6 ,7e T.0 3 10 30
0/C fiN-l0,
Fig. 3.3-6 Reynolds number effect for a super-critical airfoil (from ref. 76/4)

28
r T0 CFFU L NASA
mos as Jz ip 2 ___o NACa m WiRM 0 on' -2__ _____
- - a. A_ _ 01 5 10 50
Ic - -. 06
• o I
2 04 0 1 D c Craba f -. 02
I5 10 50
NOTE: Results for R =24.8 x 10⁶and 28.3 x 10⁶ are invalid because ofinadequate side-wall suction - .02
()BEFORE 0RAGRISE -Cni
.2[ ___0o_
S5 10 R 50
and 28x1'aeivldbcueo
2&
__ •__ _ -_
LI - - - -11
-~ _ .21
.6
-i. SHOC _-1 Renls __re et______ o
- -- - K/C j 3
- - - -. 4
11 5 10 R, 06 5
@ATPig[. - 3.3-10 Reynolds nuber effect of soe&aeAFTEDRAG RISE dynamic characteristics for a conven-tional (MACA 03,- 213) airfoil (from
Fla. 3.3-9 Example of Reynolds number effect ref. 75/3)
on second expansion behind theshock (from ref. 76/2)
Idm m sm mIme i li11 1 -
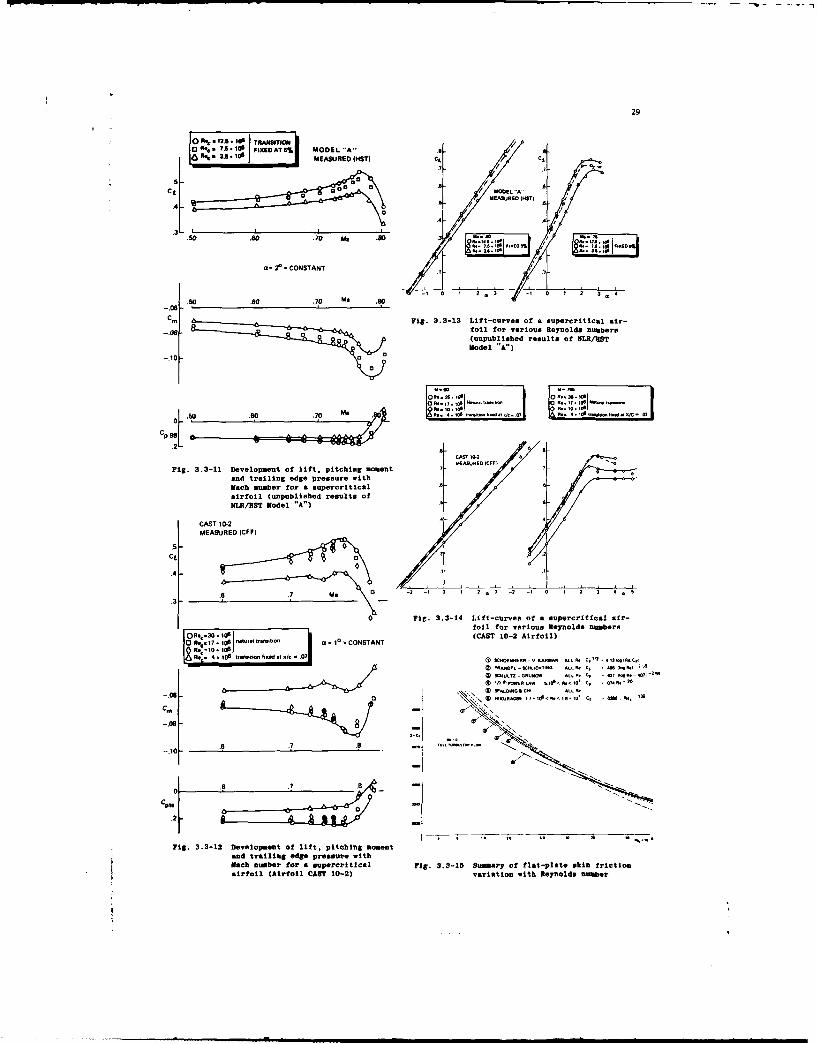
29
0~ € Fk 10,
O3R A.* 106 FIXEDAT5% MODEL A' • /
R% 3A10 MEASURED (NET) C' j
./ .0
Ct MODEL "A"
MEA&URED 4HST)
4 44
so.0.70 AIR '85I.41 **f.F . : I S. F O F *ix*. 1% A IxERE. .1
O 2* CONSTANT
- .50 .10. Ma .80
Cm Fig. 3.3-13 Lift-curves of a supercritical air--. 0 ... toil for various Reynolds numbers
(unpublished results of NLR/VSTModel ""
-o 100 • .0 ... 4. •00
4.[~ -e~ .a Ms .0 .0 F TF.F0
CP9L . I
CAST I0-2 0 I.2
Fig. 3.3-11 Development of lift, pitching moment 07
and trailing edge pressure withMach number for a supercrltical A
airfoil (unpublished results of
NLR/ST Model "A")
CAST 1W2MEASURED (CFF)
.5 0
.3
0 Fie. 3.3-14 Lift-curves of a supercritlcal air-
foil for various Reynolds nusbersIO, = =0. .01II0. R
5I7. l 60 nritrn 0 it 17 CONSTANT (CAST 10-2 Airfoil)
R'. 10 10 6
o-RIC 4. 10
6
t liton fixed at ,I0 EF V KARMAW ALL - C I3 . 41310 (F.Cl
I RANoTL - CHT-IN ALL FF C 4C 6 OF N 8
* SHULTZ - GRUOF ALL F. CT = 421 lOS S- 4071-2
.- 0 IUAIE1.<61F & cam2F. *
Cm
-. 0 8
.2
c,~. .6 -_ ~F 0
Fig. 3.3-12 Development of lift, pitching moment
and trailing edge pressure withMach number for a supercritIcal Fig. 3.3-15 Summary of flat-plate skin frictionairfoil (Airfoil LABT 10-2) variation with Reynolds nuaber

30
.012 . a A MEASURED. FIXED TRASITION MODEL "A"
MEASURED. NATURAL TRANSITION MEASUR 111501
R. 104 A CT -Nca1T CK) N'Ct COFIXE0
010 FOR FACTOR ESTIMATE * .. •
Ad - PORNIFACTOR ESTIMATT R- 2.5.I AMODEL "A" P - R- FACTOR ESTIMATE Re. 12A0
HST C4 -0 M.
.010 Mach - .6 .
00 0
CAST 10-2 a .00 'D M. noCFF
C5 .
R.0
NACA65. -213.. .6 ACd
.012-0
W.65 .0 70 Pft so
.0tO0
Fig. 3.3-18 Drag creep at Costiant lift forMODEL "B" A CFF different Reynolds numbers (tupu-
A blshed results of POL/BST; Model
I0 20 40 100 ReC A -6
Fig. 3.3-10 Development of subsonic minimumairfoil drag with Reynolds number CAST 10.2
(various sources) A Cd MEASURED JCFFI
.DO6 30 R 10-6
17 NATURAL TRANSITION,G 004 : :, 6
Cd - led
Ml - CdM. .51
C( CONSTANT1 4 FIXEDTRANSITION
C.002 R. 10.106a
.o MODEL "A" X1IG - ff N .. • 0 1 C,= .3 .. .
. CASTI - 11 z • N ,* •11 a-,4 - MODEL "B'" "'. -01 0e= 9• 0 .77 M. .90
LOWNE - MODEL "'" x-i0 N-I9-1o
0 .004 C .0 aCd. 'V 0W A
o.0 E, 5
CtN0 6156. -O .. 2 1. 1 ,0 0 Xr -M t I 2. 1061 "".6 • MODEL "A" Xr,.- o6 eeuls.,di dC
d
01112 NATURAL TPI-6 A 10. 10 .0
.4 • ODL " "NATIR TlAN R - 0 10 1VMHIGH RE Cr- .80e
00 C6 -pC6F '006 0 .00 .7 V Ao4 PP...d .10 Ms .60
Fig. 3.3-17 Subsonic lift-dependent drag for Pig. 3.3-19 Drag creep at conatant lift for
low and high Reynolds numbers (varl- different Reynolds numbers (CAST
ou@ sources) 10-S Airfoil)
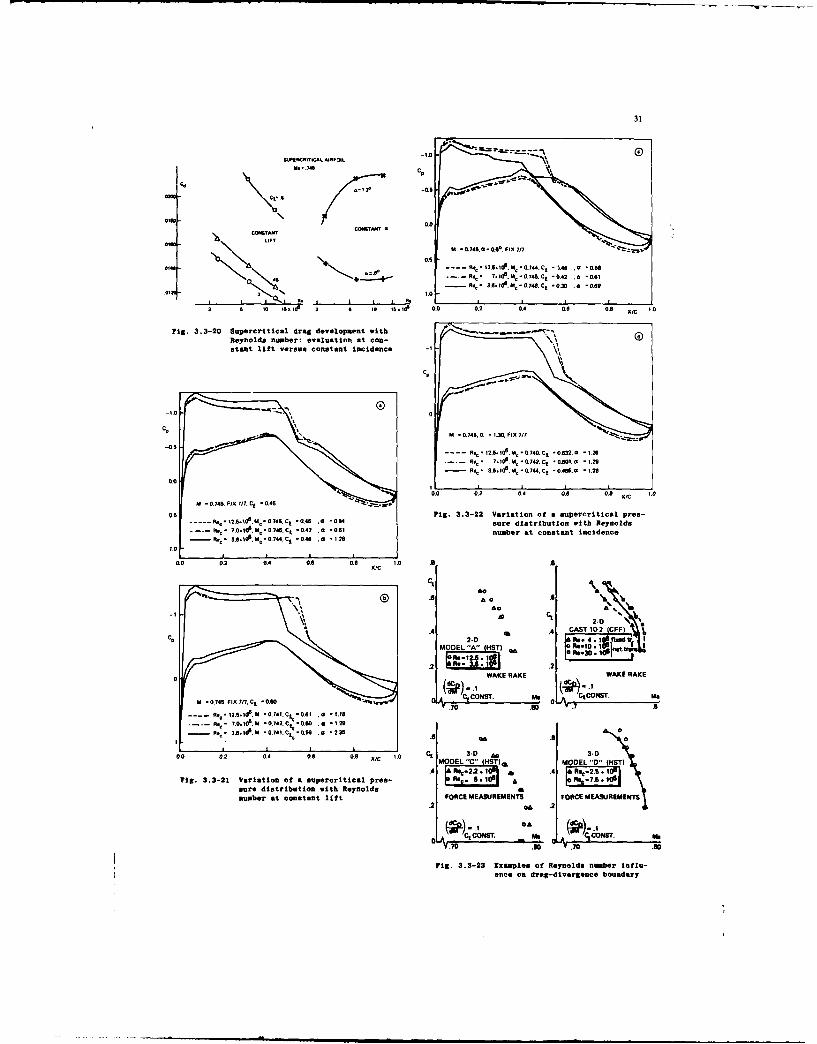
31
0006A~r ONST06PIT 0
Am~~ -1 0.746.40. FJIX 7/7
.-- R~ 7.'0
. M...'415 C' .. 2 .0 -0.1- -. ': 3.6. too. M, IK748 C, 0.30 0 ho
6 to IX I.7 1. 1. o S .0 0.2 04 .6 0.0 1.0
Fig. 3.3-20 Supercritical drag development with GReynolds number: evaluation at con-.tant lift versus constant Incidence -
CO
cp IM -0.745,4 - 1.30,FIX7/7
R.' -12 '5.106 M1 -0.740 C, .. 32.0a - 1.25No - 7.I00.N-0.74 CO -0.. -1.29
R. -*I 3.6. 106, Md0 -0.744. C, 0.466.0G - 1.28
0.0 0.2 0.4 0. 08 x 1 .0t
N -0.740. FIX 7n7. C o..45
o.5 -04 45 ig. 3.3-22 Variation of a supereritlcal pres--~ol26.0 -GN.140 C 000 00 sure distribution with Reynolds
o. 7.0.. 0 0.45. Ct -0.42 .a .. 1 number at constant incidence- 11%. 3.00
8.- 0.744.Cj -0.46 .0 1 .28
0.o 0. 1.4 0.h 0.0 t.o ..
CC
£0
0~~~ .6£0.
-1 It CS2-
.4 Ah . CAST 1112 (CFF)
C 7MODEL"A" (HST1)usR
0.746 FIX /7. j .0.0 '='300
.2 Rs. : 1.5 .2ItWAKE RAKE WAKE RAKE
A OS. MN A4CO4ST. MI,M -. 4.I~.j-.oT.70 .90 0 781
R. I 2.5.106, N -0.741. C L .t .5 110.C- 7.0.106.M -0.742.C
0 -00 0 1.2
- R1. 3.8.104 IGM (74I.C0 -0.X . -2.35 no .6 o
0.0 0.2 04 0. .0 0 C - 30D0/C MDEL C" HST)s OE "0" (HST1
A4 £Ree.2.2. 10 .4 I&F*.-2.5.lO5
kig. 3.3-21 Variation of a super rit cal pr s-
0.£sure distribution with ReynoldsIs]number at constant lift FORCE MEASUREMENTS FORCE MEASUJREMENTS
.2 o& .2 o
IC 1 S. --I us c OT.1
V.70 .80 T 70.0
rig. 3.3-23 gxamples of Reynolds number Influ-ence on drag-divergence boundary
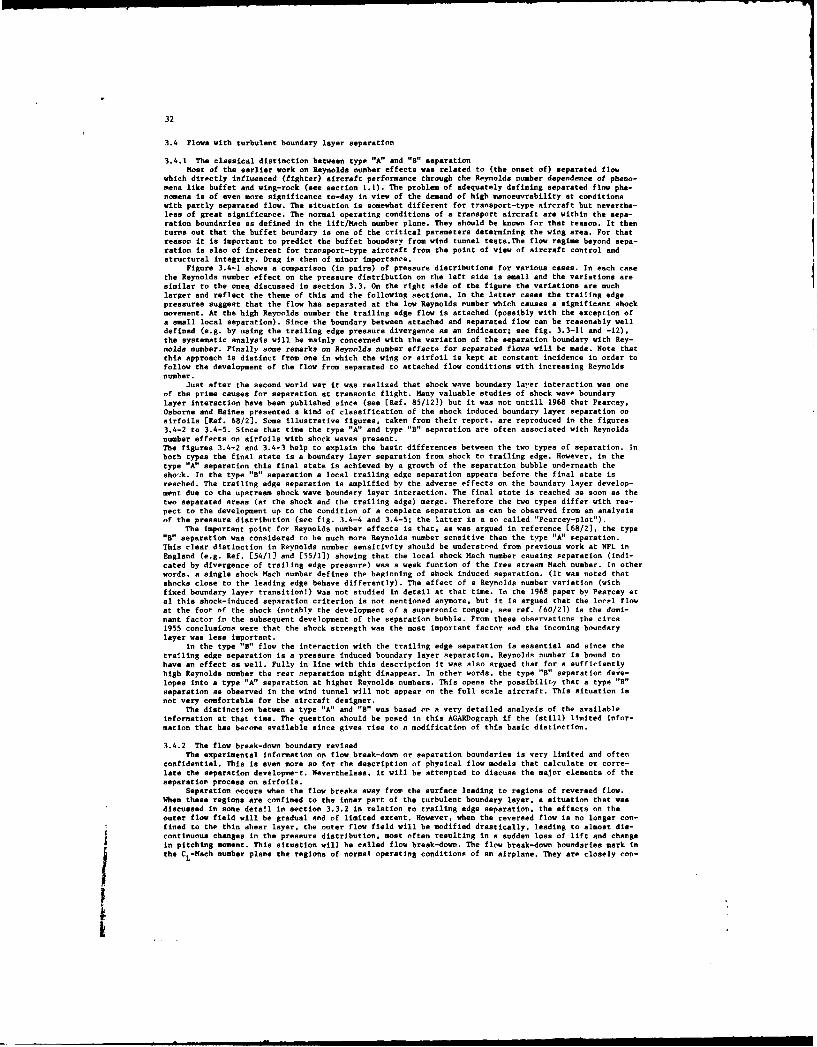
32
3.4 Flows with turbulent boundary layer separation
3.4.1 The classical distinction between type "A" and "B" separationMost of the earlier work on Reynolds number effects was related to (the onset of) separated flow
which directly influenced (fighter) aircraft performance through the Reynolds number dependence of pheno-mena like buffet and wing-rock (see section 1.1). The problem of adequately defining separated flow phe-nomena is of even more significance to-day in view of the demand of high manoeuvrability at conditionswith partly separated flow. The situation is somewhat different for transport-type aircraft but neverthe-less of great significarce. The normal operating conditions of a transport aircraft are within the sepa-ration boundaries as defined in the lift/Mach number plane. They should be known for that reason. It thenturns out that the buffet boundary is one of the critical parameters determining the wing area. For thatreason it is important to predict the buffet boundary from wind tunnel tests.The flow regime beyond sepa-ration is also of interest for transport-type aircraft from the point of view of aircraft control andstructural integrity. Drag is then of minor importance.
Figure 3.4-1 shows a comparison (in pairs) of pressure distributions for various cases. In each casethe Reynolds number effect on the pressure distribution on the left side is small and the variations aresimilar to the ones discussed in section 3.3. On the right side of the figure the variations are muchlarger and reflect the theme of this and the following sections. In the latter cases the trailing edgepressures suggest that the flow has separated at the low Reynolds number which causes a significant shockmovement. At the high Reynolds number the trailing edge flow is attached (possibly with the exception ofa small local separation). Since the boundary between attached and separated flow can be reasonably welldefined (e.g. by using the trailing edge pressure divergence as an indicator; see fig. 3.3-11 and -12),the systematic analysis will be mainly concerned with the variation of the separation boundary with Rey-nolds number. Finally some remarks on Reynolds number effects for separated flows will be made. Note thatthis approach is distinct from one in which the wing or airfoil is kept at constant incidence in order tofollow the development of the flow from separated to attached flow conditions with increasing Reynoldsnumber.
Just after the second world war it was realized that shock wave boundary layer interaction was oneof the prime causes for separation at transonic flight. Many valuable studies of shock wave boundarylayer interaction have been published since (see [Ref. 85/12)) but it was not untill 1968 that Pearcey,Osborne and Raines presented a kind of classification of the shock induced boundary layer separation onairfoils [Ref. 68/2). Some illustrative figures, taken from their report, are reproduced in the figures3.4-2 to 3.4-5. Since that time the type "A" and type "B" separation are often associated with Reynoldsnumber effects on airfoils with shock waves present.The figures 3.4-2 and 3.4-3 help to explain the basic differences between the two types of separation. Inboth types the final state is a boundary layer separation from shock to trailing edge. However, in thetype "A" separation this final state is achieved by a growth of the separation bubble underneath theshosk. In the type "B" separation a local trailing edge separation appears before the final state isreached. The trailing edge separation is amplified by the adverse effects on the boundary layer develop-ment due to the upstream shock wave boundary layer interaction. The final state is reached as soon as thetwo separated areas (at the shock and the trailing edge) merge. Therefore the two types differ with res-pect to the development up to the condition of a complete separation as can be observed from an analysisof the pressure distribution (see fig. 3.4-4 and 3.4-5; the latter is a no called "Pearcey-plot").
The important point for Reynolds number effects is that, as was argued in reference 168/2), the type"B" separation was considered to be much more Reynolds number sensitive than the type "A" separation.This clear distinction in Reynolds number sensitivity should be understood from previous work at NFL inEngland (e.g. Ref. (54/1) and (55/1)) showing that the local shock Mach number causing separation (indi-cated by divergence of trailing edge pressure) was a weak funtion of the free stream Mach number. In otherwords, a single shock Mach number defines the beginning of shock induced separation. (It was noted thatshocks close to the leading edge behave differently). The effect of a Reynolds number varlation (withfixed boundary layer transition!) was not studied in detail at that time. In the 1968 paper by Pearcey atal this shock-induced separation criterion is not mentioned anymore, but it is argued that the local flowat the foot of the shock (notably the development of a supersonic tongue, see ref. (60/2)) is the domi-nant factor in the subsequent development of the separation bubble. From these observations the circa1955 conclusions were that the shock strength was the most important factor and the incoming boundarylayer was less important.
In the type "B" flow the interaction with the trailing edge separation is essential and since thetrailing edge separation is a pressure induced boundary layer separation, Reynolds number is bound tohave an effect as well. Fully in line with this description it was also argued that for a sufficientlyhigh Reynolds number the rear separation might disappear. In other words, the type "B" separation deve-lopes into a type "A" separation at highet Reynolds numbers. This opens the possibility that a type "B"separation as observed in the wind tunnel will not appear on the full scale aircraft. This situation isnot very comfortable for the aircraft designer.
The distinction betwen a type "A" and "B" was based on a very detailed analysis of the availableinformation at that time. The question should be posed in this AGARDograph if the (still) limited infor-mation that has become available since gives rise to a modification of this basic distinction.
3.4.2 The flow break-down boundary revisedThe experimental information on flow break-down or separation boundaries is very limited and often
confidential. This is even more so for the description of physical flow models that calculate or corre-late the separation developme-t. Nevertheless, it will be attempted to discuss the major elements of theseparation process on airfoils.
Separation occurs when the flow breaks sway from the surface leading to regions of reversed flow.When these regions are confined to the inner part of the turbulent boundary layer, a situation that was
* discussed in some detail in section 3.3.2 in relation to trailing edge separation, the effects on theouter flow field will be gradual and of limited extent. However, when the reversed flow is no longer con-fined to the thin shear layer, the outer flow field will be modified drastically, leading to almost dis-* continuous changes in the pressure distribution, most often resulting in a sudden loss of lift and change
in p mtchingmoment. This situation will be called flow break-down. The flow break-down boundaries mark inthe C L-Mach number plane the regions of normal operating conditions of an airplane. They are closely con-
co tuu hne ntepesr itiuin ot fe eutn nasde oso itadcag

33
nected with, but not necessarily identical to the buffet and maximum lift boundaries. Various definitionsare In use like a kink in the CL-a curve, a break in pitching moment or tangential force development, ora rapid divergence of trailing edge pressure.In the transonic regime the flow break-down boundary of particular interest involves shock induced sepa-ration from shock to trailing edge. In this kind of flow the distinction has been made in the past be-tween type "A" and "B" separation as discussed before. Separation at the foot of the shock and/or trai-ling edge separation are the main elements in this process of flow break-down.
The length of the separation bubble L underneath the shock can be written as:
L sep,shock/c - f {Mshock , , Rec , H sh (O/c)sh, press. distr... . (Ia)
whereas the trailing edge separation can be described as:
Lsept,TE/c = g {Rec,. HTE (O/c)TE, press. distr.... I (Ib)
Flow break-down is defined as the condition at which the separated boundary layer underneath the shockfails to re-attach to the airfoil surface (type "A"):
Lsepshock/C a I - xsh/C (TIa)
or when the shock bubble and trailing edge separation merge (type "B"):
(Lsepshock +Lsep, T)/C ? I - Xsh/0 (Ilb)
The expressions I and II constitute a general flow break-down criterion although much more simplified ex-pression are actually used. Fundamental studies (e.g. see [Ref. 85/12]) indicate that the upstream shockMach number for the start of separation (incipient separation) is a very weak function of the upstreamboundary layer shape factor H and for that reason almost Reynolds number independent. In the 1950's asingle correlation, based on shock strength (and hence Reynolds number independent) was used to defineflow break-down (fig. 3.4-6 taken from Ref. [55/11). Also more recently simple correlations can be foundin the literature to define flow break-down that make use of a critical shock Mach number without address-ing the Reynolds number dependence explicitly (fig. 3.4-7 taken from Ref. [82/3] and also [Ref. 81/3)).In the mean time other fundamental studies (e.g. Ref. [67/1), [78/31 and [81/1) do indicate a Reynoldsnumber dependence as also discussed in the report of the Research Committee of AGARD WG-09 [Ref. 00/i].Unpublished (and independent) studies from NLR and ARA suggest a correlation for the separation boundarywith M and 0o /c as the dominan/garameters. This correlation does reflect a Reynolds number depen-dence sc (/c)evare roughly as Re- . More recently Fulker and Ashill [85/4) have published verydetailed studies on the separation length in connection with flow break-down. In their correlation theseparation length 1 /0 is expressed as a function of Re0 hk (though weakly) and the shockMac nubr(i. o!S 5e s~fc hK suMach number (fig. separation length exceeds a criticAls vaue, dependent on the pressuredistribution, the boundary layer will not re-attach and the separation boundary is reached. This mostrecent correlation for flow break-down by Fulker and Ashill can be represented schematically:
Lsepshock/C + Xshock/c a (X/C)critical (lIe)
where (x/c),r tical depends on the pressure distribution and hence the airfoil type.
Many criteria can be found in the literature to described the more classical type of pressure inducedtrailing edge separation [Ref. 00/11. Just one of these expressions is reproduced here (from Ref. [72/53)to illustrate a fundamental Reynolds number dependency through the influence on 0:
(/)TE) .d cp/d x/c a . 007 (III)
The situation is, unfortunately, more complex than this simple correlation seems to indicate. The separa-tion onset and the separation length can, from a fundamental point of view, only be calculated from asimultaneous solution of the boundary layer and the outer flow equations since the development of the(thick) boundary layer close to separation provides a relief in the external flow pressure gradient thatcounteracts the separation development. Moreover, the boundary layer conditions at the trailing edge willdepend on the upstream history with shock wave boundary layer interaction as a complicating factor.
How do the various types of separation interact with each other? It is to be expected that prior toincipient separation at the foot of the shock (for shock Mach numbers less than roughly 1.3) trailingedge separation is the dominant phenomenon. Such situations might occur at low lift values for Machnumbers close to and beyond the design Mach number. The Reynolds number dependence enters into a directway, in a way similar to expression I1.
When the shock Mach number is higher than 1.3 a local bubble at the foot of the shock will be for-med. The extent of this separation will be Reynolds number dependent in a direct way as suggested withexpression I.e. The most recent work of Fulker and Ashill has shown that the over-ruling factor for thecondition of flow break-down appears to be the growth of the separation bubble underneath the shock, ir-respective of a possible trailing-edge separation (expression Il-c). This, however, does not mean thattrailing edge separation is not important at all. Trailing edge separat-on will modify the pressure dis-tribution in a Reynolds number dependent way. This indirect Reynolds number effect, as discussed extensi-vely in section 3.3. will alter the shock strength and hence the conditions for the separation at thefoot of the shock. This In turn will influence the conditions of the boundary layer at the trailing edge.This interaction can be very significant in view of the sensitivity of the length of the separation bubbleunderneath the shock for the shock Mach number (fig. 3.4-8). The final result of this interaction processfrom the point of view of Reynolds number sensitivity will depend very much on the pressure distributionand hence the type of airfoil. Fulker and Ashill noted already the importance of the type of pressuredistribution for their evaluation. Most airfoils from before the 1960's show a rapid increase in shock
*

34
strength with increasing Mach number or angle of attack. Viscous effects were small, unless the Reynoldsnumber was very low. For modern supercritical airfoils the variation in shock wave strength has been re-stricted through design. Rear loading has increased the pressure gradients over the rear of the airfoil.Viscous effects and hence the indirect Reynolds number effects, will be much more important for theseairfoils. It is therefore to be expected that the flow break-down boundary will also be more sensitive toReynolds number, as compared with the airfoils of the 1950's.
Since the trailing edge separation appears to be only of importance for the (gradual) indirect Rey-nolds number effects, the original distinction between type "A" and "B" flow might be less relevant forthe flow break-down boundary. This is illustrated very schematically in figure 3.4-9. The distinctionwill still be very relevant prior to flow break-down for the evaluation of drag and pitching moment asdiscussed in section 3.3. For the flow break-down boundary the Reynolds number sensitivity might verywell depend primarily on the airfoil type rather then the particular Reynolds number range.
This view appears to be supported by the experimental information as far as available to the author.The figures 3.4-10 till 3.4-14 show some examples of the variation of the flow break-down boundary withReynolds number. All results are related to modern supercritical airfoils (some of them discussed above).In figure 3.4-10 Reynolds number trends for various models of the same airfoil measured in various windtunnels are compared (Ref. 82/4, 83/103. Note that although the absolute values are very much different,the variations with Reynolds number are very similar. In figure 3.4-11 the Reynolds number trend for oneairfoil is presented for a range of Mach numbers. The figure depicts the importance of transition fixa-tion in the analysis of the separation boundary as discussed in section 3.2. Also. some increase in Rey-nolds number dependence can be noted for higher Mach numbers. Figure 3.4-12 compares various airfoils fora typical transonic design Mach number. Apart from some variation in Reynolds number dependence, all mo-dels, including the three dimensional model "C" (a high aspect ratio transport-type wing) indicate a re-gular variation of CL-max with Reynolds number.
None of the results show a tendency to level off at higher Reynolds numbers (with a possible excep-tion of the Mach - .6 data in fig. 3.4-11; for that condition the shock is close to the leading edge).This is also supported for some of these airfoils by figure 3.4-13 in which the shock Mach number at flowbreak-down and for a constant shock position has been plotted versus Reynolds number. Again, a very regu-lar trend is found. In a last example (figure 3.4-14 taken from Ref. [85/2]) the pressure distributionsof a three-dimensional high aspect ratio wing (the one discussed in Ref. [76/1]) were analyzed in orderto classify the separation as a function of Mach and Reynolds number. Also in that case no change fromtype "B" to type "A" separation was actually observed although such a change was tentatively indicated inthe figure.
From the design point of view it might be reassuring to know that no discontinuous changes in thedevelopment of the flow break-down boundary with Reynolds number are to be expected. However, clearlymore research is required to substantiate this view. Also there will be limits imposed by the "inviscidlimit" of the outer flow field and surface roughness effects that render the boundary layer developmentReynolds number independent.
3.4.3 Post stall behaviourOnly very limited information is available with respect to Reynolds number effects beyond separa-
tdon. The problem is nevertheless of considerable importance for stability and control and for the deter-mination of aerodynamic loads. One extreme appears to be very well defined: a flow that is separated alonga salient edge is independent of Reynolds number. But for pressure gradient or shock induced separationson the smooth surface of an airfoil contour, the Reynolds number will have a strong influence on the sepa-ration position and hence the dimensions of the separated flow field. For a good understanding of theproblem it is essential to allow for the interaction between the viscous flow and the non-viscid outerflow. Moreover, the complete flow field is often highly unsteady and essentially three-dimensional, evenfor two-dimensional airfoils. A sound theoretical treatment seems therefore beyond the present capabili-ties.
Nevertheless, for conditions not too far away from the flow break-down boundary, there appears to bea more or less systematic development of the separation. Cahill (Ref. 79/1] has presented a method toextrapolate pressure distributions with flow separation as measured in the wind tunnel to flight Reynoldsnumbers. The procedure is based on the observation that the relations between trailing edge pressure onthe one hand and a viscous flow parameter ("B3") and shock position on the other hand, preserve theirshape, Independent of Reynolds number. Moreover, the trends with Reynolds number appear to be rather gene-ral. The principle of the method is shown schematically in figure 3.4-15 and a typical example of a socorrected pressure distribution is presented in figure 3.4-16. In a later publication [Ref. 83/1] thepurely empirical viscous shock parameter "Bh" has been replaced by a physically more meaningful parameterdefined by:
(Ma
K- s v - Ith t =
/2
that follows from asymptotic theory for shock wave boundary layer interaction. With this parameter thecorrelation improved slightly. The method is reported to be primarily used for the prediction of aerody-namic loads.
For the same class of flows as described by Cahill's correlation it might very well be possible(under certain restrictions of tunnel Reynolds number, shock position and the three-dimensionality of theflow) to simulate in the wind tunnel the high Reynolds number flow with the help of the so called aft-fixation technique. This technique will be discussed very shortly in section 3.6.
IIIIII

35
RE-EFFECT: ONE AIRCRAFT
(a) TYPE A AT EXPANDING BUBBLE STAGE
CP C
sIs±
! .,pfITP IlA AL TG WT OAIE OG, 10 ,*,,,10 01 ,*S ,, ,*, (2(TLTE TG WT N SPRTO
~~~RE-EFFECT : TOE WTPE 2)
I M>I M<I
(fo ref. 68/2)
REBEGFNAL MOE A I MABDAET OF ) ALIAIE OEL
" o| ........ ',Is) TYPE B ( I I AT EARLY STAGE WITH LOCALISED SHOCK
BU R wD TLE AN REAR SPARATION
.Aa T (2 REAT LATER STAGE WITH ONE SEPARATIONEXTENDING FROM SHOCK T TRAILING EDGERE-EFFECT : TWO TYPES (?
Fig. 3.4-1 Observed Reynolds number effects: Fig. 3.4-2 Some details (schematic) of the re-
before and after the separation boun- gion of interaction between turbu-
dary ( from vaiousa souzrces) lent boundary layer and shock wave
(fron ref. 68/2)
ORIGINAL MODEL, A VARIANTS OF ALTERNATIVE MODEL. B
IONLY REARWARD GROWTH Of ISUBBLEI (APPLICABLE WHEN REAR SEPARATION IS INCIPIENT OR PRESENT)
12 3
REAR SEPARATION REAR SE ARATION REAR SEPARATIONPROVOKED BY 'WOOEO BY ALREADY PRESENT
BSBBLE SHOCK ITSELF
I1 INTERACTION Is) INTERACTION I.) INTERACTION (b) INTERACTION
WITH BUBBLE WITH SHOCK WITH BUBBLE WITH SHOCK
BUBL AZ e FOO OF CE- J REAR BEPARATION IN DOWNSTREAM PRESSURE GRADIENT
[ SEPARATION FROM fIOCK TO TRAILING EDGE% FIRT OIVEBOENCE IN TRIAILLINO-OGE PRtWE IFIRST EFFECT ON CIRCULATION,SR RAPIO DIVBRGBNCE IN TRAILING-EDE PRERB (MA PEFFECI ON CIRCULATIONI
Fig. 3.4-3 Claaaification of Separation development accorling to type "A" and "a"separation (from ret. 66/2)

36.
TYE""A -1.8 108 For each configration tset,5 an unfilled symbol has been
-1. TRANSITION FIXED FI,a Mahnmbr
-1.2 t h wih hnok epa1.3T -- ration and afilled svnibol
to indicate the lowest local0.1 '0 74 o,-.04Mach numnber observed
QB with separationQ4 - IcLOCAL
-- * MACH 4 1s TESTS ON 10% RAE 1030No. M, &PLAIN
v FLAP DEFLECTED1.32 91WITH SPOILERS
0.85 M 04 4 WITH SPOILERS AND1.30 - WITH FLAP DEF LECTED
: 10% RAE 10401 2 3 4
06 0G 6 % RAE 104
1 11.3 28 ALUE OFI M, -A vFOR SEPARATION
___TYPE_____ ____ 1.24 -4 - 0
011A
07.
As1
0.8 6E
i~e. . .. . .I1.12~
0 /C t.0 0.6 0.7 0.6 0.9 1.0
Pig.3.4 Deelopentof resore ietibuionFREE STREAM MACH NO0. M0Fig 3.-4 eveopmnt f pessre istibuion Fig. 3.4-6 Early correlation of the shock-up-
for type "A" end "8" separations stream Mach nomber to cause separa-(from ref. 58/2) tion (from ref. 55/1)
-0.5 -0. TYP "B" FIRST INFLUENC E OFTYPE "A" TYPE "8" SEPARATION AT
FIRST INFLUENCE OF "CsSHOC-NUCED1
-0.3 -0.
-0.2--2
X 2
0.4~ ~~~~ ~~~~~ 0. 33 , 07 08 0504 . . . . .-0.1
Wi. .4580Celd Par~yp~t" o itigoih eten yp A"en 3'searaio (fX re. C52

37
C1
bb
x a MoN .6751.2 , TRANSITION REGION
a CL p~NOTE: SEPARATION ONSET 10URLENT Ct nux
z DEFINED BY TRAILING-EDGE T"a
oPRESSURE DIVERGENCE 1. -TUBL
0.8 BUFFT ONSET0.80
SHOCK POSITION, X/c
Fig. 3.4-7 A more recent correlation of the 1.0shock-upstream Mach number to cause CL
separation (from ref. 82/3)0.5-
0.6 07
EsA8t.EOSESCEC"SRCE NSo~t - ng ataMAXIMUM LIFT
0 A Auntd data 0.4tag o o8-6 LAMINAR INTERACTION
we. 0 -O TURBULENT INTERACTION
me ----- 0.2 -1UFFETONSETIt *---# LAMINAR INTERACTION
3" A-- TURBULENT INTERACTION- pt . 5 I
IS2 3 6 10 20 30 Rex 10
130 12* Fig. 3.4-11 Observed variation of Maximus lift
@las .3 I95 I for one model at various Mach nus-
R-8..KoO hers (unpublished results of 81.8)
Fig. 3.4-8 Fulker and Ashill's shock-bubblecorrelation
NOT*e EARATION TESPAR-TION L[I EIXINEART'
SIPRET 0IOANORY --- Ln
-- ' AlEC.61- MODEL "A" (HST)
S.ROWE E
-Lf
NEARATI0N EEEWAI"N weEARTO CAST 10-2 ICFFICRITERWCRITERION6
WMEPLEFIEE '* MEIASVIEW RESENT - TENTATIVE- VIEW
Fig. 3.4-9 Itypothetical models to describe the
Reyntolds number sensitivity of the .6
as5sdttxia 4 -MODELB"IPT/CFF)
A' TWBI0 "a il.X0o ARA 1
WTU-B 0.75 6 " dlIP~~c.2 ~aw mOOEL C' 1145TI STN3o STN4E STNSO
2IF~a~c~t2mnt .70Holf filled sWiliestN Nate: Few T2 the tfee-agream
dweorodwMach faimbsr is td.01S4 Me .75fl~
fleible mal data Q i a aua amtmRe1-
CAS-?10 2 5 107
% e2 2L 4 tO 20
Fg3.-0Observed variation of maximum lift Fig. 3.4-12 Reynolds number effect on maximum
nels (from ref. 83/10) Macb number (unpublished results of

38
-~20 NUMBER. 10-
1.34.. CORRECTION FORlSWEEP EFFECT
CLS A FLOMsh
Is - A*MODEL "B"
1. . MODEL 'E2 I
o STNJ4 I/NOTATION: X EXPERIMENTa STNS 5 MODEL C"SEPARATION
A STN 6 ICLASS El LO
.1 CORRECTED M, M, 006t\ XX I
22.1 ), = .40 ofISnod CLASS 92FLW
Fg3.13Shock-upatreem Mach number at maxi- Fig. 3.4-14 Tentative and actually observedsun lift asafncino Ryod types of flow separation (from ref.number for a fixed shock location 85/2)(unpublished results of NLR)
CURVES SHIFT WITH Re Me...CONSTANT CPTE FROM
ACCORDING TO® CPTE FRROM@ES
@ A @ OIVES XCSH GIE
-CPTE 6 CPTE p
N - I 1 1/. XCSH CCPTEO je
0 WINO TUNNEL MEASUREMENTS" UNIVERSAL" VALID a 0 --- EXTRAPOLATES
(1) FROM W/T TEST WITH Mj7 CONSTANT
LEEol8/2 Pf VM- A WITH Po - FREE STREAM STATIC PRESSURE91/2 -XS Pp -PRESSURE IN FRONT OF SHOCK
CPTE - TRAILING ROGE PRESSURE A -EMPIRICAL CONSTANTXCSH - SHOCK LOCATION IS/C) M.- FRAEE STREAM MACH NUMBER
Fig. 3.4-16 Examples Of extrapolated pressure distributions accordingto the method of ref. 79/1
C-141 -1.2 C--17-193 M.BS 11 13 M- RS
EXTRA4POLATE
SHOCK
00
-. 2 0 1 -. 2 - LIH
0
.4 .6 XC 8 o 0U
Fi. 3.-1 Prnil Ishmtc fteetrplto rcdrfo prssr ditrbtin wihfo eprto fomrf 9
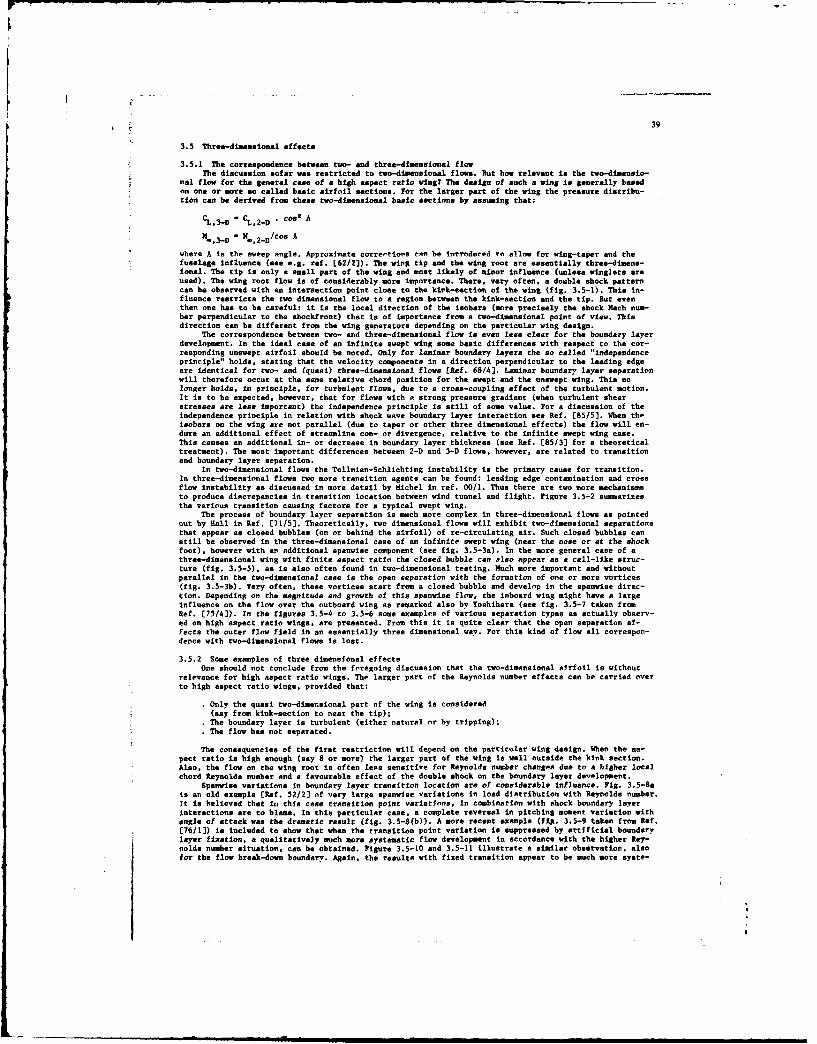
39
3.5 Three-dimensional effects
3.5.1 The correspondence between two- and three-dimensional flowThe discussion sofar was restricted to two-dimensional flows, Rut how relevant is the two-dimensio-
nal flow for the general case of a high aspect ratio wing? The design of such a wing is generally basedon one or more so called basic airfoil sections. For the larger part of the wing the pressure distribu-tion can be derived frmu these two-dimensional basic sections by assuming that:
- CL,2_D . cos' A
-,3-D -,2-D/co A
where A Is the sweep angle. Approximate corrertions can be introduced to allow for wing-taper and thefuselage influence (see e.g. ref. L62/2]). The wing tip and the wing root are essentially three-dimens-ional. The tip is only a small part of the wing and most likely of minor influence (unless winglets areused). The wing root flow is of considerably more importance. There. very often, a double shock patterncan be observed with an intersection point close to the kink-section of the wing (fig. 3.5-1). This in-fluence restricts the two dimensional flow to a region between the kink-section and the tip. But eventhen one has to be careful: it is the local direction of the isobars (more precisely the shock Mach num-bar perpendicular to the shockfront) that is of importance from a two-dimensional point of view. Thisdirection can be different frosm the wing generators depending on the particular wing design.
The correspondence between two- and three-dimensional flow is even lees clear for the boundary layerdevelopment. In the ideal case of an infinite swept wing some basic differences with respect to the cor-responding unswept airfoil should be noted. Only for laninar boundary layers the so called "independenceprinciple" holds, stating that the velocity components in a direction perpendicular to the leading edgeare identical for two- and (quasi) three-dimensional flows [Ref. 68/42. Laminar boundary layer separationwill therefore occur at the same relative chord position for the swept and the unswept wing. This nolonger holds, in principle, for turbulent flows, due to a cross-coupling effect of the turbulent motion.It is to be expected, however, that for flows with a strong pressure gradient (when turbulent shearstresses are less important) the independence principle is still of some value. For a discussion of theindependence principle in relation with shock wave boundary layer interaction see Ref. (85/5]. When theisobars on the wing are not parallel (due to taper or other three dimensional effects) the flow will en-dure an additional effect of streamline con- or divergence, relative to the infinite swept wing case.This causes an additional in- or decrease in boundary layer thickness (see Ref. [85/3] for a theoreticaltreatment). The most important differences between 2-D and 3-D flows, however, are related to transitionand boundary layer separation.
In two-dimensional flows the Tollmien-Schlichting instability is the primary cause for transition.In three-dimensional flows two more transition agents can be found: leading edge contamination and crossflow instability as discussed in more detail by Michel in ref. 00/1. Thus there are two more mechanismsto produce discrepancies in transition location between wind tunnel and flight. Figure 3.5-2 summarizesthe various transition causing factors for a typical swept wing.
The process of boundary layer separation is much more complex in three-dimensional flows as pointedout by nall in Ref. [71/51. Theoretically. two dimensional flows will exhibit two-dimensional separationsthat appear as closed bubbles (on or behind the airfoil) of re-circulating air. Such closed bubbles canstill be observed in the three-dimensional case of an infinite swept wing (near the nose or at the shockfoot), however with an additional spanwise component (see fig. 3.5-3a). In the more general case of athree-dimensional wing with finite aspect ratio the closed bubble can also appear as a cell-like struc-ture (fig. 3.5-5). as is also often found in two-dimensional testing. Much more important and withoutparallel in the two-dimensional case is the open separation with the formation of one or more vortices(fig. 3.5-3b). Very often, these vortices start from a closed bubble and develop in the spa wise direc-tion. Depending on the magnitude and growth of this spanwise flow, the inboard wing might have a largeinfluence on the flow over the outboard wing as remarked also by Yoshihara (see fig. 3.5-7 taken fromRef. [75/4)). In the figures 3.5-4 to 3.5-6 some examples of various separation types as actually observ-ed on high aspect ratio wings, are presented. From this it is quite clear that the open separation af-fects the outer flow field in an essentially three dimensional way. For this kind of flow all correspon-dence with two-dimensional flows is lost.
3.5.2 Some examples of three dimensional effectsOne should not conclude from the foregoing discussion that the two-dimensional airfoil is without
relevance for high aspect ratio wings. The larger part of the Reynolds number effects can be carried overto high aspect ratio wings, provided that:
. Only the quasi two-dimensional part of the wing is considered(say from kink-section to near the tip);The boundary layer is turbulent (either natural or by tripping);
• The flow has not separated.
The consequencies of the first restriction will depend on the particular wing design. When the as-pect ratio is high enough (say 8 or more) the larger part of the wing is well outside the kink section.Also. the flow on the wing root is often less sensitive for Reynolds number changes due to a higher localchord Reynolds number and a favourable effect of the double shock on the boundary layer development.
Spanwise variations in boundary layer transition location are of considerable influence. Fig. 3.5-8is an old example [Ref. 52/2) of very large spanwise variations in load distribution with Reynolds number.It is believed that in this case transition point variations, in combination with shock boundary layerinteractions are to blame. In this particular case, a complete reversal in pitching moment variation withangle of attack was the dramatic result (fig. 3.5-8(b)). A more recent example (fig. 3.5-9 taken from Ref.(76/1) is included to show that when the transition point variation is suppressed by artificial boundarelayer fixation, a qualitatively much more systematic flow development in accordance with the higher Rey-nolds number situation, can be obtained. Figure 3.5-10 and 3.5-11 illustrate a similar observation, alsofor the flow break-down boundary. Again, the results with fixed transition appear to be much more syste-

40
matic as compared with free transition. as discussed in section 3.2. It is even more important that thefixed transition results are similar to the two-dimensional data in figure 3.4-12, -13 (the model "C" inthese figures is the asme one as used for the results shown in figure 3.5-10 and -11). Also the corrals-tion between shock Mach number and Reynolds number at the flow break-down boundary is well in line withthe available two-dimensional date. Fulker and Ahill [Ref. 85/41 did not find a systematic difference intheir separation correlation between two- and three-dimensional results. The examples indicate that evenat the onset of flow separation the correspondence between two- and three-dimensional flows can be main-tained. However, in view of the essential three-dimensional nature of the separation itself, it is veryunlikely that this correspendance will still be found beyond the flow break-down boundary. The uncertain-ty with respect to Reynolds number effects for two-dimensional separated flows is more severe for three-dimensional configurations.
A word of caution should finally be expressed with respect to drag evaluation for a three-dimension-al configuration. The concern stems from the sensitivity of compressibility drag to small variations inshock wave strength and, for the three-dimensional case, the sweep angle of the shock. The shock wavepattern on s 3-il wng is basically determined by the 3-D inviscid flow development modified by local vis-cous effects. In reference (76/2] the risk of over- or under-fixation of the boundary layer for a highaspect ratio wing is discussed. It is argued that as a result of non-optimal fixation, the sweep-angle ofthe shock might be influenced (see figure 3.5-12) with serious effects on the overall flow field. Theimportant point to note here is that similar effects may be introduced by a Reynolds number variationwith fixed transition near the leading edge. The argument goes as follows. When the (corresponding 2-D)Reynolds number sensitivity of the inner and outer wing is significantly different (e.g. because one partof the wing is closer to separation) the sweep angle of the shock may change in this case due to a Rey-nolds number increase. When the sweep angle of the shock is increased (because the shock at the wing tipmoves faster downstream than the shock near the kink section) the effect on the overall flow developmentwill be favourable (because the Mach number component perpendicular to the shock decreases) and the Rey-nolds number sensitivity of the wing will increase, compared with the mean of the 2-D stations. When thekink-section is more critical, the reverse is true and the Reynolds number sensitivity will be reduced.Figure 3.5-13 (reported in Ref. 184/3]) further illustrates the importance of three-dimensional effectson the wave drag in relation to the total wing drag. In this figure an estimate of the wave drag contri-bution is depicted (note that the two shaded regions follow from different approximation to derive wavedrag from the wake rake traverses). At the lowest Reynolds number and highest lift the mid-wing region isjust beyond the local drag divergence boundary and experiences for that reason some increase in wave drag.For the other presented conditions (higher Reynolds number and lower lift) the wave drag contribution ismuch smaller with a modest variation over the span.
I TRANSITION FOLLOWLWING
GRAVILESo" EH
ATAIN '2LAIGEDECNAATOFLWE
EDGESTABILITY
A
O
E E O NFOLOW
FORW RD SHOCK
- ., J_
PO SSIBL Y BY R E - LA M IN A R IS A T IO N A
ROO R2 LEAD NG-EDGE CONTAMINATIONWE
RE BOAR SHOCK KT I R R P4 R
TRANSITION THROUGH ROTOLLMIEN-SCH LICHTINGT I INSTABILITY
~POSSIBLY BY RE-LAMINARIIATION AND TEN
TRANSITION THROUGH CTOLSLINSTLITN
CPANWSE SECTIONAL NOZZLE AT R4 TRANSITION FOLLOWS FROM CROSS-FLOWO I C ,N ANALOG INSTABILITY IF LEADING-EDGE CONTAMINATION
WERE ABSENT
Fig. 3.5-1 Schematic representation of three-di- Fig. 3.5-2 Example of different types of trenal-
meneioasl effects in the flow over a tim on a swept wing (from ref. 72/2)high aspect ratio wing (afterSlooff)
Lt
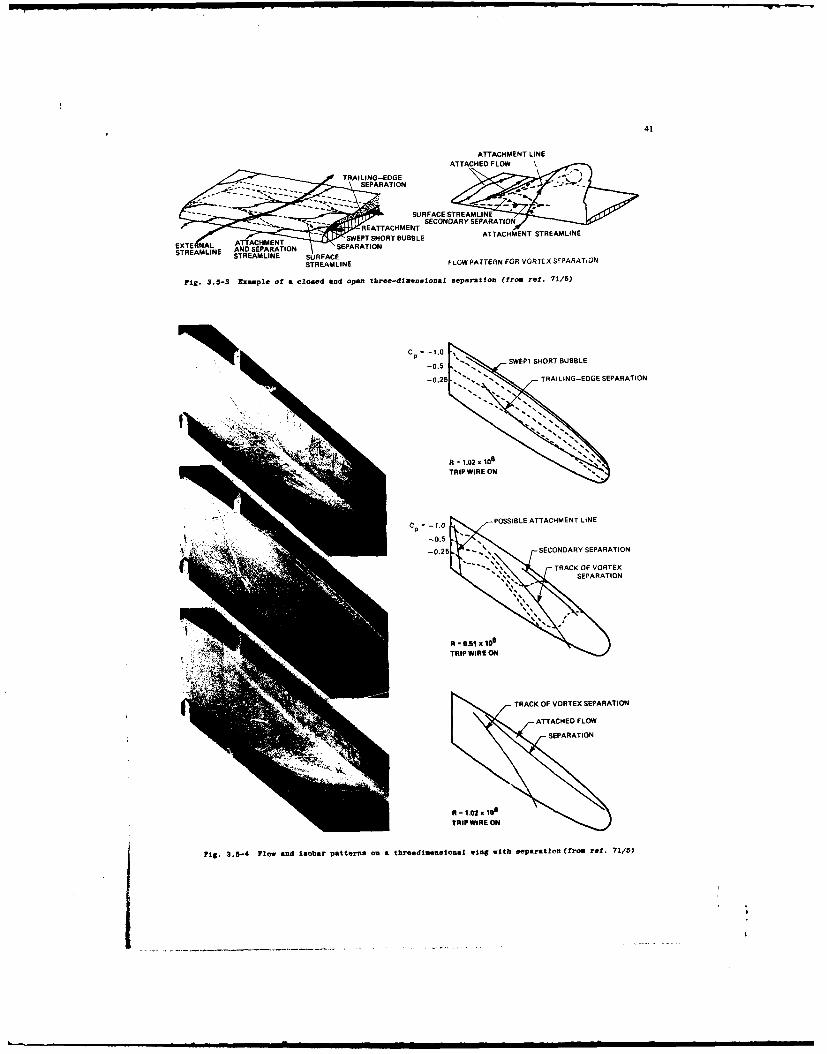
41
ATTACHMENT LINEATTACHED FLOW
TRAILING-EDGE /
SEPARATION -
SURFACE STREAMLINE
RETAHETSECONDARY SEPARVATIONr - " REATTACHMENT
ATTA SWEPT SHORT BUBBLE ATTACHMENT STREAMLINEETEAL AND SEPARATION SEPARATION
STEMIE STREAMLINE SURFACE
STREAMLINE FLOW PATTERN FOR VORTEX SPPARATION
Fig. 3.5-3 xauple of a closed and open three-dimensional separation (from ref. 71/5)
, Cp =-l.0
-°0 SWEPT SHORT BUBBLE
C"' . PSIBLE ATTACHMENT LINE
-0.25 -SECONDARY SEPARATION
- *-
SEODR S
PAR
TRACK OF VORTEX PRTO
S A RATTRIAPTIRO
-0
PO
SSIBLE ATTACHMENT
LINE
-0. - *.10
T0.2 RE ON EODRYSPRTO
TAKOVOTEX SFEPORTION
SEPARSARATIO
igt. 3.5-4 Fow and Isobar patterns on a threedmensional wng with separation (from rf. 71/5)
* ~ -
,w =,,,, m . -,mm l ImIll• m m~lB fim Illllll I I II S *
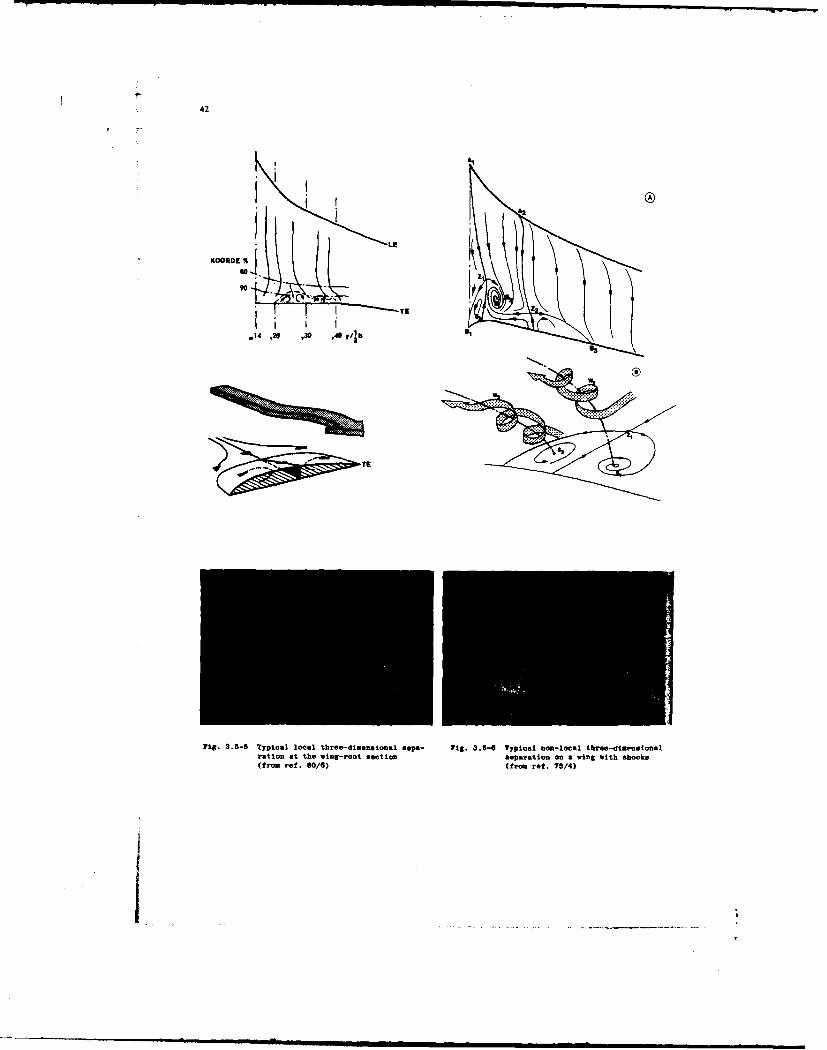
42
KOOR DE J4(EL
.14 .2D ,30 ,0 y~lb2
Fig. 3.5-5 Typical local three-dimenmional Mepa- Fig. 3.5-4 Typical non-local three-diamdionalration at the wing-root section separation on a wing with shocks(from ref. 80/6) (from, ref. 75/4)

43
FUSELAGE PREMURES 41.
NO" acivIEROSD
a) LEADING-EDGE TRIP
SH0CK AND SEPARATION PATTERN AT 4S' SWEEP.
9 v/A/E- 0.3 Ph0,75
VAOCK-INOOCED SEPARATIO1N cp SVVC-INDUCED SEPARATION 3
-4 b) FREE TRANSITION
4 5
P1.0
s~EiOCOSPRTO SO-INACED SEPARATION 4
F4T . .V 0.5 0.6 0.7 0. 09
0 c) MID TRIP
Fig. 3.5-7 Typical local three-dimensional sepa- Fig. 3.5-9 Example of spanwise variation ofration wilth spiraling vortices at trailing edge pressure divergence aathe wing root (from ref. 80/5) a function of Reynolds number with
aI'd w ithout boundary layer flxatio'(from ref. 76/1)
-0 a- gddqfoo
04 I 8 I I I4 %
Fig. 3.5-B Example of Reynolds aumber effect on the wing loading (from ref. 52/2)
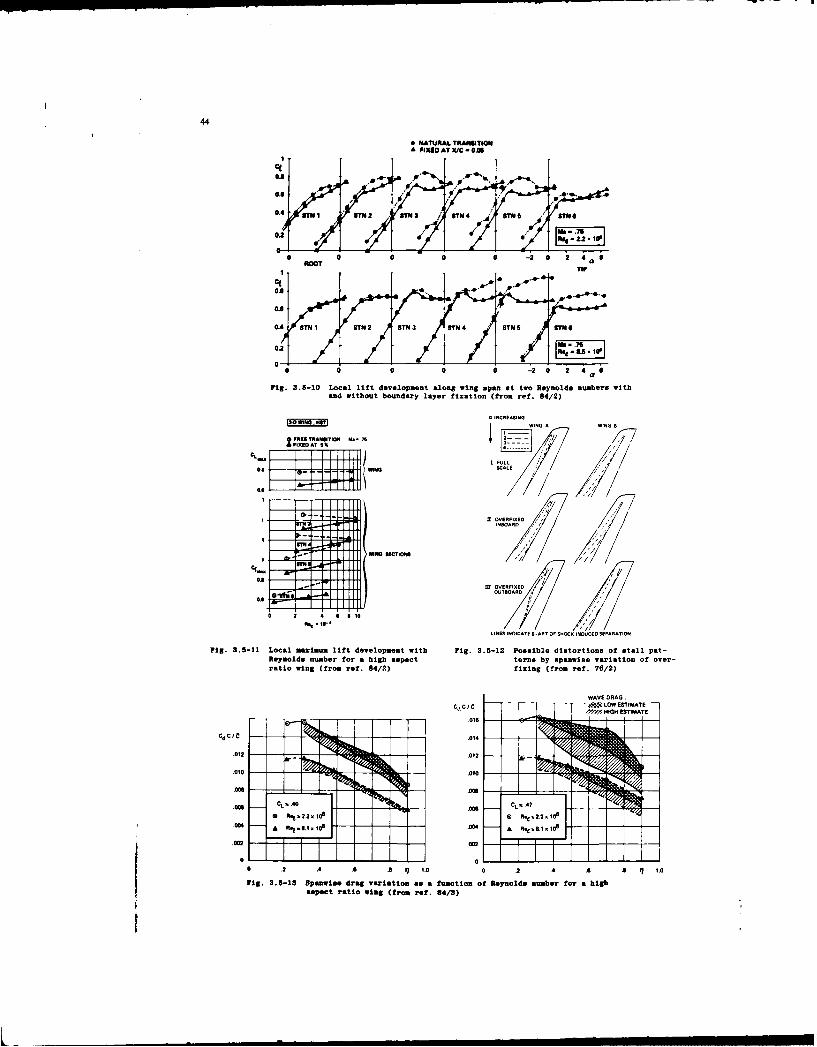
44
5 NATURAL TRANSITION& FIXED AT N/C 0.0
ROOT a1
0.4 MTNI STAII2 S-N)/ STN4 STN "TNo
Fig. 3.5-10 Local lift development along wing span at two Reynolds numbers withand without boundary layer fixation (from ref. 84/2)
a IN4CREASINGSO ING~ING A INING I
FEE T
ASIT
ION M-. 75 ~7CL_ I FULL
alSWALE
ff OVERFIXEO
I'
Si In OVERFIXEDOATBOARD
0 2 A C 55
LINES INDICATE S,ART OF SHOCK INDUCEOSEPARATION
Fig. 3.5-11 Local maximum lift development with Fig. 3.5-12 Possible distortions of stall pat-Reynolds number forta high aspect terns by spaflaise variation of over-ratio wing (from ref. 84/2) fixing (from ref. 76/2)
.012-.1
.. 01
AI -- DIG
Is .,,2.2;I0 0 R.2 .. .108
aspec rai win (fomrf.84D
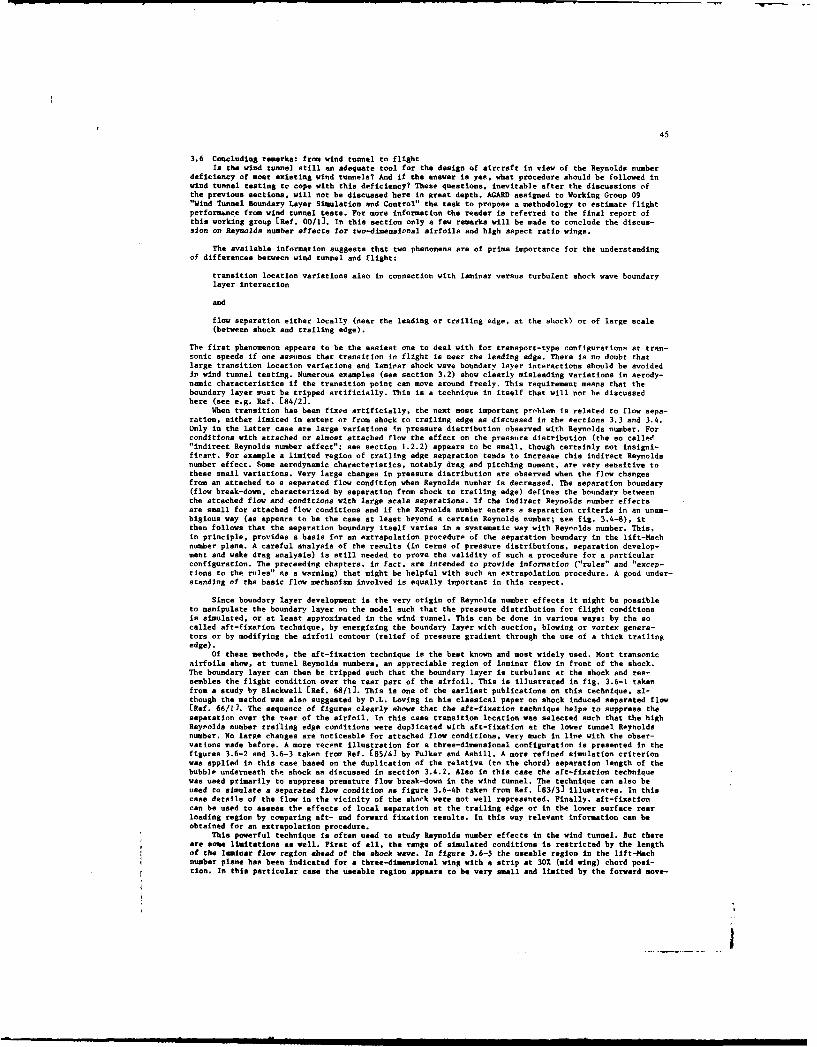
45
3.6 Concluding remarks: from wind tunnel to flightIs the wind tunnel still an adequate tool for the design of aircraft in view of the Reynolds number
deficiency of most existing wind tunnels? And if the answer is yes, what procedure should be followed inwind tunnel testing to cope with this deficiency? These questions, inevitable after the discussions ofthe previous sections, will not be discussed here in great depth. AGARD assigned to Working Group 09"Wind Tunnel Boundary Layer Simulation and Control" the task to propose a methodology to estimate flightperformknce from wind tunnel tests. For more information the reader is referred to the final report ofthis working group [Ref. 00/I. In this section only a few remarks will be made to conclude the discus-sion on Reynolds number effects for two-dimensional airfoils and high aspect ratio wings.
The available information suggests that two phenomena are of prime importance for the understandingof differences between wind tunnel and flight:
transition location variations also in connection with lamainar versus turbulent shock wave boundarylayer interaction
and
flow separation either locally (near the leading or trailing edge, at the shock) or of large scale(between shock and trailing edge).
The first phenomenon appears to be the easiest one to deal with for transport-type configurations at tran-sonic speeds if one assumes that transition in flight is near the leading edge. There is no doubt thatlarge transition location variations and laminar shock wave boundary layer interactions should be avoidedin wind tunnel testing. Numerous examples (see section 3.2) show clearly misleading variations in aerody-namic characteristics if the transition point can move around freely. This requirement means that theboundary layer rust be tripped artificially. This is a technique in itself that will not be discussedhere (see e.g. Ref. £84/2).
When transition has been fixea artificially, the next most important prnblem is related to flow sepa-ration. either limited in extent or from shock to trailing edge as discussed in the sections 3.3 and 3.4.Only in the latter case are large variations in pressure distribution observed with Reynolds number. Forconditions with attached or almost attached flow the effect on the pressure distribution (the so called"indirect Reynolds number effect"; see section 1.2.2) appears to be small, though certainly not insigni-ficant. For example a limited region of trailing edge separation tends to increase this indirect Reynoldsnumber effect. Some aerodynamic characteristics, notably drag and pitching moment, are very sensitive tothese small variations. Very large changes in pressure distribution are observed when the flow changesfrom an attached to a separated flow condition when Reynolds number is decreased. The separation boundary(flow break-down, characterized by separation from shock to trailing edge) defines the boundary betweenthe attached flow and conditions with large scale separations. If the indirect Reynolds number effectsare small for attached flow conditions and if the Reynolds number enters a separation criteria in an unam-bigious way (as appears to be the case at least beyond a certain Reynolds number; see fig. 3.4-8), itthen follows that the separation boundary itself varies in a systematic way with Reyrolds number. This,in principle, provides a basis for an extrapolation procedure of the separation boundary in the lift-Machnumber plane. A careful analysis of the results (in terms of pressure distributions, separation develop-ment and wake drag analysis) is still needed to prove the validity of such a procedure for a particularconfiguration. The preceeding chapters, in fact, are intended to provide information ("rules" and "excep-tions to the rules" as a warning) that might be helpful with such an extrapolation procedure. A good under-standing of the basic flow mechanism involved is equally important in this respect.
Since boundary layer development is the very origin of Reynolds number effects it might be possibleto manipulate the boundary layer on the model such that the pressure distribution for flight conditionsis simulated, or at least approximated in the wind tunnel. This can be done in various ways: by the socalled aft-fixation technique, by energizing the boundary layer with suction, blowing or vortex genera-tors or by modifying the airfoil contour (relief of pressure gradient through the use of a thick trailingedge).
Of these methods, the aft-fixation technique is the best known and most widely used. Most transonicairfoils show, at tunnel Reynolds numbers, an appreciable region of laminar flow in front of the shock.The boundary layer can then be tripped such that the boundary layer is turbulent at the shock and res-sembles the flight condition over the rear part of the airfoil. This is illustrated in fig. 3.6-1 takenfrom a study by Blackwell (Ref. 68/10. This is one of the earliest publications on this technique, al-though the method was also suggested by D.L. Loving in his classical paper on shock induced separated flow[Ref. 66/11. The sequence of figures clearly shows that the aft-fixation technique helps to suppress theseparation over the rear of the airfoil. In this case transition location was selected such that the highReynolds number trailing edge conditions were duplicated with aft-fixation at the lower tunnel Reynoldsnumber. No large changes are noticeable for attached flow conditions, very much in line with the obser-vations made before. A more recent illustration for a three-dimensional configuration is presented in thefigures 3.6-2 and 3.6-3 taken from Ref. (85/4] by Fulker and Ashill. A more refined simulation criterionwas applied in this case based on the duplication of the relative (to the chord) separation length of thebubble underneath the shock as discussed in section 3.4.2. Also in this case the aft-fixation techniquewas used primarily to suppress premature flow break-down in the wind tunnel. The technique can also beused to simulate a separated flow condition as figure 3.6-4b taken from Ref. (83/3) illustrates. In thiscase details of the flow in the vicinity of the shock were not well represented. Finally, aft-fixationcan be used to assess the effects of local separation at the trailing edge or in the lower surface rearloading region by comparing aft- and forward fixation results. In this way relevant information can beobtained for an extrapolation procedure.
This powerful technique is often used to study Reynolds number effects in the wind tunnel. But thereare some limitations as well. First of all, the range of simulated conditions is restricted by the lengthof the laminar flow region ahead of the shock wave. In figure 3.6-5 the useable region in the lift-Machnumber plane has been indicated for a three-dimensional wing with a strip at 301 (mid wing) chord posi-tion. In this particular case the useable region appears to be very small and limited by the forward move-
j
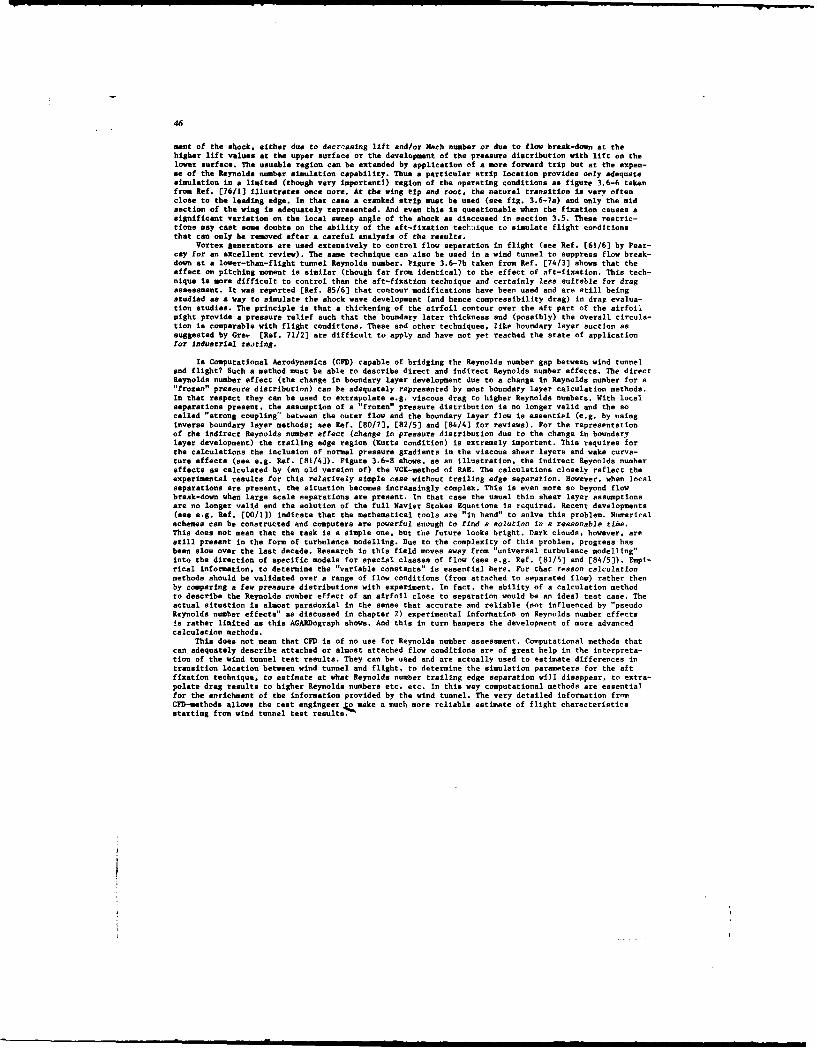
46
meet of the shock, either due to decreasing lift and/or Hah number or due to flow break-down at thehigher lift values at the upper surface or the development of the pressure distribution with lift on thelower surface, The usuable region can be extended by application of a more forward trip but at the expen-se of the Reynolds number simulation capability. Thus a particular strip location provides only adequatesimulation in a limited (though very importantl) region of the operating conditions as figure 3.6-6 takenfrom Ref. (76/1) illustrates once more. At the wing tip and root, the natural transition is very oftenclose to the leading edge. In that case a cranked strip must be used (see fig. 3.6-7a) and only the midsection of the wing is adequately represented. And even this is questionable when the fixation causes asignificant variation on the local sweep angle of the shock as diaccused in section 3.5. These restric-tions may cast some doubts on the ability of the aft-fixation tecli:tque to simulate flight conditionsthat can only be removed after a careful analysis of the results.
Vortex generators are used extensively to control flow separation in flight (see Ref. t61/6) by Pear-cey for an excellent review). The same technique can also be used in a wind tunnel to suppress flow break-down at a lower-than-flight tunnel Reynolds number. Figure 3.6-7b taken from Ref. [74/3] shows that theeffect on pitching moment is similar (though far from identical) to the effect of aft-fixation. This tech-nique is more difficult to control than the aft-fixation technique and certainly less suitable for dragassessment. It was reported [Ref. 85/63 that contour modifications have been used and are still beingstudied as a way to simulate the shock wave development (and hence compressibility drag) in drag evalua-tion studies. The principle is that a thickening of the airfoil contour over the aft part of the airfoilmight provide a pressure relief such that the boundary later thickness and (possibly) the overall circula-tion is comparable with flight conditions. These and other techniques, like boundary layer suction assuggested by Gret [Ref. 71/2] are difficult to apply and have not yet reached the state of applicationfor Industrial teating.
Is Computational Aerodynamics (CFD) capable of bridging the Reynolds number gap between wind tunneland flight? Such a method must be able to describe direct and indirect Reynolds number effects. The directReynolds number effect (the change in boundary layer development due to a change in Reynolds number for a"frozen" pressure distribution) can be adequately represented by most boundary layer calculation methods.In that respect they can be used to extrapolate e.g. viscous drag to higher Reynolds numbers. With localseparations present, the assumption of a "frozen" pressure distribution is no longer valid and the socalled "strong coupling" between the outer flow and the boundary layer flow is essentiPl (e.g. by usinginverse boundary layer methods; see Ref. [80/7, [82/5) and [84/4) for reviews). For the representationof the indirect Reynolds number effect (change in pressure distribution due to the change in boundarylayer development) the trailing edge region (Kutta condition) is extremely important. This requires forthe calculations the inclusion of normal pressure gradients in the viscous shear layers and wake curva-ture effects (see e.g. Ref. [81/4)). Figure 3.6-8 shows, as an illustration, the indirect Reynolds numbereffects as calculated by (an old version of) the VGl-method of RAE. The calculations closely reflect theexperimental results for this relatively simple case without trailing edge separation. However, when localseparations are present, the situation becomes increasingly complex. This is even more so beyond flowbreak-down when large scale separations are present. In that case the usual thin shear layer assumptionsare no longer valid and the solution of the full Navier Stokes Equations is required. Recent developments(see e.g. Ref. [00/1]) indicate that the mathematical tools are "in hand" to solve this problem. Numericalschemes can be constructed and computers are powerful enough to find a solution In a reasonable tie.This does not mean that the task is s simple one, but the future looks bright. Dark clouds, however, arestill present in the form of turbulence modelling. Due to the complexity of this problem, progress hasbeen slow over the last decade. Research in this field moves away from "universal turbulence modelling"into the direction of specific models for special classes of flow (see e.g. Ref. [81/5] and [84/5]). Empi-rical information, to determine the "variable constants" is essential here. For that reason calculationmethods should be validated over a range of flow conditions (from attached to separated flow) rather thenby comparing a few pressure distributions with experiment. In fact, the ability of a calculation methodto describe the Reynolds number effect of an airfoil close to separation would be an ideal test case. Theactual situation is almost paracoxial in the sense that accurate and reliable (not influenced by "pseudoReynolds number effects" as discussed in chapter 2) experimental information on Reynolds number effectsis rather limited as this ACARDograph shows. And this in turn hampers the development of more advancedcalculation methods.
This does not mean that CFD is of no use for Reynolds number assessment. Computational methods thatcan adequately describe attached or almost attached flow conditions are of great help in the interpreta-tion of the wind tunnel test results. They can be used and are actually used to estimate differences intransition location between wind tunnel and flight, to determine the simulation parameters for the aftfixation technique, to estimate at what Reynolds number trailing edge separation will disappear, to extra-polate drag results to higher Reynolds numbers etc. etc. In this way computational methods are essentialfor the enrichment of the information provided by the wind tunnel. The very detailed information frnmCFD-methods allows the test engingeer 4 .,make a much more reliable estimate of flight characteristicsstarting from wind tunnel test results.

47
R x/
16.8.,106 .05- -3.0 .05
3.0 .40-1.0 PRESSURE DISTRIBUTIONS BOUNDARY-LAYER
p5 son 1.2 PRFILESCP T .8,TRANSITION TRIP
0-q_ POSITION UPPER
.5 SURFACE R x 10-60 .5 1.0 0 .02 .04 .06 o 5 3 1.0
sOc ztC 01% 1
EFFECT OF R AND TRANSITION LOCATION. M 0.70; a 00 a 30% 5.1i C
R XT/'___16.8 x106 .05-- - 3.0 .05 ' 0.89
-1.0 3.0 3.0 1.0s ,. 1.2 - - -
C 0 0 .80y AP5 1. =07
0 .5 1.0 0 .02 .04 .061.
EFFECT OF R AND TRANSITION LOCATION. M =0.80; a 00 -1P
- 16.8 x 10⁶ .053.0 .05 10 17o 0.65
-1. 3.0 .40
Cp5p Aon 2 .8
0
0 .5 1.0 0 .02 .04 .06 7.05
EFFECT OF R AND TRANSITION LOCATION. M m0.75, a 30
Fig. 3.6-i Illustratilon of the aft-flaiyons Fig, 3,6-3 Two independent simulations of "fulltechnique (from ref. 68/1) scale" pressure distributions, outer
wing, Mlach .78, C L = .7 (ref. 85/4)
TRANSITION TRIP*POSITION UPPER apr i FaconfSURFACE FI0 10.6 I Frtino
3x 1.0 span 1.06 -(p Ctp
- 5 12I...s 13
*STREAMWISE FROM 0.~.o89
LEADING ED0E6% 100
LOCAL HR C -(p1
0.77
1.0 '- 1.0-
1.0 17065
-1p
0 ' " 17053
Fig. 3.6-2 Secale effects on Outer wing pressuredistributions. (a) C%= .66; (b) C L=.70 (from ref.85
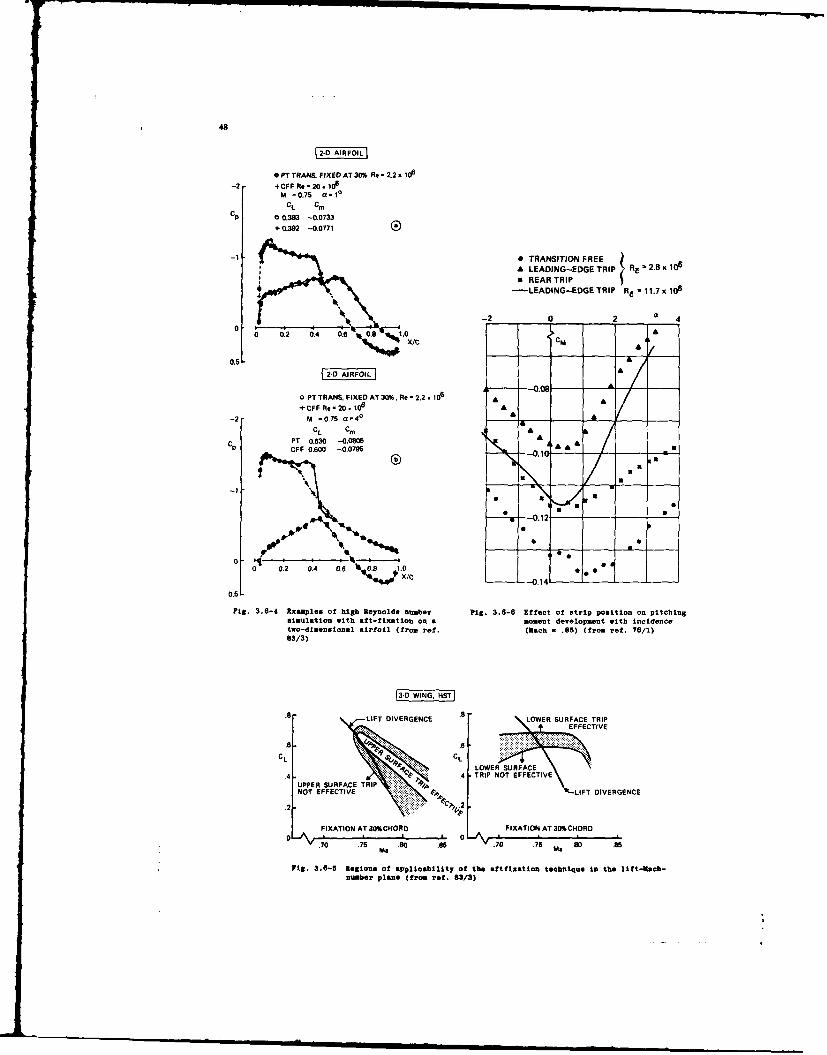
48
OPT TRANS. FIXED AT 30% Re -2.2x lo6-2 -CFF Re- 20.10
6
M -0.75 •=1°
CL CmCp 0 0.383 -0.0733
+ 0.392 -0.0771
-1 0 TRANSITION "REE6A LEADING-EDGE TRIP R, 2.8 x 10⁶
a REAR TRIP- LEADING-EDGE TRIP RE -1.7 I06
0l -2 0 2 a 4
0.58 2-0o
AIRFOIL I I -00 l
* PT TRANS. F IXED AT 30%, Re 2.2. 106 A 00
* CF FRe-20. 1006
-2 FA -0.75 a-40 ACL Cm A
PT 0.630 -0.0W5 APCFF 0.600 -0.0795 -1DI -
0.0 0.2 0.4 0.6 lkq I0 a.
FIg. 3.6-4 Examples of high Reynolds number Pig. 3.6-6 Effect of strip position on pitchingsimulation with aft-fixation on a moment development with incidencetwo-dimensional airfoil (from ref. (Mach - .85) (from ref. 76/1)83/3)
[3D WING, HST
.8 LIFT DIVERGENCE .LOWER SURFACE TRIP
CLLOWE SURCLCE
.4 I¢.4 TRIP NOT EFFECTIVE
UPPER SURFACE TRIPNOT EFFECTIVE "m
-LIFT DIVERGENCE
.2- Vx" 2
FIXATION AT 30%CHORO FIXATION AT 30%CHORDO ~_ _ _ 7 . 0 I O ..
70 .75 .80 . .70 .7 80 .8Ms Ma
FiX. 3.6-5 Regions of applicability of the aftfization technique in the lift-Each-number plane (from rot. 83/3)

49
0.2 OUNOARY - LAYER0.66 TRANSITION STRIP
CX
Fig. 3.6-7a The effect of boundary-layer transition position on theposition of the shock wave for a high aspect ratio wing(from ref. 74/3)
.- . ITI..TVX GERTOS- WIH VOTEXGENERATORS
C (-
,FORWARDTLANS. d 5 FIXATIONSTRIP FORARD
FIXATION
// 0.1 /
L
0.1 CL a
(k (DFERES) a C (DEGREES)C 1 Cm (-I
O0
0.01 0.01Fig. 3.6-7b The effect of aft-fixation and vortex generators on the lift and pit-
ching moment development (from ref. 74/3)
M s 0 C I C . 1MC C d R e . 1 0. 1 0 60 742 132 59 Wj 007 124 745 .60-10 4 0.0095 12.514 .39 t:,S 077 :0127 3.6 J -. 745 .60-02 0.0121 3.1
1. -1.2 -
MIM I ~MODEL"A" MMOE"A1.1 MEASURED (HST) CALCULATE(VGK)
11.0
.7 .7 -
0 .2 .4 .6 X/C 1 0 .2 .4 .6 X/C 8 1
Fig. 3.6-8 Comparison of measured and calculated Indirect Reynolds number effecton a two-dimensional airfoil (unpublished results of NLR)

50

4.0 OBSERVED REYNOLDS NUMBER EFFECTS: LOW ASPECT RATIO WINGS AND BODIES
byT. W. Binion, Jr.
Calspan COrporation/AEDC OperationsArnold Air Force Base, TN 37389
and
E. StanewskyInstitut far Experimentelle Str8mungsmechanik
Deutsche Forschungs- und Versuchsanstalt far Luft- und Raumfahrt e.V.G8ttingen, F.R.G.
4.1 Low Aspect Ratio Wings
Reynolds number effects on low aspect ratio configurations are potentiallymanifested in four factors: transition location, displacement thickness, shock position,and separation loci. While in two-dimensional flows, natural transition occurs primarilybecause of Tollmien-Schlichting instabilities, transition in highly 3D flows inherentwith low aspect ratio configurations can be the result of leading edge contamination,cross flow instability, and in some situations Goertler instabilities as well. Themodification of the spatial distribution of displacement thickness due to Reynolds numberis, of course, coupled with the local flow vector distribution. The effects of Reynoldsnumber on shock position and separation loci are closely coupled with those acting ondisplacement thickness. Because of the complex nature of the flows and because low aspectratio configurations are used primarily for military applications, definitive informationis not frequently published. Aside from some generic delta wing studies, there have beenno systematic investigations of the basic aerodynamic characteristics of low aspect ratioconfigurations reported. The richest source of Reynolds number effects data seems to bewind tunnel to flight comparisons. Such comparisons are fraught with many difficultiesbecause of pseudo-Reynolds effects which creep into wind tunnel data and inherentinaccuracies and measurement difficulties in flight testing. Thus, we feel that the datawhich follow should be viewed with some caution; the conclusions depicted may, withrefined techniques and insight, be shown to be incorrect.
4.1.1 Zero-Lift Drag
Saltzman and Bellman [71/9) presented data correlations for the X-15 and the YF-102 aircraft. Wind tunnel zero-lift drag data were extrapolated using the Karnam-Schoenherr flat plate skin friction relationship [63/2] which obtains the bestcorrelations in terms of Rea rather than Rex. Extrapolation of the data, Fig. 4.1.1, isexcellent. Note however, that the X-15 data had to be correlated with the base dragremoved because of the influence of sting interference on the blunt base configuration.It is further noted that the X-15 airplane and model were both very rigid; there were noleading edge slats, spoilers, or hinged rudders; no inlet flows, propulsion jets orbypass airflows to simulate on the model; and, the problem of measuring thrust in flightwas avoided by considering only gliding flight. Thus, all of the pitfalls associated withthe flexible, airbreathing aircraft were avoided. Even at that, it was necessary tosubtract the base drag from both data sets because of sting interference in the windtunnel. NO explanation was given for the good agreement with the YF-102. However, theonly "Reynolds number effect" for both configurations apparently was that due to skinfriction.
4.1.2 Delta Wings
The formation of stable vortices over swept wings at angle of attack is a usefullift-generating phenomenon utilized as either the primary lift production mechanism or toaugment the lift produced by a conventional airfoil, see [83/9] for example. From aphenomenological viewpoint, wings which produce lift can be classified according to theirleading edges. In order to make a statement about Reynolds number effects for deltawings, it is necessary to specify the type of flow that exists over the wing. It hasbecome traditional to categorize delta wing flow in terms of the Mach number and the flowincidence angle in a plane normal to the leading edge. Stanbrook and Squire [64/1] inevaluating data for sharp leading edge delta wings established demarcation regions forseparated and attached flows at the leading edge in the Mn/an plane. Szodruch (77/1]extended their idea by defining boundaries of other types of separation, Pig. 4.1.2. Notonly do the specific effects of Reynolds number depend on the region of interest in theMn/on plane, but the boundaries themselves seem to be a function of Re, although trulydefinitive studies are lacking. Systematic studies for rounded leading edges are alsosparse. Szodruch has summarized the present knowledge with respect to Reynolds number for
I.

52
each class of wings 188/1). It is felt unnecessary to repeat that summary here. The mainpoints therefrom ares
(1) With sharp leading edge wings for which the primary flow separation is fixedat the leading edge, the main vortex position and strength is essentially constant withReynolds number. However, the location of the secondary separation liaes and hence thesecondary vortex strength appears to be a moderately weak function of Re.
(2) A systematic study of Reynolds number effects for rounded leading edges hasnot appeared. Nevertheless, one may deduce from the existing data that the larger theleading edge radius, the greater the Reynolds number dependency. However, Poll [83/13],based on the comparison of his work with other results, states *Reynolds number, sweep,and incidence are insufficient in themselves to determine the type of (vortex) flow whichwill occur on a given airfoil section." He suggests the wind tunnel disturbanceenvironment also may be a significant factor affecting the data.
(3) There is conflicting evidence on the effect of Reynolds number on vortexbreakdown. Again, no systematic investigations have been published. However, Erickson[80/9] has compiled a group of data from several swept wings tested in both wind andwater tunnels, Fig 4.1.3, which show no correlation between the angle of attack at whichvortex breakdown begins and Reynolds number in the range between 9800 and 40 million.
4.1.3 Aerodynamic Derivatives
Teige, et al. [75/5), have reported a comparison of flight and wind tunnelobtained aerodynamic derivatives for the SAAB 37 fighter, Fig. 4.1.4. After applicablecorrections, the flight data were reduced through a least-square regression processinvolving 75 equations. The results were cross checked using a 6-deg of freedom digitalsimulator with the flight control surface pulses as inputs to reproduce the flightmotion. Wind tunnel tests were conducted with 1/30- and 1/50-scale models at Reynoldsnumbers of 6- and 12-million. Scatter in the CnB wind tunnel data in the transonic regimewas attributed to nonlinear Cn-B curves. Experience in other tunnels has shown thatnonlinear Cn-S data can be caused by flow non-uniformities in the test section flow ifthe pitch-roll technique is used to obtain yaw. However, as the sample data in Fig. 4.1.5show, while aeroelastic corrections are necessary, no Reynolds number effects were found.The flight and wind tunnel predictions are in good agreement.
4.1.4 Buffet
Figure 4.1.6 [81/6] depicts a typical flow pattern on a transonic swept wing atbuffet onset and with moderate buffet. At buffet onset, there is a bifurcated shock inthe planform plane, mild shock induced separation, and the beginning of trailing edgeseparation in the wing root region. As incidence is increased, the flow pattern becomesmuch more complex with thickened shear layers, leading edge as well as shock inducedseparated regions, and regions of complete flow breakdown. The flow structure in thevicinity of the surface has much lower energy and is therefore more unstable. One wouldexpect that since buffet is associated with such complex phenomena, Reynolds number wouldbe a strong influencing parameter in buffet characterization. Such, however, does notappear to be the situation.
Because of the nature of buffet determination in conventional wind tunnels,aeroelastic effects can mask Reynolds number effects when Re is varied by changing totalpressure. Such a difficulty can be avoided by using a cryogenic facility wherein Re canbe varied by changing temperature keeping the dynamic pressure constant. Boyden (81/71has conducted such a test using a 65-deg swept wing. The data, Fig. 4.1.7, are presentedin terms of a steady, Cs, and an unsteady, Ca, bending moment coefficient. The steadycomponent is completely independent of Reynolds number as is the dynamic component priorto vortex breakdown. The reason for the rise in Cs beyond flow breakdown at the higher Reis believed to be associated with the increased frequency parameter rather than Re, seemabey (81/6].
Butler and Spavins [77/2] tested a large half model of a 43-deg swept wing atReynolds numbers up to the flight value which showed no Re effects and an excellentagreement with flight data, Fig. 4.1.8.
Buffet tests on the YF-4 showed that, of 8 methods tried to discern buffet, wing-tip accelerometers were the most sensitive and reliable indicator [70/2]. Wind tunneldata were obtained with a 5% model at unit Reynolds numbers between 3.4- and 7.8-milliondepending upon Mach number. Correlation of flight and wind tunnel data both using wing-tip accelerometers to detect buffet onset, Pig. 4.1.9, shows that at a given Mach number,
53
the wind tunnel predicted the onset of flow separation from 0.5- to 1-deg higher angle ofattack than was experienced in flight. Whether that discrepancy is caused by a Reynoldsnumber mismatch or some other factor was not investigated.
4.1.5 Transonic Technology Wing Program
A transonic technology wing program specifically designed to compare wind tunneland flight data was conducted by Dornier in cooperation with several other agencies[82/11] (82/121. The experimental aircraft, Fig. 4.1.10, and a 1/10-scale wind tunnelmodel were equipped with pressure orifices at identical locations. Comparison of pressuredistributions from flight and Tunnel 16T showed generally very good agreement even thoughthe Reynolds number differed by a factor of 6 to 10. Typical examples are shown in Fig.4.1.11. Boundary-layer transition was free in each instance. Drag polars for one TSTconfiguration are shown in Fig. 4.1.12. The wind tunnel data were obtained in the ONERAS2a at 2.5-million Reynolds number. The agreement it ,uite good except at Mach number0.85. The wind tunnel data at Mach number 0.85 probably contains a large increment due towall interference since the blockage was 1.2%.
4.1.6 Summary
Available data for low aspect ratio configurations depicting Reynolds numbereffects are sparse. No systematic investigations, other than a few for sharp edge deltawings, have been conducted. The data which are available, however, suggest that for mostof the flight regime of interest, Reynolds number effects are small to nonexistent.
o FLIGHT, FULL SCALE CENTER LINEa MODEL, SUB SCALE so SHOCK REGION LEADING EDGE
- EXTRAPOLATION 0EAIN/AAJ SEPARATION
y .05 i 3 . SEPARATION 7 WITh SHCK INDUCEDM=2.504 2 ; ¢SHOCK SE PARATION
.03
S20
:2.06 - M=.
05-X1LEDN EAD GDSEPARATION
4 6 10 20 4060100x106
WIR O1 2 3
NOcoMAL .4C3 NUME SR
Fig. 4.1-1. Comparison of extrapolatedwind tunnel model drag Fig. 4.1-2. Leeside flow regimes overcoefficients with full- thick Delta wings at super-scale flight results, sonic speeds - Qe versus N5(71/9]. diagram, [77/li.
12MEo I ''°/
o WATnR TUNNEL 4.1 x 10⁴ -30 -- _o
* WATER TUNNEL 9. x 03o -+ WATER TUNNEL 1.0x 10⁴ I
! WINDOTUNNEL ! .5 x106
5
1.3 x 1.
, WIND TUEINEL 13x 104 20 . i-
9.0 4
o WINO TUNNEL o.x0x WINTWUNEFL 1.4xi.7x1064 WIN TUNNEL 2.0 x1 06
a0 FLIGHT 40.01x10⁶ 10 - _ --
* WATERTUJNNF.L 1.0x8.0x10 4 IiE WIN TUNNEL 2.0 x 10⁶I2 WIN TUNNEL 1.0 x 10⁶ 0 EDG SPRTO
WATER TUNN0 3.Ox 104WING S MACH E R
Fig. 4.1-3. Effects of wing sweep and Reynolds number on Delta wingvortex breakdown at the trailing edge, (80/19].
1Ii' . mm m mm i m mm~mmm~r-- " m -m ' -40

54
V"G-
~ liltSEPARATIIO
" ',P k \ • THICK( SHEAR
~AT TIP
g5-915Jr OS MOD0 ATE [81/T6
Fig. 4.1-6. Transonic flow on swept wing,IN = 0.80, (81/6].
"A-I =
Tt(K)30 Pt(bor) R., x 10"6 q(kN/m2). V(m/s,
/- 300 1.2 1.1 9.6 120+110 1.2 7.1 9.6 73
CB CB CB 0.060.10
Fig. 4.1-4. SAAB 37 Viggen, [75/5]. 0.04I %/V 1.4
A WT. TESTS RIGID MODEL 0.05 C0+ COwuLITE mEOIELyIc 0.02DOW
o FLIGHT TESTS%/0 V =0.83
-0AA10 20 300.1 D. -G
Fig. 4.1-7. Effect of Reynolds number on0 buffet, M = 0.35, 65-deg swept0 0.5 1.0 1.5 2.0M wing, [81/71.
r 0..11 0.5 BUTLER AND
0 0.40 0.5 1.0 1.5 2.0 M
I FLIGHT's 0.1 0.3 TUNNEL
N=6 km
0 i i
O.S 1.0 1.5 2.0 M
0.1 0.243
0.10 0.5 1.0 1.5 2.0M RC= 10TO18x10 6
Fig. 4.1-5. Comparison of wind tunnel and 0 0 0 0flight derived Cn4, SAAB-37 0.7 0.8fighter, [75/5]. M
Fig. 4.1-8. Flight/tunnel comparison forbuffet onset on a smallfighter aircraft, [77/2].

55
DATA10 - BASIC F-4 SYM SOURCE % LOCGE ALPHA MACH Re x O
6 CT
"WN TUNEL A FLIGHT 2.33 0.836 23.1 30 16T 0.16 2.33 0.835 2.5 3
FLIGHT TEST -1.2
-1.0
4 -0.8
-0.6
-0.4.0.5 0.6 0.7 0.8 0.9 1.0 CP .4
MACH NO. - M -0.2
Fig. 4.1-9. Wingtip accelerometer, rms indi- 0cation of airflow separation,comparison of wind tunnel and 0.2flight test results, (70/2]. 0.4
0.6
0.8 CO0 0.1 0.2 0.3 0.4 0.5 0.6 0.7 0.8 0.9 1.0
xIC
b. = 0.835Fig. 4.1-11. Concluded.
. "WIND TUNNEL TESTS S2 ONERA
ACL 0.2 FLIGHT TESTSA- L -.50. -....
M = 0.5, 0.65 0.70 0.775 0.85
Fig. 4.1-. Transonic technology wing on
DATA Fig 4-1.12. Comparison of forces from windSyM SOURa£ % 8LKGE ALF MACH Rex. 10-6 SECT tunnel and flight test, TST* FLIGHT 2.J6 0.*603 15.5 3 configuration, (82/11).o 16T 0.16 2, 16 0.600 2.5 3
-1.2
-1.0
-0.8-0.6
-0.4
.0.2
0
0.2
0.4
0.6
0.8 . . n . . . . .
0 0.1 0.2 0.3 0.4 0.5 0.6 0.7 0.8 0.9 1.0x/C
a. M = 0.6Fig. 4.1-11. Comparison of wing surface
pressure distribution fromflight and wind tunnel, TSTwing, [82/12].

56
4.2 BODImS
4.2.1 Introduction
Considering the flow about bodies typical of missile configurations and/or fighterfuselages, there exists an area particularly sensitive to Reynolds number effects,viz., the high angle of attack domain of freestream conditions. The strong interestin achieving high maneuverability for both missiles and fighter aircraft hasincreased the importance of that domain and hence the need for an accurate pre-diction of the vehicle performance at such conditions. We will, therefore, discusshere mainly the Reynolds number dependence of the aerodynamic characteristics ofbodies at high angles of attack but also briefly treat the less sensitive lowerincidence range as well as afterbody and base flow and their contributions to theoverall Reynolds number dependence.
Before proceeding it should be noted that an extensive and thorough review ofviscous effects related to bodies at high angles of attack (with an abundance ofreferences) was carried out by Polhamus in 1984 [84/7]. We will essentially followhis discussion - where relevant - but restrict the present discussion to somecharacteristic examples of Reynolds number effects supplemented by results onafterbody and base flow.
4.2.2 CyUnders In normal flow
Many of the Reynolds number dependent viscous flow phenomena encountered by mis-siles and fuselages at high angles of attack can be related, at least qualitatively,to the flow about circular cylinders. Here, the various phenomena and regimescovered as the Reynolds number is increased, say, from the low Reynolds number windtunnel tests to full-scale conditions can best be explained. These regimes aredefined in Figure 4.2.1 where the drag coefficient for a circular cylinder inplotted versus the Reynolds number based on the diameter of the cylinder [84/7].
In the subcritical range, below a Reynolds number of RD=2xlO5, the flow is laminar
and a laminar separation occurs at a separation angle of @S=80. Since the flowdoes not reattach, a wide wake and a correspondingly high drag coefficient results.In this range a dominant vortex shedding frequency is present. When increasingthe Reynolds number, the laminar separation is followed by a turbulent reattachmentwith transition having occurred in the separated shear layer. In this "critical"range a renewed but turbulent separation takes place further downstream - forRo='4xlO
5, for instance, at
8S=
130* - resulting in a narrowing of the wake with an
associated strong decline in drag coefficient. Other than stated by Polhamus[84/71, evidence is given, for instance, by Horvath et al. [86/3] and Schewe [83/11]that a narrowband coherent vortex shedding still exists in the critical Reynoldsnumber range. Note, that flows with laminar separation and transition taking placein the separated shear layer are known to give a similarly favorable effect on dragfor airfoils and wings in transonic flow [68/21 [81/1].
In the supercritical range, RD0 4xI05
to about RD=6xI06, transition to turbulent
flow moves upstream to a position ahead of separation and eventually to the vicinityof the foreward stagnation point. In that range the separation point shifts, dueto the change in boundary layer conditions, also upstream from the extreme down-stream position 6S=130* to about eS=115*; there is, due to the widening of the wake,a corresponding increase in the drag coefficient. Spectra signatures from thisregime are wideband with no predominant frequency except for a small region at thehigh Reynolds number end where a narrowband vortex shedding prevails. The flowdevelopment in the supercritical range is very sensitive to freestream turbulenceand surface roughness [86/3].
At the high Reynolds number end of the supercritical range, the drag levels offsince the upstream movement of the transition point eventually comes to a halt.At still higher Reynolds numbers in a range termed "hypercritical" by Polhamus[84/7], the boundary layer is fully turbulent and the drag coefficient is likelyto decrease with increasing Reynolds number, predominantly due to a slight downwardshift in the separation location. The vortex wake flow becomes here at least qua-si-periodic.
Many correlations have been made of the effect of the Reynolds number on the flowabout circular cylinders. These correlations have often shown a wide band of datauncertainty which was explained as being caused, for instance, by differences insurface roughness, compressibility and end conditions, i. e., the tunnel width tocylinder diameter ratio. Polhamus [84/7) has carried out a careful selection ofresults from various sources, restricting the data to incompressible flow
I

57
(M i0.15)1) , which are essentially free from "secondary" effects; they aredepicted in Figure 4.2.2. The data basically exhibit the Reynolds number dependencedescribed above. The reader is also referred to the investigation of Schewe [83/11who covered a Reynolds number range between ReD=2.3xlO' and ReD=7xl0
6 with one
experimental setup by varying the total pressure between one and 51 bar. Theinvestigation revealed interesting details of the flow behavior in the criticalReynolds number range where distinct discontinuities in the Reynolds numberdependence were observed, Figure 4.2.3. Here, the discontinuity at A is attributedto the formation of a laminar separation with turbulent reattachment and subsequentfar aft separation on one side of the cylinder and a laminar separation withoutreattachment on the other side. This asymmetric flow development is accompaniedby a steady lift force, Figure 4.2.4, which disappears as soon as the flow re-es-tablishes its symmetric condition with increasing Reynolds number; the latterresults in the discontinuity at B. Note, that the lift force observed in the cri-tical range is associated with one mechanism generating side forces (out-off-planeforces) on, say, a three-dimensional ogive-cylinder body at angle of attack.
It was mentioned earlier that two effects, namely the effects of roughness andcompressibility, frequently obscured a comparison of results on flows about cyl-inders obtained from different sources. Their individual influence is, therefore,shown in Figures 4.2.5 and 4.2.6: Roughness of sufficient height essentiallypromotes an early transition so that the transition point may always be locatedupstream of the separation point as is the situation of the upper two curves ofFigure 4.2.5 (r/DxlO5=900 and 450, respectively). Here, an Increase in Reynoldsnumber, starting, say, at RD=105, initially moves the transition point furtherupstream to the vicinity of the stagnation point resulting in an increase in drag.At a further increase in Reynolds number the drag gradually decreases with thebehavior of the flow being as in the hypercritical range, although at much lowerReynolds numbers. As the roughness height is decreased , various stages in theReynolds number dependence of the flow development can be observed: Atr/D=1l0xl 0, for instance, a very noticeable critical as well as a supercriticaldomain still exist; however, both extend over a much smaller Reynolds number rangethan is obtained with a smooth surface. Concerning compressibility, Figure 4.2.6,one observes that the classical Reynolds number dependence persists at least upto the vicinity of the critical Mach number with the drag increasing as the Machnumber is raised. As soon as shock waves occur, strong enough to separate theturbulent boundary layer, the characteristic drop in drag in the critical Reynoldsnumber range is likely to disappear (also see Figure 4.2.12.). Note, that the dragcoefficient decreases in the hypercritical range as was conjectured when discussingFigure 4.2.1.
Besides the circular cylinder, other cross-sectional shapes are of interest suchas, for instance, a rectangular cross section with rounded corners which might beselected for a missile body to improve the packing density for submunition [83/12).Furthermore, such shapes can be found on fuselages of modern combat aircraft whichare required to maneuver at high angles of attack. Figure 4.2.7, again taken fromRef [84/7], summarizes some typical results concerning the Reynolds numberdependence of the drag coefficient for cylinders with square cross sections havingvarious values of the normalized corner radius. One observes a strong effect ofthe corner radius on both the value of the drag and on the Reynolds number for thetransition from subcritical to supercritical flow. For the smallest radiub,r/w=.021, separation occurs on the windward corners, essentially fixed by geom-etry, at least at the low Reynolds numbers considered here, and the strong Reynoldsnumber effects observed for the circular cylinder cannot be expected. The dragis similar to that for a flat plate perpendicular to the flow. As the corner radiusis increased, the adverse pressure gradients at the corners are reduced and, as aconsequence, separation is now affected by Reynolds number in a way similar to thecircular cylinder, although the drag of the latter is not reached here.
Ref. 84/7 also considers the influence of the flow angle on drag and side forcesfor cylinders with non-circular cross sections and cross sections with other thanrectangular shapes. The results show basically similar Reynolds number dependencesas the ones depicted in Figure 4.2.7. Finally, it should be noted that data fornon-circular cross sections are mainly available for incompressible flow and Rey-nolds numbers of ReCi2xlO
6; there is a considerable need to extend investigations
to compressible flow and to higher Reynolds numbers.
4.2.3 Cylinders in oblique flow
An interim stage between the cylinder in normal flow and, say, a cone-cylinder bodyat angle of attack is the cylinder of infinite length in oblique flow (swept
1) Applicable to three-dimensional bodies in transonic flow at low angles of attack

58
cylinder). Results for such a configuration are depicted in Figure 4.2.8 in theform normal force, CN/fln 2
s, versus effective Reynolds number, Reet f , for varioussweep angles s 184/7). Here, the effective Reynolds number corresponds to the onedefined by Each 175/6), viz.,
Reeff - ROD Ka
where
Ka = 10.983 / sina + 0.311 +0.287 . sins] / 1.581
In this formulation, Ka is equal to the ratio of the circumferential length of thebody in the plane parallel to the freestream (ellipse) to that in the cross flowplane (circle), thus accounting for the actual change in streamline length, say,to the separation line, as the sweep angle is changed. One observes that thiseffective Reynolds number correlates the data of Figure 4.2.8 with regard to theonset of the critical Reynolds number regime quite well - as a matter of fact,better than any other correlation. This indicates that the flow component normalto the cylinder is not instrumental in determining separation and transition con-ditions, at least not at sweep angles of s*60*° a fact also supported by thedependence of the normal force coefficient CN/sin
2a on the sweep angle in the
supercritical Reynolds number range. Such a limit in the applicability of theindependence principle, i.e., the independence of the flow components normal andparallel to the body considered, which holds strictly only for laminar flow, wasalso found for shock-induced separation on wings in transonic flow (88/1!. Forfurther discussions on the Reynolds number dependence of the flow about infinitelyswept cylinders, the reader is referred to Ref. 84/7.
4.2.4 Three-dimensional bodies
As a slender body is pitched through the angle of attack range 0°sai90, it expe-
riences four distinct flow patterns that reflect the diminishing influence of theaxial flow component eventually leading to conditions discussed in the previoussections, Figure 4.2.9 [87/41 (79/31 (81/81. At low angles of attack the axialcomponent dominates ; the flow is attached and essentially vortex free. As the angleof attack is increased, cross flow developes and the boundary layer separates onthe leeward side of the body forming a symmetric vortex pair. This condition isdepicted in Figure 4.2.9 (a) for s=30*. Note, that the vortex lifts off the bodyat the extreme downstream end. In the next higher s-regime, the cross floweffects start to dominate and the vortices become asymmetric thereby producing aside force at zero side slip or yaw, Figure 4.2.9 (a), s=5OO. Finally, at veryhigh angles of attack, the cross flow dominates completely and the vortices areshed either in a periodic form or in a wideband random fashion dependent on theReynolds number as discussed in Section 4.2.2 for the cylinder in normal flow.
It can be expected that the flow development in the various regimes is more or lessstrongly influenced by the Reynolds number. To show this the normal force coeffi-cient, based on freestream conditions and base area, for a typical ogive-cylinderbody is first depicted as function of the angle of attack with the Reynolds numberas parameter, Figure 4.2.10 (78/51. Also indicated in this figure is the angleof attack dependence of the normal force according to cross flow theory assuminga purely laminar and a fully turbulent separation with separation angles corre-sponding to the maximum drag in the subcritical and the minimum drag in thesupercritical Reynolds number regime, respectively, for the cylinder in normal flow[51/31. One observes that the flow development is highly dependent on Reynoldsnumber, starting already at relatively low angles of incidence, and that a par-ticularly strong change in normal force occurs as separation shifts from a laminarto a fully turbulent state.
A still better illustration of the flow development is obtained when cross-plottingthe results of Figure 4.2.10 as function of the Reynolds number with the angle ofattack as parameter. This was carried out by Polhamus (84/71 supplementing theseresults by data of Foley [71/101 at an incidence of s=30*, Figure 4.2.11. Thedifferent Reynolds number regimes, discussed in Section 4.2.2 for the cylinder innormal flow, become clearly distinguishable: the subcritical rango where a laminarseparation prevails, the critical Reynolds number domain where a transitionalseparation with subsequent turublent reattachment and a renewed separation takesplace - and where the drag coefficient for the cylinder in normal flow has a minimum
and the super- and hypercritical domains where the separation eventually becomesfully turbulent. Figure 4.2.11 also illustrates the Large reduction in the criticalReynolds number, based on cylinder diameter and freestream conditions, withdecreasing angle of attack which is associated with the corresponding increase instreamline length similar to the conditions for the infinitely swept cylinderdiscussed earlier. (For the establishment of the characteristic boundaries, marked
Iq

59
by the dashed lines in Figure 4.2.11, from results for the cylinder in normal flow,the reader is referred to Ref. 84/7.) Note, that the influence of compressibilityon the critical Reynolds number is still minor at the freestream Mach number con-sidered (M.=0.5), even at the extreme angles of attack.
In order to explore the influence of compressibility on the Reynolds numberdependence, the data of Hartmann [78/5) are cross-plotted in Figure 4.2.12 forconstant Mach numbers at angles of attack of a=30
° and a=60
° . It can be observedthat the critical Reynolds number increases slightly with Mach number and that,at the same time, the Reynolds number sensitivity in the critical Reynolds numberrange gradually disappears. The latter is due to the fact, already pointed outin Section 4.2.2, that the cross flow Mach number becomes large enough to establishsupersonic regions on the body with terminating shock waves strong enough to sep-arate the boundary layer essentially independent of the condition of the boundarylayer upstream of the shock. This is in agreement with evidence presented in Ref.88/1 which indicates that the onset of shock-induced separation (incipient sepa-ration) is, for a turbulent boundary layer, only weakly dependent on viscouseffects so that only a marginal decrease in normal force with Reynolds number canbe expected here. Note, that the second set of Reynolds number boundaries givenin Figure 4.2.12, termed "laminar, transitional and fully turbulent", will bediscussed below.
It is well known that side (or out-off-plane) forces on slender bodies at zeroside-slip or yaw angle pose a serious problem to the maneuverability of such con-figurations so that a closer look at the Reynolds number dependence of side forcesin the various angle of attack domains seems warranted. There are essentially twomechanisms that may generate side forces: One occurs only in the critical Reynoldsnumber regime and is related to the steady lift forces on the cylinder in normalflow cauced by different developments of transition and separation on the upperand lower side of the cylinder (see Figure 4.2.4 and Section 4.2.2). The othermechanism, referred to at the beginning of this section, also operates in thesubcritical (laminar) and the super- and hypercritical (fully turbulent) separationregimes; this mechanism is directly related to hydrodynamic instability and isqualitatively described by the impulsive flow analogy [82/131. For a more detailedstudy of vortex-induced asymmetric loads, the reader is referred to the review ofEricsson and Reding [81/81 and the papers by Lamont [82/13], Hartmann 187/4] andChampigny [86/41.
The true effect of Reynolds number and angle of attack on side forces can only bedetermined when first considering the variation .f the side force with roll anglewhich occurs even if the flow is steady and extreme care has been taken to manu-facture a model without apparent geometric asymmetry [82/131. The phenomenon isillustrated in Figure 4.2.13 for two angles of attack and Reynolds numbers ofRe0 =2.5xlO
5 and Reo=7.3x10
5, corresponding - see Figur 4.2.11 - to the subcritical
and supercritical Reynolds number range, respectively. One observes that in thetest cases considered two side force cycles occur during a complete roll and that,furthermore, pronounced maxima are present which seem to decrease as the Reynoldsnumber is raised. Considering henceforth only the absolute maximum during a com-plete roll as representative of the overall side force, it is indicated in Figure4.2.14, taken from Ref. 82/13, that there is a strong variation of that force withangle of attack as well as with Reynolds number. Side forces start to develop,nearly independent of the Reynolds number, at an angle of attack of about a=300and persist almost up to a=90*, especially at Reo=O.4xlO
6, a Reynolds number which
lies within the critical Reynolds number range where for the cylinder in normalflow spurious lift forces existed.
The effect of the Reynolds number on the maximum side force is illustrated in Figure4.2.15 for two test cases 182/131 [85/131. The maximum side force falls from ahigh value at a Reynolds number of approximately Reo=2xlO
5 (laminar separation)
to almost zero at the end of the critical Reynolds number range before climbingagain to a higher value at Reynolds numbers of ReD=2xlO
6 to Re0 =4xl0 at which a
fully turbulent separation exists. The Reynolds number range where the side forcesbecome almost zero is the same as the one where the cylinder in normal flow exhibitsa minimum in the Reynolds number dependence of the drag coefficient and where thesteady lift force, Figure 4.2.4, falls again to zero. At these conditions sepa-ration occurs furthest downstream, as indicated by the corresponding circumferen-tial pressure distribution in Figure 4.2.16, and the symmetric vortex patternbecomes stable. The results of Figure 4.2.15 are somewhat contrary to a statementof Ericsson and Reding [81/81 who claim that the largest side forces develop inthe critical Reynolds number regime due to differences in the transition patternon opposite sides of the cylinder. Note, that the vortex-induced side loadsdecrease with increasing subsonic cross flow Mach number (M. : 0.4) and becomeinsignificant at supersonic cross flow Mach numbers [81/81 [84/71.
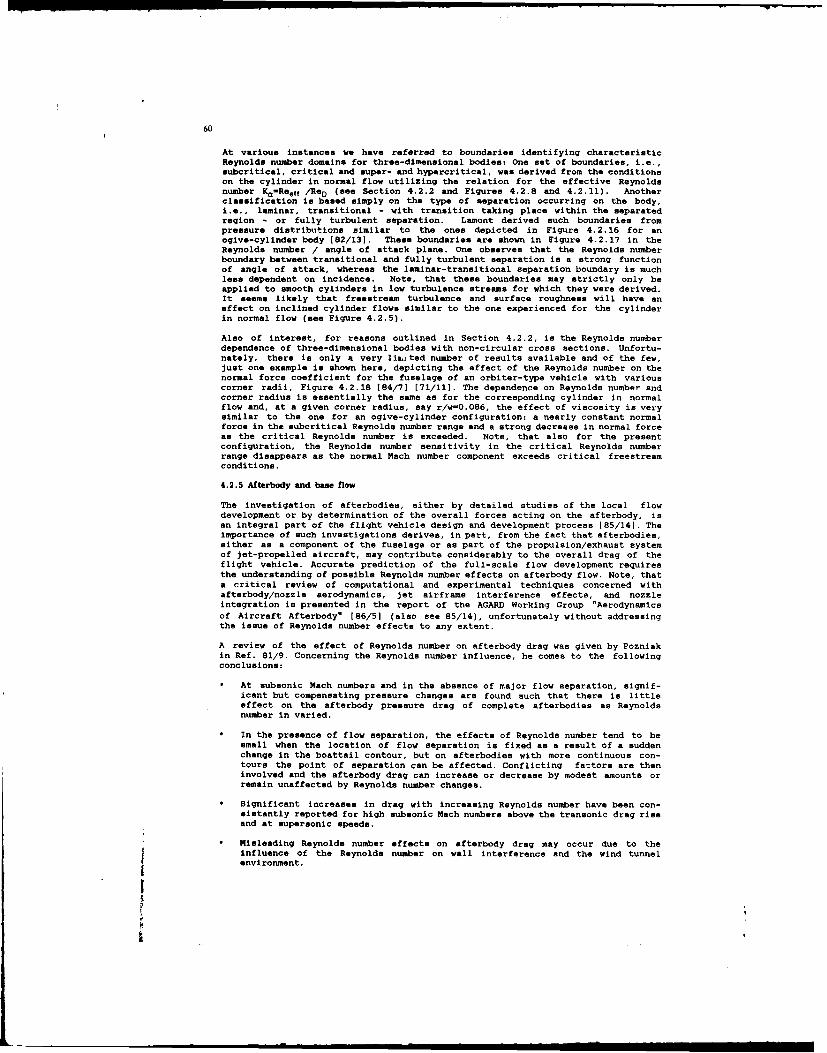
60
At various instances we have referred to boundaries identifying characteristicReynolds number domains for three-dimensional bodies: One set of boundaries, i.e.,subcritical, critical and super- and hypercritical, was derived from the conditionson the cylinder in normal flow utilizing the relation for the effective Reynoldsnumber K=Reef /Re0 (see Section 4.2.2 and Figures 4.2.8 and 4.2.11). Anotherclassification is based simply on the type of separation occurring on the body,i.e., laminar, transitional - with transition taking place within the separatedregion - or fully turbulent separation. Lamont derived such boundaries frompressure distributions similar to the ones depicted in Figure 4.2.16 for anogive-cylinder body [82/131. These boundaries are shown in Figure 4.2.17 in theReynolds number / angle of attack plane. One observes that the Reynolds numberboundary between transitional and fully turbulent separation is a strong functionof angle of attack, whereas the laminar-transitional separation boundary is muchless dependent on incidence. Note, that these boundaries may strictly only beapplied to smooth cylinders in low turbulence streams for which they were derived.It seems likely that freestream turbulence and surface roughness will have aneffect on inclined cylinder flows similar to the one experienced for the cylinderin normal flow (see Figure 4.2.5).
Also of interest, for reasons outlined in Section 4.2.2, is the Reynolds numberdependence of three-dimensional bodies with non-circular cross sections. Unfortu-nately, there is only a very lia, ted number of results available and of the few,just one example is shown here, depicting the effect of the Reynolds number on thenormal force coefficient for the fuselage of an orbiter-type vehicle with variouscorner radii, Figure 4.2.18 [84/7] [71/111. The dependence on Reynolds number andcorner radius is essentially the same as for the corresponding cylinder in normalflow and, at a given corner radius, say r/w=0.086, the effect of viscosity is verysimilar to the one for an ogive-cylinder configuration: a nearly constant normalforce in the subcritical Reynolds number range and a strong decrease in normal forceas the critical Reynolds number is exceeded. Note, that also for the presentconfiguration, the Reynolds number sensitivity in the critical Reynolds numberrange disappears as the normal Msch number component exceeds critical freestreamconditions.
4.2.5 Afterbody and base flow
The investigation of afterbodies, either by detailed studies of the local flowdevelopment or by determination of the overall forces acting on the afterbody, isan integral part of the flight vehicle design and development process 185/14]. Theimportance of such investigations derives, in part, from the fact that afterbodies,either as a component of the fuselage or as part of the propulsion/exhaust systemof jet-propelled aircraft, may contribute considerably to the overall drag of theflight vehicle. Accurate prediction of the full-scale flow development requiresthe understanding of possible Reynolds number effects on afterbody flow. Note, thata critical review of computational and experimental techniques concerned withafterbody/nozzle aerodynamics, jet airframe interference effects, and nozzleintegration is presented in the report of the AGARD Working Group "Aerodynamicsof Aircraft Afterbody" [86/51 (also see 85/14), unfortunately without addressingthe issue of Reynolds number effects to any extent.
A review of the effect of Reynolds number on afterbody drag was given by Pozniakin Ref. 81/9. Concerning the Reynolds number influence, he comes to the followingconclusions:
. At subsonic Mach numbers and in the absence of major flow separation, signif-icant but compensating pressure changes are found such that there is littleeffect on the afterbody pressure drag of complete afterbodies as Reynoldsnumber in varied.
. In the presence of flow separation, the effects of Reynolds number tend to besmall when the location of flow separation is fixed as a result of a suddenchange in the boattail contour, but on afterbodies with more continuous con-tours the point of separation can be affected. Conflicting factors are theninvolved and the afterbody drag can increase or decrease by modest amounts orremain unaffected by Reynolds number changes.
. Significant increases in drag with increasing Reynolds number have been con-sistantly reported for high subsonic Mach numbers above the transonic drag riseand at supersonic speeds.
. Misleading Reynolds number effects on afterbody drag may occur due to theinfluence of the Reynolds number on wall interference and the wind tunnelenvironment.I
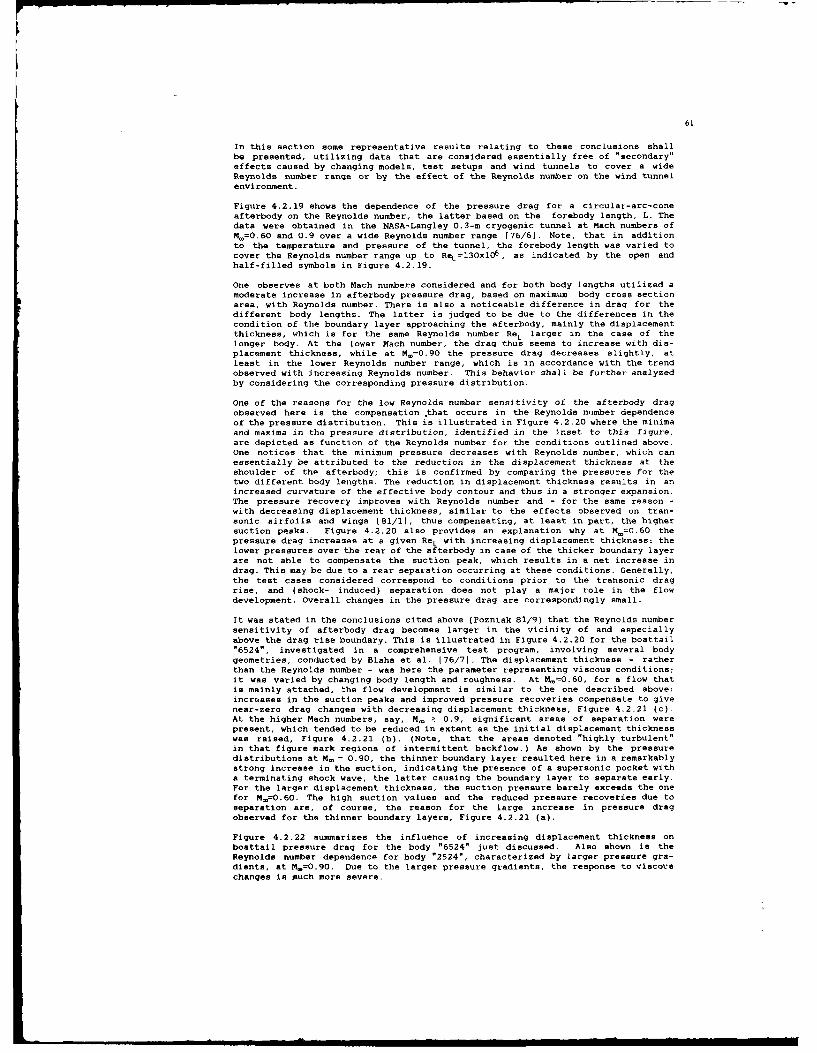
61
In this section some representative results relating to these conclusions shallbe presented, utilizing data that are considered essentially free of "secondary"
effects caused by changing models, test setups and wind tunnels to cover a wideReynolds number range or by the effect of the Reynolds number on the wind tunnelenvironment.
Figure 4.2.19 shows the dependence of the pressure drag for a circular-arc-coneafterbody on the Reynolds number, the latter based on the forebody length, L. Thedata were obtained in the NASA-Langley 0.3-m cryogenic tunnel at Mach numbers ofM.=0.60 and 0.9 over a wide Reynolds number range 176/6]. Note, that in additionto the temperature and pressure of the tunnel, the forebody length was varied tocover the Reynolds number range up to Ret=130xl0
6, as indicated by the open and
half-filled symbols in Figure 4.2.19.
One observes at both Mach numbers considered and for both body lengths utilized amoderate increase in afterbody pressure drag, based on maximum body cross sectionarea, with Reynolds number. There is also a noticeable difference in drag for thedifferent body lengths. The latter is judged to be due to the differences in thecondition of the boundary layer approaching the afterbody, mainly the displacementthickness, which is for the same Reynolds number ReL larger in the case of thelonger body. At the lower Mach number, the drag thus seems to increase with dis-placement thickness, while at M.=0.90 the pressure drag decreases slightly, atleast in the lower Reynolds number range, which is in accordance with the trendobserved with increasing Reynolds number. This behavior shall be further analyzedby considering the corresponding pressure distribution.
One of the reasons for the low Reynolds number sensitivity of the afterbody dragobserved here is the compensation .that occurs in the Reynolds number dependenceof the pressure distribution. This is illustrated in Figure 4.2.20 where the minimaand maxima in the pressure distribution, identified in the inset to this figure,are depicted as function of the Reynolds number for the conditions outlined above.One notices that the minimum pressure decreases with Reynolds number, which canessentially be attributed to the reduction in the displacement thickness at theshoulder of the afterbody; this is confirmed by comparing the pressures for thetwo different body lengths. The reduction in displacement thickness results in anincreased curvature of the effective body contour and thus in a stronger expansion.The pressure recovery improves with Reynolds number and - for the same reason -with decreasing displacement thickness, similar to the effects observed on tran-sonic airfoils and wings [81/l, thus compensating, at least in part, the highersuction peaks. Figure 4.2.20 also provides an explanation why at M.=0.60 thepressure drag increases at a given ReL with increasing displacement thickness: thelower pressures over the rear of the afterbody in case of the thicker boundary layerare not able to compensate the suction peak, which results in a net increase indrag. This may be due to a rear sepatation occurring at these conditions. Generally,the test cases considered correspond to conditions prior to the transonic dragrise, and (shock- induced) separation does not play a major role in the flowdevelopment. Overall changes in the pressure drag are correspondingly small.
It was stated in the conclusions cited above (Pozniak 81/9) that the Reynolds numbersensitivity of afterbody drag becomes larger in the vicinity of and especiallyabove the drag rise boundary. This is illustrated in Figure 4.2.20 for the boattail"6524", investigated in a comprehensive test program, involving several bodygeometries, conducted by Blaha et al. [76/71. The displacement thickness - ratherthan the Reynolds number - was here the parameter representing viscous conditions;it was varied by changing body length and roughness. At M-=0.60, for a flow thatis mainly attached, the flow development is similar to the one described above:increases in the suction peaks and improved pressure recoveries compensate to givenear-zero drag changes with decreasing displacement thickness, Figure 4.2.21 (c).At the higher Mach numbers, say, M_ 1 0.9, significant areas of separation werepresent, which tended to be reduced in extent as the initial displacement thicknesswas raised, Figure 4.2.21 (b). (Note, that the areas denoted "highly turbulent"in that figure mark regions of intermittent backflow.) As shown by the pressuredistributions at M. = 0.90, the thinner boundary layer resulted here in a remarkablystrong increase in the suction, indicating the presence of a supersonic pocket witha terminating shock wave, the latter causing the boundary layer to separate early.For the larger displacement thickness, the suction pressure barely exceeds the onefor M.-O.60. The high suction values and the reduced pressure recoveries due toseparation are, of course, the reason for the large increase in pressure dragobserved for the thinner boundary layers, Figure 4.2.21 (a).
Figure 4.2.22 summarizes the influence of increasing displacement thickness onboattail pressure drag for the body "6524" just discussed. Also shown is theReynolds number dependence for body "2524", characterized by larger pressure gra-dients, at M.=0.90. Due to the larger pressure gradients, the response to viscous
changes is much more severe.

62
The results described in the preceding paragraphs were obtained on simpleforebody/afterbody configurations, and, in general, the afterbody drag increasedwith increasing Reynolds number or decreasing displacement thickness. In the fol-lowing, results for a more complex configuration shall briefly be considered:Measurements of the installed boattail drag over a wide range of Reynolds numbershave been made by NASA on boattails mounted behind underwing nacelles on an F-106type delta aircraft during tunnel and flight tests [75/71. Examples of the measuredpressure drag at M=0.60 and 0.90 are depicted in Figure 4.2.23, replotted fromRef. 81/9, for the flight tests only, being consistent with the initial statementto restrict the illustration of Reynolds number effects to results obtained withone configuration and one test setup to avoid "secondary" effects of obscuring theresults.
The flight test data for the various boattail geometries consistently indicate areduction in boattail drag with increasing Reynolds number, although the exact rateis uncertain due to the scatter of data. There are several comments to be madeconcerning this Reynolds number dependence: One reason for the drag reduction withReynolds number might be due to the dominant effect of the Reynolds number onseparation, hence on pressure recovery, rather than on the suction peak, contraryto the development observed for the bodies in Figures 4.2.21 and 4.2.22; a favorableeffect of an increase in Reynolds number on separation, determined by wool tufts,was indicated during the flight tests. Another possible contribution to theobserved variation in drag may arise from the presence of a significant andfavorable interference effect from the closeness of the contoured part of theafterbody to the wing coupled with a positive influence of increasing Reynoldsnumber on the wing flow. There is, however, further - indirect - evidence from otherflight tests 174/4) that boattail separation in relation to the suction peakdevelopment may essentially determine this drag behavior: Little effect of Reynoldsnumber on drag was shown in cases where little movement of the separation pointoccurred.
There are many parameters - besides the ones associated with viscous changes - thatmay have an influence on afterbody flow, especially for complex geometries. For amore detailed study of these, the reader is referred to Refs. 85/11 and 81/9 andthe many literature sources given there.
Base pressure is likely to he affected by the boundary layer condition upstreamof the base in a way similar to the afterbody pressure distribution, at least asfar as the expansion around the shoulder is concerned. There seems, therefore,no need to address here viscous effects on base flow to any great extent. Inaddition, a detailed study of the aerodynamics of base flow, including the influ-ence of combustion, also containing major correlations of base pressure with vis-cous and geometric parameters, is given in Ref. 76/8, to which the reader isreferred.
A characteristic example of the influence of the state of the boundary layer onbase pressure is depicted in Figure 4.2.24 for a cone-cylinder model withL/D=5(76/8]: In the laminar region, the base pressure coefficient decreases withincreasing Reynolds number, mainly due to the corresponding reduction in dis-placement thickness at the corner of the base. In the transitional region and theinitial turbulent domain, the base pressure increases with Reynolds number, prob-ably due to boundary layer transition progressing upstream towards the apex of thebody with a corresponding increase in the boundary layer thickness. For fullyturbulent flow approaching the corner, the base pressure decreases again as theReynolds number is raised; this is illustrated in Figure 4.2.25 by a large bodyof experimental data presented in a correlation according to Chapman 158/11.
As a further example of the Reynolds number effect on base flow, some results ofmeasurements on a space shuttle orbiter-type configuration at transonic speeds -however, only over a very limited Reynolds number range - are depicted in Figure4.2.26 [72/71. The data, obtained for free and forced transition and at variousangles of incidence, all show the same trend: an increase in base-drag coefficient- due to a drop in base pressure - with increasing Reynolds number similar to thebehavior observed on the simpler geometry discussed above.
4.2.0 Conclusion
The Reynolds number dependence of the flow about bodies, including afterbody andbase flow, has briefly been reviewed. This review showed examples characteristicof Reynolds number effects for cylinders with circular and non-circular crosssections in normal flow, sheared cylinders of quasi-infinite span, three-dimen-sional fuselage- and missile-type bodies, and afterbodies as they exist on fightersand nacelles as part of the exhaust/propulsion system.

63
Two-dimensional bodies at subcritical speeds and three-dimensional bodies with
subcritical cross flow velocities exhib- t essentially the same behavior withincreasing Reynolds numbert At low Reynolds numbers the flow is laminar and laminarseparation occurs, drag and normal force, respectively, are relatively high. Asthe Reynolds number is increased, the critical Reynolds number range is entered,and drag and normal force drop rapidly due to transition occurring in the separatedshear layer with a subsequent turbulent reattachment and renewed separation at alarge circumferential angle. At transitional separation conditions, a steady liftforce may act on the cylinder in cross flow which manifests itself on the three-dimensional body as a side force. These forces are caused by differences in theboundary layer, and hence separation development, on opposite sides of the body.The side force is nearly zero at the transition between the critical and thesupercritical Reynolds number ranges where the drag and the normal force for thetwo-dimensional cylinder and the three-dimensional body, respectively, also havea minimum. Note, that theme side forces may occur at any angle of attack and thatthey are, at a given incidence and wind tunnel environment, only dependent onReynolds number. A further increase in Reynolds number results in an increase indrag and normal force up to conditions at which the movement of the transition pointon the body ceases; hereafter, a reversal in Reynolds number dependence shoulddevelop; however, very little data is available in the hypercritical Reynoldsnumber range to confirm this.
A second mechanism generating side forces on a three-dimensional body is relatedto hydrodynamic instability. These out-off-plane forces occur at angles of attackroughly between 30 and 60', dependent on body length, in all Reynolds numberregimes; they have, however, as indicated above, a minimum in thecritical/supercritical Reynolds number range.
With increasing Mach number, the classical Reynolds number dependence disappearsdue to the development of supersonic regions with terminating shock waves strongenough to separate even the turbulent boundary layer. At such conditions, the flowdevelopment seems not very susceptible to viscous changes The freestream conditionsat which this occurs may, however, dependent on angle of attack, already besupersonic since the freestream Mach number component normal to the body is thedominant parameter.
Note, that single or distributed roughness in a form that fixes transition wellupstream of separation also strongly redudes the Reynolds number dependence, asdo bodies with corner radii that essentially fix separation itself.
Concerning afterbody flow, it was found that at subsonic Mach numbers in the absenceof major flow separation significant but compensating pressure changes occur suchthat there is little effect of Reynolds number on afterbody pressure drag. However,strong increases in drag with increasing Reynolds number were consistantly observedat subsonic Mach numbers above the transonic drag rise and at supersonic speeds.At the lower Mach numbers, the stronger expansion in the shoulder region of theafterbody caused by reduced displacement thickness as Reynolds number increasesis compensated by the improved pressure recovery; at the higher Mach numbers,reducing displacement thickness by increasing Reynolds number causes such a strongexpansion that shock waves develop separating the boundary layer in a way that thepressure recovery can no longer compensate the expansion and a net increase in dragresults.
There is also evidence obtained on more complex configurations, e.g., boattailsmounted behind underwing nacelles, that the boattail pressure drag may welldecrease with increasing Reynolds number. One reason for this behavior seems tobe the positive effect of the Reynolds number on separation, hence on pressurerecovery, rather than on the suction peak development, as was the case in theexamples cited above.
The opposing trends in the Reynolds number dependence of afterbody drag suggeststhat further research is needed, especially for more complex configurations, todetermine conditions at which either the effect of the Reynolds number on thesuction peak or on separation is dominant, and, furthermore, to determine theinfluence of the closeness of the afterbody to adjacent aircraft components. Con-cerning the Reynolds number effect on the flow about two- and three-dimensionalbodies, more information is needed at Reynolds numbers in the supercritical andhypercritical domains, especially at Mach numbers above critical freestream con-ditions and for bodies with non-circular cross sections. Also of interest areinvestigations related to the influence of the Reynolds number on the interferencebetween bodies and control surfaces which was not explicitly discussed here.
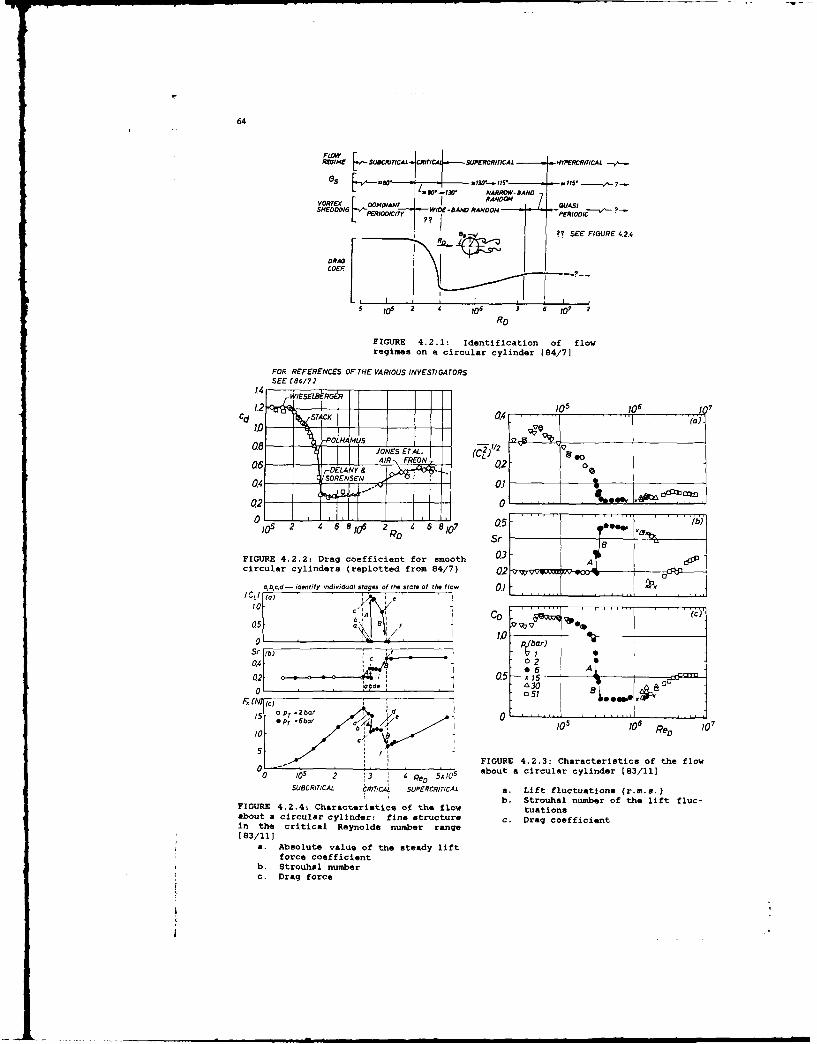
64
RIME [ UBRITICAL CRT7 SUPERCITICAL HYPERRITICAL -
s-- ftX NARROW-BAND
VORTEX VDOMINANT 10 RANDOM QUSSHEDDING IODICI WIDE-BAND RANDOM PERIODIC'-
?. SEE FIGURE 4.2.4
DRAGCOEF
O3 . -?LT ----5 10 2 70RD
FIGURE 4.2. i1: Identi fication Of flowregimesa on a circular cylinder 184/7]
FOR REFERENCES OF THE VARIOUS INVESTIGATORSSEE 184/71
14 WIE-SEL ROER
1.2- 105
106 1 7Cd TACK 0.4----------(.C.d - t I I ] '7081 I ows Er AL. I (cZ-- 00o J - 'POiNAMUS 3)/
Al I I I FREON 02-0. ORENSEN 0 __ __ ___
02" 0 .
0 - 19.. _, II- - I-I )105 2 4 68 806 2 R 6 810
7 05S r
FIGURE 4.2.2: Drag coefficient for smooth 0.3- Acircular cylinders (replotted from 84/7) 02 .-VOAV
a,b,c,d- identify indiwidual stages of the state of the flow 0.1 -_
(CLI (a) e________1.0,
05 Al f 1 CC)
: P. bar)
[ AjSrNIj Gbd " 3002- 0 25 1a ad-
5 -OP :A ' 105 106 PeD 107
- FIGURE 4.2.3: Characteristics of the flow0 tO
5 2 3 4 5xJO
5 about a circular cylinder [83/111
SUBCRTICAL CRITIC4L 5UPERCRITICAL a. Lift fluctuations (r.m.s.)
b. Strouhal number of the lift fluc-FIGURE 4.2.4; Characteristics of the flow tuationsabout a circular cylinder: fine structure c. Drag coefficientIn the critical Reynolds number range[83/111
a. Absolute value of the steady liftforce coefficient
b. Strouhal numberc. Drag force
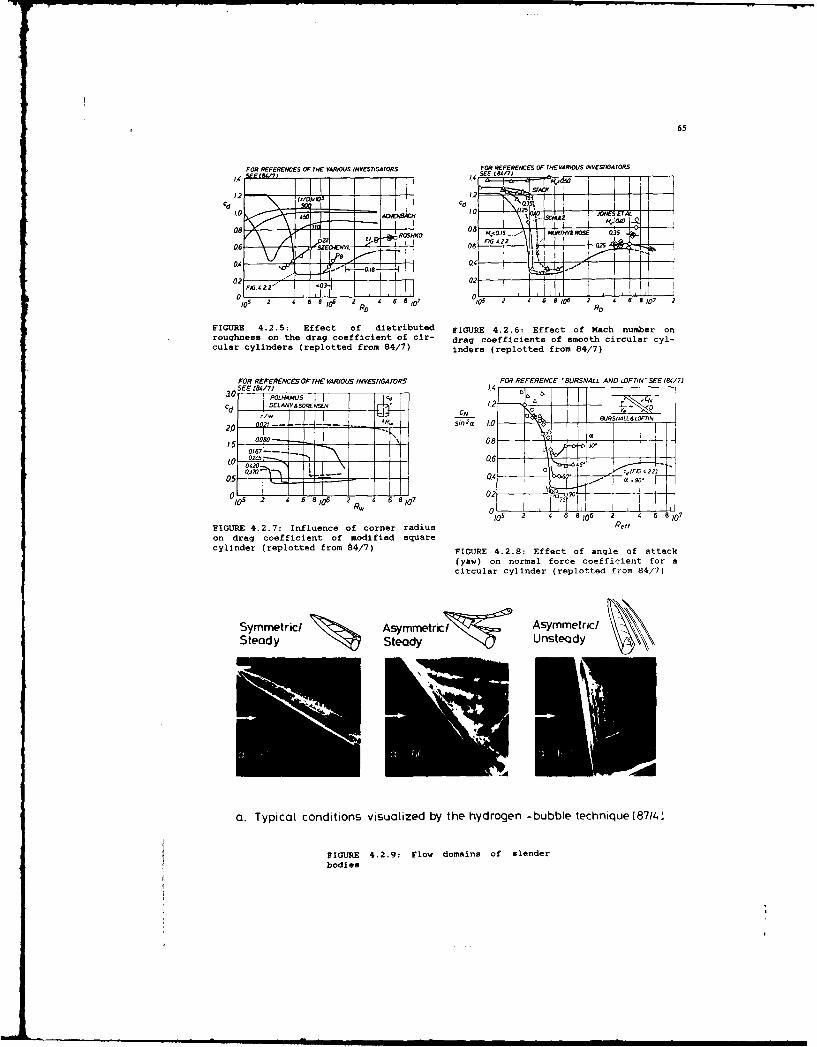
65
FOR REFERENCES OF THE VARIOUS INVESTIGATORS FOR REFERENCES OF THE VARIOUS INVESTIGATORS
I10)10 - 1E 2 c& 41
Cd -d 10rj I...11 i
Cd II[IIL1.0 A QENBA,, IC- 0.+ ]o,+, N if
0+ -, o,, ,,Wk6.oSH IO 0 A.. 7 OI5 AARTY ROE ,35
02 T22' I3 2
00 2 I J 8 0' 6 84 07 0 2 4 I a 17 2 4 6 A 07 214b ,O R2
FIGURE 4.2.5: Effect of distributed FIGURE 4.2.6: Effect of Mach number onroughness on the drag coefficient of cir- drag coefficients of smooth circular cyl-cular cylinders (replotted from 84/7) inders (replotted from 84/7)
FOR REFERENCESOFIHE VARIOUS INVESTIGATORS FOR REFERENCE "BURSNALL AND LOFTIN "SEE (84/7)SEE [8017J).
30 POLH4MUS Jodo. T_Cd DELANYSO ENSE L12-- _,C
20 OI0 ~ _V
1-0080 0
0178-- I
Q30 - 42
on 5 04 -17
4105 2 4 6 8106 2 i
W 4 6 8107 0I IIII[l[ I
105
2 4 6 8 106
2 4 6 8 o7
FIGURE 4.2.7: Influence of corner radius POff
on drag coefficient of modified squarecylinder (replotted from 64/7) FIGURE 4.2.8: Effect of angle of attack
(yaw) on normal force coefficient for acircular cylinder (replotted from 84/7)
Symmetric/ s m eti~ Asymmetric/Steady Steady O Unsteady
Ni
a. Typical conditions visualized by the hydrogen -bubble technique [87/4]
FIGURE 4.2.9: Flow domains of slenderbodies

66
30 1 1sg)o LJIKEFLOW CNLAMINAR SEPARATION
60 LSTEADY ASYMMErRIC 20 - .~ LZ I6
VORTEXORE LO .,1-
20(~ Bunaresfo a oiv -cyinerboy 1 2 3 4 5 6 7 6D9
FIGRE4.10 Forma frce coeffici n
l-.RICA &. -Cak 0VACR20 E~LW 1 0 O COSFOWSE
FIUR 4..0 NormaRl Sore cefien
-CRCRIICICAL03
00; 2 IV- USCR CR
CA 6 RI 8 104 7 VPRO
80 8, 0 2P 07 0 1 SE 7 42,11)
05 2 S 06 2 5 aa. a=30 Re
FIGURE 4.2.11: Effect of angle of attackon normal force coefficient for a slender FIGURE 4.2.2: Effect of Mach number onbody. M., =0.50 normal force coefficient for an ogive-Data of Hartmann [78/5) and Foley (m=30* cylinder body [78/51only [71/10])
25 Z
20
10 k 2 o" bEA 21
wS 2 a.6015 0 2 ROD 107 Roll angle dependence of total side force coefficients
FIGURE 4.2.12: Concluded FIGURE 4.2.13: Roll angle dependence oftotal side force coefficients 187/41
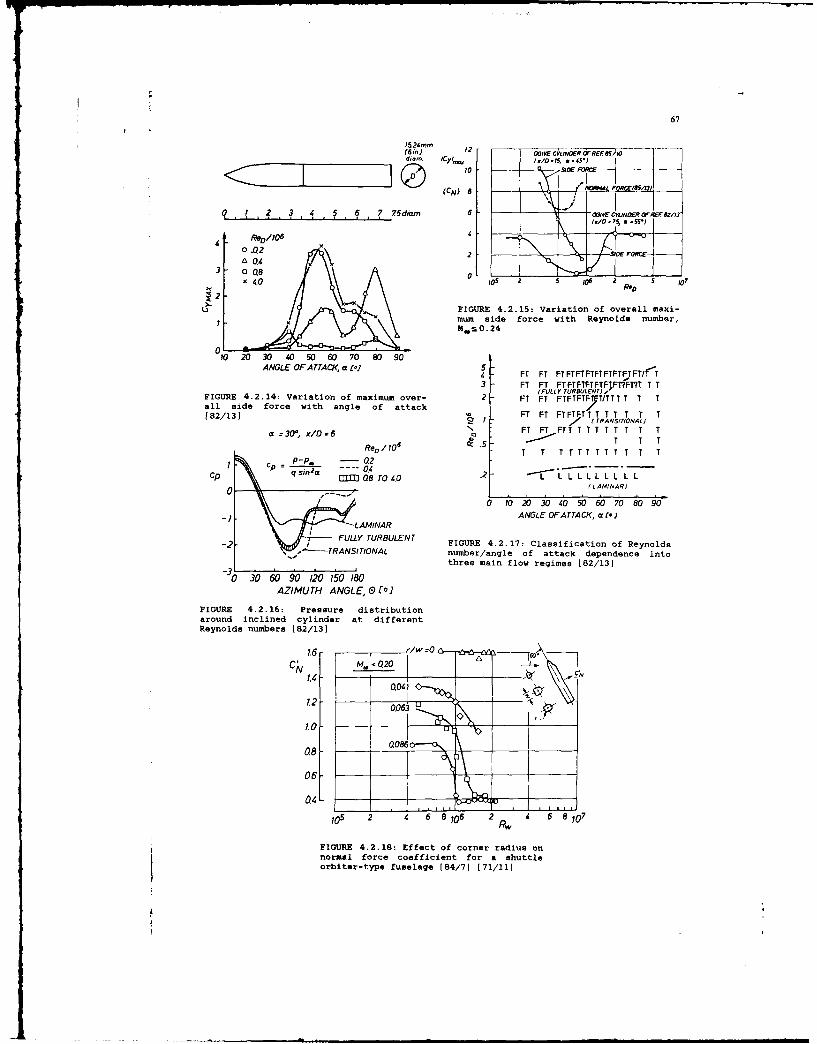
67
1524mm61n) 2 - OGECYLNDER 12 REE.j/t0
diam icy/0.IS .453)
2 - FOR E O
Z I E I ] 0 SID _ _
GUN) 4.2.15 Var ation L FORCEall ____
~72 4 5 6 75diam 6 V113ICEORE6Zt
0 .0 24a 04
.0 20 2 4 50E0 FORCE
3 - F 0TF T0 TTx 40 05 2 £ 0 2 Re" 5 07
FUFIGURE 4.2.15: Variation of overall maxi-mum side force with Reynolds number,K.: 0. 24
70 20 30 40 S0 60 70 80 90ANGLE OF A TACK( a t-1 5L
4 - FT FT FTrFTFTFTFTFTFTFTFT T3 - FT FT FTFTFTFTFTFjFTi1FTT T T
FIGUR 4.2.14: Variation of maximum over- 2 FULLYTFFT~ TURTTTVTall sid force with angle of attack F TFFFFTTT[82/13] FT FT FTFTFTT T TT T T T
/ (rRANSTONALJo FT FT FT T T T T T T T T T
S30", x/O6 R.T T T
Re/06
T T T I T T T T T T T
- -. 02*1 7N __ 0.4
Cp q s.n2 0r 8 To 0 LL LLL LL L LcL AMINAR)
,0 10 20 3o0 40 50 60 70 80 90L N ANGLE OFATTACK, a t- I
- /LAMINAR
" J - FULLY TURBULENT-2 7,-FULLY TURBULENT FIGURE 4.2.17: Classification of ReynoldsS.A TRANSITIONAL number/angle of attack dependence into
three main flow regimes 182/131
"30 0 0 120 150 1 0AZIMUTH ANGLE, e [o]
FIGURE 4.2.16: Pressure distributionaround inclined cylinder at differentReynolds numbers [82/13)
, M. 20 --
0.047
1.0 1
0.6
04
105 2 4 6 8 106 2 Rw 4 6 8 ,07
FIGURE 4.2.18: Effect of corner radius onnormal force coefficient for a shuttleorbiter-type fuselage [84/71 [71/111
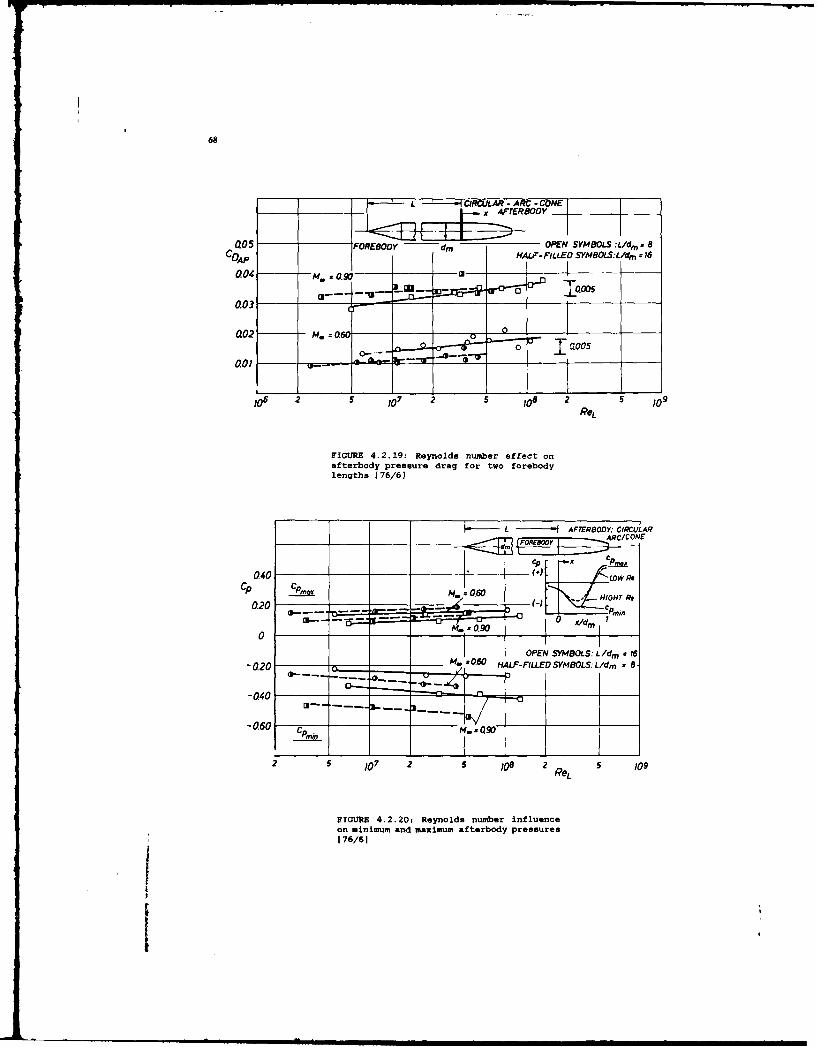
68
_____CU -ARC__ - CON
0105 .FORE8oDy d. OPEN SYMBOLS :Lldtn 8COAP HALF-FLLED SYMfBOLS:L/dm 15
0.030
0.01
o6 2 5 o7 2 5 [0o 2 5 0ReL
FIGURE 4.2.19. Reynolds number effect onafterbody pressure drag for two forebodylengths 176/61
.- L -i jAFTER80DY: CI#RCULAR
0.40 1.)LOW Re
CP CP., !; P 0.60 H rP
0.20MLa(C6 nE!E M, 0 900 x/dm
01
OPEN SYMBOLS: L/dm - 16
-020 ____ M- 060 HALF-FILLED SYMBOLS; L/dmo - 8-
-040
-060 C .- 9
2 5 107 2 5 108 2 e 5 log
FIGURE 4.2.20: Reynolds number influenceon minimum and maximum afterbody pressures[76/61
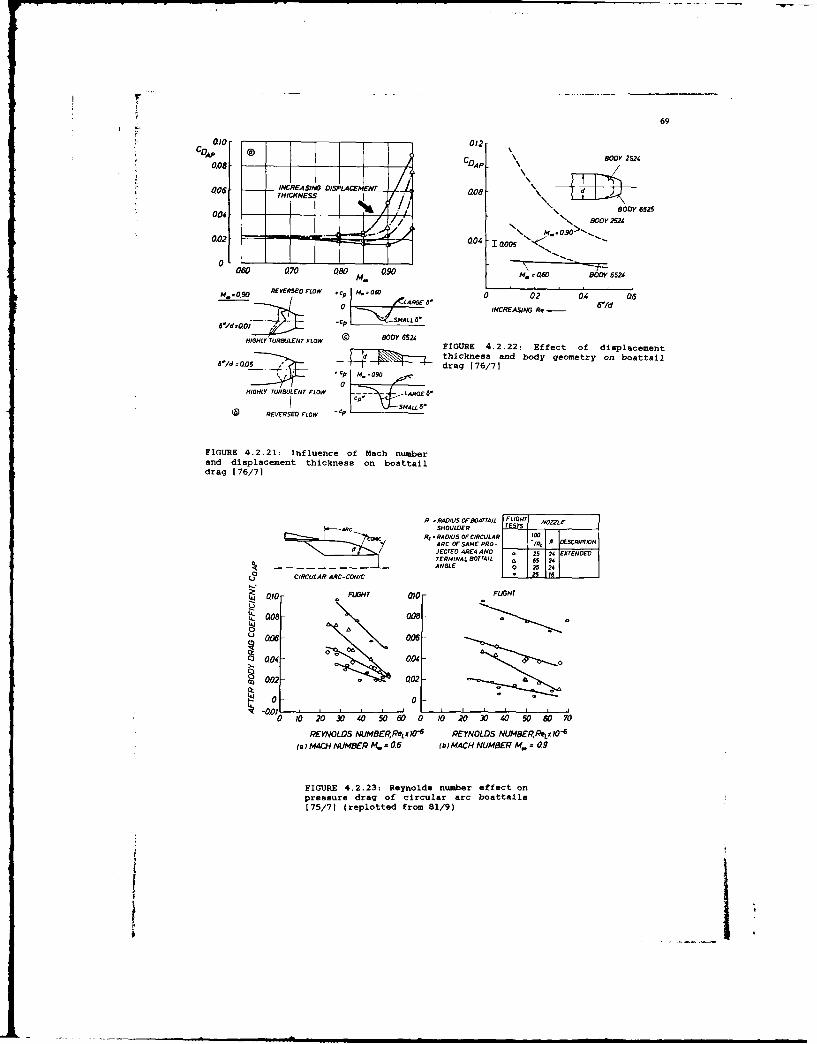
69
0JO 012
COAP I0.08 . C--p \ BODY 2S24
006 - NCREASS DISPLACEMENT- 008 \
004 - L.BODY 6525
060 070 080 090 M. Bo0 BODY 6524M.. +9o vE~~o FW M . ,
,..0 RE VERSED FLOW *CP M. . 060 0 02 0.4 06INCREASING Re
;*d 7 -co P6
HIGHLY TURBULENT FLOW ( BODY 6524FIGURE 4.2.22: Effect of displacement
dthickness and body geometry on boattall8/d , -- drag [76/71
Cp M* 090
HIGHLY TURBULENT FLOW AE
" "SMALL 6'( VRSEO FOW "CP
FIGURE 4.2.21: Influence of Mach numberand displacement thickness on boattaildrag 176/71
V .N9ADU5 OF'9047TArI I FLIGHT NOZZLESHOULDER TESTS
- Re-RADIUS OF CIRCULAR toARC OF SAME PRO- IN1 A RfPTIONJECT O AREA AND 25 24 EXTENDEDTERMINAL sOTRAIL a 65 2
- - - ,ANGLE 25 24o CfRCULAR ARC-CONIC 2 5 16
010 FLIGHT 010 FLIGHT
008- 0.08
006- 006
002 002
c00 004 aI0 0
-* '0 60 0 ,0 20 6' 4 0 0 70
REYNOLDS NUMBEReLV IO" REYNOLDS NUMBERReLx106
(a) MACH NUMBER M. - 0.6 ( b) MACH NUMBER M. 0.9
FIGURE 4.2.23: Reynolds number effect onpressure drag of circular arc boattalle175/71 (replotted from 81/9)
i i
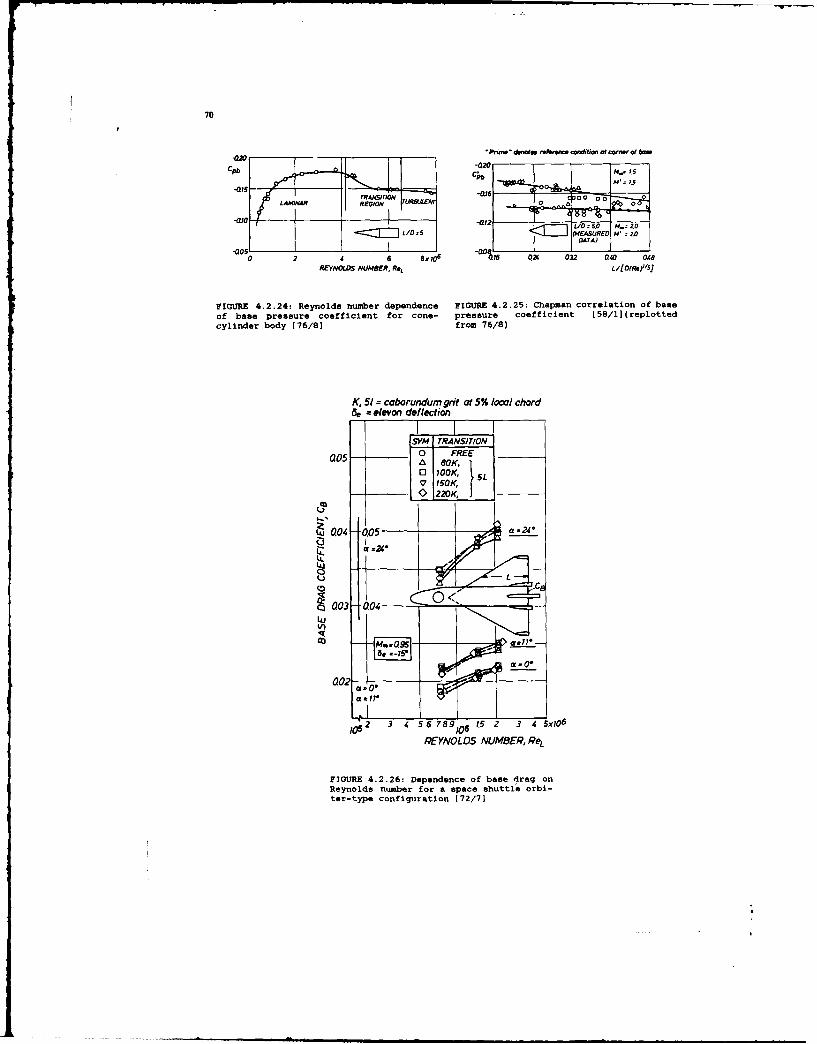
70
'Ptiwn* denOtin stews cwsndin at cwnor of bmn
Cpb C;,b M .
0~~~-w-l 2 6' ISo ~ 6 Q 03 R R
TRANITIONUAR o. o /( R0'
KYW 5UMER cbrundu grit t5% oclchor
5e = elevan deflection
SYM I RANSIflON005* FREE'005- - 80K.
* 1OOK, 5LS150K,O220K,1
____ 004_ W3a=24.
Lm j ___ B5C
S)003 .04 4LaJV)
0020
5.V7
052 3 4 56 789 1615 2 3 4 Sx706
REYNOLDS NUMBER, ReL
FIGURE 4.2.26: Dependence of base drag onReynolds number for a space shuttle orbi-ter-type configuration [72/71

71
5. CONCLUDING REMARKS
Reynolds number effects in transonic flow were critically reyiewed. In this review,the following geometries were considered: Airfoils and high aspect ratio wingstypical of transport aircraft configurations, fighter-type low aspect ratio deltawings, two- and three-dimensional bodies characteristic of missiles and combataircraft fuselages, and afterbodies. Furthermore included in this review werepseudo-Reynolds number effects which may arise, for instance, due to the influenceof the Reynolds number on the wind tunnel environment, and, as an introduction tothe present topic, a brief review of the "history" of Reynolds number effectsassociated with transonic flow.
It was originally envisaged to also present a section on fundamental Reynoldsnumber effects covering the influence of the Reynolds number on the boundary layerdevelopment, including transition, and on basic viscous / inviscid interactionssuch as shock boundary layer interaction and trailing edge separation; however,since this subject is comprehensively discussed in the report of the AGARD WorkingGroup 09 "Boundary Layer Simulation and Control in Wind Tunnels", which will bepublished concurrent with the present AGARDograph, it was decided to omit thatdiscussion here.
Systematic study of Reynolds number (scale) effects, which commenced some timeafter second world war when transonic flight itself became a matter of thoroughscientific study and which obtained new impetus after Loving of NASA published hisreport on the large differences between C-141 wind tunnel and flight results in1966, frequently reveal "anomalieb" which can be traced to the wind tunnel envi-ronment and measuring techniques and their response to Reynolds number changes.Such "anomalies", sometimes labeled as "unit"-Reynolds number effects, are betterdescribed as "pseudo"-Reynolds number effects with the Reynolds number influencingthe wind tunnel environment which, in turn, affects the flow about the model.Factors which have the potential of introducing pseudo-Reynolds number effectsinclude wall interference, tunnel Mach number calibration, noise, turbulence,humidity, non-uniform flow (flow angle, temperature, pressure gradients), flowcontamination, side wall effects in two-dimensional tests, model deformation andtransition fixing. Here are examples of the manifestation of pseudo-Reynolds numbereffects: Changing Reynolds number was found to change the characteristics of par-tially open wind tunnel walls, hence the magnitude of wall interference for a givenmodel, and therewith, for instance, the effective freestream conditions. Noise andturbulence may affect the transition location; noise and turbulence tend toincrease due to an increase in wind tunnel power, the latter required to raiseReynolds number. Transition location may be influenced directly by an increase inReynolds number and, superimposed, via the change in turbulence and noise level.In the same way - although the influence seems to be small - the effect of noiseand turbulence intensity on the turbulent boundary layer development may induce apseudo-Reynolds number effect. Humidity alters the pressure distribution includingshock location; humidity effects change with total pressure, the latter utilizedto alter Reynolds number. Wind tunnel contamination by particles small enough tobe airborne and simultaneously hard enough to cause roughening of model surfacesin the stagnation region may contribute to pseudo-Reynolds number effects in adifferent way: Roughness in the stagnation region can cause premature transitionthus obscuring the "true" influence of Reynolds number on transition point move-ment.
Tunnel calibration must be performed at all total pressure and temperature condi-tions that are expected during the actual model tests since the relation betweenthe average test section Mach number and the reference Mach number may be Reynoldsnumber dependent. Also considered in that regard should be flow non-uniformities,i.e., spatial gradients of pressure, temperature and angle of attack, for instance,and their Reynolds number dependence. Especially in two-dimensional flow, theinfluence of the Reynolds number on the side wall boundary layer development maycause spurious effects on the flow about the model which may falsely be interpretedas real Reynolds number effects; proper treatment of the side wall boundary layeror a sufficiently large aspect ratio ( a 2.5) is required to avoid these influences.Undesireable thermal non-equilibrium, i.e., undesireable deviations of the modelwall temperature from adiabatic wall conditions, may occur in short duration windtunnels, for instance, due to the throttling process in the control valve, or incontinuous (cryogenic) wind tunnels when Reynolds number is varied by temperaturechanges and time is not allotted for the model to acquire adiabatic wall temper-ature. Thermal non-equilibrium has a considerable influence on the boundary layerdevelopment and hence on aerodynamic parameters sensitive to viscous changes. Modeldeflections may easily introduce peoudo-Reynolds number effects if the deflections
I
72
are a result of changes in the model load associated with increasing total pressure;model deflections must be accounted for. Finally, transition fixing may be accom-panied by pseudo-Reynolds number effects if the height of the roughness element,utilized to force transition , is not adjusted to the freestream conditions,including Reynolds number itself, and over- or underfixing occurs resulting ineither too thick a boundary layer or transition taking place downstream of thetripping devlice.
Considering "true" Reynolds number effects on transport-type airfoils and wings,the available information suggests that two phenomena are of primary importance,especially when regarding the Reynolds number difference between wind tunnel andflight: transition point movement, itself and in conjunction with laminar versusturbulent shock boundary layer interaction, and flow separation, either locallynear the trailing edge or of large scale between shock and trailing edge on theupper airfoil or wing surface. When transition is fixed artificially, Reynoldsnumber effects are mainly related to flow separation; large variations in thepressure distribution and correspondingly in the force and moment coefficients wereobserved with Reynolds number when separation extended from the foot of the shockto the trailing edge, and especially, when the flow changed from an attached to aseparated condition as Reynolds number is decreased (or vice versa). For conditionswith attached or almost attached flow, Reynolds number effects appear to be smal-ler, though certainly not insignificant: A limited region of trailing edge sepa-ration, which frequently exists on rear loaded wing sections, tends to increasethe Reynolds number effect and some aerodynamic characteristics, notably drag andpitching moment, are very sensitive to these small variations in the separatedregion with Reynolds number. Note, that the boundary between attached and separatedflow as a function of Mach number and angle of attack varies itself with Reynoldsnumber in a systematic way. . If conditions are such that the separation locationdoes no longer change with Reynolds number, its effect on the overall flow devel-opment is also small.
The second phenomenon to be considered in conjunction with observed Reynolds numbereffects is the transition point movement occurring due to a change in Reynoldsnumber if transition is left free. Transition point movement has an effect on theflow development (e.g., separation) similar to a "pure" Reynolds number change.However, the effect of transition movement is much more pronounced since the changein the initial boundary layer parameters, which determine the overall flow devel-opment, is much greater than for the associated Reynolds number change with tran-sition fixed. Concerning low Reynolds number wind tunnel tests and the scaling ofresults to full-scale conditions, uncontrolled transition point movements shouldbe avoided, e.g., by adequately fixing transition (see the report of the AGARD WG09), since misleading variations in the aerodynamic characteristics may occur ifthe transition point can move around freely.
Available data for low aspect ratio fighter-type configurations depicting Reynoldsnumber effects are sparse. No systematic investigations, other than few forsharp-edge delta wings, have been conducted in a sufficiently wide Reynolds numberrange to allow firm conclusions to be made. The data which are available, however,suggest for most of the flight regime of interest that Reynolds number effects aresmall to nonexistent, the boundary layer state being controlled by leading edgecontamination or cross flow instability.
The Reynolds number sensitivity of bodies, typical of missiles and fighter aircraftfuselages, is also strongly related to separation, and one can distinguish essen-tially four (classical) Reynolds number domains: Subcritical, in which the flowis laminar and laminar separation occurs without reattachment, critical, in whichseparation is transitional with turbulent reattachment and a subsequent far-aftturbulent separation, supercritical, in which separation is turbulent and thetransition point moves upstream to the vicinity of the stagnation point withincreasing Reynolds number, and hypercritical, in which the flow, including sepa-ration, is fully turbulent. The flow is not very sensitive to viscous changes inthe subcritical (laminar) and the hypercritical (fully turbulent) Reynolds numberdomains since the separation location is essentially fixed. Especially in thecritical Reynolds number range, large changes in the aerodynamic forces - largedecreases in drag and normal force for the cylinder in cross flow and the three-dimensional body at angle of attack, respectively - occur due to the sensitivityof transitional separation to Reynolds number. Note, that for a three-dimensionalbody the boundary between the various Reynolds number regimes is angle of attackdependent.
The Reynolds number sensitivity in the critical and supercritical Reynolds numberdomains disappears with increasing Mach number due to the development of supersonicregions with terminating shock waves strong enough to separate even the turbulentboundary layer. The freestream velocity at which this happens is, for a three-di-

73
mensional body, again dependent on incidence. Distributed or single roughness ina form that fixes transition well upstream of separation also strongly reduces theReynolds number sensitivity, as do bodies with corner radii that essentially fixseparation.
At subsonic freestream Mach numbers and in the absence of major flow separation,significant but compensating pressure changes occur on afterbodies such that thereis little effect on afterbody pressure drag as Reynolds number is varied. Signif-icant increases in drag with increasing Reynolds number were consistently observedfor subsonic Mach numbers above the transonic drag rise and at supersonic Machnumbers. However, also observed were flow developments, e.g., on boattails mountedbehind underwing nacelles, where the boattail drag decreased with increasingReynolds number. One reason for this behavior may be the positive effect of Rey-nolds number on separation, hence on pressure recovery, rather than on the valueof the suction peak, as was the case for the configurations for which an increasein pressure drag with Reynolds number was observed.
The sensitivity of the flow development about transonic flight vehicles to Reynoldsnumber changes illustrated in the present AGARDograph and the lack of sufficienthigh Reynolds number facilities, indicate the necessity to provide generallyaccepted means and ways to scale lower-than-flight Reynolds number results tofull-scale conditions. This topic was not addressed to any extent since it was thetask of the AGARD Working Group 09, "Boundary Layer Simulation and Control in WindTunnels", to provide a methodology for transonic wind tunnel testing and theextrapolation of low Reynolds number wind tunnel results to flight conditions. Theresults of the deliberations of that Working Group are published as an AGARD-reportwhich contains, besides the said methodology, also a review of the present state-of-the-art in transonic wind tunnel testing, especially with regard to boundarylayer simulation as well as a critical assessment of the physical background ofviscous simulation. The present AGARDograph should be considered as complementaryto the WG 09-report.
I

75
REFERENCES
43/1 A. Fage "Effect on Aerofoil Drag of Boundary-Layer Suction BehindR. F. Sargent a Shock Wave." Aeronautical Research Council R & M 1913,
October 1943.
45/1 B. Goethert "German High-Speed Wind Tunnel Results Collected by Rae."W. A. Mair Tech. Note No. Aero 1684 ARC 9064, August 1945.
46/1 J. Ackeret "Investigation of Compression Shocks and Boundary LayersF. Feldmann in Fast Moving Gases." Institut fuer Aerodynamik E.T.M.N. Rott Zuerich Report No. 10, 1946.
48/1 J. A. Beavan "Measurements of Maximum Lift on 26 Aerofoil Sections atHigh Mach Number." Aeronautical Research Council R & M2678, January 1948.
48/2 V. Outman "Transonic Separation." Journal of the Aeronautical Sciences,A. A. Lambert Vol. 15, 1948, p. 671.
51/1 H. E. Gamble "Some Effects of Reynolds Number on a Cambered Wing atHigh Subsonic Mach Number." RAE Report No. Aero 2423 ARC14, 448, May 1951.
51/2 G. E. Cooper "Schlieren Investigation of the Wing Shock Wave Boundary-R. S. Bray Layer Interaction in Flight." NACA RMA 51909 (NACA/TIB/
2760) ARC 14, 485 - F.M. 1642, 1951.
51/3 H. J. Allen "A Study of Effects of Viscosity on Flow over SlenderE. W. Perkins Inclined Bodies of Revolution." NACA Rep. 1048, 1951.
52/1 G. E. Gadd "Interaction between Wholly Laminar or Wholly TurbulentBoundary Layers and Shock Waves Strong Enough to CauseSeparation." Journal ofthe AeronauticalSciences, Vol. 20, No.11, Nov. 1952, pp. 729-739.
52/2 B. E. Tinling "The Effects of Reynolds Number at Mach Numbers up toA. E. Lopez 0.94 on the Loading on a 35-Deg, Swept-Back Wing Having
NACA 65 lA012 Streamwise Sections." NACA RM A52 B20,June 1952.
53/1 D. Xuohemann "Types of Flows on Swept wings." Journal of the RoyalAeronauticalSociet, Vol. 57, November 1953, pp. 683-699.
54/1 H. H. Pearcey "Examples of the Effect of Shock-Induced Boundary-LayerD. W. Holder Separation in Transonic Flight." Aeronautical Research
Council Technical Report, R & M No. 3510, 1954 (re-issued 1967).
54/2 A. B. Haines "Scale Effects at High Subsonic and Transonic Speeds,D. W. Holder and Methods for Fixing Boundary-Layer Transition inH. H. Pearcey Model Experiments." Aeronautical Research Council Tech-
nical Report R & M No. 3012, September 1954.
55/1 D. W. Holder "The Interaction between Shock Waves and Boundary Layers."H. H. Pearcey Aeronautical Research Council Technical Report C.P. No.G. E. Gadd 180, 1955.
55/2 H. H. Pearcey "Some Effects of Shock-Induced Separation of TurbulentBoundary Layers in Transonic Flow past Airfoils."Aeronautical Research Council Technical Report, R & MNo. 3108, June 1955 (re-issued 1959).
58/1 D. R. Chapman "Investigation of Separated Flows in Supersonic and Sub-D. M. Kuetin sonic Streams with Emphasis on the Effect of Transition."H. K. Larson NACA Report R-1356, 1958.
60/1 E. W. E. Rogers "An Introduction to the Flow about Plane, Swept-Back WingsI. M. Hall at Transonic Speeds." Journal oftheRoyalAeronauicalSociety,
Vol. 64, p. 449 (1960).
60/2 J. Seddon "The Flow Produced by Interaction of a TurbulentBoundary Layer with a Normal Shock Wave ot StrengthSufficient to Cause Separation." Aeronautical ResearchCouncil R & M 3502, 1960.
61/1 H. H. Pearcey "Shock-Induced Separation and Its Prevention by Designand Boundary-Layer Control." From: Boundary Layerand FlowControl, Vol. 2, G. V. Lachmann, ed., Pergamon Presq,1961.
F
76
62/1 H. H. Pearcey "The Aerodynamic Design of Section Shapes for SweptWings." Advances in Aeronautical Sciences, Vol. 3, London,1962.
62/2 R. C. Lock "An Equivalence Law Relating Three- and Two-DimensionalPressure Distributions." NPL Aero Report 1028, 1962.
63/1 A. A. Pouring "An Experimental and Analytical Investigation of Homo-geneous Condensation of Water Vapor in Air during RapidExpansion." Ph. D. Dissertation, Yale University, 1963.
63/2 J. B. Peterson, Jr. "A Comparison of Experimental and Theoretical Results forthe Compressible Turbulent Boundary-Layer Skin Frictionwith Zero Pressure Gradient." NASA TN D-1795, 1963.
64/1 A. Stanbrook "Possible Types of Flow at Swept Leading Edges." Aero.L. C. Squire nautical Quarterly, Vol. XV, 1964, pp. 72-82.
66/1 D. L. Loving "Wind Tunnel Flight Correlation of Shock-Induced Separ-ated Flow." NASA TN D-3580, 1966.
66/2 F. Thomas "The Determination of Buffet Boundaries for Wings in theTransonic Speed Regime." Wissenschaftliche Gesellschaftfur Luft- und Raumfahrt, 1966, pp. 126-144.
67/1 B. f. Little "Effects of Initial Turbulent Boundary Layer on Shock-Induced Separation in Transonic Flow." VKI TechnicalNote No. 39 (1967).
68/1 J. A. Blackwell "Effect of Reynolds Number and Boundary Layer TransitionLocation on Shock-Induced Separation." AGARD CP 35,September 1968, Paper 20.
68/2 H. H. Pearcey "The Interaction between Local Effects at the Shock andJ. Osborne Rear Separation -- A Source of Significant Scale EffectsA. B. Haines in Wind Tunnel Tests on Aerofoils and Wings." AGARD CP
35, September 1968, Paper 11.
68/3 M. C. P. Firman "Detailed Exploration of the Compressible Viscous FlowT. A. Cook over Two-Dimensional Airfoils at High Reynolds Numbers."
ICAS Paper No. 09/68, Munich, September 1968.
68/4 H. Schlichting "Boundary-Layer Theory." McGraw Hill, New York, 1968 (SixthEdition).
69/1 M. Pindzola "Boundary Interference at Subsonic Speeds in Wind TunnelsC. F. Lo with Ventilated Walls." AEDC-TR-69-47 (AD-687440), May
1969.
69/2 S. R. Pate "Effects of Radiated Aerodynamic Noise on Model Boundary-C. J. Schueler Layer Transition in Supersonic and Hypersonic Wind Tun-
nels." AEDC-TR-67-236 (AD-666644), March 1969. (AlsoAIAA Journal, Vol. 7, March 1969, pp. 450-457.)
70/1 J. E. Green "Interaction between Shock Waves and Turbulent BoundaryLayers." Progress in Aerospace Sciences, Vol. II, PergamonPress, 1970 (Ed. D. Kuechmann).
70/2 E. G. "Comparison of Wind Tunnel and Flight Test Techniques forHollingsworth Determining Transonic Buffet Characteristics on theM. Cohen McDonnell Douglas F-4 Airplane." AIAA Paper 70-584, May
18-20, 1970.
71/1 E. Stanewsky "Studies of Separation and Reattachment in Transonic Flow."B. H. Little Journal ofAircraff, Vol. 8, No. 12, December 1971, pp. 952-
958.
71/2 J. E. Green "Some Aspects of Viscous-Inviscid Interactions at Tran-sonic Speeds and Their Dependence on Reynolds Number."AGARD CP 83, April 1971, Paper 2.
71/3 A. B. Haines Possibilities for Scale Effects on Swept Wings at HighSubsonic Speeds: Recent Evidence from Pressure PlottingTests. AGARD CP 83, April 1971, Paper 14. (Also ARAReport 18, 1971.)
71/4 J. F. Cahill "Simulation of Full-Scale Flight Aerodynamic Charac-teristics by Tests in Existing Transonic Wind Tunnels."AGARD CP 83, April 1971, Paper 20.
71/5 M. G. Hall "Scale Effects in Flows over Swept Wings." AGARD CP 83-71, 1971.
77
71/6 J. E. Green "Some Aspects of Viscous-Inviscid Interactions at Tran-sonic Speeds and Their Dependence on Reynolds Number."AGARD CP 83-71, 1971.
71/7 E. Thomas "A Method for Calculating the Transonic Buffet BoundaryG. Redeker Including the Influence of Reynolds Number." AGARD CP
83-71, 1971.
71/8 J. Osborne "A Type of Stall with Leading-Edge Transonic Flow andH. H. Pearcey Rear Separation." AGARD CP 83-71, 1971.
71/9 E. J. Salzman "A Comparison of Some Aerodynamic Drag Factors as Deter-D. R. Bellman mined in Full-Scale Flight with Wind Tunnel and Theo-
retical Results." AGARD CP 83-71, 1971.
71/10 J. E. Foley "Results of a Study of Mach Number and Reynolds Numberon the Cross Flow Drag Characteristics of Ogive-Cylinderand Ogive-Cylinder-Frustrum-Cylinders at Angles of Attackto 30 Degrees." NASA CR-61356, October 1971.
71/11 J. J. Brownson "Static Stability Characteristics of Manned SpacecraftR. E. Graham Center Straight-Wing Space Shuttle Orbiter: Effect ofD. Banducci Reynolds Number and Body Corner Radius at M < 0.5."
NASA TM X-62, 054, 1971.
72/1 LaWs Group "The Need for Large Wind Tunnels in Europe." AGARD ARNo. 60, 1972.
72/2 M. G. Hall "Difficulties in Predicting Boundary-Layer Transition onD. A. Treadgold Swept Wings." RAE Technical Memorandum Aero 1465, ARC
35160, 1972.
72/3 Ms. G. C. Browne "A Comparison of Wing Pressure Distributions Measured inT. E. B. Bateman Flight and on a Wind Tunnel Model of the Super VC-10."M. Pavitt Aeronautical Research Council R & M 3707, 1972.A. B. Haines
72/4 "The High Reynolds Number Tunnel -- A National Need --Description and Justificdtion." AEDC, February 1972.
72/5 J. P. Hartzuiker "Scale Effects at Transonic Speeds; Basic Considera-tions." Notes for AGARD/VKI Short Course, "TransonicAerodynamic Testing," 1972.
72/6 J. W. Green "Heat Transfer as a Source of Spurious Scale Effects inD. J. Weeks Subsonic and Transonic Wind Tunnels." AGARD Laws PaperP. G. Pugh No. 135, 1972.
72/7 E. Stanewsky "Effect of Reynolds Number and Transition on the Aero-dynamic Coefficients of the MSC 040 A Orbiter at Tran-sonic Speeds." DFVLR/AVA-Report 062. 72 A 18, 1972.
73/1 J. H. Paterson "A Survey of Drag Prediction Techniques Applicable toD. G. McWilkenson Subsonic and Transonic Aircraft Design." AGARD CP-124,W. T. Blackerby April 1973.
73/2 J. E. Green "On the Influence of Free-Stream Turbulence on a Turbu-lent Boundary Layer as it Relates to Wind Tunnel Testingat Subsonic Speeds." AGARD-AR-602, April 1973.
74/1 LaWs Group "The Need for a Large Transonic Tunnel in Europe." AGARDAR No. 70, 1974.
74/2 F. Aulehla "Fore- and Afterbody Flow-Field Interacti-n with Consid-G. Besigk erations of Reynolds Number Effects." AGARD CP 150,
Paper 12, September 1974.
74/3 S.O.T.H. Han "On the Effect of Variation of Transition Position andJ. P. Hartzuiker of Vortex Generators on the High-Speed Stall Charact-
eristics of a Swept-Wing Transport Aircraft Model." NLRTR 74008 U, 1974.
74/4 R. Chamberlin "Flight Reynolds Number Effects on a Contoured BoattailNozzle at Subsonic Speeds." NASA TM-X-3053.
75/1 L. L. Galigher "Description of the AGARD Nozzle Afterbody ExperimentsF. M. Jackson Conducted by the Arnold Engineering Development Center."C. E. Robinson AGARD-AG-208, October 1975.
75/2 W. T. Blackerby "High Reynolds Number Tests of a C141A Aircraft Semi-SpanJ. F. Cahill Model to Investigate Shock-Induced Separation." NASA CR
2604 (1975).
78
75/3 K. P. Burdges "High Reynolds Number Test of a NACA 651-213, a = 0.5J. A. Blackwell, Jr. Airfoil at Transonic Speeds." NASA CR-2499 (1975).G. A. Pounds
75/4 H. Yoshihara "The Many Facets of 3D Transonic Shock-Induced Separa-D. Zonars tion." AGARD CP 168 Paper 42 (1975).
75/5 S. Teige "Swedish Experience on Correlations of Flight ResultsG. Strang with Ground Test Predictions." Paper 21, AGARD-CP-187,K. E. Stake June 1975.
75/6 H. Each "The Influence of Reynolds Number on the Normal ForceCharacteristics of Slender Cylindrical Bodies." ESA TT-170, 1975.
75/7 F. A. Wilcox "Reynolds Number Effects on Boattail Drag of ExhaustR. Chamberlin Nozzles from Wind Tunnel and Flight Tests." AGARD-CP-
150, Paper 21, 1975.
76/1 D. J. Weeks "An Investigation of Scale Effects on the Transonic Flowover Swept Wings." Part I, Aeronautical Research CouncilR & M 3842, 1976; Part 2, Aeronautical Research CouncilR & M 3842, 1977.
76/2 A. B. Haines "Further Evidence and Thoughts on Scale Effects at HighSubsonic Speeds." AGARD CP NO. 174, March 1976, Paper43.
76/3 "Workshop on High Reynolds Number Research." NASA CP-2009 (1976).
76/4 J. A. Blackwell, Jr. "Scale Effects on Advanced Aircraft Wing Designs." Pro-ceedings of the Lockheed-Georgia Company Viscous Flow Symposium,"Reviews in Viscous Flow." LG77 ER 0044, June 1976.
76/5 J. L. Jacocks "An Investigation of the Aerodynamic Characteristics ofVentilated Test Section Walls for Transonic WindTunnels." Ph.D. Dissertation, University of Tennessee,December 1976.
76/6 D. E. Reubush "An Experimental and Analytical Investigation of theL. E. Putnam Effect on Isolated Boattail Drag of Varying Reynolds
Number up to 130 x 106." NASA TN D-8210, May 1976.
76/7 B. J. Blaha "Boundary Layer Thickness Effect on Boattail Drag." NASAR. Chamberlin TM-X-73443, 1976.L. J. Bober
76/8 S. N. B. Murthy "Base Flow Phenomena with and without Injection: Experi-J. R. Osborn mental Results, Theories and Bibliography." Progress in
Astronautics and Aeronautics, Vol. 40, Aerodynamics of BaseCombustion, 1976.
77/1 J. Szodruch "Leeseiten-Stromung bei Schlanken Delta flugeln endlichierDicke ILR Breicht 23." Technical Universtat Berlin,1977.
77/2 G. F. Butler "Preliminary Investigation of a Technique for PredictionD. C. Conner Loads in Flight from Wind Tunnel Measurements on Models
of Conventional." Construction AGARD CP 204, February1977.
77/3 J. F. W. Crane "The Effect of Base Cavities on the Drag of anAxisymmetric Afterbody with a Sonic Nozzle between M-= 0.8 and 1.3." RAE TR 77 144, 1977.
78/1 J. A. Blackwell, Jr. 'Scale Effects on Supercritical Airfoils." Proceedingsofthe XlCongressoflCAS, Lisbon, Portugal, 10-16 September1978, Vol, 1, Paper No. B3, pp. 370-383.
78/2 J. A. van Egmond "The Design and Aerodynamic Characteristics of an 18%D. Rozendal Thick Shock-Free Airfoil (NLR 7501)." NLR MP 78016 U,
1978.
78/3 J. W. Kooi "Influence of Free-Stream Mach Number on TransonicShock-Wave Boundary-Layer Interaction." NLR NP 78013 U,1978.
78/4 F. M. Jackson "Calibration of the AEDC-PWT 16-FT Transonic Tunnel with
the Propulsion Test Section at Various Reynolds Num-bers." AEDC-TR-77-121 (AD-A057877), August 1978.
79
78/5 K. Hartmann "Uber den Einfluss der Reynolds Zahl auf dieNonmalkrafte Schlanker Plugkdrpernimpfe." Z. Fluqwiss,Weltraum-forscg. 2, 1978, Heft 1, p. 23.
79/1 J. P. Cahill "Correlation of Data Related to Shock Induced TrailingD. C. Conner Edge Separation and Extrapolation to Flight Reynolds
Number." NASA CR 3178, 1979.
79/2 A. B. Haines "Review of Post-1974 Evidence on Scale Effects at HighSubsonic Speeds." ARA Memo No. 218, 1979.
79/3 G. T. Chapman "The Aerodynamics of Bodies of Revolution of Angles ofE. R. Keener Attack to 90 deg." AIAA Paper 79-23, 1979.
80/1 L. W. McKinney "High Reynolds Number Research - 1980." NASA ConferenceD. D. Baals Publication 2183.
80/2 0. M. Pozniak "A Review of the Effect of Reynolds Number on AfterbodyDrag." ARA Report 56, May 1980.
80/3 Y. Brocard "Etude des caracteristiques de l'ecoulement tour'-illonnaireF. Manie sur une aile en fleche." L'Aeronautique et L'Astronau-
tique No. 82, 1980-3.
80/4 N. S. Dougherty "Boundary-Layer Transition on a 10-deg Cone: Wind Tunnel/D. F. Fisher Flight Data Correlation." AIAA Paper No. 80-0154, AIAA
18th Aerospace Sciences Meeting, January 14-16, 1980.
80/5 J.P.F. Lindhout "Comparison of Boundary-Layer Calculations of the RootB. van den Berg Section of a Wing." The September 1975 Amsterdam TestA. Elsenaar Case - NLR MP 80028 U.
80/6 D. J. Peake "Three-Dimensional Interactions and Vortical Flows withM. Tobak Emphasis on High Speeds." NASA TM 81169 (1980).
80/7 "Computation of Viscous-Inviscid Interactions." AGARDCP-291, 1980.
80/8 T. L. Kennedy "An Evaluation of Wind Tunnel Test Techniques forAircraft Nozzle Afterbody Testing at Transonic MachNumbers." AEDC-TR-80-8 (AD-A091775), November 1980.
80/9 G. E. Erickson "Flow Studies of Slender Wing Vortices." AIAA Paper No.80-1423, AIAA 13th Fluid and Plasma Dynamics Conference,July 14-16, 1980.
81/1 E. Stanewsky "Wechselwirkung Zwischen Aussenstromung und Grenzschichtan Transsonischen Profilen." Dissertation, TechnicheUniversitit Berlin, May 1981.
81/2 L. C. Squire "Experimental Work on the Aerodynamics of IntegratedSlender Wings for Supersonic Flight." Progress inAerospace Science, Vol. 20, pp. 1-96. Pergamon Press Lt.1981.
81/3 T. S. Beddoes "A Note on Shock Reversal at High Lift." Westland Heli-copter Limited, Research Paper 633, 1981.
81/4 R. C. Lock "Survey of Techniques for Estimating Viscous Effects inM. C. P. Firmin External Aerodynamics." RAE Tech Memo Aero 1900, 1981.
81/5 S. J. Kline "The 1980-1981 AFOSR-HTTM-Stanford Conference on Complex(Editor) Turbulent Flows." Stanford University, 1981.
81/6 D. G. Mabey "Some Remarks on Buffeting in Unsteady Airloads andAeroelastic Problems in Separated and Transonic Flow."VKI Lecture Series 1981-4.
81/7 R. P. Boyden "Preliminary Results of Buffet Tests in a CryogenicTunnel." NASA TM 81923, July 1981.
81/8 L. L. Ericsson "Review of Vortex-Induced Asymmetric Loads - Part I."J. P. Reding Z. Fluqwiss, Weltraumforsch. 5, 1981, Heft 3, p. 162.
81/9 0. M. Pozniak "A Review of the Effect of Reynolds Number on AfterbodyDrag." AGARD-CP-301, Aerodynamics of Power Plant Instal-lation, September 1981, pp. 16-1 to 16-21.
82/1 E. J. Ray "A Review of Reynolds Number Studies Conducted in theLangley 0.3-m Transonic Cryogenic Tunnel." AIAA-82-0941.
-so
82/2 A. B. Haines "Notes on Transition Fixing and the Interpretation ofDrag Data with Different Transition Fixes." ARA Memo243, November 1982.
82/3 David Nixon "Transonic Aerodynamic Progress in Astronautics and Aero-(Editor) nautics." Vol. 81, 1982.
82/4 A. Elsenaar "A Report of a GARTEur Action Group "Two-Dimensional Tran-E. Stanewsky sonic Testing Methods." AGARD CP No. 335, Paper 5, 1982.
82/5 J. C. le Balleur "Viscid-Inviscid Coupling Calculations for Two- andThree-Dimensional Flows." VKF Lecture Series 1982-4,1982.
82-6 Y. Y. Chan 'Wall Boundary-Layer Effects in Transonic Wind Tunnels."AGARD CP-335, September 1982.
82/7 N. S. Dougherty, Jr. "Boundary-Layer Transition on a Slender Cone in WindD. F. Fisher Tunnels and Flight for Indications of Flow Quality."
AEDC-TR-81-26 (AD-A111328), February 1982.
82/8 S. Raghunathan "Free-Stream Turbulence and Attached Subsonic TurbulentR. J. W. McAdams Boundary Layer." AIAA Paper 82-0029, January 1982.
82/9 F. Aulehla "Reynolds Number Effect on Transonic Shock Location, InA. Eberle Wall Interference in Wind Tunnels." AGARD CP-335,
September 1982.
82/10 R. W. Barnwell "Similarity Rules for Effects of Sidewell Boundary LayerW. G. Sewall in Two-Dimensional Wind Tunnels." in "Wall Interference
in Wind Tunnels," AGARD CP-335, September 1982.
82/11 D. Jacob "A Comparison between Wind Tunnel and Flight Results forD. Welte Aerodynamic Performance." AGARD CP-339, October 1982.B. Wunnenberg
82/12 C. J. Spurlin "Comparison of Flight and Wind Tunnel Data on the DornierH. Lueck TST Configuration." AIAA Paper No. 84-0612-CP, March
1984.
82/13 P. J. Lamont "Pressures Around an Inclined Ogive Cylinder withLaminar, Transitional, or Turbulent Separation." AIAAJournal, Vol. 20, No. ii, November 1982, p. 1492.
83/1 M. M. S. Khan "New Considerations on Scale Extrapolation of Wing Pres-J. F. Cahill sure Distributions Affected by Transonic Shock Induced
Separation. NASA Contractor Report 166426, March 1983.
83/2 A. E. P. Veldman "A Numerical View on Strong Viscous-Inviscid Inter-action." NLR MP 83049 U, 1983.
83/3 A. Elsenaar "Experience with Transition Fixation in the High-SpeedRegime at NLR." NLR Memorandum AC-83-039 U, iIO3.
83/4 S. J. Boersen "Half-Model Testing in the NLR Nigh-Sped Wind TunnelA. Elsenaar HST: Its Technique and Application." AGARD CPP 348,
August 1983.
83/5 S. Raghunathan "Free-Stream Turbulence and Transonic Flow overa 'Bump'R. J. W. McAdams Model" AIAA Journal, Vol. 21, No. 3, March 1983, pp. 467-
469.
83/6 S. Raghunathan "Boundary-Layer and Turbulence Intensity Measurements inR. J. W. McAdams a Shock Wave/Boundary-Layer Interaction." AIAA Journal,
Vol. 21, No. 9, September 1983, pp. 1349-1350.
83/7 E. Stanewsky "Interaction between the Outer Inviscid Flow and theBoundary-Layer on Transonic Air Foils." Z. Flugwiss.,Weltraumforsch 7 (1983), Heft 4, pp. 242-252.
83/8 M. Mokry "Two-Dimensional Wind Tunnel Wall Interference." AGARDY. Y. Chan AG-281, November 1983.D. J. Jones
83/9 A. D. Young "Aerodynamics of Vortical Type Flows in Three Dimen-(Editor) sions." AGARD CP 342, July 1983.
83/10 GARTEur ACTION GROUP "Two-Dimensional Transonic Testing Methods." GARTEur/TP-AD(AG-02) 011, also NLR TR 83086U, 1983.
83/11 G. Schewe "On the Force Fluctuations Acting on a Circular Cylinderin Crosaflow from Subcritical up to TranscriticalReynolds Numbers." JournalofPluid Mechanics, Vol. 133, p.265, 1983.

81
83/12 W. Schneider "Experimental Investigation of Bodies with Non-CircularCross Section in Compressible Flow." AGARD-CP-336,February 1983, pp. 1-19 to 19-19.
83/13 D. I. A. Poll "On the Generation and Subsequent Development of SpiralVortex Flow Over a Swept-back Wing." AGARD-CP-342, July1983, pp. 6-1 to 6-14.
84/1 R. C. Luh "A Numerical Procedure to Predict the Effects of ReynoldsM. D. Mack Number and Trip Strip Variation on Three-Dimensional
Wing Lift and Pitching Moment." AIAA-84-0255, 1984.
84/2 "Grenzschtsteuerung durch transitionfixierung." DFVLR-Mitt 84-17.
84/3 S. J. Boersen "Half-Model Testing in the NLR High-Speed Wind TunnelA. Elsenaar HST: Its Technique and Application." AGARD CP 348, Paper
23, 1984.
84/4 G. Meauze "Viscous-Inviscid Flow Interaction Methods/ShockBoundary-Layer Interaction." ONERA TP 1984-114, 1984.
84/5 D. A. Johnson "A New Turbulence Closure Model for Boundary-Layer FlowsL. S. King with Strong Adverse Pressure Gradients and Separation."
AIAA-84-9175, 1984.
84/6 W. Burgsmueller "Transitionfixierung im Hochgeschwindigkeits-bereich beider Fleugelentwicklung far zivile Flugzeuge, imGrenzschichtsteuerung durch Transitionsfixierung." DFVLRMitteilung 84-17, October 1984.
84/7 E. C. Polhamus "A Review cf Some Reynolds Number Effects Related toBodies at High Angles of Attack." NASA Contract Report3809, 1984.
85/1 J. B. Doc "The T2 Cryogenic Induction Tunnel in Toulouse."AGARD/FDP Special Course "Cryogenic Technology for WindTunnel Testing," V.K.I., 22-26 April 1985.
85/2 A. G. T. Cross Report of the Review Committee of AGARD Working Group09, Section 2.2.4, "Complex Configurations" (1985) to bepublished as part of the final working group report.
85/3 P. R. Ashill "An Integral Methods for Calculating the Effects on Tur-P. D. Smith bulent Boundary Layer Development of Sweep and Taper."
Aeronautical Journal 882, February 1985.
85/4 J. L. Fulker "A Model of the Flow over Swept Wings with Shock-InducedP. R. Ashill Separation." Paper presented at the IUTAM Symposium,
"Turbulent Shear-Layer/Shock-Wave Interactions," Septem-ber 1985, Palaiseau, France.
85/5 G. R. Inger "Supersonic Viscous-Inviscid Interaction of a Swept Com-pression Ramp with a Turbulent Boundary Layer." IUTAMSymposium.
85/6 A. B. Haines Private Communication.
85/7 A. Mignosi "Fundamental Reflections on Cryogenic Testing." AGARD/FDP Special Source - Cryogenic Technology for WindTunnel Testing, V.K.I., 22-26 April 1985.
85/8 C. E. Robinson "Estimating Water Vapor Condensation Effects for Tran-R. C. Bauer sonic and Supersonic Flow Fields." AIAA Paper 85-5020,R. H. Nichols October 14-16, 1985.
85/9 S. Raghunathan "Relative Effects of Reynolds Number and Free-StreamR. J. W. McAdams Turbulence in Transonic Flow." AIAA Journal, Vol. 23, No.
4, April 1985.
85/10 R. Clock "Prediction of Viscous and Wave Drag at High SubsonicSpeeds by Viscous-Inviscid Interaction Techniques."AGARD VKI Special Course, "Aircraft Drag Prediction andReduction," May 1985.
85/11 R. E. Melnik "An Improved Inviscid/Inviscid Interaction Procedure forR. R. Chow Transonic Flows over Airfoils." NASA CR-3805, 1985.H. R. MeadA. Jameson
85/12 J. Velery "Turbulent Shock Wave Boundary Layer Interaction." AGARD-J. G. Marvin ograph No. 280, 1985.
82
85/13 V. Kanagarajan "Force Measurements on a Body-Tail-Combination at Differ-K. Hartmann ent Reynolds Numbers and Roll Angles up to Incidences of
45 Degrees." DFVLR-Report IB 222-85 A 38, 1985.
85/14 E. E. Covert "Thrust and Drag: Its Prediction and Verification." AIAA(Editor) Progress in Astronautics and Aeronautics, Vol. 98, 1985.
86/1 B. Ewald "The Accuracy Problem of Airplane Development Force Test-G. Krenz ing in Cryogenic Wind Tunnels." AIAA Paper 86-0776, AIAA
Paper 86-0776, AIAA 14th Aerodynamic Testing Conference,March 1986.
86/2 S. V. Merthy "Effects of Compressibility and Free-Stream TurbulenceF. W. Steinle, Jr. on Boundary-Layer Transition in High Subsonic and Tran-
sonic Flows." AIAA Paper 86-0764, AIAA 14th AerodynamicTesting Conference, March 1986.
86/3 Th. J. Horvath "Coherent Shedding from a Circular Cylinder at Critical,G. S. Jones Supercritical, and Transcritical Reynolds Numbers." SAEP. C. Stainback Technical Paper Series, Paper 861768, 1986.
86/4 P. Champigny "Stability of Side Forces on Bodies at High Angles ofAttack." AIAA 4th Applied Aerodynamics Conference, PaperAIA 86-1776-CP, 1986.
86/5 "Report of the Working Group on Aerodynamics of AircraftAfterbody (Chairman P. Sacher)." AGARD-AR-226, June1986.
87/1 F. Auleha "Pseudo Reynolds Number Trends, AIAA Paper 87-2612-CP."Presented at the AIAA 5th Applied Aerodynamics Confer-ence, Monterey, CA, Aug. 17-19, 1987.
87/2 F. T. Lynch "Wind Tunnel Side Wall Boundary-Layer Effects in TransonicC. B. Johnson Airfoil Testing -- Some Correctable, But Some Not."
AGARD PDP Conference on Aerodynamic Data Accuracy andQuality: Requirements and Capabilities in Wind TunnelTesting, Naples, Italy, September 28-October 1, 1987.
87/3 H. U. Meier "The Influence of Wind Tunnel Turbulence on the Boundary-U. Michel Layer Transition. Perspectives in Turbulence Studies,"H. P. Kreplin dedicated to the 75th birthday of Dr. J. C. Rotta.
International Symposium, DFVLR Research Center, Gottingen,May 11-12, 1987.
87/4 K. Hartmann "Experimental Investigation on an Ogive-Nosed Body atHigh Incidence and Different Reynolds Numbers." Inter-national Conference on Fluid Mechanics, Beijing, China,July 1-4, 1987.
88/1 AGARD WG09 "Boundary Layer Simulation and Control in Wind Tunnels."AGARD-AR-224, April 1988.
i'

REPORT DOCUMENTATION PAGE
1. Recipient's Reference 2. Originator's Reference 3. Further Reference 4. Security Classificationof Document
AGARD-AG-303 ISBN 92-835-0492-5 UNCLASSIFIED
5. Originator Advisory Group for Aerospace Research and DevelopmentNorth Atlantic Treaty Organization7 rue Ancelle, 92200 Neuilly sur Seine, France
6. Tide REYNOLDS NUMBER EFFECTS IN TRANSONIC FLOW
7. Presented at
8. Author(s)/Editor(s) 9. Date
Various December 1988
10. Author's/Editor's Address I1. Pages
Various 92
12. Distribution Statement This document is distributed in accordance with AGARDpolicies and regulations, which are outlined on theOutside Back Covers of all AGARD publications.
13. Keywords/Descriptors
Reynolds number FuselagesTransonic flow Missile airframesWind tunnels AfterbodiesAirfoils
14. Absitract (~ A-
'-., Reynolds number effects in transonic flow are critically reviewed. This review, which may be
considered a supplement to AR 224 'Boundary Layer Simulation and Control in Wind Tunnels'?is mainly concerned with a discussion of viscous effects actually observed on realisticconfigurations.
The following geometries are considered: Airfoils and high aspect ratio wings typical of transpe,aircraft, fighter-type low aspect ratio delta wings, two- and three-dimensional bodiescharacteristic of missiles and combat aircraft fuselages, and afterbodies. "Pseudo-Reynoldsnumber effects are identified which may arise, for instance due to the influence of the Reynoldsnumber on the wind tunnel environment and in turn affect the flow about a model. As anintroduction, a brief retrospect of the-'i-story"' of Reynolds number effect is presented.
This AGARDograph has been produced at the request of the Fluid Dynamics Panel of AGARD.
II!

0 0
6 . 6 -
0
<
0 oe0
z I,, Xr 'r
OZ t- 8 0 a e O
0 0~
I .200 f 0 0
0 zo. t~
o OR~ < <
0-
"a A a m0c 0U V5 U~U
M m
0 ;
0. 0
E 0
U. SR.CZ0
2, U
E~ -6 .
09
0 o
00
E E 0
.0 00
cc 0
CC
'o L.U E
~ -S OP
0 0.U~E
.9,