reynoldsburg city school district franklin … · page | 1 reynoldsburg city school district...
TRANSCRIPT
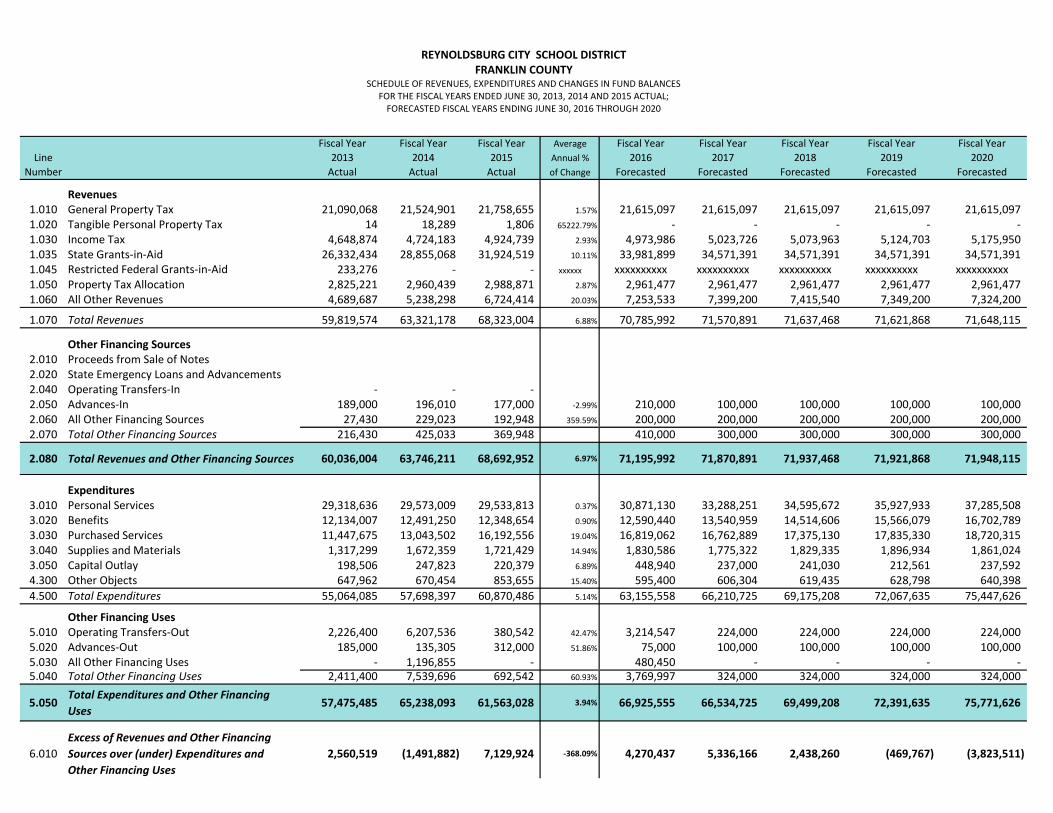
Fiscal Year Fiscal Year Fiscal Year Average Fiscal Year Fiscal Year Fiscal Year Fiscal Year Fiscal Year
Line 2013 2014 2015 Annual % 2016 2017 2018 2019 2020
Number Actual Actual Actual of Change Forecasted Forecasted Forecasted Forecasted Forecasted
Revenues1.010 General Property Tax 21,090,068 21,524,901 21,758,655 1.57% 21,615,097 21,615,097 21,615,097 21,615,097 21,615,097 1.020 Tangible Personal Property Tax 14 18,289 1,806 65222.79% - - - - - 1.030 Income Tax 4,648,874 4,724,183 4,924,739 2.93% 4,973,986 5,023,726 5,073,963 5,124,703 5,175,950 1.035 State Grants-in-Aid 26,332,434 28,855,068 31,924,519 10.11% 33,981,899 34,571,391 34,571,391 34,571,391 34,571,391 1.045 Restricted Federal Grants-in-Aid 233,276 - - xxxxxx xxxxxxxxxx xxxxxxxxxx xxxxxxxxxx xxxxxxxxxx xxxxxxxxxx1.050 Property Tax Allocation 2,825,221 2,960,439 2,988,871 2.87% 2,961,477 2,961,477 2,961,477 2,961,477 2,961,477 1.060 All Other Revenues 4,689,687 5,238,298 6,724,414 20.03% 7,253,533 7,399,200 7,415,540 7,349,200 7,324,200
1.070 Total Revenues 59,819,574 63,321,178 68,323,004 6.88% 70,785,992 71,570,891 71,637,468 71,621,868 71,648,115
Other Financing Sources2.010 Proceeds from Sale of Notes 2.020 State Emergency Loans and Advancements 2.040 Operating Transfers-In - - - 2.050 Advances-In 189,000 196,010 177,000 -2.99% 210,000 100,000 100,000 100,000 100,000 2.060 All Other Financing Sources 27,430 229,023 192,948 359.59% 200,000 200,000 200,000 200,000 200,000 2.070 Total Other Financing Sources 216,430 425,033 369,948 410,000 300,000 300,000 300,000 300,000
2.080 Total Revenues and Other Financing Sources 60,036,004 63,746,211 68,692,952 6.97% 71,195,992 71,870,891 71,937,468 71,921,868 71,948,115
Expenditures3.010 Personal Services 29,318,636 29,573,009 29,533,813 0.37% 30,871,130 33,288,251 34,595,672 35,927,933 37,285,508 3.020 Benefits 12,134,007 12,491,250 12,348,654 0.90% 12,590,440 13,540,959 14,514,606 15,566,079 16,702,789 3.030 Purchased Services 11,447,675 13,043,502 16,192,556 19.04% 16,819,062 16,762,889 17,375,130 17,835,330 18,720,315 3.040 Supplies and Materials 1,317,299 1,672,359 1,721,429 14.94% 1,830,586 1,775,322 1,829,335 1,896,934 1,861,024 3.050 Capital Outlay 198,506 247,823 220,379 6.89% 448,940 237,000 241,030 212,561 237,592 4.300 Other Objects 647,962 670,454 853,655 15.40% 595,400 606,304 619,435 628,798 640,398
4.500 Total Expenditures 55,064,085 57,698,397 60,870,486 5.14% 63,155,558 66,210,725 69,175,208 72,067,635 75,447,626
Other Financing Uses5.010 Operating Transfers-Out 2,226,400 6,207,536 380,542 42.47% 3,214,547 224,000 224,000 224,000 224,000 5.020 Advances-Out 185,000 135,305 312,000 51.86% 75,000 100,000 100,000 100,000 100,000 5.030 All Other Financing Uses - 1,196,855 - 480,450 - - - - 5.040 Total Other Financing Uses 2,411,400 7,539,696 692,542 60.93% 3,769,997 324,000 324,000 324,000 324,000
5.050Total Expenditures and Other Financing
Uses57,475,485 65,238,093 61,563,028 3.94% 66,925,555 66,534,725 69,499,208 72,391,635 75,771,626
6.010
Excess of Revenues and Other Financing
Sources over (under) Expenditures and
Other Financing Uses
2,560,519 (1,491,882) 7,129,924 -368.09% 4,270,437 5,336,166 2,438,260 (469,767) (3,823,511)
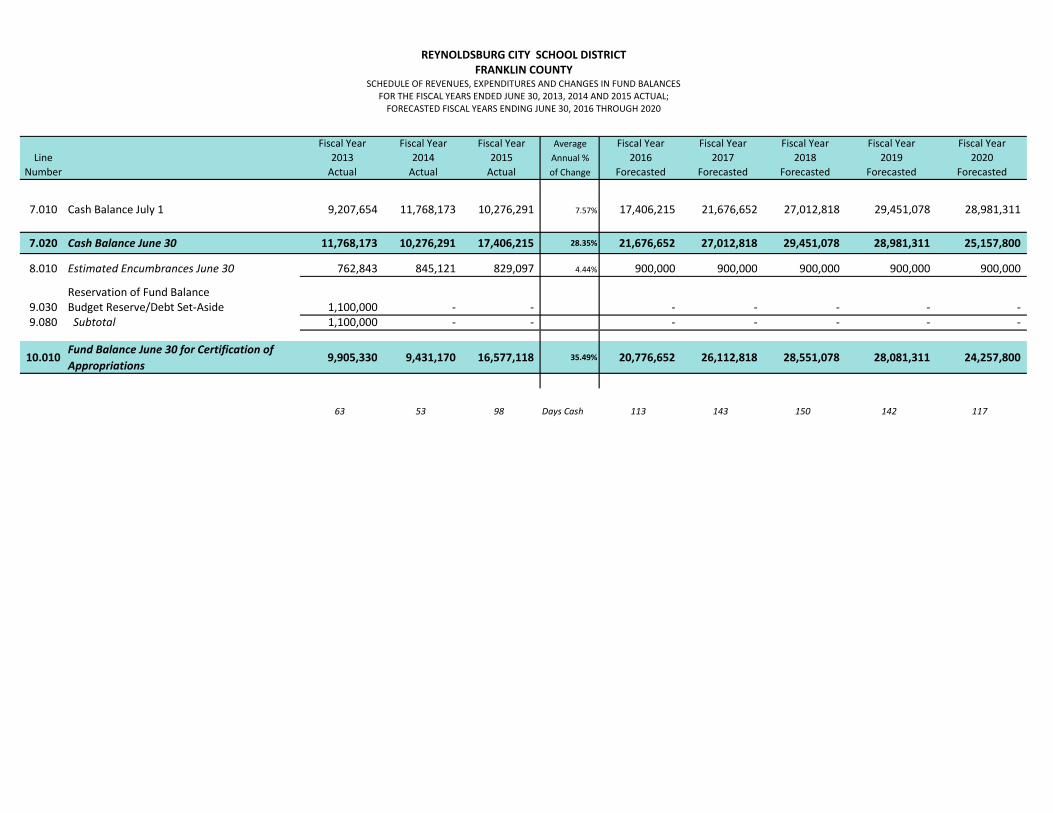
REYNOLDSBURG CITY SCHOOL DISTRICTFRANKLIN COUNTY
SCHEDULE OF REVENUES, EXPENDITURES AND CHANGES IN FUND BALANCESFOR THE FISCAL YEARS ENDED JUNE 30, 2013, 2014 AND 2015 ACTUAL;
FORECASTED FISCAL YEARS ENDING JUNE 30, 2016 THROUGH 2020
Fiscal Year Fiscal Year Fiscal Year Average Fiscal Year Fiscal Year Fiscal Year Fiscal Year Fiscal Year
Line 2013 2014 2015 Annual % 2016 2017 2018 2019 2020
Number Actual Actual Actual of Change Forecasted Forecasted Forecasted Forecasted Forecasted
REYNOLDSBURG CITY SCHOOL DISTRICTFRANKLIN COUNTY
SCHEDULE OF REVENUES, EXPENDITURES AND CHANGES IN FUND BALANCESFOR THE FISCAL YEARS ENDED JUNE 30, 2013, 2014 AND 2015 ACTUAL;
FORECASTED FISCAL YEARS ENDING JUNE 30, 2016 THROUGH 2020
7.010 Cash Balance July 1 9,207,654 11,768,173 10,276,291 7.57% 17,406,215 21,676,652 27,012,818 29,451,078 28,981,311
7.020 Cash Balance June 30 11,768,173 10,276,291 17,406,215 28.35% 21,676,652 27,012,818 29,451,078 28,981,311 25,157,800
8.010 Estimated Encumbrances June 30 762,843 845,121 829,097 4.44% 900,000 900,000 900,000 900,000 900,000
Reservation of Fund Balance 9.030 Budget Reserve/Debt Set-Aside 1,100,000 - - - - - - - 9.080 Subtotal 1,100,000 - - - - - - -
10.010Fund Balance June 30 for Certification of
Appropriations9,905,330 9,431,170 16,577,118 35.49% 20,776,652 26,112,818 28,551,078 28,081,311 24,257,800
63 53 98 Days Cash 113 143 150 142 117
Page | 1
Reynoldsburg City School District
Five-Year Forecast Assumptions and Notes
For the Period July 1, 2012 Through June 30, 2020 October 20, 2015
Overview Reynoldsburg is a high-performing district focused on student achievement, safety and fiscal
responsibility. The District continuously strives to provide innovative and cost-effective
educational opportunities for all students.
The Reynoldsburg Board of Education values financial stability as a means of protecting and
enhancing the high quality educational opportunities that are important to the Reynoldsburg
community and to the success of our children. The district has achieved a stable financial
outlook, as evidenced in this forecast, by employing four key strategies:
1. Controlled expenditures. Reynoldsburg is known for innovation, however, the district has
adopted an approach that prioritizes promising new strategies amongst existing practices
so that new expenditures are offset by the elimination of lower-priority expenditures.
2. Personnel. Reynoldsburg’s two employee associations have recognized that reasonable
contracts are necessary to protect the fiscal health and stability of the district.
3. Partnerships. Opportunities for students have been created by trading space and services
when the district and community organizations have overlapping missions.
4. Open Enrollment. Reynoldsburg utilizes its available capacity to offer educational
opportunities to students outside the District, which generates millions of dollars to
support programs for all students.
Reynoldsburg students have a variety of educational opportunities and are achieving at high
levels. This is made possible by careful prioritization of spending, strategic deployment of
resources and creative collaborations with community partners. To continue that trajectory, the
Board has adopted a long-term financial goal of maintaining a positive cash balance through
2020.
What is a Forecast?
The five-year forecast is a planning tool that uses currently available data and reasonable
assumptions to form a hypothetical representation of the district’s financial future. Forecasts, by
their nature, are not designed to be precise, but are rather a tool to provide information to assist
the District in its planning.
The five-year forecast is a working document that changes when more up-to-date information
becomes available or when any of the underlying assumptions significantly change. The District
monitors actual receipts and expenditures against the current year forecast on a monthly basis
and updates the forecast when appropriate.
Page | 2
The following provides more detailed information on the assumptions used in this forecast.
----Revenues----
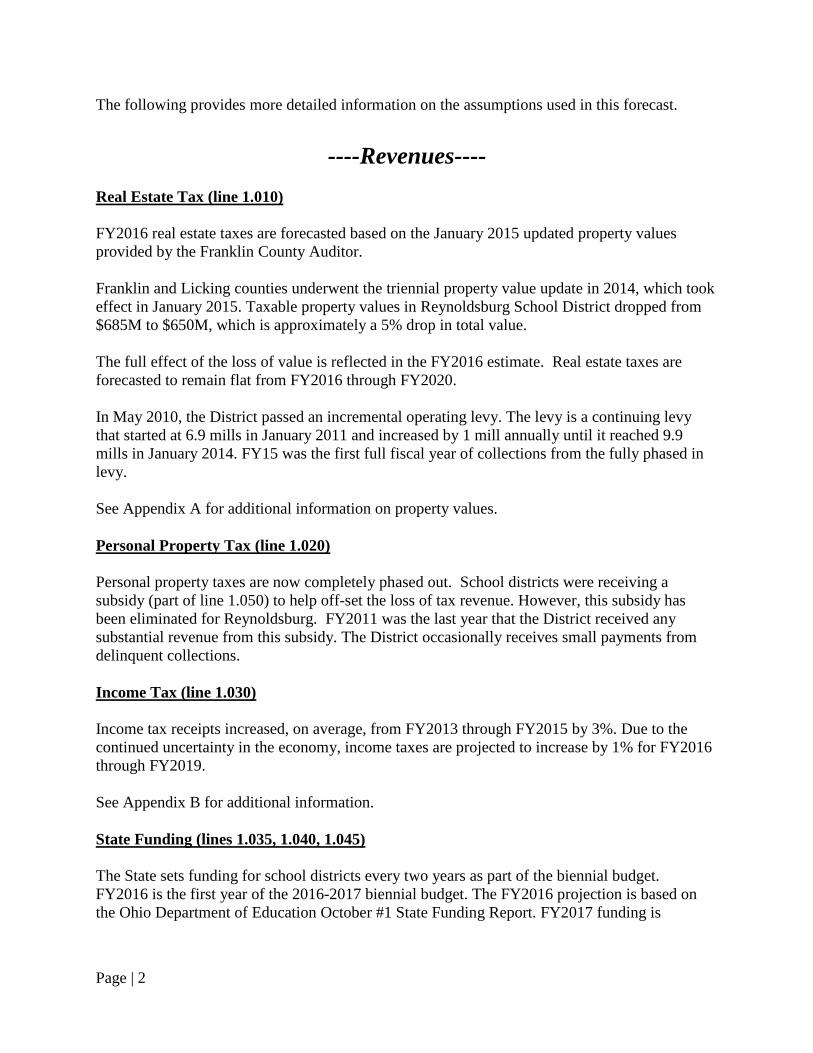
Real Estate Tax (line 1.010)
FY2016 real estate taxes are forecasted based on the January 2015 updated property values
provided by the Franklin County Auditor.
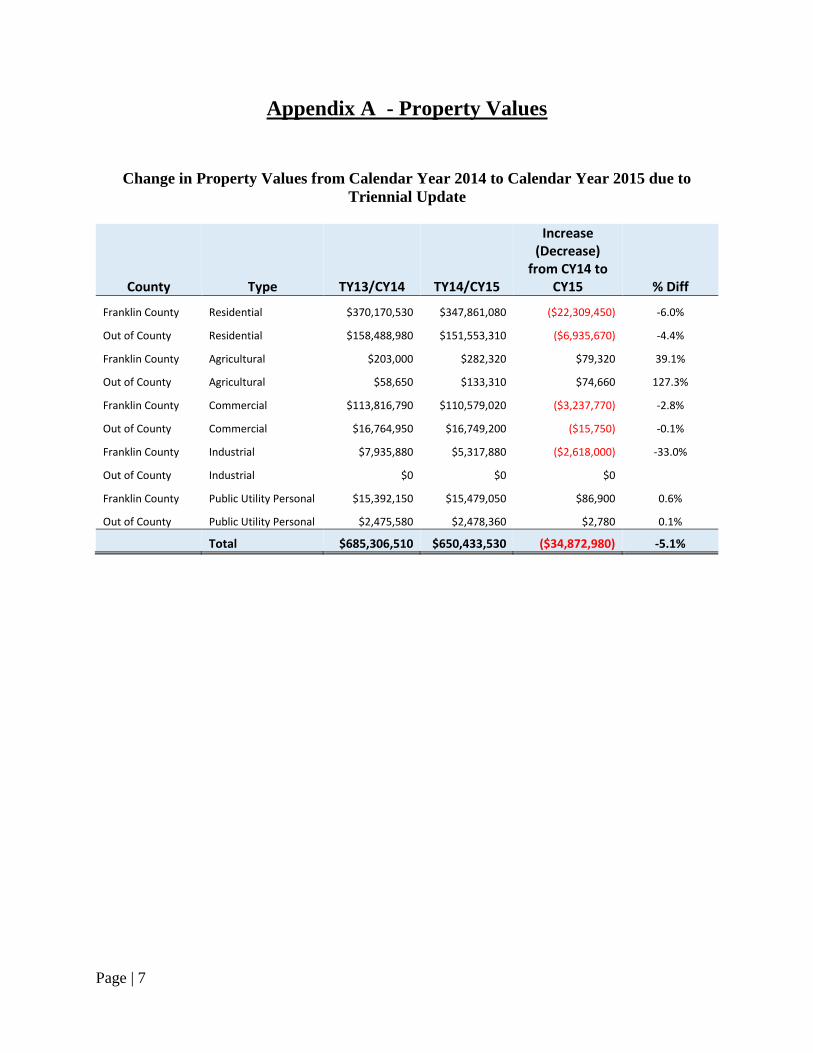
Franklin and Licking counties underwent the triennial property value update in 2014, which took
effect in January 2015. Taxable property values in Reynoldsburg School District dropped from
$685M to $650M, which is approximately a 5% drop in total value.
The full effect of the loss of value is reflected in the FY2016 estimate. Real estate taxes are
forecasted to remain flat from FY2016 through FY2020.
In May 2010, the District passed an incremental operating levy. The levy is a continuing levy
that started at 6.9 mills in January 2011 and increased by 1 mill annually until it reached 9.9
mills in January 2014. FY15 was the first full fiscal year of collections from the fully phased in
levy.
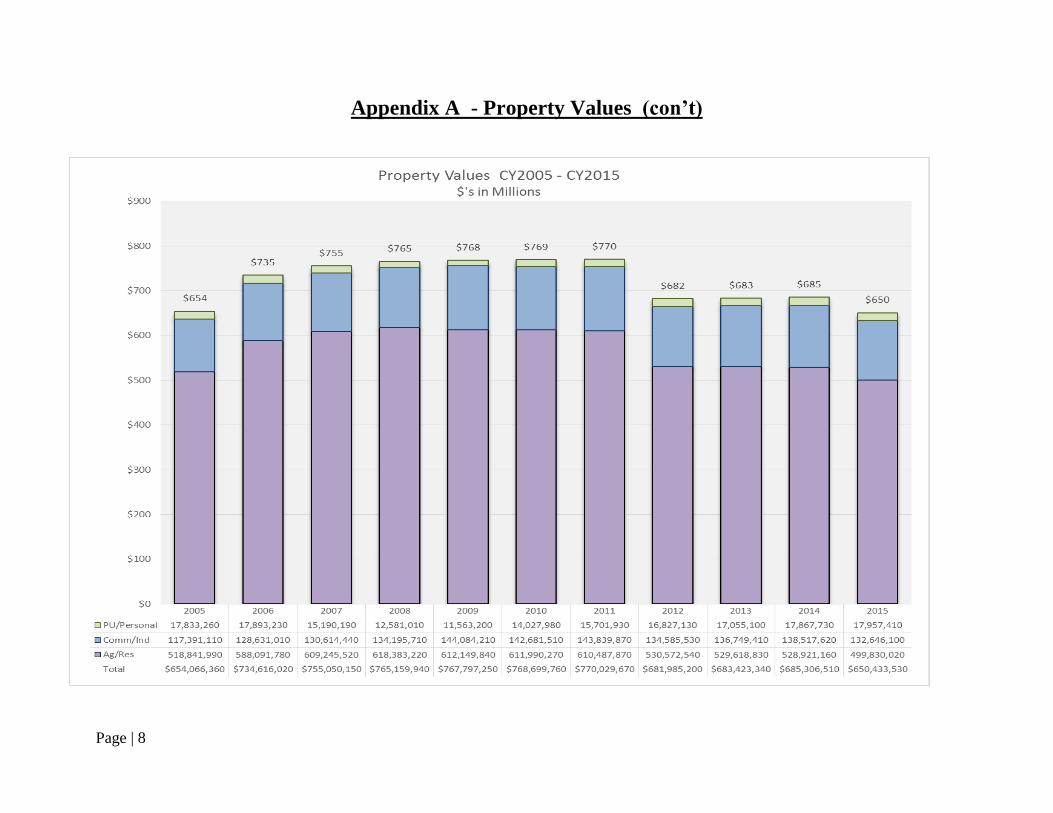
See Appendix A for additional information on property values.
Personal Property Tax (line 1.020)
Personal property taxes are now completely phased out. School districts were receiving a
subsidy (part of line 1.050) to help off-set the loss of tax revenue. However, this subsidy has
been eliminated for Reynoldsburg. FY2011 was the last year that the District received any
substantial revenue from this subsidy. The District occasionally receives small payments from
delinquent collections.
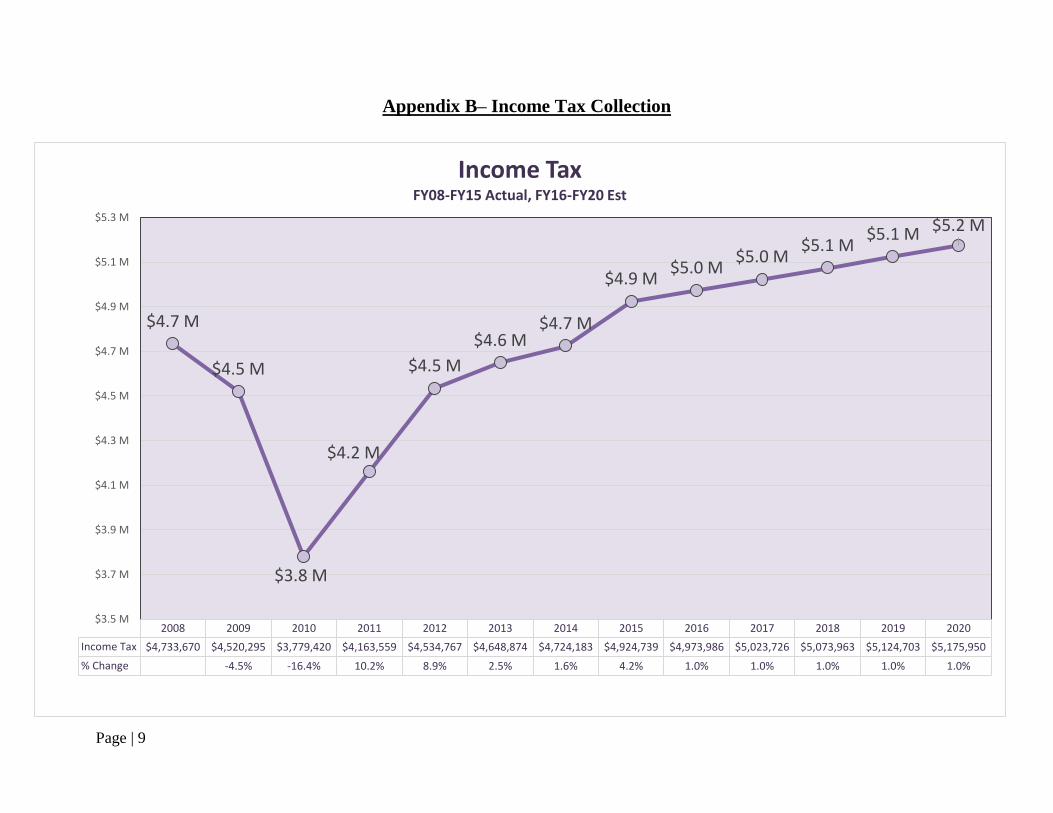
Income Tax (line 1.030)
Income tax receipts increased, on average, from FY2013 through FY2015 by 3%. Due to the
continued uncertainty in the economy, income taxes are projected to increase by 1% for FY2016
through FY2019.
See Appendix B for additional information.
State Funding (lines 1.035, 1.040, 1.045)
The State sets funding for school districts every two years as part of the biennial budget.
FY2016 is the first year of the 2016-2017 biennial budget. The FY2016 projection is based on
the Ohio Department of Education October #1 State Funding Report. FY2017 funding is
Page | 3
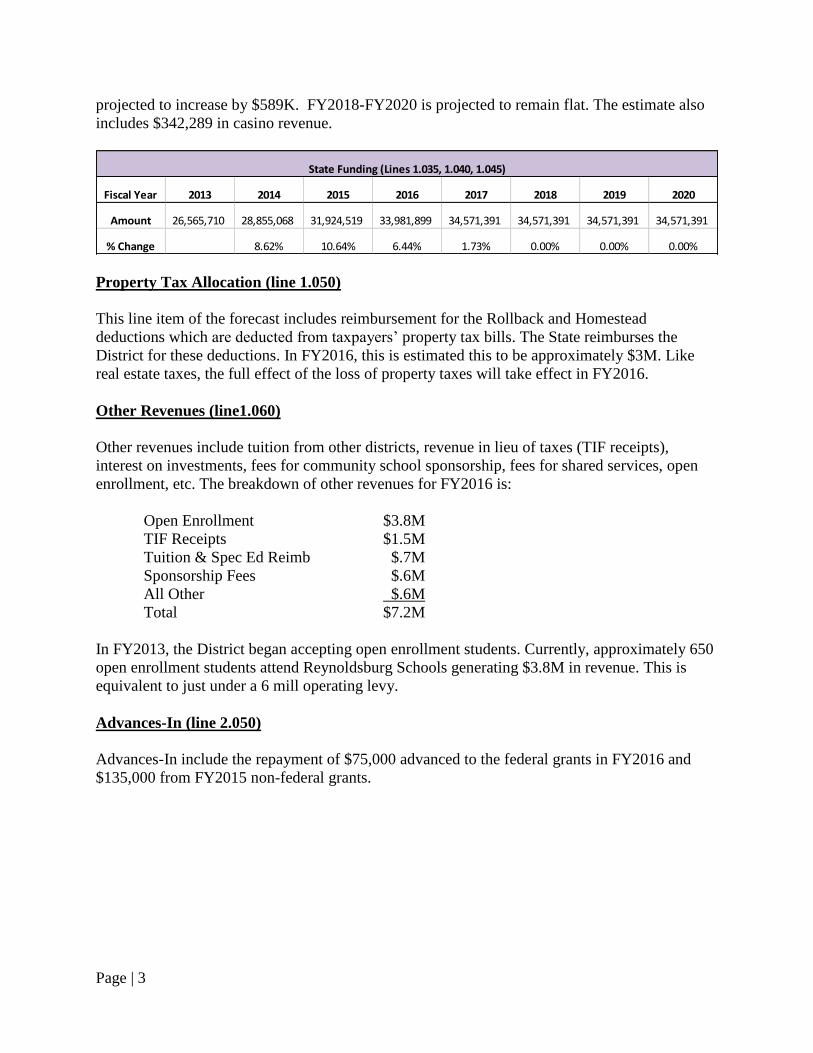
projected to increase by $589K. FY2018-FY2020 is projected to remain flat. The estimate also
includes $342,289 in casino revenue.
Fiscal Year 2013 2014 2015 2016 2017 2018 2019 2020
Amount 26,565,710 28,855,068 31,924,519 33,981,899 34,571,391 34,571,391 34,571,391 34,571,391
% Change 8.62% 10.64% 6.44% 1.73% 0.00% 0.00% 0.00%
State Funding (Lines 1.035, 1.040, 1.045)
Property Tax Allocation (line 1.050)
This line item of the forecast includes reimbursement for the Rollback and Homestead
deductions which are deducted from taxpayers’ property tax bills. The State reimburses the
District for these deductions. In FY2016, this is estimated this to be approximately $3M. Like
real estate taxes, the full effect of the loss of property taxes will take effect in FY2016.
Other Revenues (line1.060)
Other revenues include tuition from other districts, revenue in lieu of taxes (TIF receipts),
interest on investments, fees for community school sponsorship, fees for shared services, open
enrollment, etc. The breakdown of other revenues for FY2016 is:
Open Enrollment $3.8M
TIF Receipts $1.5M
Tuition & Spec Ed Reimb $.7M
Sponsorship Fees $.6M
All Other $.6M
Total $7.2M
In FY2013, the District began accepting open enrollment students. Currently, approximately 650
open enrollment students attend Reynoldsburg Schools generating $3.8M in revenue. This is
equivalent to just under a 6 mill operating levy.
Advances-In (line 2.050)
Advances-In include the repayment of $75,000 advanced to the federal grants in FY2016 and
$135,000 from FY2015 non-federal grants.
Page | 4
----Expenditures----
Salaries (line 3.010) and Benefits (line 3.020)
Salaries
Teacher Contract
The District approved a three year contract with teaching staff effective 8/1/2014 through
7/31/2017. The contract includes 4% longevity step increases each year for most teaching staff
plus the following base salary increases for all teaching staff: 2% FY2015, 1.6% FY2016, and
1.9% FY2017. In addition, all teaching staff are eligible for bonuses based on performance
and/or extra duties.
Classified Contract
The current contract with classified staff expired 6/30/2015. The forecast includes an estimate for
longevity step increases for FY2016-FY2020. For forecast purposes only, base increases are
estimated at the same level as the teacher base increases. Actual salary increases may be
different based on the structure of the new contract.
For FY2018 through FY2020, salary increases for all staff are forecasted at 1.9% to mirror the
last year of the certified contract.
Benefits
As part of the negotiated agreement, staff will maintain their current insurance plan. Employee
contributions changed from a flat dollar amount to a % effective 8/1/2014. By the end of the
contract, certified staff will pay 10% of the insurance premium. Insurance increases are
forecasted to increase by 10% each January 1st starting in January 2017.
Purchased Services (line 3.030)
Purchased services include, among other things, utilities, building repairs and maintenance, bus
repairs and maintenance, service agreements, copier leases, TRECA computer services, meeting
and mileage expenses, special education tuition and services, and open enrollment and
community school students leaving the District. This line item accounts for over 26% of total
expenditures (line 4.500) and is the most volatile. The District has limited direct control of many
of the items in this category and expenditures such as special education and community school
students can vary widely from year to year.
The four largest expenditures, which make up over 60% of this line item, are:
Community School Deduction $3.7M (see chart below)
Special Education Services & Tuition $2.8M
Utilities (Including Phone/Connectivity) $2.1M
Bldg & Grounds Maintenance $1.9M
Page | 5
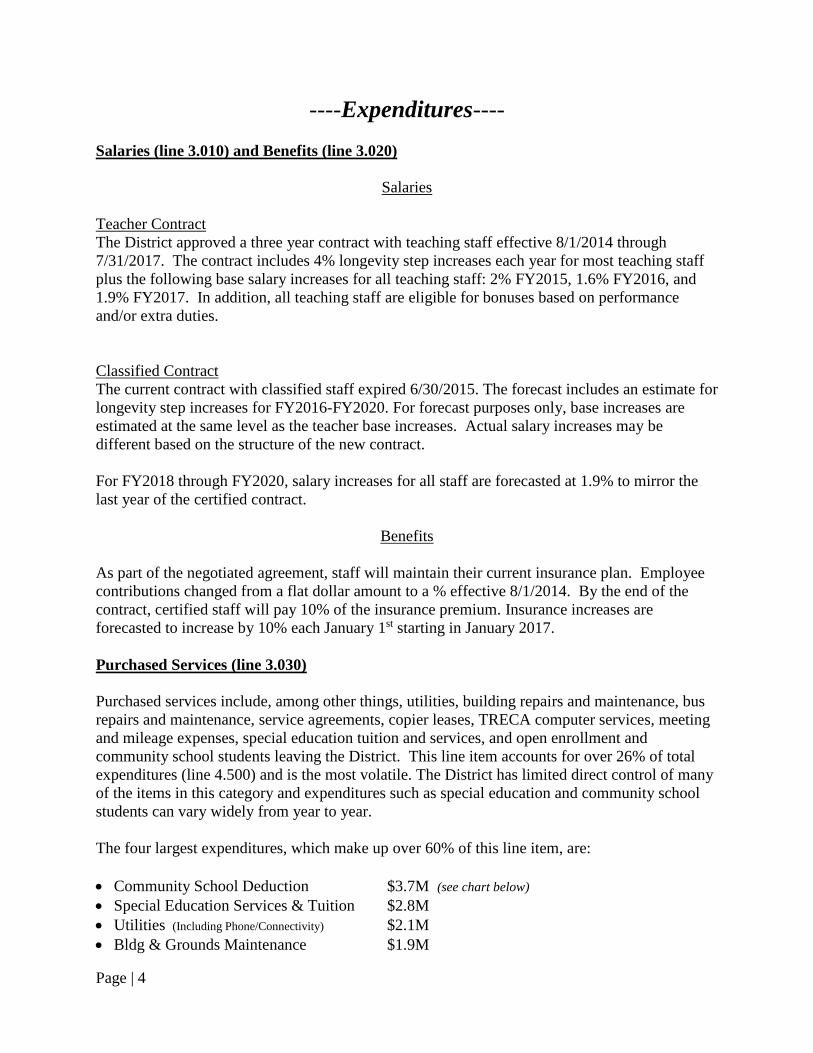
The following chart shows historical community school deductions.
Community School Deduction
Fiscal Year Amount %
Change No. of
Students
Average Cost per Student
2010 $2,585,421 348.01 $7,429
2011 $3,554,002 37% 476.72 $7,455
2012 $3,485,904 -2% 473.87 $7,356
2013 $3,678,993 6% 507.14 $7,254
2014 $3,634,929 -1% 493.88 $7,360
2015 $3,551,816 -2% 477.1 $7,445
2016 EST $3,700,000 4% 497 $7,445
Supplies and Materials (line 3.040)
Materials and supplies are estimated at $1.8 for FY2016 and account for 3% of the expenditures.
This line item includes instructional supplies, maintenance supplies and bus fuel.
Capital Outlay (line 3.050)
Capital outlay is a relatively small part of the District’s operating budget, accounting for less
than 1%. The District has been able to keep these expenditures low due to a maintenance levy, a
carryover of construction funds and setting aside funds for technology and busses.
Other Expenditures (line 4.300)
The majority of Other Expenditures include fees paid to the county auditor and treasurer to
collect the District’s property taxes, membership fees and the cost of the annual audit.
Operating Transfers Out (line 5.010)
In FY2016, the forecast includes the following transfers:
$140,000 to the Athletic Fund to reduce pay-to participate fees
$21,000 to the music funds to reduce pay-to-participate fees
$13,000 to the LPDC Fund per the teacher negotiated agreement
$50,000 to the 034 Maintenance Fund per the Construction Project Master Agreement
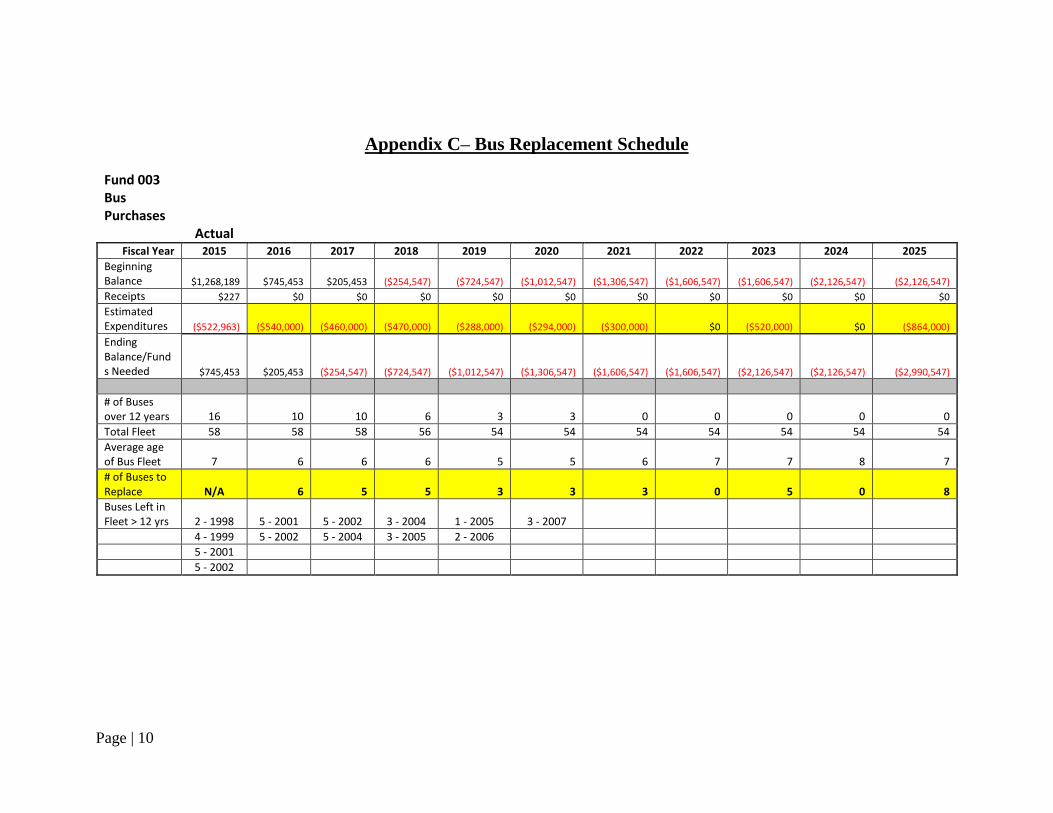
$2,990,547 to the Permanent Improvement Fund to set-aside funds for bus replacements
through 2025 (See appendix C.)
In FY2015, the District made the following transfers:
$139,089 to the Athletic Fund to reduce pay-to-participate fees
$20,729 to the music funds to reduce pay-to-participate fees
Page | 6
$12,889 to the LPDC Fund per the teacher negotiated agreement
$49,516 to the 034 Maintenance Fund per the Construction Project Master Agreement
$158,319 set-aside of building budget funds
In FY2014, the District made the following transfers:
$1,080,000 to the Permanent Improvement Fund to purchase 3 busses per year in
accordance with the bus replacement plan.
$4,900,000 to the Technology Capital Outlay Fund to fund technology equipment and
infrastructure per the technology plan.
$12,827 to the LPDC Fund per the teacher negotiated agreement.
$48,334 to Maintenance Set-Aside Fund per the OSFC master plan
$166,375 set-aside of building budget funds
Advances Out (line 5.020)
Advances are temporary loans from the General Fund to other District funds, usually grants.
FY2016 includes $75,000 in advances to the federal grants. These advances will be repaid to the
General Fund by the end of the fiscal year.
All Other Financing Uses (line 5.030)
In FY2014, the District paid $1.2M to Licking Heights School District as part of a revenue
sharing agreement for Tax Years 2001-2006. Both Districts decided that it was mutually
beneficial to discontinue the agreement and a final payment of $480K was made to Licking
Heights in FY2016.
Page | 7
Appendix A - Property Values
Change in Property Values from Calendar Year 2014 to Calendar Year 2015 due to
Triennial Update
County Type TY13/CY14 TY14/CY15
Increase (Decrease)
from CY14 to CY15 % Diff
Franklin County Residential $370,170,530 $347,861,080 ($22,309,450) -6.0%
Out of County Residential $158,488,980 $151,553,310 ($6,935,670) -4.4%
Franklin County Agricultural $203,000 $282,320 $79,320 39.1%
Out of County Agricultural $58,650 $133,310 $74,660 127.3%
Franklin County Commercial $113,816,790 $110,579,020 ($3,237,770) -2.8%
Out of County Commercial $16,764,950 $16,749,200 ($15,750) -0.1%
Franklin County Industrial $7,935,880 $5,317,880 ($2,618,000) -33.0%
Out of County Industrial $0 $0 $0
Franklin County Public Utility Personal $15,392,150 $15,479,050 $86,900 0.6%
Out of County Public Utility Personal $2,475,580 $2,478,360 $2,780 0.1%
Total $685,306,510 $650,433,530 ($34,872,980) -5.1%
Page | 8
Appendix A - Property Values (con’t)
Page | 9
Appendix B– Income Tax Collection
2008 2009 2010 2011 2012 2013 2014 2015 2016 2017 2018 2019 2020
Income Tax $4,733,670 $4,520,295 $3,779,420 $4,163,559 $4,534,767 $4,648,874 $4,724,183 $4,924,739 $4,973,986 $5,023,726 $5,073,963 $5,124,703 $5,175,950
% Change -4.5% -16.4% 10.2% 8.9% 2.5% 1.6% 4.2% 1.0% 1.0% 1.0% 1.0% 1.0%
$4.7 M
$4.5 M
$3.8 M
$4.2 M
$4.5 M
$4.6 M$4.7 M
$4.9 M$5.0 M
$5.0 M$5.1 M
$5.1 M $5.2 M
$3.5 M
$3.7 M
$3.9 M
$4.1 M
$4.3 M
$4.5 M
$4.7 M
$4.9 M
$5.1 M
$5.3 M
Income TaxFY08-FY15 Actual, FY16-FY20 Est
Page | 10
Appendix C– Bus Replacement Schedule
Fund 003 Bus Purchases
Actual
Fiscal Year 2015 2016 2017 2018 2019 2020 2021 2022 2023 2024 2025
Beginning Balance $1,268,189 $745,453 $205,453 ($254,547) ($724,547) ($1,012,547) ($1,306,547) ($1,606,547) ($1,606,547) ($2,126,547) ($2,126,547)
Receipts $227 $0 $0 $0 $0 $0 $0 $0 $0 $0 $0
Estimated Expenditures ($522,963) ($540,000) ($460,000) ($470,000) ($288,000) ($294,000) ($300,000) $0 ($520,000) $0 ($864,000)
Ending Balance/Funds Needed $745,453 $205,453 ($254,547) ($724,547) ($1,012,547) ($1,306,547) ($1,606,547) ($1,606,547) ($2,126,547) ($2,126,547) ($2,990,547)
# of Buses over 12 years 16 10 10 6 3 3 0 0 0 0 0
Total Fleet 58 58 58 56 54 54 54 54 54 54 54
Average age of Bus Fleet 7 6 6 6 5 5 6 7 7 8 7
# of Buses to Replace N/A 6 5 5 3 3 3 0 5 0 8
Buses Left in Fleet > 12 yrs 2 - 1998 5 - 2001 5 - 2002 3 - 2004 1 - 2005 3 - 2007
4 - 1999 5 - 2002 5 - 2004 3 - 2005 2 - 2006
5 - 2001
5 - 2002