rhic ags 17 - brookhaven national laboratory · niseem magdy star collaboration stony brook...
TRANSCRIPT

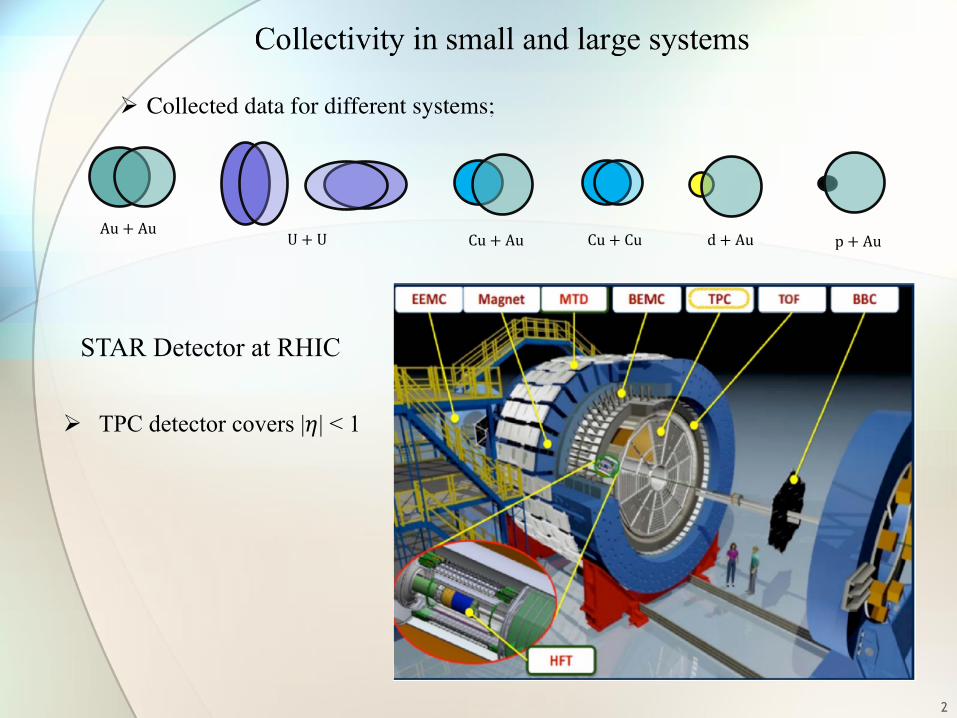
Ø Collected data for different systems;
Au + AuU + U Cu + Au Cu + Cu d + Au p + Au
2
STAR Detector at RHIC
Ø TPC detector covers |𝜂| < 1

Flow
𝑯𝑩𝑻
𝑫𝒆𝒄𝒂𝒚
𝑴𝒐𝒎𝒆𝒏𝒕𝒖𝒎𝑪𝒐𝒏𝒔𝒆𝒓𝒗𝒂𝒕𝒊𝒐𝒏
Di−jets
Two particle correlation function 𝐶r Δ𝜑 ,
𝐶𝑟 Δ𝜑 = 𝑑𝑁/𝑑Δ𝜑 and 𝑣OP = ∑ RS TU VWX(OTU)�\]
∑ RS TU�\]
𝑺𝒉𝒐𝒓𝒕 − 𝒓𝒂𝒏𝒈𝒆𝑳𝒐𝒏𝒈 − 𝒓𝒂𝒏𝒈𝒆
𝑛 > 1𝑣OO = 𝑣Oe𝑣Of +𝛿hijSk
𝑛 = 1𝑣ll = 𝑣le𝑣lf +𝛿mjOn
Non-flow
Azimuthal anisotropy measurements Correlation
function
3Charge
Flow
Non-flow
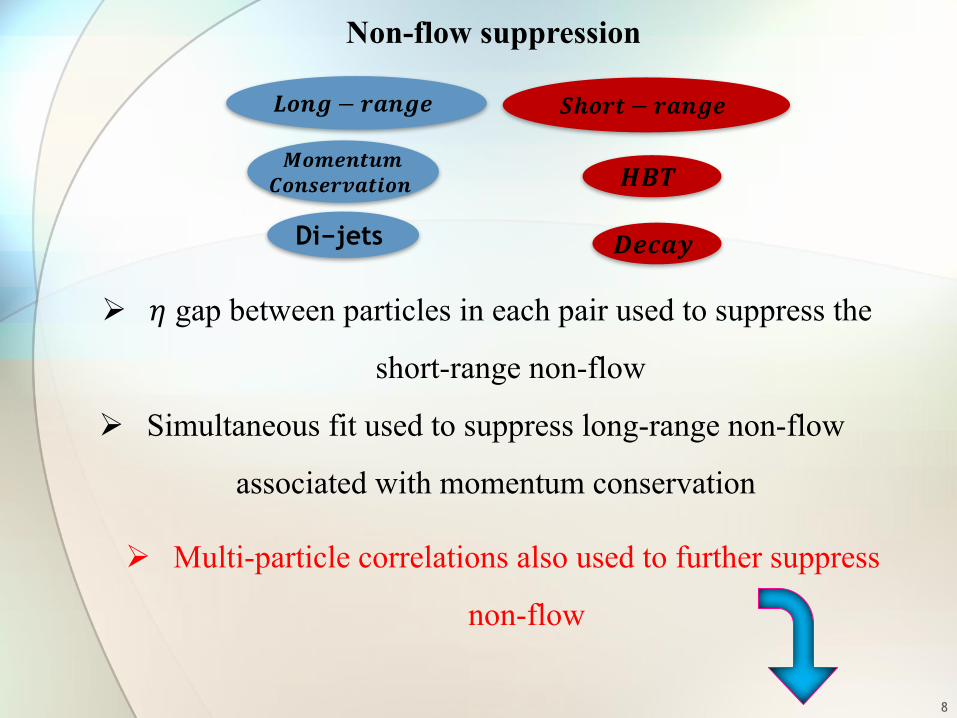
Non-flow suppression is needed
𝑺𝒉𝒐𝒓𝒕 − 𝒓𝒂𝒏𝒈𝒆Non−flow
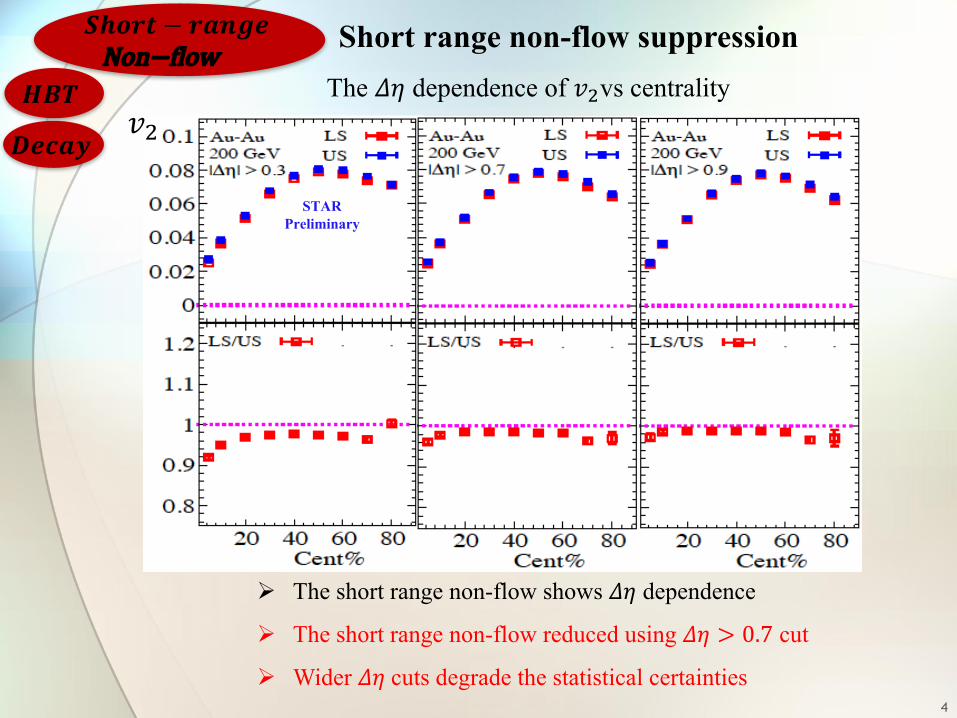
𝑯𝑩𝑻 The 𝛥𝜂 dependence of 𝑣vvs centrality
4
𝑣v
STAR Preliminary
Short range non-flow suppression
Ø The short range non-flow shows 𝛥𝜂 dependence
Ø The short range non-flow reduced using 𝛥𝜂 > 0.7 cut
Ø Wider 𝛥𝜂cuts degrade the statistical certainties
𝑫𝒆𝒄𝒂𝒚
5
𝑣v
STAR Preliminary
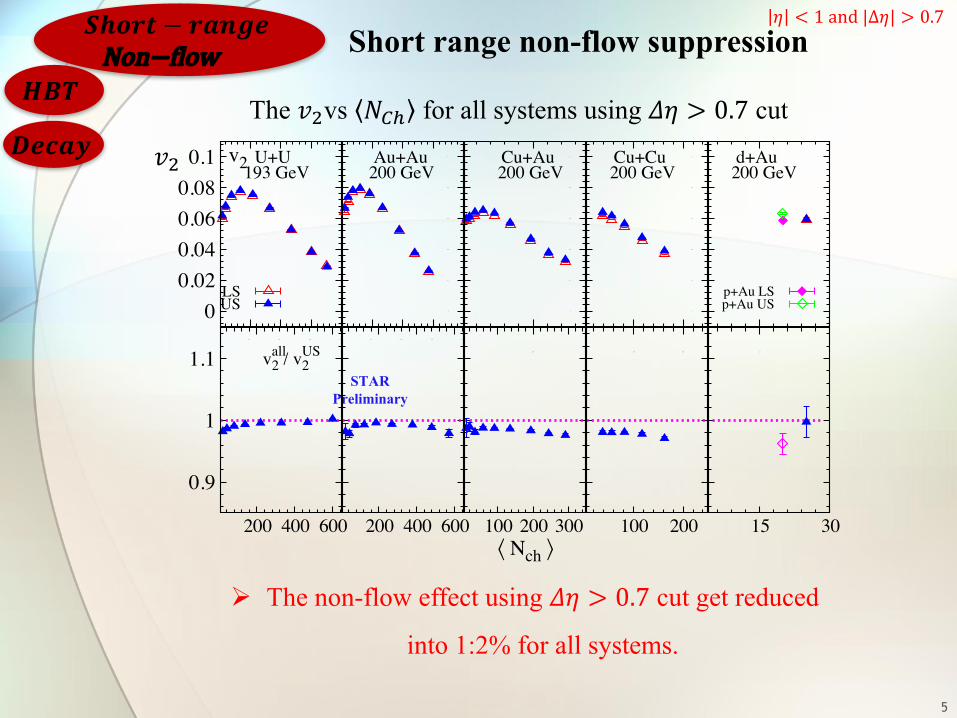
𝜂 < 1and|Δ𝜂| > 0.7
Ø The non-flow effect using 𝛥𝜂 > 0.7 cut get reduced
into 1:2% for all systems.
The 𝑣vvs 𝑁Ri for all systems using 𝛥𝜂 > 0.7 cut
Short range non-flow suppression𝑺𝒉𝒐𝒓𝒕 − 𝒓𝒂𝒏𝒈𝒆Non−flow
𝑯𝑩𝑻
𝑫𝒆𝒄𝒂𝒚
0 0.02 0.04 0.06 0.08
0.1
200 400 600 800
U+U193 GeV
v2
LSUS
0
0.02
0.04
0.06
0.08
0.1
200 400 600 800
Au+Au200 GeV
0
0.02
0.04
0.06
0.08
0.1
200
Cu+Au200 GeV
0
0.02
0.04
0.06
0.08
0.1
100 200
Cu+Cu200 GeV
0
0.02
0.04
0.06
0.08
0.1
15 30
d+Au200 GeV
p+Au LSp+Au US
0.9
1
1.1
200 400 600
vall2 / vUS
2
0.9
1
1.1
200 400 600
0.9
1
1.1
100 200 300⟨ Nch ⟩
0.9
1
1.1
100 200
0.9
1
1.1
15 30
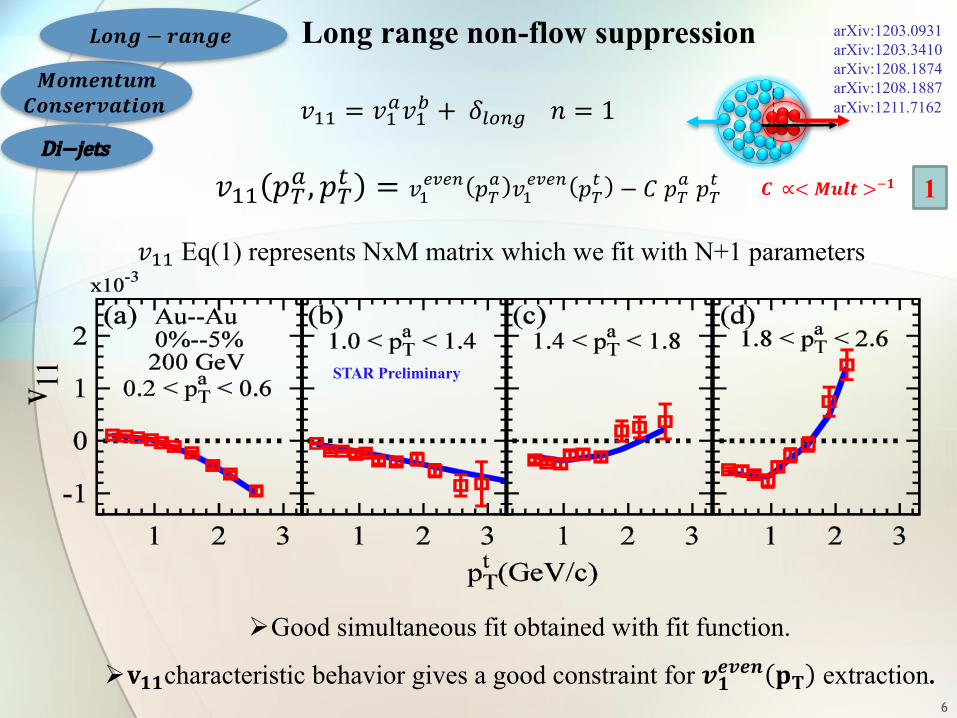
𝑣ll = 𝑣le𝑣lf +𝛿mjOn𝑛 = 1
𝑣ll 𝑝~e, 𝑝~k = 𝑣l���O 𝑝~
e 𝑣l���O 𝑝~
k − 𝐶𝑝~e𝑝~
k
STAR Preliminary
ØGood simultaneous fit obtained with fit function.
Ø𝐯𝟏𝟏characteristic behavior gives a good constraint for 𝒗𝟏𝒆𝒗𝒆𝒏 𝐩𝐓 extraction.6
arXiv:1203.0931arXiv:1203.3410arXiv:1208.1874arXiv:1208.1887arXiv:1211.7162
𝑪 ∝< 𝑴𝒖𝒍𝒕 >�𝟏 1
𝑴𝒐𝒎𝒆𝒏𝒕𝒖𝒎𝑪𝒐𝒏𝒔𝒆𝒓𝒗𝒂𝒕𝒊𝒐𝒏
Di−jets
𝑳𝒐𝒏𝒈 − 𝒓𝒂𝒏𝒈𝒆 Long range non-flow suppression
𝑣ll Eq(1) represents NxM matrix which we fit with N+1 parameters
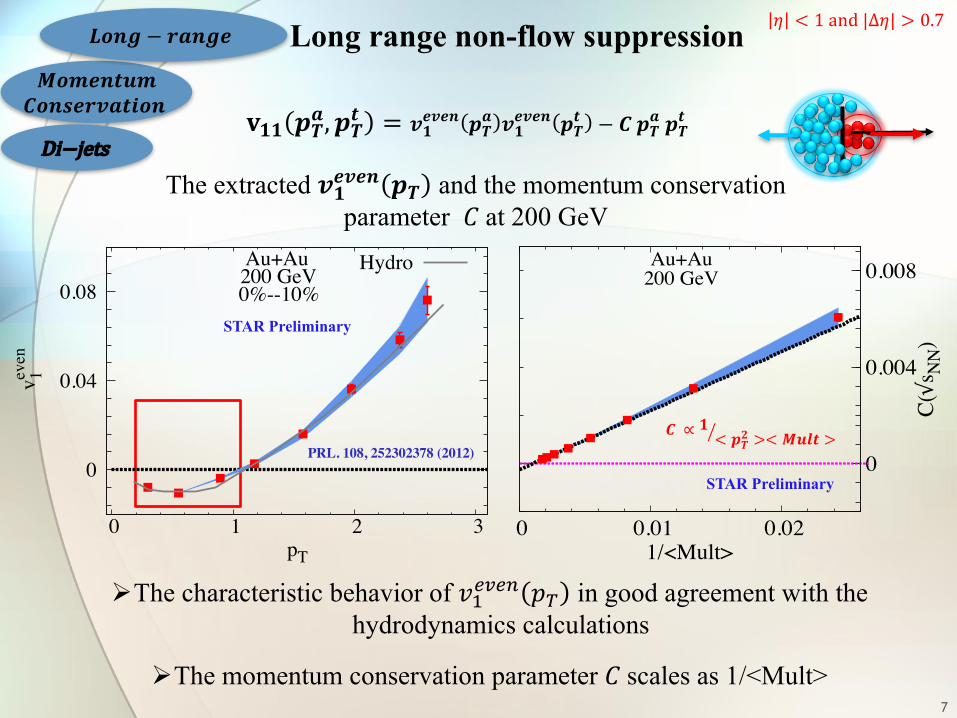
ØThe characteristic behavior of 𝑣l���O 𝑝~ in good agreement with the hydrodynamics calculations
ØThe momentum conservation parameter 𝐶 scales as 1/<Mult>
The extracted 𝒗𝟏𝒆𝒗𝒆𝒏 𝒑𝑻 and the momentum conservation parameter 𝐶 at 200 GeV
7
𝐯𝟏𝟏 𝒑𝑻𝒂, 𝒑𝑻𝒕 = 𝒗𝟏𝒆𝒗𝒆𝒏 𝒑𝑻
𝒂 𝒗𝟏𝒆𝒗𝒆𝒏 𝒑𝑻
𝒕 − 𝑪𝒑𝑻𝒂𝒑𝑻
𝒕
𝜂 < 1and|Δ𝜂| > 0.7
STAR Preliminary
Long range non-flow suppression𝑴𝒐𝒎𝒆𝒏𝒕𝒖𝒎𝑪𝒐𝒏𝒔𝒆𝒓𝒗𝒂𝒕𝒊𝒐𝒏
Di−jets
𝑳𝒐𝒏𝒈 − 𝒓𝒂𝒏𝒈𝒆
0
0 0.01 0.02
0
0.004
0.008
C(√s
NN
)
1/<Mult>
Au+Au200 GeV
PRL. 108, 252302378 (2012)
STAR Preliminary
0
0.04
0.08
0 1 2 3
veven
1
pT
Au+Au200 GeV0%--10%
Hydro
𝑪 ∝ 𝟏 < 𝒑𝑻𝟐 >< 𝑴𝒖𝒍𝒕 >�
8
Ø Multi-particle correlations also used to further suppress
non-flow
Ø 𝜂 gap between particles in each pair used to suppress the
short-range non-flow
Ø Simultaneous fit used to suppress long-range non-flow
associated with momentum conservation
Non-flow suppression
𝑯𝑩𝑻
𝑫𝒆𝒄𝒂𝒚
𝑴𝒐𝒎𝒆𝒏𝒕𝒖𝒎𝑪𝒐𝒏𝒔𝒆𝒓𝒗𝒂𝒕𝒊𝒐𝒏
Di−jets
𝑺𝒉𝒐𝒓𝒕 − 𝒓𝒂𝒏𝒈𝒆𝑳𝒐𝒏𝒈 − 𝒓𝒂𝒏𝒈𝒆
9
-2.5 -2 -1.5 -1 -0.5 0 0.5 1 1.5 2 2.5-3-2-1
0123
0
10
20
30
40
50
60
-2.5 -2 -1.5 -1 -0.5 0 0.5 1 1.5 2 2.5-3-2-1
0123
0
10
20
30
40
50
60
70
4 ≡ 𝑒�O �����������
4 ≡ 𝑒�O �����������
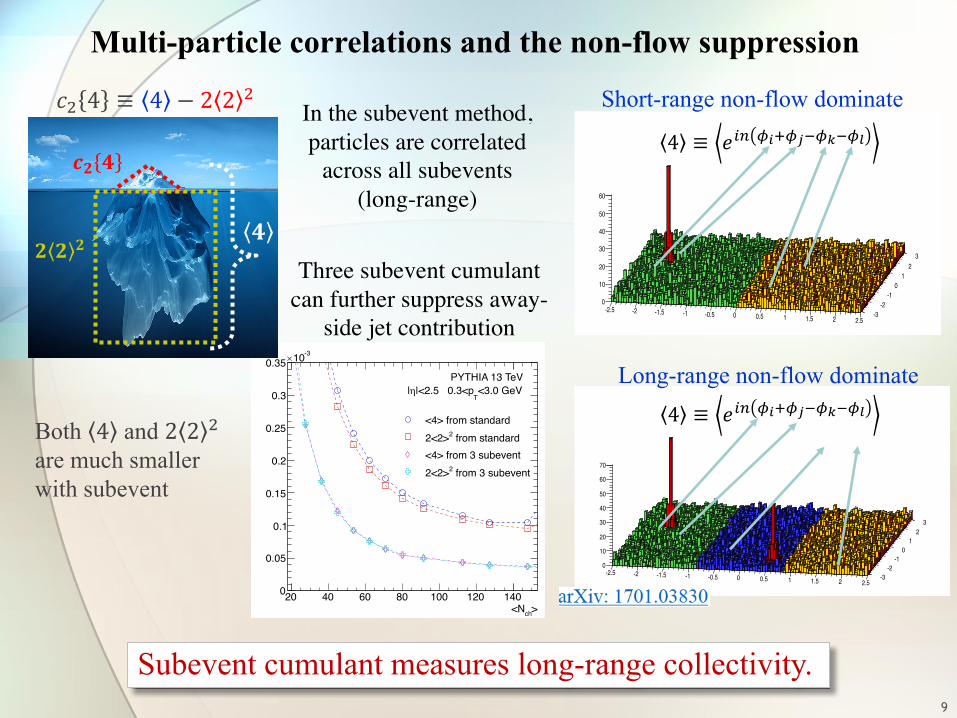
Subevent cumulant measures long-range collectivity.
Short-range non-flow dominate
Long-range non-flow dominate
>ch<N20 40 60 80 100 120 140
{4}
2C
0
0.05
0.1
0.15
0.2
0.25
0.3
0.35-310×
PYTHIA 13 TeV<3.0 GeV
T|<2.5 0.3<pη|
<4> from standard from standard22<2>
<4> from 3 subevent from 3 subevent22<2>
Both 4 and 2 2 v
are much smaller with subevent
Three subevent cumulantcan further suppress away-
side jet contribution
In the subevent method, particles are correlated
across all subevents (long-range)
Multi-particle correlations and the non-flow suppression
𝑐v 4 ≡ 4 − 2 2 v
𝒄𝟐 𝟒
𝟐 𝟐 𝟐𝟒
10
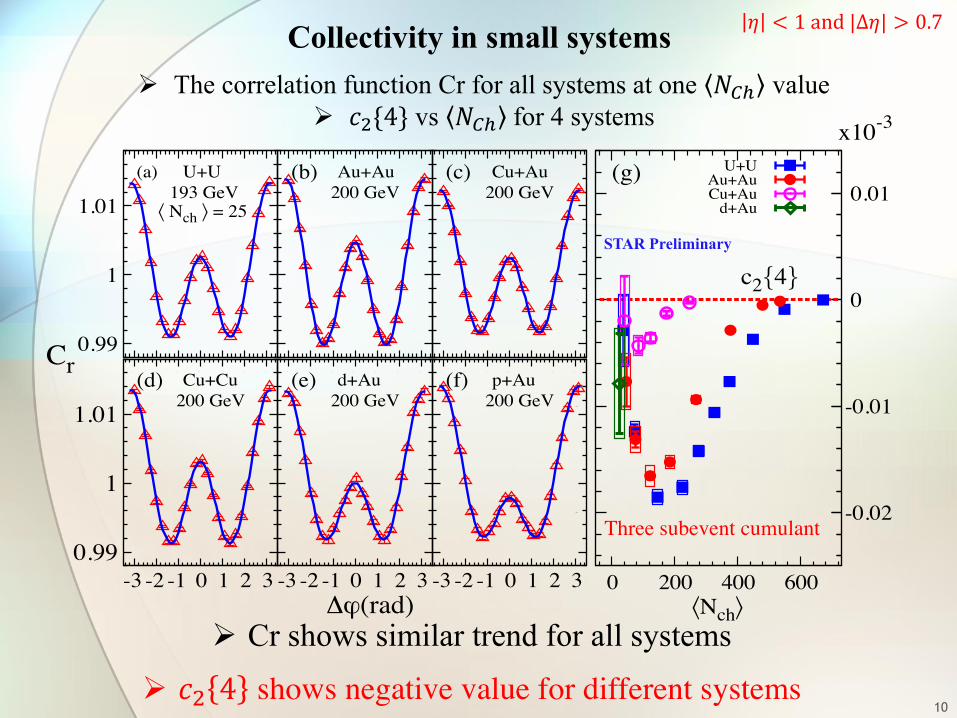
Collectivity in small systems
Ø Cr shows similar trend for all systems
Ø 𝑐v 4 shows negative value for different systems
𝜂 < 1and|Δ𝜂| > 0.7
Ø The correlation function Cr for all systems at one 𝑁Ri valueØ 𝑐v{4} vs 𝑁Ri for 4 systems
STAR Preliminary
-0.02
-0.01
0
0.01
0 200 400 600
-0.02
-0.01
0
0.01
c2{4}
x10-3
(g)
⟨Nch⟩
U+UAu+AuCu+Au
d+Au
0.99
1
1.01
-3 -2 -1 0 1 2 3
U+U193 GeV
⟨ Nch ⟩ = 25
Cr
(a)
0.99
1
1.01
-3 -2 -1 0 1 2 3
Au+Au200 GeV
(b)
0.99
1
1.01
-3 -2 -1 0 1 2 3
Cu+Au200 GeV
(c)
0.99
1
1.01
-3 -2 -1 0 1 2 3
Cu+Cu200 GeV
(d)
0.99
1
1.01
-3 -2 -1 0 1 2 3
d+Au200 GeV
(e)
∆ϕ(rad)
0.99
1
1.01
-3 -2 -1 0 1 2 3
p+Au200 GeV
(f)
Three subevent cumulant
Au + AuU + U Cu + Au Cu + Cu d + Au p + Au
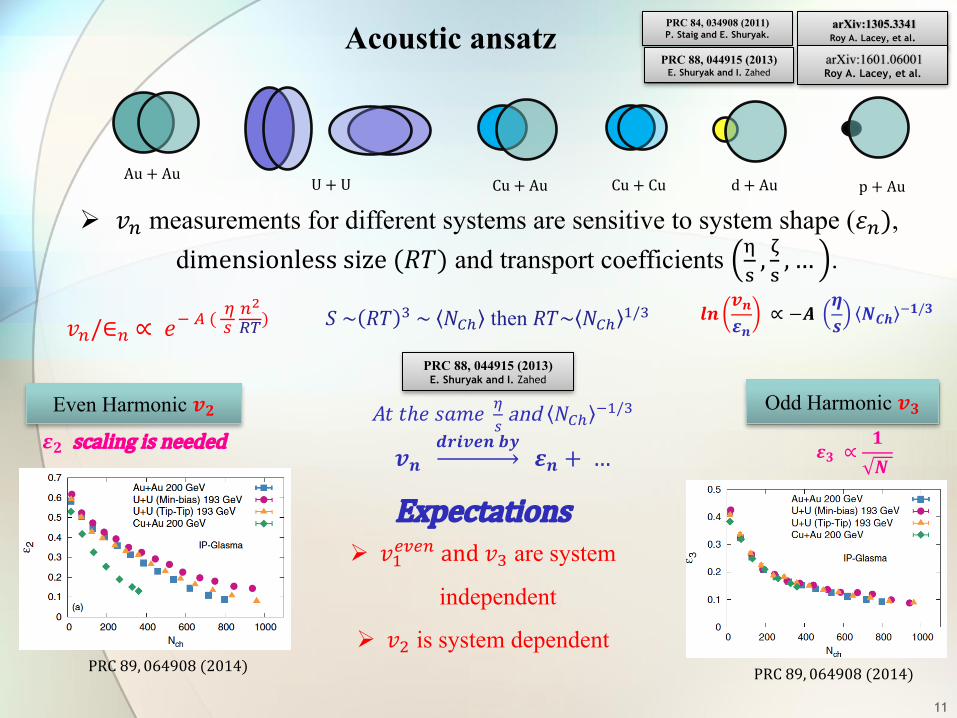
Ø 𝑣O measurements for different systems are sensitive to system shape (𝜀O), dimensionlesssize(𝑅𝑇) and transport coefficients �
X, X, … .
𝒍𝒏𝒗𝒏𝜺𝒏
∝ −𝑨𝜼𝒔 𝑵𝑪𝒉 �𝟏/𝟑
Even Harmonic 𝒗𝟐 Odd Harmonic 𝒗𝟑A𝑡𝑡ℎ𝑒𝑠𝑎𝑚𝑒 ¬hand 𝑁Ri �l/
𝒗𝒏 𝒅𝒓𝒊𝒗𝒆𝒏𝒃𝒚
𝜺𝒏 +… 𝜺𝟑 ∝𝟏𝑵�
PRC 88, 044915 (2013)E. Shuryak and I. Zahed
𝜺𝟐 scalingisneeded
ExpectationsØ 𝑣l���Oand𝑣 are system
independent
Ø 𝑣v is system dependent
11
𝑣O/∈O∝ 𝑒�µ(¬h
O¶·~) 𝑆~ 𝑅𝑇 ~ 𝑁Ri then 𝑅𝑇~ 𝑁Ri l/
PRC89, 064908(2014)PRC89, 064908(2014)
arXiv:1305.3341Roy A. Lacey, et al.
arXiv:1601.06001Roy A. Lacey, et al.
PRC 84, 034908 (2011)P. Staig and E. Shuryak.
PRC 88, 044915 (2013)E. Shuryak and I. Zahed
Acoustic ansatz
12
0
0.1
0 1 2 3
veven
1⟨ NCh ⟩ = 270(a)
U+UAu+AuCu+Au
0
0.1
0.2
0 1 2 3
v 2
(b)
0
0.1
0 1 2 3
v 3
(c)
0
0.05
0 1 2 3
v 4
pT(GeV/c)
(d)
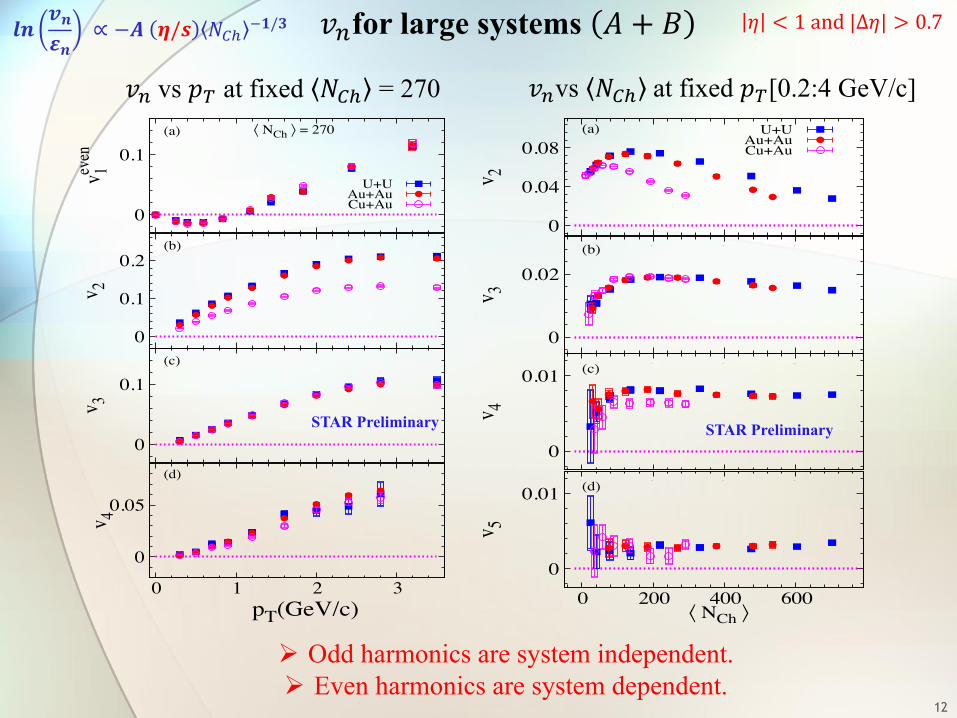
Ø Odd harmonics are system independent.Ø Even harmonics are system dependent.
𝑣Ofor large systems 𝐴 + 𝐵
0
0.04
0.08
0 200 400 600
v 2
(a) U+UAu+AuCu+Au
0
0.02
0 200 400 600
v 3
(b)
0
0.01
0 200 400 600
v 4
(c)
0
0.01
0 200 400 600
v 5
⟨ NCh ⟩
(d)
𝜂 < 1and|Δ𝜂| > 0.7𝒍𝒏𝒗𝒏𝜺𝒏
∝ −𝑨 𝜼/𝒔 𝑁Ri �𝟏/𝟑
STAR Preliminary STAR Preliminary
𝑣Ovs 𝑝~ at fixed 𝑁Ri = 270 𝑣Ovs 𝑁Ri at fixed 𝑝~[0.2:4 GeV/c]
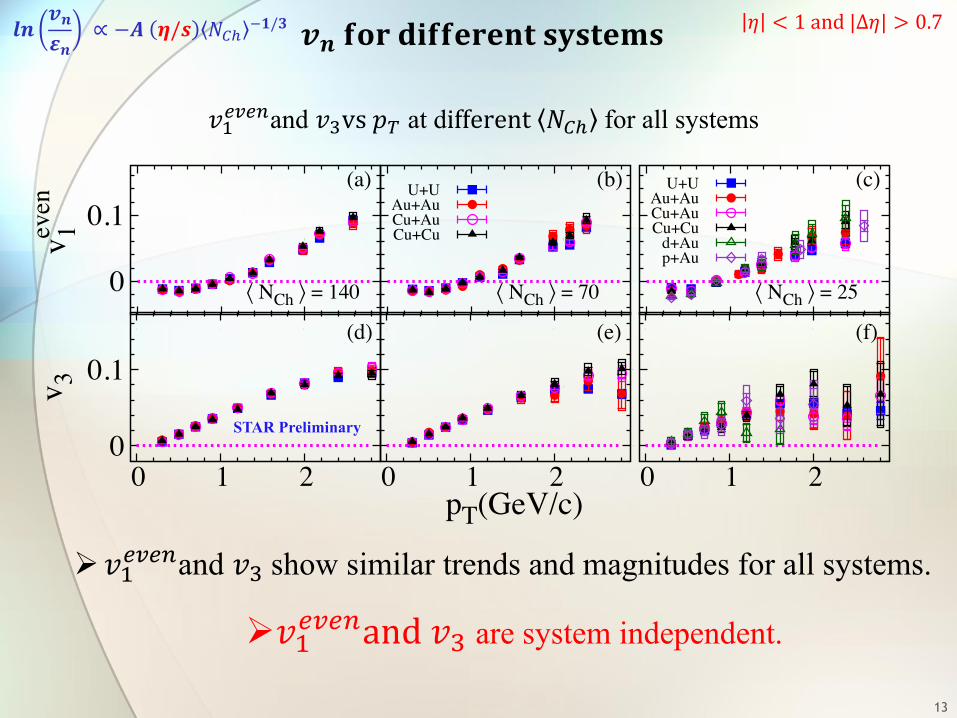
Ø𝑣l���Oand𝑣are system independent.
𝑣l���Oand 𝑣vs𝑝~ at different 𝑁Ri for all systems
Ø𝑣l���Oand 𝑣show similar trends and magnitudes for all systems.
13
0
0.1
0 1 2
veven
1
⟨ NCh ⟩ = 140
(a)
0
0.1
0 1 2
veven
1
⟨ NCh ⟩ = 70
(b)U+UAu+AuCu+AuCu+Cu
0
0.1
0 1 2
veven
1
⟨ NCh ⟩ = 25
(c)U+UAu+AuCu+AuCu+Cu
d+Aup+Au
0
0.1
0 1 2
v 3
(d)
0
0.1
0 1 2
v 3
(e)
0
0.1
0 1 2
v 3
(f)
0
0.2
0 1 2
v 2
(g)
0
0.2
0 1 2
v 2
(h)
0
0.2
0 1 2
v 2
(i)
0
0.4
0 1 2
v 2/ε
2
(j)
0
0.4
0 1 2
v 2/ε
2
(k)
pT(GeV/c)
0
0.4
0 1 2
v 2/ε
2
(l)
0
0.1
0 1 2
veven
1
⟨ NCh ⟩ = 140
(a)
0
0.1
0 1 2
veven
1
⟨ NCh ⟩ = 70
(b)U+UAu+AuCu+AuCu+Cu
0
0.1
0 1 2
veven
1
⟨ NCh ⟩ = 25
(c)U+UAu+AuCu+AuCu+Cu
d+Aup+Au
0
0.1
0 1 2
v 3(d)
0
0.1
0 1 2
v 3
(e)
0
0.1
0 1 2
v 3
(f)
0
0.2
0 1 2
v 2
(g)
0
0.2
0 1 2
v 2
(h)
0
0.2
0 1 2
v 2
(i)
0
0.4
0 1 2
v 2/ε
2
(j)
0
0.4
0 1 2
v 2/ε
2
(k)
pT(GeV/c)
0
0.4
0 1 2
v 2/ε
2
(l)
STAR Preliminary
𝒗𝒏𝐟𝐨𝐫𝐝𝐢𝐟𝐟𝐞𝐫𝐞𝐧𝐭𝐬𝐲𝐬𝐭𝐞𝐦𝐬𝜂 < 1and|Δ𝜂| > 0.7𝒍𝒏
𝒗𝒏𝜺𝒏
∝ −𝑨 𝜼/𝒔 𝑁Ri �𝟏/𝟑
Ø 𝑣l���Oand𝑣 show similar trends and magnitudes for all systems.
Ø 𝑣l���Oand𝑣 are system independent.14
0.02
0.04
0.06
0.08
0 175 350 525 700
0.02
0.04
0.06
0.08(c)
v2 0.2 < pT(GeV/c) < 4
U+UAu+AuCu+AuCu+Cu
d+Aup+Au
0.01
0.02
0 175 350 525 700⟨ Nch ⟩
(b)
v3 0.2 < pT(GeV/c) < 4
0.01
0.02
0 175 350 525 700
vn
(a)
|veven1 |
0.2 < pT(GeV/c) < 0.9
0
0.01
0 0.02 0.04
C
⟨ Nch ⟩-1
𝑵𝑪𝒉
𝑪 ∝< 𝑁Ri >�𝟏
0.02
0.04
0.06
0.08
0 175 350 525 700
0.02
0.04
0.06
0.08(c)
v2 0.2 < pT(GeV/c) < 4
U+UAu+AuCu+AuCu+Cu
d+Aup+Au
0.01
0.02
0 175 350 525 700⟨ Nch ⟩
(b)
v3 0.2 < pT(GeV/c) < 4
0.01
0.02
0 175 350 525 700
vn
(a)
|veven1 |
0.2 < pT(GeV/c) < 0.9
0
0.01
0 0.02 0.04
C
⟨ Nch ⟩-1
STAR Preliminary
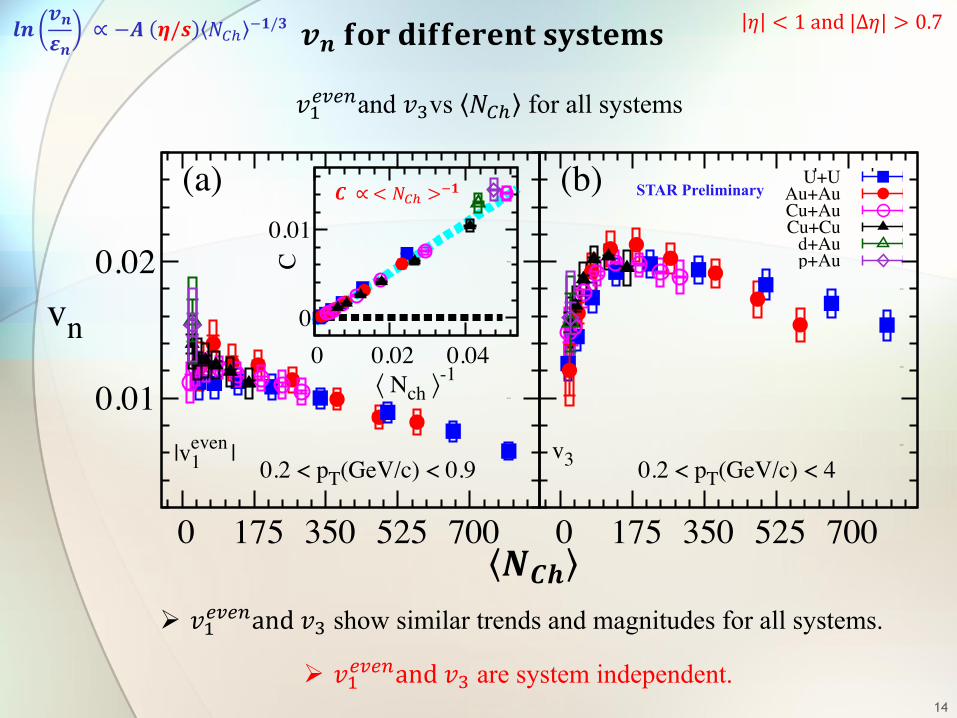
𝑣l���Oand 𝑣vs 𝑁Ri for all systems
𝒗𝒏𝐟𝐨𝐫𝐝𝐢𝐟𝐟𝐞𝐫𝐞𝐧𝐭𝐬𝐲𝐬𝐭𝐞𝐦𝐬𝜂 < 1and|Δ𝜂| > 0.7𝒍𝒏
𝒗𝒏𝜺𝒏
∝ −𝑨 𝜼/𝒔 𝑁Ri �𝟏/𝟑
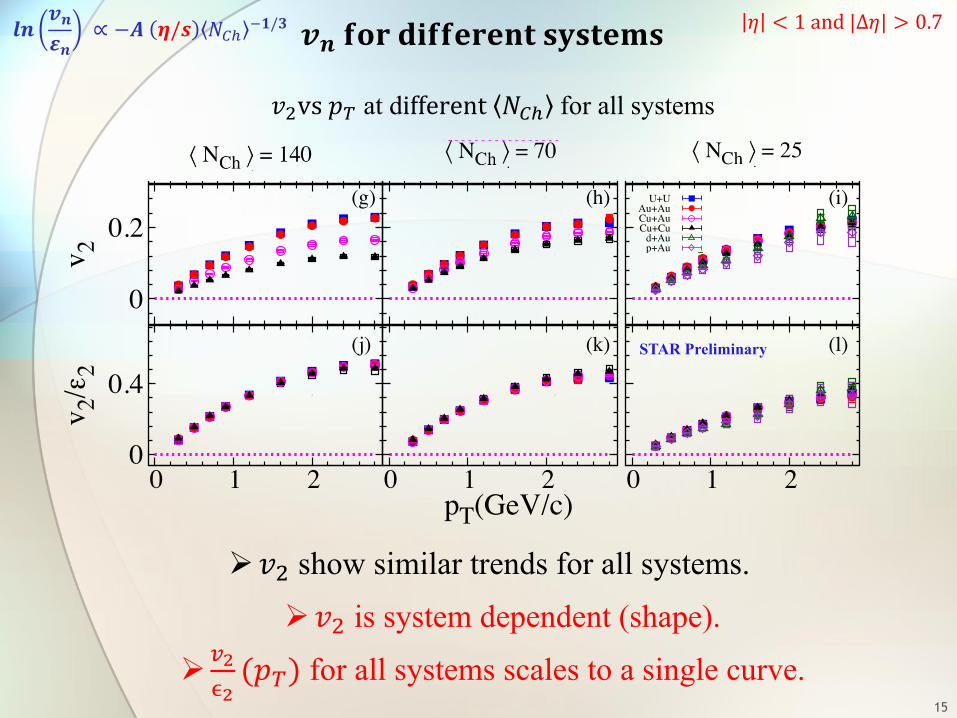
Ø𝑣v is system dependent (shape).
Ø𝑣v show similar trends for all systems.
15
Ø�¶Í¶(𝑝~) for all systems scales to a single curve.
𝑣vvs𝑝~ at different 𝑁Ri for all systems
𝒗𝒏𝐟𝐨𝐫𝐝𝐢𝐟𝐟𝐞𝐫𝐞𝐧𝐭𝐬𝐲𝐬𝐭𝐞𝐦𝐬𝜂 < 1and|Δ𝜂| > 0.7
0
0.1
0 1 2
veven
1⟨ NCh ⟩ = 140
(a)
0
0.1
0 1 2
veven
1
⟨ NCh ⟩ = 70
(b)U+UAu+AuCu+AuCu+Cu
0
0.1
0 1 2
veven
1
⟨ NCh ⟩ = 25
(c)U+UAu+AuCu+AuCu+Cu
d+Aup+Au
0
0.1
0 1 2
v 3
(d)
0
0.1
0 1 2
v 3
(e)
0
0.1
0 1 2
v 3
(f)
0
0.2
0 1 2
v 2
(g)
0
0.2
0 1 2
v 2
(h)
0
0.2
0 1 2
v 2
(i)
0
0.4
0 1 2
v 2/ε
2
(j)
0
0.4
0 1 2
v 2/ε
2
(k)
pT(GeV/c)
0
0.4
0 1 2v 2
/ε2
(l)
STAR Preliminary
0
0.1
0 1 2
veven
1
⟨ Nch ⟩ = 140
(a)
0
0.1
0 1 2
veven
1
⟨ Nch ⟩ = 70
(b)U+UAu+AuCu+AuCu+Cu
0
0.1
0 1 2
veven
1
⟨ Nch ⟩ = 25
(c)U+UAu+AuCu+AuCu+Cu
d+Aup+Au
0
0.1
0 1 2
v 3(d)
0
0.1
0 1 2
v 3
(e)
0
0.1
0 1 2
v 3
(f)
0
0.2
0 1 2
v 2
(g)
0
0.2
0 1 2
v 2
(h)
0
0.2
0 1 2
v 2
(i)
0
0.4
0 1 2
v 2/ε
2
(j)
0
0.4
0 1 2
v 2/ε
2
(k)
pT(GeV/c)
0
0.4
0 1 2
v 2/ε
2
(l)
𝒍𝒏𝒗𝒏𝜺𝒏
∝ −𝑨 𝜼/𝒔 𝑁Ri �𝟏/𝟑
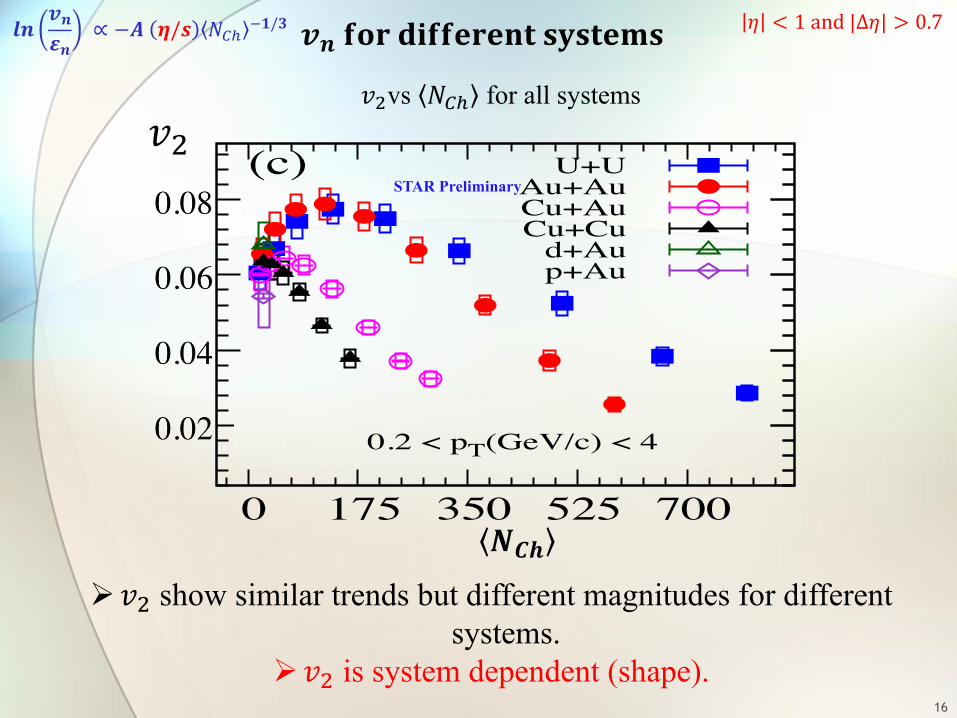
Ø𝑣v show similar trends but different magnitudes for different systems.
Ø𝑣v is system dependent (shape).16
0.02
0.04
0.06
0.08
0 175 350 525 700
0.02
0.04
0.06
0.08(c)
v2 0.2 < pT(GeV/c) < 4
U+UAu+AuCu+AuCu+Cu
d+Aup+Au
0.01
0.02
0 175 350 525 700⟨ Nch ⟩
(b)
v3 0.2 < pT(GeV/c) < 4
0.01
0.02
0 175 350 525 700
vn
(a)
|veven1 |
0.2 < pT(GeV/c) < 0.9
0
0.01
0 0.02 0.04
C
⟨ Nch ⟩-1
𝑣v
𝑵𝑪𝒉
STAR Preliminary
𝑣vvs 𝑁Ri for all systems
𝒗𝒏𝐟𝐨𝐫𝐝𝐢𝐟𝐟𝐞𝐫𝐞𝐧𝐭𝐬𝐲𝐬𝐭𝐞𝐦𝐬𝜂 < 1and|Δ𝜂| > 0.7𝒍𝒏
𝒗𝒏𝜺𝒏
∝ −𝑨 𝜼/𝒔 𝑁Ri �𝟏/𝟑
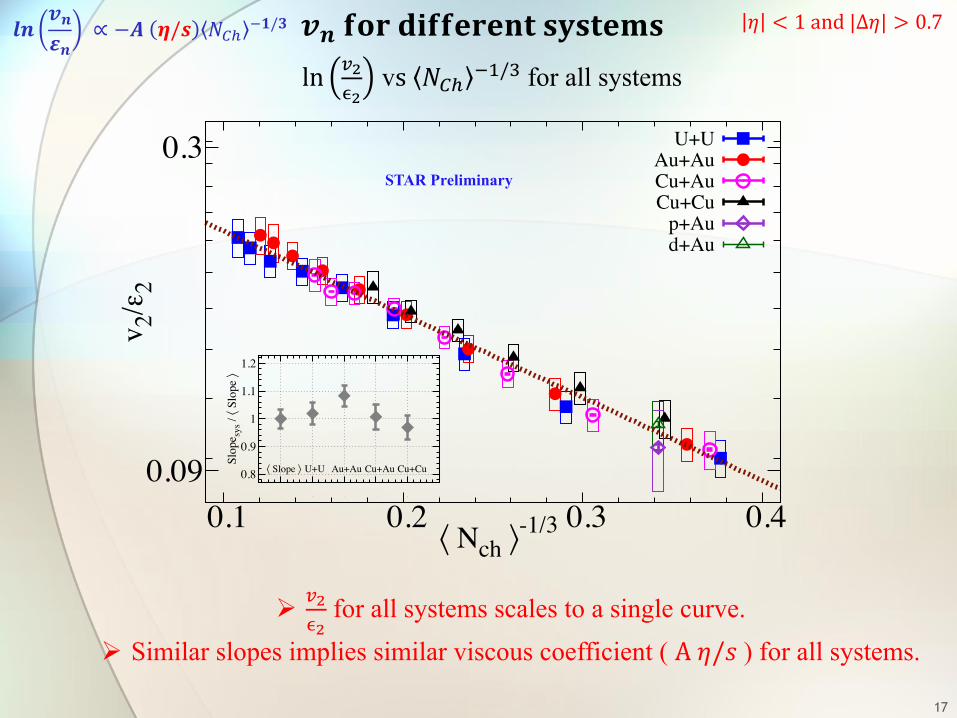
ln �¶Í
vs 𝑁Ri �l/for all systems
Ø�¶Í
for all systems scales to a single curve.Ø Similar slopes implies similar viscous coefficient ( A𝜂/𝑠) for all systems.
17
𝒗𝒏𝐟𝐨𝐫𝐝𝐢𝐟𝐟𝐞𝐫𝐞𝐧𝐭𝐬𝐲𝐬𝐭𝐞𝐦𝐬 𝜂 < 1and|Δ𝜂| > 0.7
STAR Preliminary
0.09
0.3
0.1 0.2 0.3 0.4
v 2/ε
2
⟨ Nch ⟩-1/3
U+UAu+AuCu+AuCu+Cu
p+Aud+Au
0.8
0.9
1
1.1
1.2
1 2 3 4 5 6
Slop
e sys
/ ⟨ S
lope
⟩
⟨ Slope ⟩ U+U Au+Au Cu+Au Cu+Cu
𝒍𝒏𝒗𝒏𝜺𝒏
∝ −𝑨 𝜼/𝒔 𝑁Ri �𝟏/𝟑
ConclusionComprehensive set of STAR measurements presented for
𝑣O(𝑝~, 𝑁Ri ) for several collision systems.
ØScaling the system size;ü The odd harmonics are system independentü The even harmonics are system dependentü
�¶Í
for all systems scaled onto one curve to ~15% in slope
At the same energy, the scaling features suggest similar viscous coefficient (A �
h) for different systems.
18
ØNon-flow suppressionü 𝛥𝜂 cut used to suppress the short range non-flowü 𝑐v 4 shows negative value for all presented systems.

19