rhode island 21st century community learning center ... · community learning center program...
TRANSCRIPT
MONTH YEAR
Rhode Island 21st Century
Community Learning Center
Program Evaluation:
Evaluation Report 2011-12
Matthew Vinson
Julia Marchand
Mariel Sparr
Deborah Moroney
June 2013
Education

Rhode Island 21st Century Community
Learning Centers Program Evaluation:
Evaluation Report 2011-12
June 2013
Julia Marchand
Mariel Sparr
Matthew Vinson
Deborah Moroney
20 North Wacker Drive, Suite 1231
Chicago, IL 60606-2901
800-356-2735 312-288-7600
www.air.org
Copyright © 2012 American Institutes for Research. All rights reserved. 1256_06/13
February 2013
Contents
Page
I. Executive Summary ...................................................................................................................... i
II. Introduction .................................................................................................................................1
Evaluation Questions .................................................................................................................1
Background and Organization of the Report .............................................................................1
III. Grantee and Center Characteristics ............................................................................................4
Data Source ................................................................................................................................4
Summary of Grantee and Center Characteristics .......................................................................4
Detailed Analysis: Grantee Characteristics ...............................................................................5
Detailed Analysis: Center Characteristics .................................................................................7
IV. Program Attendance and Activities .........................................................................................11
Data Source ..............................................................................................................................11
Summary of Program Attendance and Activities ....................................................................11
Detailed Analysis: Program Attendance and Activities...........................................................11
V. Organizational Processes ..........................................................................................................18
Data Source ..............................................................................................................................18
Summary of Findings ...............................................................................................................18
Detailed Analysis .....................................................................................................................20
VI. Impact Analysis .......................................................................................................................40
Data Source ..............................................................................................................................40
Impact of 21st CCLC Participation on Student Outcomes .......................................................40
Limitations of the Results ........................................................................................................45
VII. Conclusion and Recommendations ........................................................................................46
References ......................................................................................................................................48
Appendix. Core Survey Items ........................................................................................................50

American Institutes for Research Statewide Evaluation of RI 21st CCLC Program: Final Report—i
I. Executive Summary
American Institutes for Research (AIR), on behalf of the Rhode Island Department of Education
(RIDE), has undertaken an evaluation of Rhode Island’s 21st Century Community Learning
Centers (21st CCLC) program. This evaluation aimed to address the following questions:
1. To what extent is there evidence that students participating in services and activities
funded by 21st CCLC demonstrated better performance on the outcomes of interest as
compared with similar students not participating in the program?
2. To what extent is there evidence that students participating in services and activities
funded by 21st CCLC grants more frequently demonstrated better performance on the
outcomes of interest?
3. To what extent is there evidence of a relationship between center and student
characteristics and the likelihood that students demonstrated better performance on
desired program outcomes?
This evaluation report addresses these questions using data associated with the 2011-12 school
year.
It is important to first understand the characteristics of the 21st CCLC program in Rhode Island
in order to describe and assess program impact. In terms of descriptive information, analysis of
data from the Profile and Performance Information Collection System (PPICS) shows that there
were 38 subgrantees active during the 2012 Annual Performance Report (APR) period (summer
2011, school year 2011–12). These subgrantees operated a total of 56 centers, nearly all of which
were school based (93 percent) and 22 of which served elementary grades only (39 percent).
Across all centers, a total of 12,388 students were served, for an average of 221 students per
center. Of these students, 4,532 (37 percent) were regular attendees, attending 30 days or more
during the reporting period. Of all regular attendees, 39 percent were identified as Hispanic, and
33 percent as white. Nearly all centers served students during the school year (98 percent of
programs), and most also operated during the summer (79 percent). Compared with the nation,
centers in Rhode Island tended to offer more enrichment activities as a proportion of their overall
hours: 34 percent of Rhode Island centers were identified as offering Mostly Enrichment
activities, as opposed to 21 percent of centers nationally. This was also true for recreation: 32
percent of Rhode Island centers were identified as offering Mostly Recreation, compared with 24
percent nationally.
Sound organizational processes support program quality and ultimately youth outcomes. In order
to describe common organizational practices across Rhode Island’s 21st CCLC program, site
managers working in the state’s centers completed a survey during the 2011–12 academic year.
A total of 56 surveys were distributed to site managers, with the term site manager being defined
as the individual at a given center responsible for the day-to-day operations of the program. A
total of 46 surveys (88 percent response rate) were completed and returned.

American Institutes for Research Statewide Evaluation of RI 21st CCLC Program: Final Report—ii
The survey covered organizational processes (i.e., indicators of program quality) related to:
partnership and collaboration, professional development, quality improvement processes, and
intentionality in program content and activities. In terms of partnership and collaboration, most
site managers reported that partners/collaborators (67 percent of total responses) and certified
teachers (85 percent) lead program activities that likely enhance the quality and breadth of
activities offered to participating youth. A little more than a quarter of respondents (28 percent)
indicated that attended professional development was insufficient. Asked about the Rhode Island
Program Quality Assessment (RIPQA) process, site managers reported working an average of
eight hours with Quality Advisors, and generally included two program staff in work with
Quality Advisors. Major topics of work with Quality Advisors included training staff and setting
program goals. Most site managers (58 percent) reported a moderate impact of RIPQA
participation on various aspects of programming.
In terms of intentional program content and activities, 63 percent of site managers reported
conducting a formal needs assessment, and less than one half (44 percent) completed a structured
planning process. About one third of site managers (30 percent) reported developing an action
plan, and slightly less than one fourth (22 percent) assessed participants’ social-emotional
competencies. With respect to data use, site managers generally (60 percent) reported only
occasional use of student data to plan program activities. Roughly one fifth (21 percent) of site
managers reported no use of or access to various types of student data to plan program activities.
To assess program impact on student outcomes, 21st CCLC participants were matched with a
group of non-participants (attending the same schools during the school day) using propensity
score matching (PSM). PSM is a technique that approximates, as best as possible, a random
assignment to treatment and non-treatment groups: Based on demographic and school
characteristics, students’ propensity to attend 21st CCLC is first given a score, and then students
with similar propensity scores from the non-participant pool of students are selected to create a
comparison group. While not as rigorous as a random-assignment model, this method of
comparison controls for student or school characteristics that could skew the results via selection
bias.
The outcomes assessed in the comparison study were: 1) Changes in reading and mathematics
assessment scale scores from one year to the next; 2) unexcused absence rates; and 3) the number
of disciplinary incidents.
In terms of state assessment results, little to no significant impact was observed. There was a
statistically significant, positive impact of 21st CCLC on reading achievement for students
attending 21st CCLC programming for 30 days or more, but the effect size was small (.055
standard deviation units higher than the comparison group), and no other significant effects were
observed (for reading or mathematics).
The effects of 21st CCLC participation on unexcused absences and disciplinary incidents were
more pronounced. Statistically significant, negative effects of 21st CCLC participation were
found for both unexcused absences and the number of disciplinary incidents at both the 30 days
or more and 60 days or more treatment levels (i.e., students participating in 21st CCLC at these
levels had fewer unexcused absences and disciplinary incidents than did students in the non-
American Institutes for Research Statewide Evaluation of RI 21st CCLC Program: Final Report—iii
participation group). Generally, students in the treatment group displayed 30 to 40 percent the
rate of unexcused absences and disciplinary incidents displayed by students in the non-treatment
group. Comparing treatment and non-treatment groups by grade level, significant, negative
effects of 21st CCLC participation on unexcused absences were also observed for all grades
except tenth (the data did not converge for grade 10, and were therefore excluded from analysis);
in similar fashion, the percentage of disciplinary incidents in the treatment group was lower (and
statistically significant) than that of the comparison group for grades 4-10 and 12 (with other
grades showing no statistically significant effects, the effects observed for these grades having a
relatively high likelihood of being due merely to chance).
American Institutes for Research Statewide Evaluation of RI 21st CCLC Program: Final Report—1
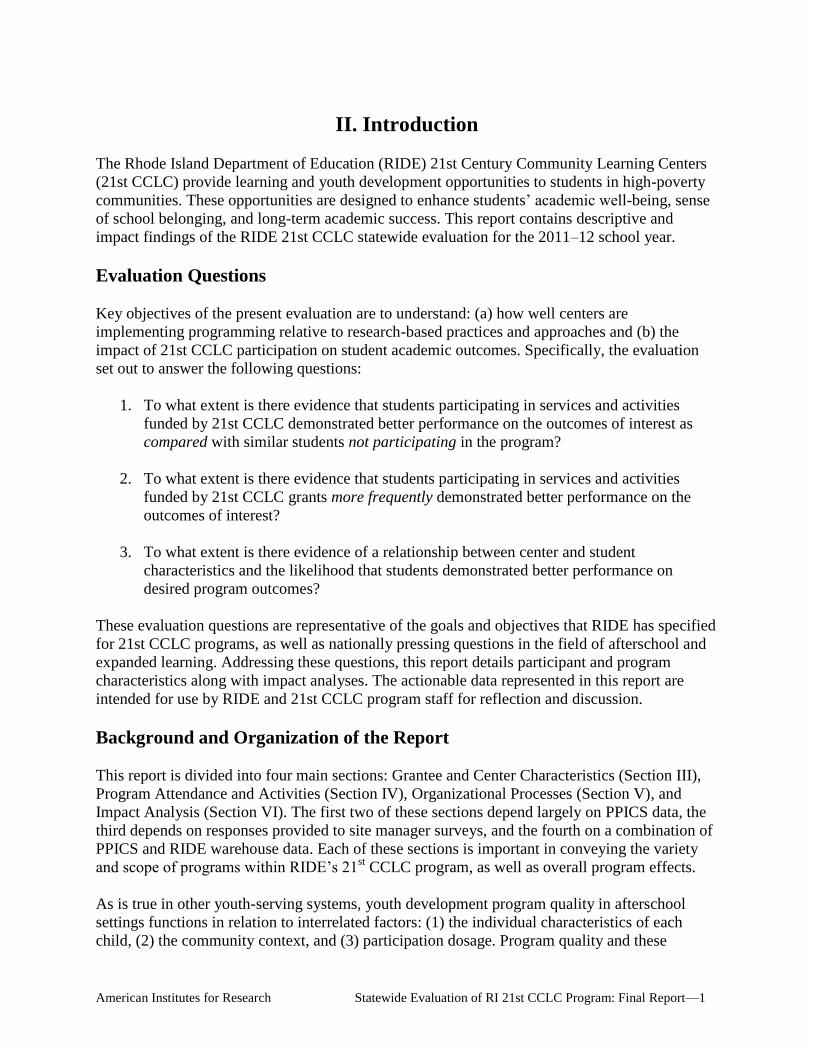
II. Introduction
The Rhode Island Department of Education (RIDE) 21st Century Community Learning Centers
(21st CCLC) provide learning and youth development opportunities to students in high-poverty
communities. These opportunities are designed to enhance students’ academic well-being, sense
of school belonging, and long-term academic success. This report contains descriptive and
impact findings of the RIDE 21st CCLC statewide evaluation for the 2011–12 school year.
Evaluation Questions
Key objectives of the present evaluation are to understand: (a) how well centers are
implementing programming relative to research-based practices and approaches and (b) the
impact of 21st CCLC participation on student academic outcomes. Specifically, the evaluation
set out to answer the following questions:
1. To what extent is there evidence that students participating in services and activities
funded by 21st CCLC demonstrated better performance on the outcomes of interest as
compared with similar students not participating in the program?
2. To what extent is there evidence that students participating in services and activities
funded by 21st CCLC grants more frequently demonstrated better performance on the
outcomes of interest?
3. To what extent is there evidence of a relationship between center and student
characteristics and the likelihood that students demonstrated better performance on
desired program outcomes?
These evaluation questions are representative of the goals and objectives that RIDE has specified
for 21st CCLC programs, as well as nationally pressing questions in the field of afterschool and
expanded learning. Addressing these questions, this report details participant and program
characteristics along with impact analyses. The actionable data represented in this report are
intended for use by RIDE and 21st CCLC program staff for reflection and discussion.
Background and Organization of the Report
This report is divided into four main sections: Grantee and Center Characteristics (Section III),
Program Attendance and Activities (Section IV), Organizational Processes (Section V), and
Impact Analysis (Section VI). The first two of these sections depend largely on PPICS data, the
third depends on responses provided to site manager surveys, and the fourth on a combination of
PPICS and RIDE warehouse data. Each of these sections is important in conveying the variety
and scope of programs within RIDE’s 21st CCLC program, as well as overall program effects.
As is true in other youth-serving systems, youth development program quality in afterschool
settings functions in relation to interrelated factors: (1) the individual characteristics of each
child, (2) the community context, and (3) participation dosage. Program quality and these

American Institutes for Research Statewide Evaluation of RI 21st CCLC Program: Final Report—2
interrelated factors ultimately affect youth outcomes (Durlak, Mahoney, Bohnert, & Parente,
2010). The emerging literature in afterschool program quality is clear on defining these
dimensions of best practice and in articulating that there are contextually driven indicators of
quality that are not possible to unilaterally describe without relation to one another (Noam, 2008;
Durlak at al., 2010). It is, therefore, not until we understand how these factors interact that we
can truly describe the impact of afterschool and expanded learning programs. Figure 1 depicts
the interrelated factors that influence youth outcomes in afterschool settings. Note that this
theory of change is not intended to be a final or prescriptive; rather, this framework is a “mental
scaffold” on which to build, and is intended to be refined further in the future. It is provided here
as a starting point, and as a way of organizing the report findings.
Figure 1. Theory of Change in Afterschool and Expanded Learning Settings
Note that diversity in how 21st CCLC grantees design and run their programs is supported by the
current body of knowledge in afterschool research, which suggests that a variety of paths can be
taken in both the design and delivery of afterschool programs that may lead to improved
participant academic and social and emotional learning outcomes (Birmingham, Pechman,
Russell, & Mielke, 2005; Black, Doolittle, Zhu, Unterman, & Grossman, 2008; Durlak &
Weissberg, 2007; Granger, 2008; Lauer et al., 2006; Vandell et al., 2005). The research indicates,
however, that quality matters: much of the afterschool research has found an uneven level of
effectiveness in promoting positive participant outcomes that are largely based on variation in
program quality (Granger, 2008). Further, meaningful progress has been made in uncovering

American Institutes for Research Statewide Evaluation of RI 21st CCLC Program: Final Report—3
what constitutes quality afterschool programming (Granger, Durlak, Yohalem, & Reisner, 2007;
Little, 2007; Vandell et al., 2005; Wilson-Ahlstrom & Yohalem, 2007; Yohalem, Wilson-
Ahlstrom, Fischer, & Shinn, 2009). Markedly, studies suggest that a primary catalyst for
maintaining and improving program quality is found when midlevel managers and program staff
have ongoing access to program data (e.g., evaluation data, observation data, self-assessment
data) to make informed program improvements (Smith, Peck, Denault, Blazevski, & Akiva,
2010). Statewide evaluations of 21st CCLC programs should not therefore be viewed only as an
opportunity to collect and analyze data for the purpose of state and national program monitoring
and improvement efforts, but also as a way of reporting back to grantees for the purpose of
ongoing quality improvement efforts.
As noted, this report is divided into four main sections. These sections are designed to explore
the elements of the theory of change depicted in Figure 1: Chapter III details the context of the
program (grantee and center characteristics); Chapter IV describes participation (program
attendance and activities); Chapter V provides a description of how grantees are aligned with
organizational processes; and Chapter VI provides an assessment of program impact on youth
outcomes (state assessment score changes, unexcused absence rates, and disciplinary incident
rates). The methodology, measures, summary and detailed findings of each section are contained
in those chapters.
American Institutes for Research Statewide Evaluation of RI 21st CCLC Program: Final Report—4
III. Grantee and Center Characteristics
The description of context and the setting of afterschool and expanded learning programs is
one of the interrelated set of factors that determine program quality and ultimately influence
participant outcomes. This chapter provides a broad description of the characteristics of
21st CCLC programs in Rhode Island in relation to program schedule, setting, and staffing
patterns.
Data Source
The 21st CCLC Profile and Performance Information Collection System (PPICS) is a Web-based
data collection system developed and maintained by American Institutes for Research (AIR) on
behalf of the U.S. Department of Education. Data on the full domain of 21st CCLC programs
funded nationally, including those in Rhode Island, are collected through this system. PPICS
consists of various data collection modules, including the Annual Performance Report (APR)
completed by grantees once a year to summarize operational elements of their program, the
student population served, and the extent to which students showed improvements in academic-
related behaviors and achievement. In this report, grantee and center data are primarily analyzed
along two dimensions: across APR years and across various program categories. In some places,
where appropriate, national numbers are provided for reference.1 Where otherwise unmarked,
data are taken from APR 2012, which covered program operations during the summer of 2011
and the 2011–12 school year.
Note that the term grantee in this report refers to an entity that applies for grants and serves as
the fiscal agent for a given 21st CCLC grant. The term center refers to the physical location
where grant-funded services and activities are provided to participating students and adults.
Summary of Grantee and Center Characteristics
During the 2011–12 Annual Reporting Period, 38 active 21st CCLC grantees across the state
of Rhode Island operated a total of 56 centers. School-based and non-school-based grantees
were represented in roughly equal numbers, and grantees classified as Community-Based
Organizations made up the largest segment of non-school-based fiscal agents. PPICS data
also showed the following grantee and center characteristics:
Awards in Rhode Island have been made for five years and have tended to be somewhat
lower than awards across the nation in terms of both average and median.
Most grantees are mature (not in the first or last years of funding).
The vast majority of Rhode Island centers (98 percent) offered school-year programming
during afterschool hours, and most (79 percent) also operated in the summer.
1 With respect to national comparison values, note that the national numbers do not reflect finalized data: APR 2012
data reporting, at the time of compiling this report, was still open, with four different states incomplete. The national
comparison numbers, therefore, do not reflect all 21st CCLCs that were active during the APR 2012 period, but
rather the vast majority.
American Institutes for Research Statewide Evaluation of RI 21st CCLC Program: Final Report—5
Rhode Island centers most commonly served elementary school students; 39 percent of
all centers were classified as Elementary Only in APR 2012. The percentage of centers
serving elementary students exclusively has stayed about the same over the past few
years.
Rhode Island centers typically employ a mix of youth development workers, staff with no
college, and school-day teachers (40 percent); school-day teachers and other school staff
(27 percent); or school-day teachers only (24 percent), which is roughly consistent with
national averages.
Detailed Analysis: Grantee Characteristics
Grantee Maturity
Grantee maturity is described here because it is hypothesized that more mature grantees have the
experience necessary for providing high-quality programming, adapting to budget reductions,
and sustaining program operations. To facilitate comparisons with national data housed in
PPICS, Rhode Island grantees were classified into three possible maturity categories:
New—grantees in their first year of 21st CCLC funding
Mature—grantees not in their first year, but also not in their last year of funding
Sustaining—grantees in their last year of 21st CCLC funding
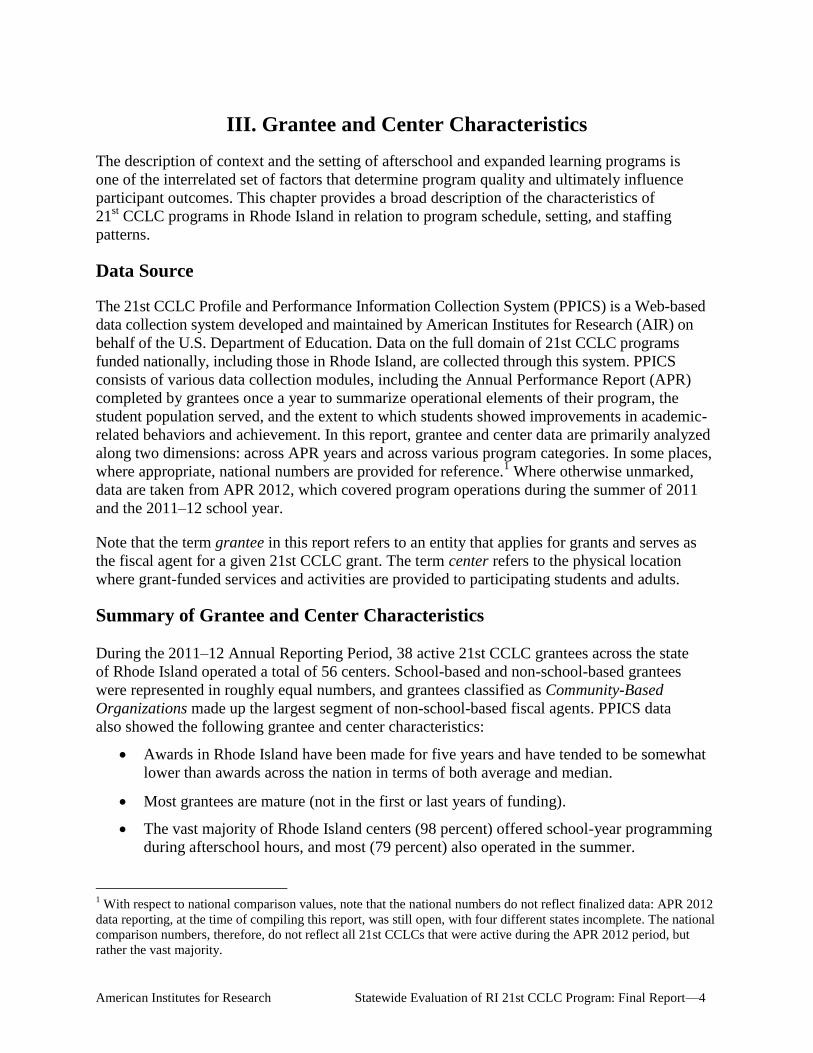
As shown in Table 1, during APR 2012 there was a smaller proportion of grants that were
Sustaining and a higher proportion of grants that were Mature. In Rhode Island, there were no
grants that were defined as New. Awards in Rhode Island are for five years; award lengths across
the nation vary from three to five years.
Table 1. Grants by Maturity
RI Grants
All Grants*
Grant Maturity
N Grants
% Grants
N Grants
% Grants
New 0 0.0% 421 10.6%
Mature 26 68.4% 2,072 52.1%
Sustaining 12 31.6% 1,481 37.3%
Total grantees 38 100.0% 3,974 100.0%
*Organization maturity could not be determined for 142 grantees at the national level.
Grantee Organization Type

American Institutes for Research Statewide Evaluation of RI 21st CCLC Program: Final Report—6
All grantee organizations can be placed into one of two main groups: school-based and non-
school-based. With the passage of the No Child Left Behind Act, funding eligibility was
expanded beyond schools to include public and private educational and youth organizations.
These organizations are referred to as non-school-based organizations. School-based
organizations (SBO) include school districts, charter schools, and private schools. Non-school-
based organizations (NSBO) include, among other entities, community-based organizations,
faith-based organizations, health-based organizations, and park districts. Both SBOs and NSBOs
may apply for grants.
Of 21st CCLC grantees funded by Rhode Island, school-based and non-school based
organizations have been represented roughly equally. In 2012, for example, school districts were
the fiscal agents on 20 of the 38 active grants (53 percent of all 21st CCLC grants). Figure 2
shows the comparison across seven APR years.
Figure 2. Number of School-Based Versus Non-School-Based Grantees
Of the non-school-based grantees, Community-Based Organizations are the largest group,
making up more than 34 percent of all grantees in 2012. The next highest non-school based
grantee type was YMCAs/YWCAs, making up approximately 8 percent of all fiscal agents.
Grant Amounts
Rhode Island’s first-year grant award amounts and the duration of the grants were assessed
alongside national averages, as shown in Table 2. No major differences in terms of the average
length of a grant were noted between the two groups, but the average first-year award for Rhode
Island grantees was lower than the national average. Although not displayed in Table 2, the
median first-year award amounts for Rhode Island and the nation (Rhode Island inclusive) were,
respectively, $149,355 and $200,000.
8 8 14 14
19 20 18
13 13
19 19
21 21 20
0
5
10
15
20
25
30
35
40
45
2006 2007 2008 2009 2010 2011 2012
School Based
Non-School Based
American Institutes for Research Statewide Evaluation of RI 21st CCLC Program: Final Report—7
Table 2. Grants by First-Year Award Amount*
RI Grants
All Grants**
Award Amount and Duration
Mean
Mean
Year 1 award amount $156,105 $329,451
Award length 5 years 4.5 years
Total grantees
Mean number of centers per grant
38
1.5
4,116
2.5
*Of grantees reporting data for APR 2012.
**Exclusive Rhode Island grants.
Detailed Analysis: Center Characteristics
Center Organization Type
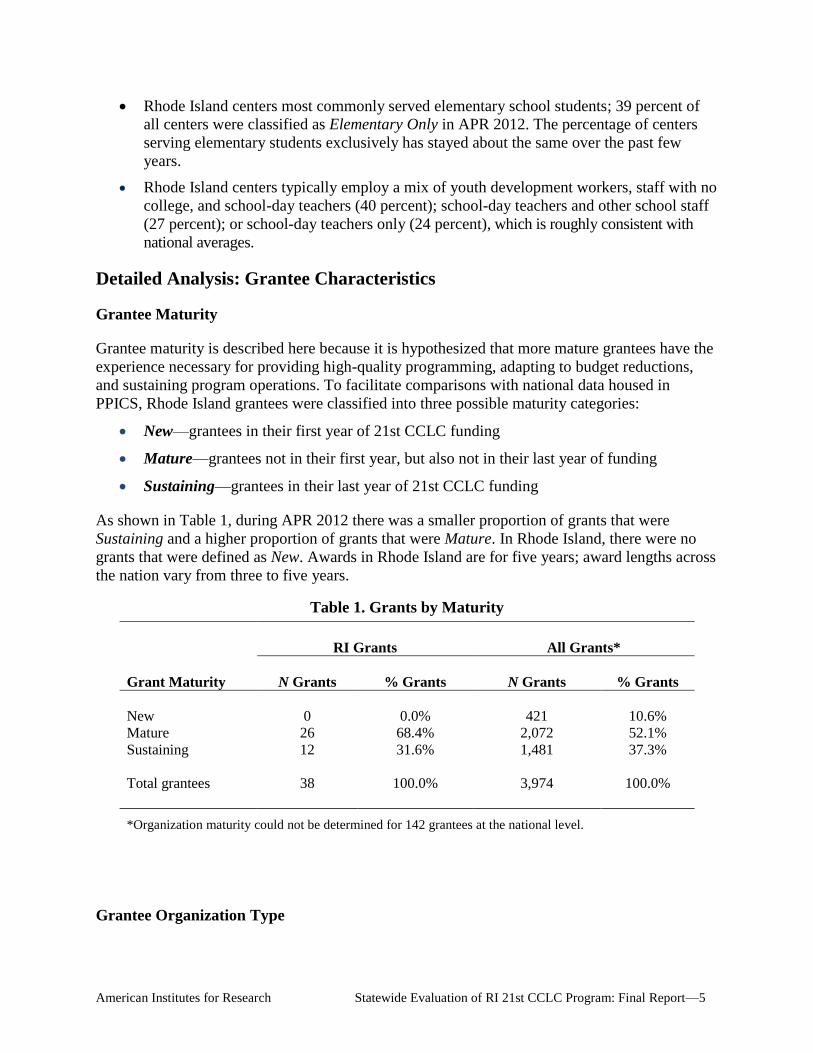
As with grantees, centers can be classified as either school-based or non-school based. During
APR 2012, the vast majority of Rhode Island’s centers (53 or 93 percent) were located in
schools (see Figure 3), which is above the national average of 87 percent.
Figure 3. School-Based Versus Non-School-Based Centers
School-Year and Summer Operations
A total of 55 centers in Rhode Island (98 percent) offered school-year programming during the
2012 reporting period. This is similar to the national average, 96 percent. Rhode Island centers
tended most often to offer programming after the school day (as opposed to before the school
day, during the school day, or on weekends), offering on average 11 hours of programming after
31 29
43 42
52 53 52
7 7 8 7 5 5 4
0
10
20
30
40
50
60
2006 2007 8 2009 2010 2011 2012
School Based
Non-School Based

American Institutes for Research Statewide Evaluation of RI 21st CCLC Program: Final Report—8
school each week. On average, Rhode Island offered slightly less programming during the school
year than did centers across the nation, with roughly 12.8 hours of programming per week
compared with 13.4 hours per week. Rhode Island centers offered programming an average of
4.2 days per week over 32 weeks, which is similar to national averages.
In terms of summer operations, a total of 44 of Rhode Island’s centers (79 percent) offered
summer programming, which was about the same as previous years. In 2012, Rhode Island
centers, however, were more likely than other centers nationwide to offer summer programming
(national average: 54 percent). Overall, Rhode Island centers tended to be very similar to other
centers nationwide that operate in the summer. Rhode Island centers with summer programs had,
on average, 5.5 weeks of programming (compared with 5.3 nationally) and approximately 27
hours of programming per week (compared with 25 hours of programming per week).
Grade Levels Served
A topic garnering increasing attention at the national level relates to the role that grade level
plays both in terms of how 21st CCLC programs should structure their operations and program
activities, and the outcomes for which they should be held accountable through performance
indicator systems. Using student-level data about the grade level of students attending a program,
21st CCLC programs were classified according to six categories:
Elementary Only—centers serving students up to Grade 6
Elementary/Middle School—centers serving students up to Grade 8
Middle School Only—centers serving students in Grades 5–8
Middle/High School—centers serving students in Grades 5–12
High School Only—centers serving students in Grades 9–12
Other—centers that did not fit one of the other five categories
The High School Only category is especially important to examine because afterschool programs
for older children often look considerably different from elementary or middle school programs
(Naftzger et al., 2007). High school students are experiencing developmental transitions different
from those of younger students and often have other afternoon obligations such as jobs, caring
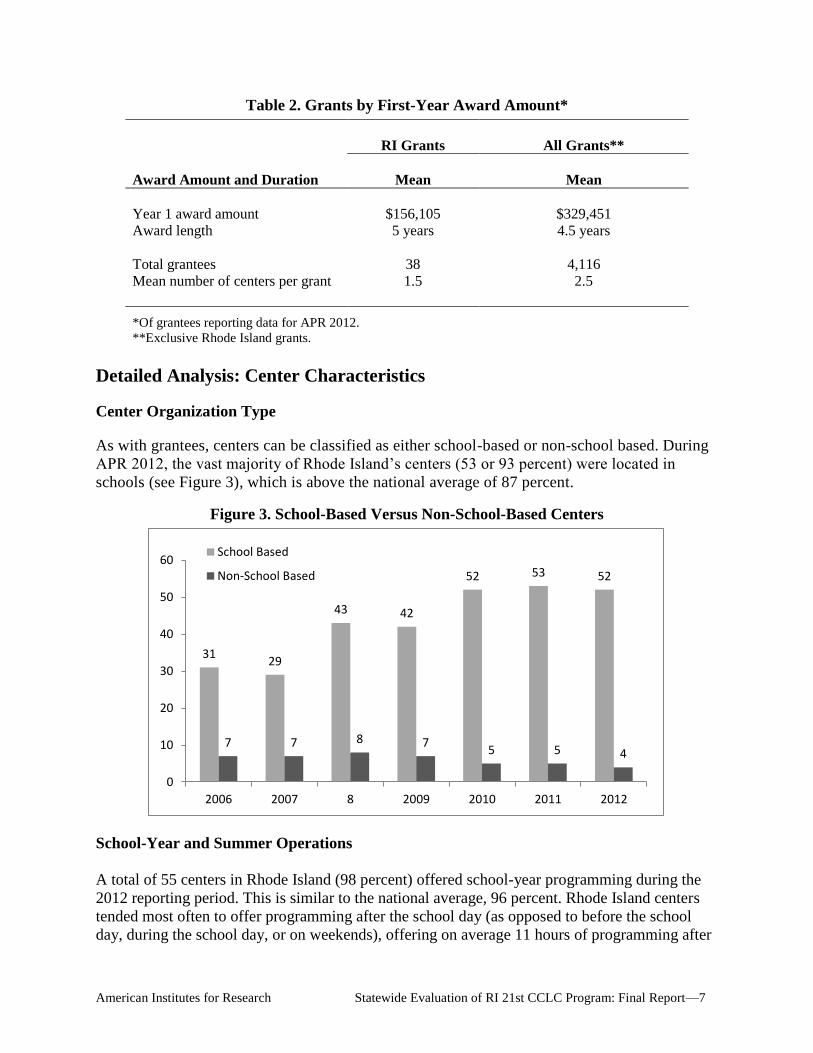
for younger siblings, or extracurricular activities. In terms of grade levels served, centers in
Rhode Island 21st CCLC programs most commonly serve elementary school students
exclusively, with 39 percent of all centers being classified as Elementary Only in APR 2012 (see
Figure 4). The percentage of centers serving elementary students exclusively has stayed about
the same over the past few years.
American Institutes for Research Statewide Evaluation of RI 21st CCLC Program: Final Report—9
Figure 4. Percentage of Centers per Grade-Level Cluster per Year
Note. Reflective of centers with grade-level status available. Two centers in 2006, along with one center each in
2008, 2009, and 2010 lacked a clear grade-level status.
Staffing
In terms of the staffing of Rhode Island 21st CCLCs, a total of 1,733 staff members were
reported for 2011–12 school-year operations (35 percent volunteer), and 608 for the summer of
2011 (20 percent volunteer). Of the school-year staff, 22 percent were paid school-day teachers,
and 14 percent were paid youth-development workers. Volunteer college students were the
largest volunteer group, accounting for 19 percent of school-year staff.
Summer staffing was very similar to school-year staffing in terms of staff type: 22 percent
summer staff being paid school-day teachers, and 18 percent other paid youth-development
workers. Volunteer high school students accounted for 11 percent of all summer staff.
In order to further classify centers into categories that meaningfully represent the extent to which
different types of staff are employed to deliver programming to youth (e.g., school-day teachers,
youth-development workers, college students), K-Means cluster analysis was employed using
center-level percentages for each category of staff. These percentages represent the extent to
which centers nationwide emphasized certain types of staff in the programming offered to
participating youth. Cluster analysis typically is employed to combine cases into groups using a
series of variables as criteria to determine the degree of similarity between individual cases, and
it is particularly well suited when there is a desire to classify a large number of cases into a
smaller domain of discrete groupings.2
Based on this analysis, roughly two thirds of Rhode Island centers typically employ a mix of
youth-development workers, staff with no college, and school-day teachers (40 percent); school-
2 Due to the fact APR 2012 data were not entirely complete at the time of this report (three states were missing APR
staffing information), the final cluster solution for 2012 may be somewhat different than presented here.
58
%
6%
22
%
3%
11
%
0%
53
%
6%
14
%
8%
11
%
8%
46
%
6%
26
%
4%
16
%
2%
44
%
8%
27
%
2%
17
%
2%
43
%
4%
30
%
2%
18
%
4%
41
%
5%
31
%
2%
17
%
3%
39
%
9%
20
%
14
%
13
%
5%
0%
10%
20%
30%
40%
50%
60%
70%
Elem Elem-Mid Mid Mid-High High Other
2006 2007 2008 2009 2010 2011 2012
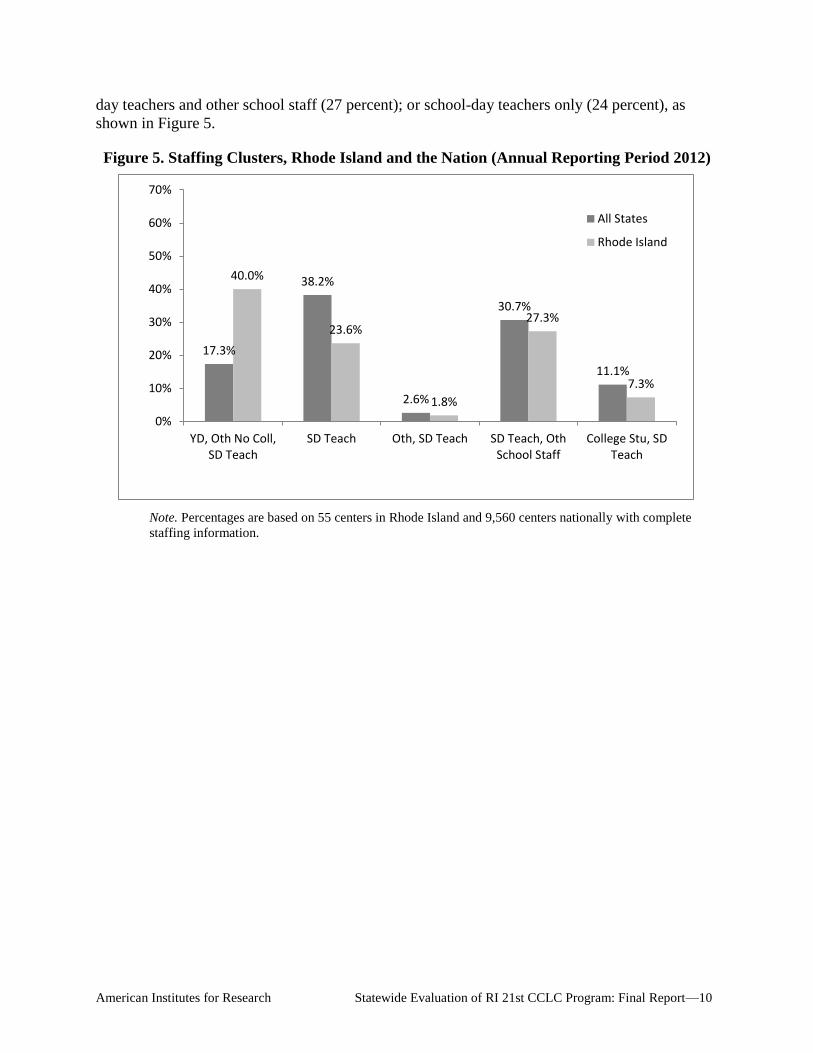
American Institutes for Research Statewide Evaluation of RI 21st CCLC Program: Final Report—10
day teachers and other school staff (27 percent); or school-day teachers only (24 percent), as
shown in Figure 5.
Figure 5. Staffing Clusters, Rhode Island and the Nation (Annual Reporting Period 2012)
Note. Percentages are based on 55 centers in Rhode Island and 9,560 centers nationally with complete
staffing information.
17.3%
38.2%
2.6%
30.7%
11.1%
40.0%
23.6%
1.8%
27.3%
7.3%
0%
10%
20%
30%
40%
50%
60%
70%
YD, Oth No Coll,SD Teach
SD Teach Oth, SD Teach SD Teach, OthSchool Staff
College Stu, SDTeach
All States
Rhode Island

American Institutes for Research Statewide Evaluation of RI 21st CCLC Program: Final Report—11
IV. Program Attendance and Activities
Student participation in afterschool and expanded learning programs is a critical variable in
predicting youth experience in programs and is one of the interrelated set of factors that indicate
program quality and ultimately influence participant outcomes. This chapter details 21st CCLC
program attendance and activities.
Data Source
Data on program attendance and activities for the 2011–12 programming period were extracted
from the APR module of PPICS. A total of 56 centers across the state associated with 38 21st
CCLC grants active during this programming period were represented in the data set extracted
from PPICS.
Summary of Program Attendance and Activities
A total of 12,388 students were reported as attending 21st CCLCs for at least one day
during the 2012 reporting period, with 37 percent classified as regular attendees.
On average, each center in Rhode Island served approximately 221 total students, among
whom 81 (37 percent) were regular attendees.
Rhode Island centers mostly served Hispanic and white students; 39 percent of all regular
attendees identified as Hispanic, and 33 percent identified as white.
When compared with the nation, centers in Rhode Island were more likely to offer Mostly
Enrichment activities (34 percent of all Rhode Island centers, 21 percent of centers
nationally) or Mostly Recreation activities (32 percent of all Rhode Island centers, 24
percent of centers nationally).
Detailed Analysis: Program Attendance and Activities
Center Attendance
As part of the APR data-collection process in PPICS, information is collected on the total
number of students that a given center served during the reporting period, how many of those
students met the definition of Regular Attendee by participating in 30 or more days of
programming, and demographic information about the student population in question, including
grade level and ethnicity.
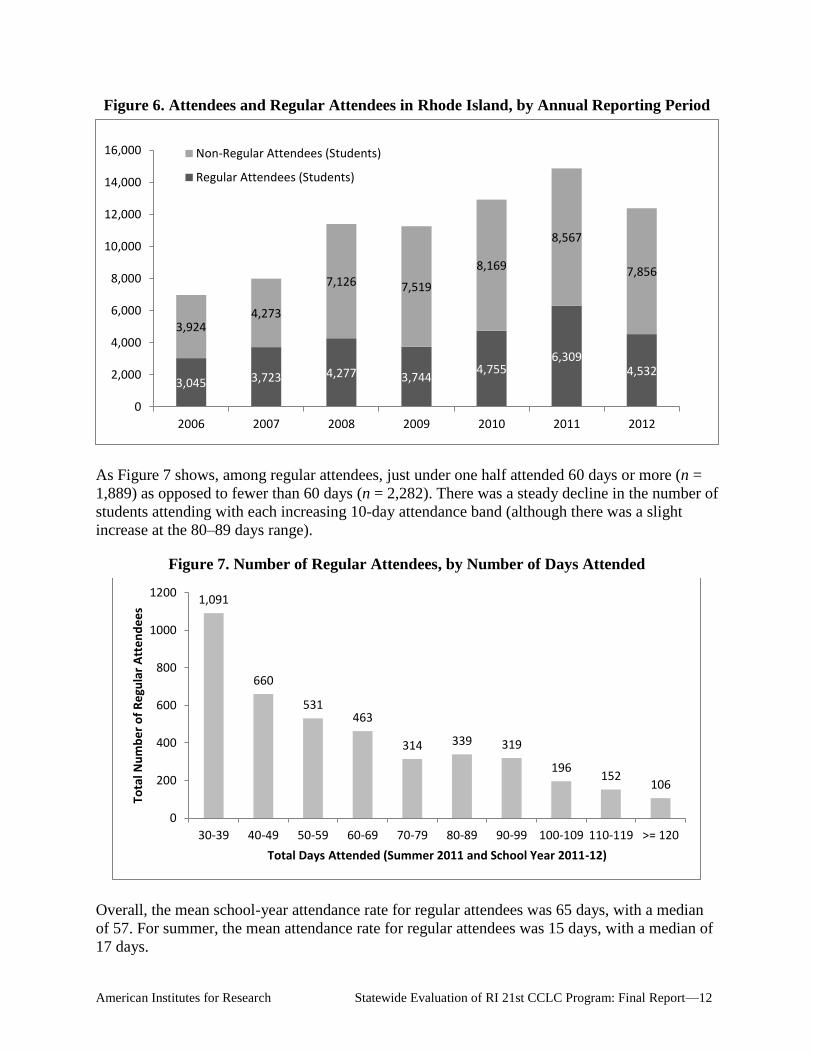
In Rhode Island, a total of 12,388 students were reported as attending 21st CCLC programs for at
least one day during the 2012 reporting period. Of these, 4,532 students—or 37 percent
(compared with 50 percent nationally)—were regular attendees. Annual attendance levels are
presented in Figure 6. Attendance was highest in 2011, dipping somewhat in 2012.
American Institutes for Research Statewide Evaluation of RI 21st CCLC Program: Final Report—12
Figure 6. Attendees and Regular Attendees in Rhode Island, by Annual Reporting Period
As Figure 7 shows, among regular attendees, just under one half attended 60 days or more (n =
1,889) as opposed to fewer than 60 days (n = 2,282). There was a steady decline in the number of
students attending with each increasing 10-day attendance band (although there was a slight
increase at the 80–89 days range).
Figure 7. Number of Regular Attendees, by Number of Days Attended
Overall, the mean school-year attendance rate for regular attendees was 65 days, with a median
of 57. For summer, the mean attendance rate for regular attendees was 15 days, with a median of
17 days.
3,045 3,723 4,277 3,744 4,755
6,309 4,532
3,924 4,273
7,126 7,519
8,169
8,567
7,856
0
2,000
4,000
6,000
8,000
10,000
12,000
14,000
16,000
2006 2007 2008 2009 2010 2011 2012
Non-Regular Attendees (Students)
Regular Attendees (Students)
1,091
660
531 463
314 339 319
196 152
106
0
200
400
600
800
1000
1200
30-39 40-49 50-59 60-69 70-79 80-89 90-99 100-109 110-119 >= 120
Tota
l Nu
mb
er
of
Re
gula
r A
tte
nd
ee
s
Total Days Attended (Summer 2011 and School Year 2011-12)

American Institutes for Research Statewide Evaluation of RI 21st CCLC Program: Final Report—13
On average, each center in Rhode Island served approximately 221 total students, among whom
81 (or 37 percent) were regular attendees. This was about the same as total attendance in
previous years. Median values show a similar trend. See Figure 8 for annual trends.
Figure 8. Average Attendance Rate per Center, by Annual Reporting Period,
Total and Regular Attendees (Rhode Island Only)
In terms of ethnicity, Rhode Island centers mostly served Hispanic and white students, with 39
percent of all regular attendees identified as Hispanic, and 33 percent identified as white. Figure
9 shows the total number of students and regular attendees according to student ethnicity.
Figure 9. Number of Total Students and Regular Attendees, by Ethnicity
188
222 224 230 227
256
221
80
103
84 76 83
109
81
0
50
100
150
200
250
300
2006 2007 2008 2009 2010 2011 2012
Total Students
Regular Attendees (Students)
4,140
3,802
2,297
339 145
0
1,702 1,462
1,041
132 37 0 0
500
1,000
1,500
2,000
2,500
3,000
3,500
4,000
4,500
Hispanic White Black Asian NativeAmerican
PacificIslander
Total RegularAttendees

American Institutes for Research Statewide Evaluation of RI 21st CCLC Program: Final Report—14
In terms of special status (limited English proficiency [LEP], free or reduced-price lunch
[FRPL], or special needs), the proportion of students stayed roughly level over the seven APR
periods. However, there was a slight decrease in the proportion of attendees identified as special
needs from 2007 to 2012, both for total attendees and for regular attendees (see Figures 10
through 13).
Figure 10. Percentage of Attendees, by LEP, FRPL, and Special-Needs Status
Figure 11. Number of Total and Regular Attendees, by Limited-English-Proficiency Status
Note. The number of students whose LEP status was unknown is not shown.
10
%
11
%
71
%
72
%
13
%
11
%
14
%
14
%
68
% 77
%
16
%
17
%
11
%
16
%
63
%
65
%
13
%
14
%
10
%
12
%
60
% 7
3%
10
%
11
%
8%
9%
67
%
75
%
12
%
11
%
9%
9%
59
%
56
%
11
%
8%
11
%
11
%
67
%
70
%
5%
5%
0%
10%
20%
30%
40%
50%
60%
70%
80%
90%
100%
LEP - TotalAttendees
LEP - RegularAttendees
FRPL - TotalAttendees
FRPL - RegularAttendees
Spec Needs -Total Attendees
Spec Needs -Regular
Attendees
2006 2007 2008 2009 2010 2011 2012
6,969 7,996
11,403 11,263
12,924
14,876
12,388
3,045 3,723
4,277 3,744
4,755
6,309
4,532
338 533 673 447 433 553 516 338 533 673 447 433 553 516 0
2,000
4,000
6,000
8,000
10,000
12,000
14,000
16,000
2006 2007 2008 2009 2010 2011 2012 2006 2007 2008 2009 2010 2011 2012
Total Attendees Regular Attendees
Total Students
LEP Unknown
LEP

American Institutes for Research Statewide Evaluation of RI 21st CCLC Program: Final Report—15
Figure 12. Number of Total and Regular Attendees, by FRPL Status
Note. The number of students whose FRPL status was unknown is not shown.
Figure 13. Number of Total and Regular Attendees, by Special-Needs Status
Note. The number of students whose special-needs status was unknown is not shown.
6,969 7,996
11,403 11,263
12,924
14,876
12,388
3,045 3,723
4,277 3,744
4,755
6,309
4,532
4,950 5,456 7,206 6,752 8,642 8,716 8,259 2,189 2,882 2,776 2,716 3,548 3,557 3,161 0
2,000
4,000
6,000
8,000
10,000
12,000
14,000
16,000
2006 2007 2008 2009 2010 2011 2012 2006 2007 2008 2009 2010 2011 2012
Total Attendees Regular Attendees
Total Students
FRPL Unknown
FRPL
6,969 7,996
11,403 11,263
12,924
14,876
12,388
3,045 3,723
4,277 3,744
4,755
6,309
4,532
922 1,281 1,485 1,176 1,608 1,608 592 330 622 594 427 537 515 207 0
2,000
4,000
6,000
8,000
10,000
12,000
14,000
16,000
2006 2007 2008 2009 2010 2011 2012 2006 2007 2008 2009 2010 2011 2012
Total Attendees Regular Attendees
Total Students
Spec Needs Unknown
Spec Needs
American Institutes for Research Statewide Evaluation of RI 21st CCLC Program: Final Report—16
Center Activities
Both the staff working at a given 21st CCLC site and the activities offered to participants are
critical in participants’ program experiences and potential benefits gained from participation in
21st CCLC programming. The national goal of the 21st CCLC program encompasses a host of
different types of activities, including the following, which are tracked in PPICS:
Academic enrichment learning program
Recreational activity
Homework help
Supplemental Education Services (SES) tutoring
Activity to promote youth leadership
Expanded library service hours
Drug/violence prevention, counseling, or character education
Career/job training
Promotion of family literacy
Mentoring
Community service/service learning
Promotion of parent involvement
Other (e.g., activities involving computers and technology, life skills, nutrition, etc.)
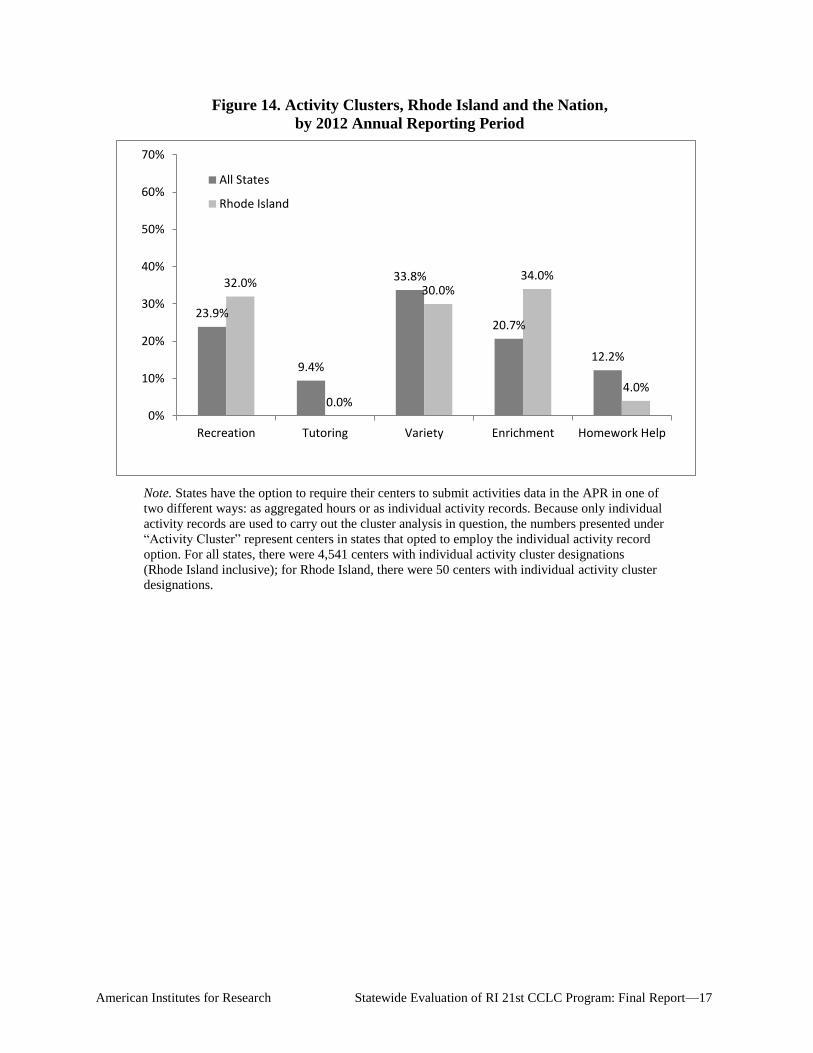
In order to further classify Rhode Island centers into categories that meaningfully represent the
relative emphasis given to providing different types of activities (academic enrichment, tutoring,
homework help, recreation, etc.), K-Means cluster analysis was employed using center-level
percentages for each category of activity. When compared with the nation, centers in Rhode
Island were more likely to fall into the Mostly Enrichment cluster (34 percent of all Rhode Island
centers compared with 21 percent of centers nationally) or the Mostly Recreation cluster (32
percent of all centers in Rhode Island, compared with 24 percent nationally), as shown in
Figure 14.
American Institutes for Research Statewide Evaluation of RI 21st CCLC Program: Final Report—17
Figure 14. Activity Clusters, Rhode Island and the Nation,
by 2012 Annual Reporting Period
Note. States have the option to require their centers to submit activities data in the APR in one of
two different ways: as aggregated hours or as individual activity records. Because only individual
activity records are used to carry out the cluster analysis in question, the numbers presented under
“Activity Cluster” represent centers in states that opted to employ the individual activity record
option. For all states, there were 4,541 centers with individual activity cluster designations
(Rhode Island inclusive); for Rhode Island, there were 50 centers with individual activity cluster
designations.
23.9%
9.4%
33.8%
20.7%
12.2%
32.0%
0.0%
30.0% 34.0%
4.0%
0%
10%
20%
30%
40%
50%
60%
70%
Recreation Tutoring Variety Enrichment Homework Help
All States
Rhode Island
American Institutes for Research Statewide Evaluation of RI 21st CCLC Program: Final Report—18
V. Organizational Processes
Implementation of sound organizational practices is crucial in supporting point-of-service
program quality. This chapter provides a description of organizational processes from survey
findings. These findings are aligned with the research-based indicators of program quality,
offering a snapshot of how 21st CCLC programs in Rhode Island are implementing best
practices.
Data Source
Site managers working in Rhode Island 21st CCLC centers completed a survey during the 2011–
12 academic year. The site manager was defined as the individual at a given center who is
responsible for the day-to-day operations of the program and serves as the point of contact for
parents and staff when questions or issues arise on-site. In general, site managers are often
viewed as important middle managers in the delivery of 21st CCLC programs.
A total of 52 surveys were administered. This number was based on identification of centers that
were active during the evaluation period. Completed surveys were received from 46 site
managers for a response rate of 88 percent. The survey addressed the extent to which centers
engaged in practices supported by research as effective in afterschool programming. Survey
items were organized within five dimensions of program operations: (1) Collaboration and
Partnerships, (2) Staffing, (3) Rhode Island Program Quality Assessment (RIPQA) Process, (4)
Intentional Program Content and Activities, and (5) Intentional Family Involvement Activities.
A series of questions were asked to assess more specific indicators of practices within each
dimension. (See the appendix for a list of core survey items organized by dimension.)
Summary of Findings
Dimension 1: Collaboration and Partnership
Most site managers reported that partners/collaborators and certified teachers lead
program activities, which likely enhances the quality and breadth of activities that are
offered to participating youth.
Most centers work informally or formally with partner agencies to establish program
goals and provide staff professional development. Few site managers reported working
with partner agencies to plan for program sustainability and expansion.
Staff members at centers generally work together on a monthly basis for program
planning and to discuss ways to improve programming or engage youth.
Most site managers report a minor strategy to align afterschool programming with the
regular school day. Site managers are more likely to report communication with regular
school-day staff as a major strategy—compared with more direct collaborations with
regular school-day staff to monitor participants’ academic performance or deliver
programming.

American Institutes for Research Statewide Evaluation of RI 21st CCLC Program: Final Report—19
Dimension 2: Staffing
Staff attended state and local meetings/trainings for professional development; however,
only slightly more than one half of site managers reported staff attending either new-staff
orientation or all-staff training prior to the start of the program year. Most site managers
reported that attended trainings were of either excellent or good quality and adequate.
Nearly one third of site managers rated the attended professional developments as
insufficient.
Staffing challenges were mostly minor, with approximately 15 percent of site managers
reporting more major, consistent staffing challenges. Common staffing challenges
included staff turnover and inadequate time for staff meetings and planning periods.
Dimension 3: RIPQA Process
Site managers reported working an average of eight hours with Quality Advisors and
generally included two program staff in work with Quality Advisors. Major topics of
work with Quality Advisors included training staff and setting program goals.
Most site managers reported a moderate impact of RIPQA participation on various
aspects of programming. Fewer than 15 percent of site managers generally reported no
impact of RIPQA participation on various aspects of programming. The most common
aspects of programming impacted by RIPQA participation included how staff interacts
with youth, professional development, and the design of program activities. Less
common aspects of programming impacted by RIPQA participation included alignment
with the regular school day and embedding content in program activities.
Dimension 4: Intentional Program Content and Activities
Sixty-three percent of site managers reported conducting a formal needs assessment, and
less than one half completed a structured planning process. One third of site managers
reported developing an action plan, and one fourth assessed participants’ social-
emotional competencies.
The most common high-priority program objective was raising the academic performance
of students who are interested in participating in the program.
Most site managers agreed with a series of statements of how youth build ownership of
the program, with only 5 percent disagreeing. The most common ways youth built
ownership of the program included youth providing feedback on programming and
making plans for program activities. Site managers reported that young people were
typically involved in planning program activities on a weekly or monthly basis.
Although a large portion of enrolled students were recruited for program participation
based on specific academic needs (e.g., referral from school or low performance on state
or local exams), site managers generally reported occasional use of student data to plan
program activities. Roughly one fourth of site managers reported no use of or access to
various types of student data to plan program activities. Individualized education plans
and student scores on district- or building-level assessments were least commonly used to
plan program activities.
American Institutes for Research Statewide Evaluation of RI 21st CCLC Program: Final Report—20
Commonly addressed subject areas included reading, art and music, mathematics, and
health and nutrition. Commonly unaddressed subject areas included engineering and
entrepreneurship.
Half of the surveyed site managers reported aligning program content in core academic
areas to Rhode Island state standards, and most (61 percent) do not use a published or
externally available curriculum to guide program activities.
Site managers reported that program activities were sometimes to frequently
characterized as developmentally responsive and appropriate, and well
planned/intentional. Only 12 percent to 20 percent reported that program activities
were always characteristic of developmentally responsive and appropriate and well-
planned/intentional aspects of program activities.
Dimension 5: Intentional Family Involvement Activities
Site managers generally reported that center staff sometimes communicate with families
about the program and their child’s progress and/or encourage family involvement in
program activities. Relative to frequency of communicating with families, site managers
were more likely to report frequently encouraging family involvement in program
activities.
Detailed Analysis
Many of the scales on the site manager survey contain a set of questions that are intentionally
designed to measure an underlying latent construct or indicator of quality (e.g., opportunities for
youth engagement). For scales of this type, Rasch analysis techniques used site manager
responses to a particular set of questions to create an overall scale score for the indicator in
question. These scale scores are an inferential statistic that provides a measure of site managers’
general response tendency within a given construct. For the purposes of interpretation, scale
scores at the indicator level were then calibrated with the survey response categories for the
respective set of questions. Results for scale scores are summarized with regard to the number
and percentage of site managers falling within a response category on the basis of their calibrated
scale scores in a given indicator.
Other findings presented in this chapter are not suited to the same sort of scale construction
discussed above. Findings of this type are described descriptively.
Dimension 1: Collaboration and Partnership
Indicators of program quality within this dimension include: (1) the presence and extent of
partnerships and collaborations within partner agencies, (2) the frequency of internal
collaboration among afterschool program staff, and (3) collaboration efforts to link the
afterschool program with the regular school day.
Presence and Extent of Partnerships and Collaborations With Partner Agencies. Within
21st CCLC programs, partners can play an important role in enhancing the variety of program
offerings available to youth and promoting program sustainability. Ideally, partners and grantees
American Institutes for Research Statewide Evaluation of RI 21st CCLC Program: Final Report—21
have developed a collaborative relationship to work on various aspects of program design and
delivery with a shared vision of program goals. The site manager survey measured the extent to
which sites have established partnerships and collaborate with partner agencies to implement key
program activities.
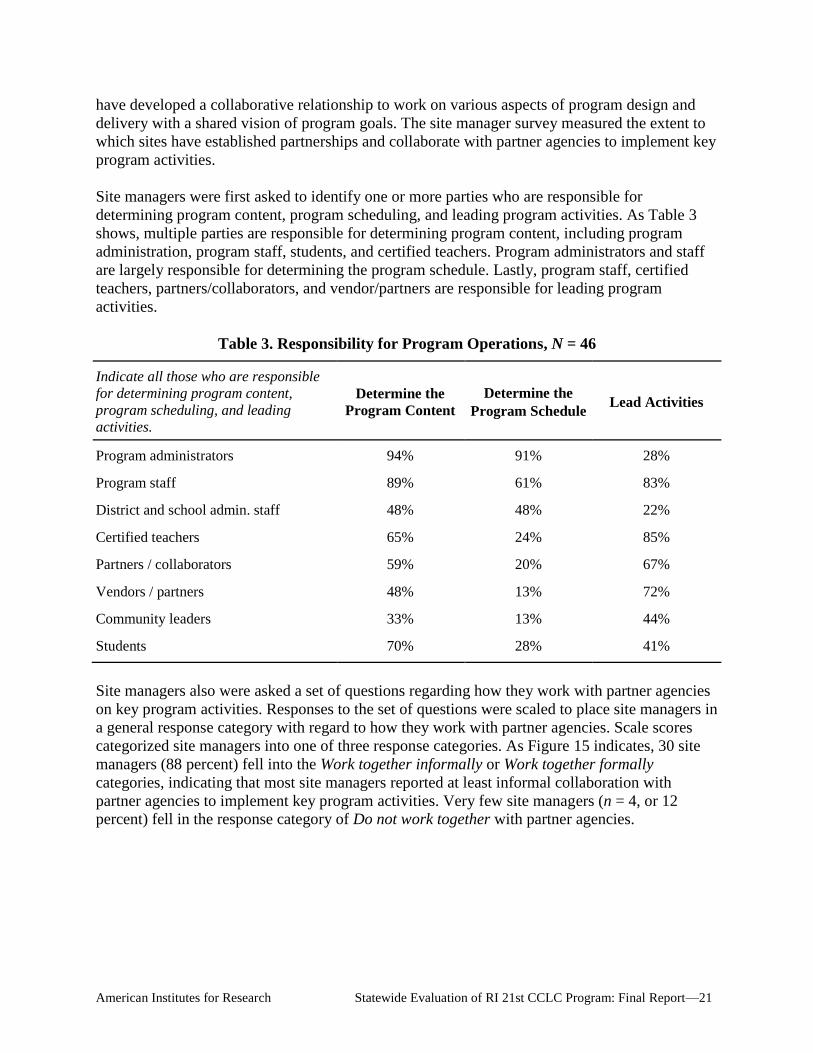
Site managers were first asked to identify one or more parties who are responsible for
determining program content, program scheduling, and leading program activities. As Table 3
shows, multiple parties are responsible for determining program content, including program
administration, program staff, students, and certified teachers. Program administrators and staff
are largely responsible for determining the program schedule. Lastly, program staff, certified
teachers, partners/collaborators, and vendor/partners are responsible for leading program
activities.
Table 3. Responsibility for Program Operations, N = 46
Indicate all those who are responsible
for determining program content,
program scheduling, and leading
activities.
Determine the
Program Content Determine the
Program Schedule Lead Activities
Program administrators 94% 91% 28%
Program staff 89% 61% 83%
District and school admin. staff 48% 48% 22%
Certified teachers 65% 24% 85%
Partners / collaborators 59% 20% 67%
Vendors / partners 48% 13% 72%
Community leaders 33% 13% 44%
Students 70% 28% 41%
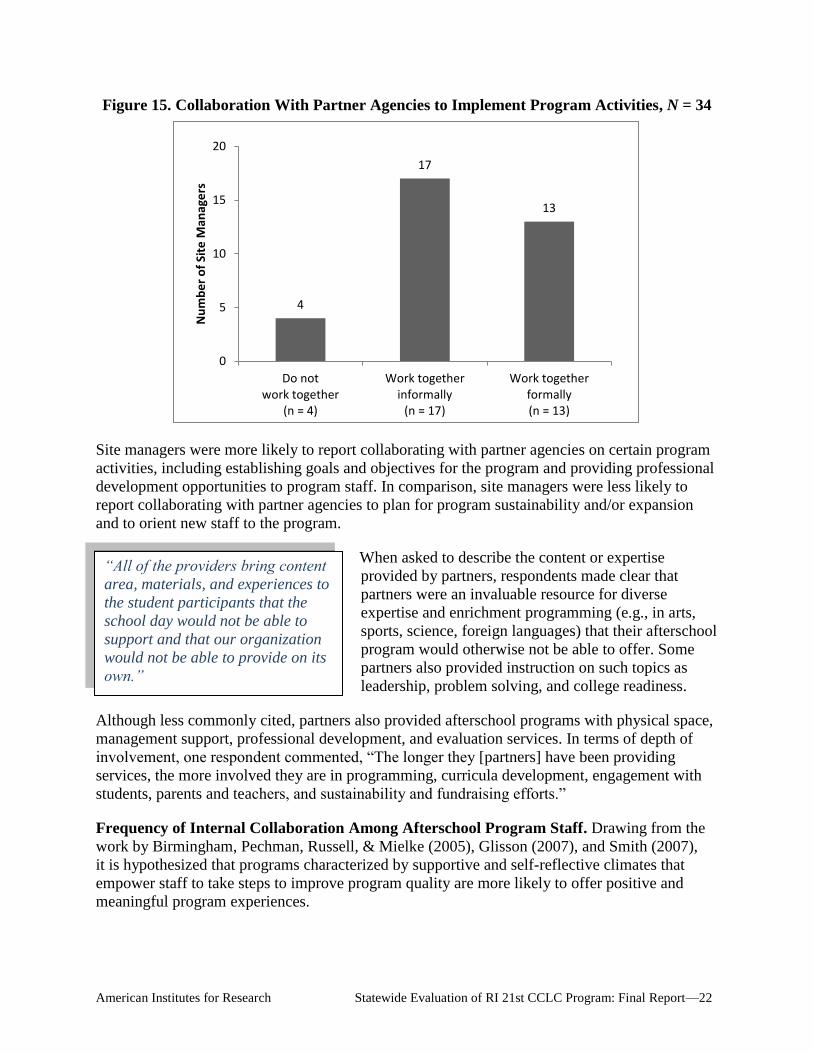
Site managers also were asked a set of questions regarding how they work with partner agencies
on key program activities. Responses to the set of questions were scaled to place site managers in
a general response category with regard to how they work with partner agencies. Scale scores
categorized site managers into one of three response categories. As Figure 15 indicates, 30 site
managers (88 percent) fell into the Work together informally or Work together formally
categories, indicating that most site managers reported at least informal collaboration with
partner agencies to implement key program activities. Very few site managers (n = 4, or 12
percent) fell in the response category of Do not work together with partner agencies.
American Institutes for Research Statewide Evaluation of RI 21st CCLC Program: Final Report—22
“All of the providers bring content
area, materials, and experiences to
the student participants that the
school day would not be able to
support and that our organization
would not be able to provide on its
own.”
Figure 15. Collaboration With Partner Agencies to Implement Program Activities, N = 34
Site managers were more likely to report collaborating with partner agencies on certain program
activities, including establishing goals and objectives for the program and providing professional
development opportunities to program staff. In comparison, site managers were less likely to
report collaborating with partner agencies to plan for program sustainability and/or expansion
and to orient new staff to the program.
When asked to describe the content or expertise
provided by partners, respondents made clear that
partners were an invaluable resource for diverse
expertise and enrichment programming (e.g., in arts,
sports, science, foreign languages) that their afterschool
program would otherwise not be able to offer. Some
partners also provided instruction on such topics as
leadership, problem solving, and college readiness.
Although less commonly cited, partners also provided afterschool programs with physical space,
management support, professional development, and evaluation services. In terms of depth of
involvement, one respondent commented, “The longer they [partners] have been providing
services, the more involved they are in programming, curricula development, engagement with
students, parents and teachers, and sustainability and fundraising efforts.”
Frequency of Internal Collaboration Among Afterschool Program Staff. Drawing from the
work by Birmingham, Pechman, Russell, & Mielke (2005), Glisson (2007), and Smith (2007),
it is hypothesized that programs characterized by supportive and self-reflective climates that
empower staff to take steps to improve program quality are more likely to offer positive and
meaningful program experiences.
4
17
13
0
5
10
15
20
Do notwork together
(n = 4)
Work togetherinformally
(n = 17)
Work togetherformally(n = 13)
Nu
mb
er
of
Site
Man
age
rs
American Institutes for Research Statewide Evaluation of RI 21st CCLC Program: Final Report—23
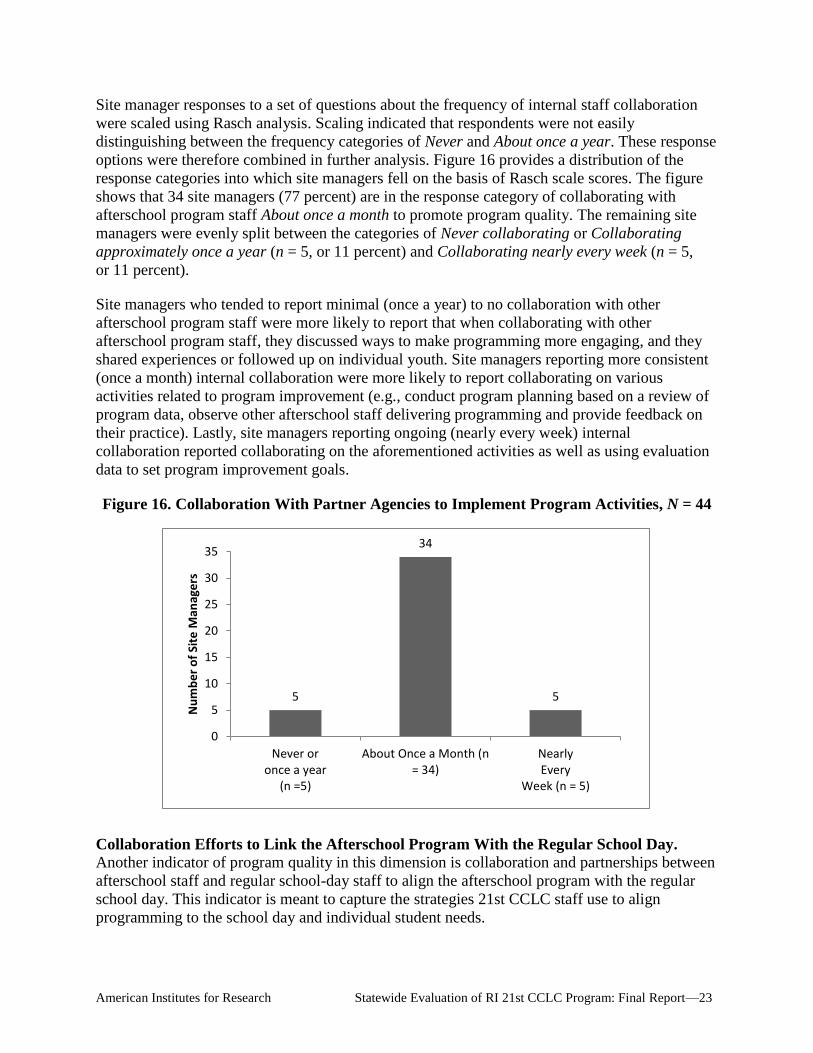
Site manager responses to a set of questions about the frequency of internal staff collaboration
were scaled using Rasch analysis. Scaling indicated that respondents were not easily
distinguishing between the frequency categories of Never and About once a year. These response
options were therefore combined in further analysis. Figure 16 provides a distribution of the
response categories into which site managers fell on the basis of Rasch scale scores. The figure
shows that 34 site managers (77 percent) are in the response category of collaborating with
afterschool program staff About once a month to promote program quality. The remaining site
managers were evenly split between the categories of Never collaborating or Collaborating
approximately once a year (n = 5, or 11 percent) and Collaborating nearly every week (n = 5,
or 11 percent).
Site managers who tended to report minimal (once a year) to no collaboration with other
afterschool program staff were more likely to report that when collaborating with other
afterschool program staff, they discussed ways to make programming more engaging, and they
shared experiences or followed up on individual youth. Site managers reporting more consistent
(once a month) internal collaboration were more likely to report collaborating on various
activities related to program improvement (e.g., conduct program planning based on a review of
program data, observe other afterschool staff delivering programming and provide feedback on
their practice). Lastly, site managers reporting ongoing (nearly every week) internal
collaboration reported collaborating on the aforementioned activities as well as using evaluation
data to set program improvement goals.
Figure 16. Collaboration With Partner Agencies to Implement Program Activities, N = 44
Collaboration Efforts to Link the Afterschool Program With the Regular School Day.
Another indicator of program quality in this dimension is collaboration and partnerships between
afterschool staff and regular school-day staff to align the afterschool program with the regular
school day. This indicator is meant to capture the strategies 21st CCLC staff use to align
programming to the school day and individual student needs.
5
34
5
0
5
10
15
20
25
30
35
Never oronce a year
(n =5)
About Once a Month (n= 34)
NearlyEvery
Week (n = 5)
Nu
mb
er
of
Site
Man
age
rs
American Institutes for Research Statewide Evaluation of RI 21st CCLC Program: Final Report—24
Rasch analysis of questions assessing strategies for aligning afterschool programming with the
regular school day indicated that strategies fall into two strategy types: (1) communication
strategies and (2) direct collaboration between afterschool program staff and regular school-day
staff to design and deliver program content. Examples of activities within these strategy types
include the following:
Communication Strategies: Regular face-to-face meetings with school-day teachers,
principals, or other school-day administrative staff and/or regular electronic
communications with school-day teachers, principals, or other school-day administrative
staff
Program Offerings and Direct Collaboration: Aligning programming to school-day
curriculum and standards, helping with homework, using student assessments and/or
grades to inform programming, monitoring student academic performance, hiring regular
school-day teachers, joint professional development and co-teaching of programs
between school-day teachers and afterschool program staff.
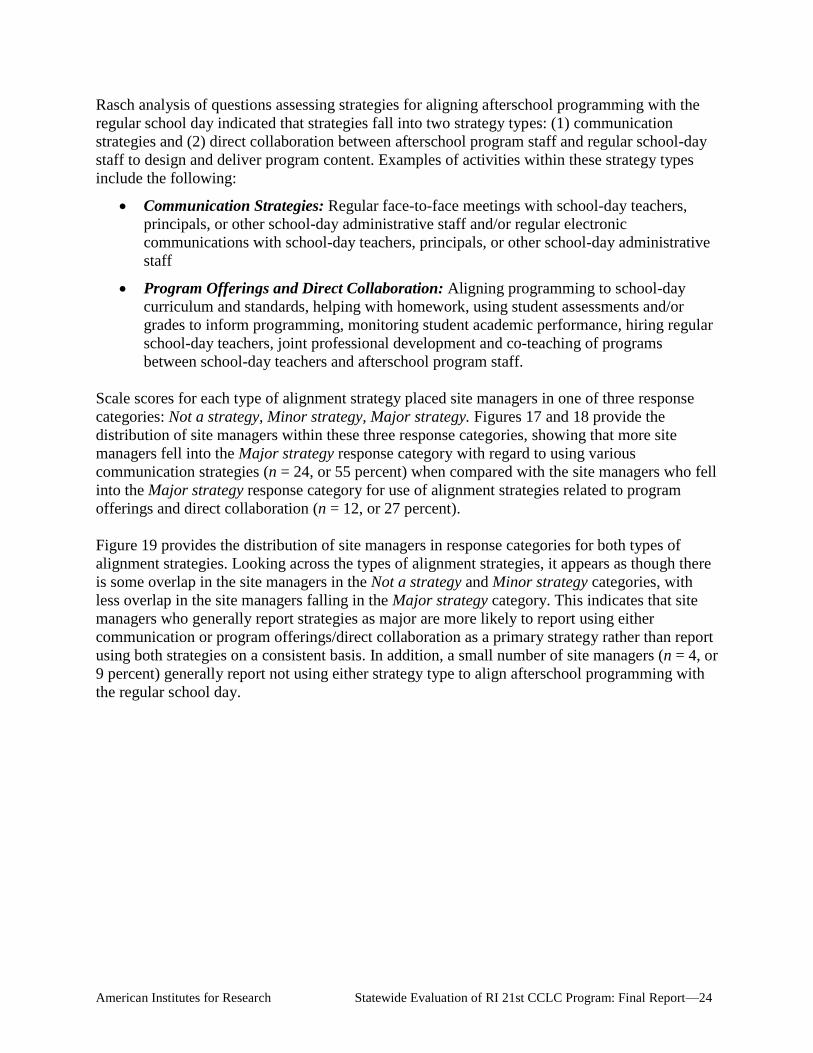
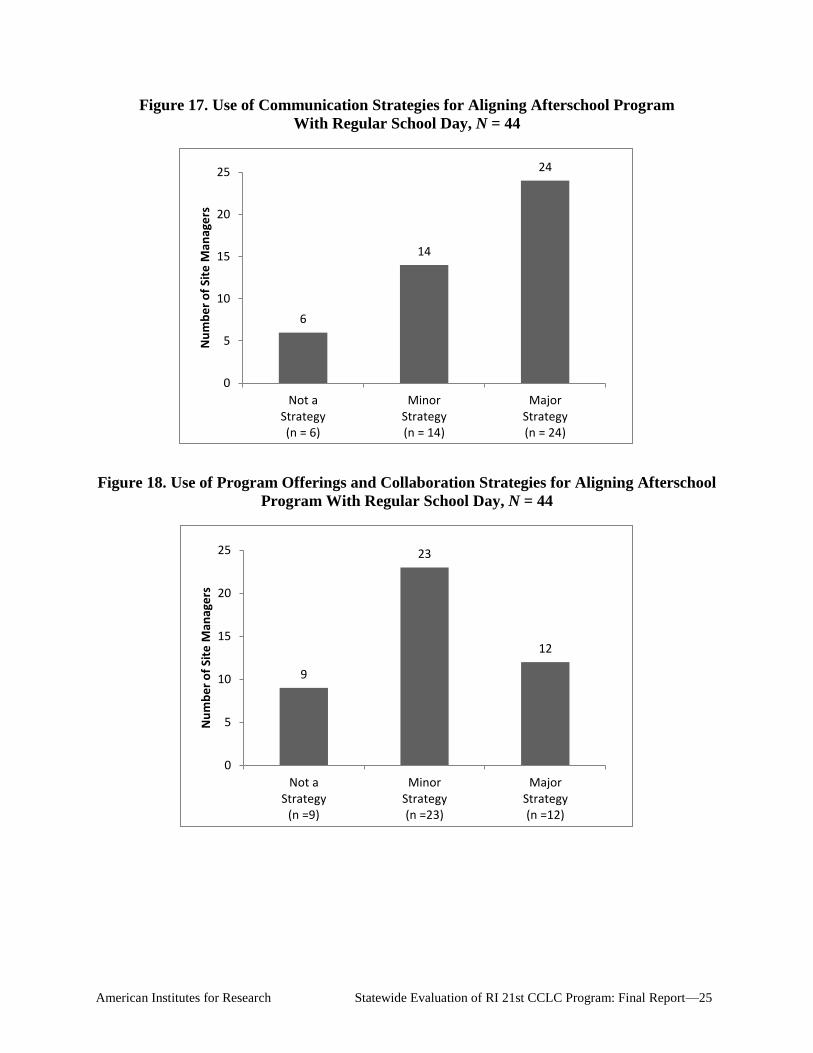
Scale scores for each type of alignment strategy placed site managers in one of three response
categories: Not a strategy, Minor strategy, Major strategy. Figures 17 and 18 provide the
distribution of site managers within these three response categories, showing that more site
managers fell into the Major strategy response category with regard to using various
communication strategies (n = 24, or 55 percent) when compared with the site managers who fell
into the Major strategy response category for use of alignment strategies related to program
offerings and direct collaboration (n = 12, or 27 percent).
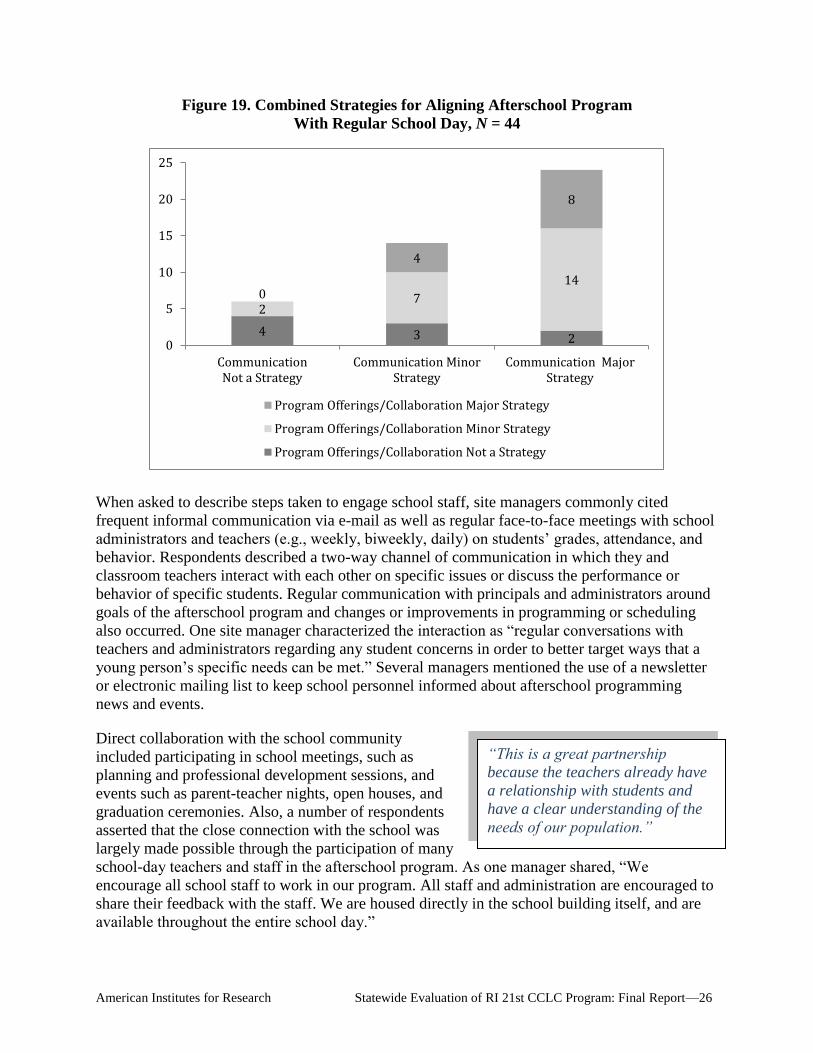
Figure 19 provides the distribution of site managers in response categories for both types of
alignment strategies. Looking across the types of alignment strategies, it appears as though there
is some overlap in the site managers in the Not a strategy and Minor strategy categories, with
less overlap in the site managers falling in the Major strategy category. This indicates that site
managers who generally report strategies as major are more likely to report using either
communication or program offerings/direct collaboration as a primary strategy rather than report
using both strategies on a consistent basis. In addition, a small number of site managers (n = 4, or
9 percent) generally report not using either strategy type to align afterschool programming with
the regular school day.
American Institutes for Research Statewide Evaluation of RI 21st CCLC Program: Final Report—25
Figure 17. Use of Communication Strategies for Aligning Afterschool Program
With Regular School Day, N = 44
Figure 18. Use of Program Offerings and Collaboration Strategies for Aligning Afterschool
Program With Regular School Day, N = 44
6
14
24
0
5
10
15
20
25
Not aStrategy(n = 6)
MinorStrategy(n = 14)
MajorStrategy(n = 24)
Nu
mb
er
of
Site
Man
age
rs
9
23
12
0
5
10
15
20
25
Not aStrategy
(n =9)
MinorStrategy(n =23)
MajorStrategy(n =12)
Nu
mb
er
of
Site
Man
age
rs
American Institutes for Research Statewide Evaluation of RI 21st CCLC Program: Final Report—26
“This is a great partnership
because the teachers already have
a relationship with students and
have a clear understanding of the
needs of our population.”
Figure 19. Combined Strategies for Aligning Afterschool Program
With Regular School Day, N = 44
When asked to describe steps taken to engage school staff, site managers commonly cited
frequent informal communication via e-mail as well as regular face-to-face meetings with school
administrators and teachers (e.g., weekly, biweekly, daily) on students’ grades, attendance, and
behavior. Respondents described a two-way channel of communication in which they and
classroom teachers interact with each other on specific issues or discuss the performance or
behavior of specific students. Regular communication with principals and administrators around
goals of the afterschool program and changes or improvements in programming or scheduling
also occurred. One site manager characterized the interaction as “regular conversations with
teachers and administrators regarding any student concerns in order to better target ways that a
young person’s specific needs can be met.” Several managers mentioned the use of a newsletter
or electronic mailing list to keep school personnel informed about afterschool programming
news and events.
Direct collaboration with the school community
included participating in school meetings, such as
planning and professional development sessions, and
events such as parent-teacher nights, open houses, and
graduation ceremonies. Also, a number of respondents
asserted that the close connection with the school was
largely made possible through the participation of many
school-day teachers and staff in the afterschool program. As one manager shared, “We
encourage all school staff to work in our program. All staff and administration are encouraged to
share their feedback with the staff. We are housed directly in the school building itself, and are
available throughout the entire school day.”
4 3 2
2 7
14 0
4
8
0
5
10
15
20
25
CommunicationNot a Strategy
Communication MinorStrategy
Communication MajorStrategy
Program Offerings/Collaboration Major Strategy
Program Offerings/Collaboration Minor Strategy
Program Offerings/Collaboration Not a Strategy
American Institutes for Research Statewide Evaluation of RI 21st CCLC Program: Final Report—27
“Our goal in hiring full-time staff
for teaching positions is creating
long-term relationships with very
disconnected youth. Our program
would not be successful if
instructors were around for only a
few hours a week.”
Dimension 2: Staffing
Indicators of program quality within this dimension include: (1) providing program staff with
high-quality training and/or professional development and (2) minimal program challenges in
relation to staffing the afterschool program.
Site managers described a diverse mix of full-time staff, part-time staff, and volunteers (e.g.,
VISTA, AmeriCorps, and City Year) who provide afterschool programming at 21st CCLC sites
in Rhode Island. They are teachers, teaching assistants, teaching students, retired teachers, as
well as parents, high school and college students, community leaders, “working artists who have
expertise in a particular creative discipline,” and some former afterschool participants. Many
have an arts background or certification in a particular academic subject; some have an extensive
teaching, coaching, or youth-development background; others demonstrate “core competence in
youth work.”
One site manager articulated the following hiring
philosophy, which was shared by several other
respondents: “Our goal in staffing is to offer students
exposure to many different kinds of people, from
different walks of life, who have something of value to
share with and teach young people.” Respondents
described a rigorous hiring process that may involve a
request for proposal, background checks, and
interviews, sometimes led by current afterschool
students. A few managers noted that creating stable connections for participating students is an
important consideration when making hiring decisions.
Providing Program Staff With High-Quality Training and/or Professional Development.
This indicator is meant to capture the degree to which staff members are trained to deliver high-
quality programming and the quality of professional development events attended by program
staff. Table 4 summarizes the types of professional development events attended by afterschool
program staff during the 2011–12 program year. The most common professional development
events included state meetings/trainings and regional and local/meetings. It is interesting to note
that only a little more than one half of site managers reported staff attending new-staff
orientation or all-staff training prior to the start of the program year. It is not clear if this is due to
a lack of new hires during the program year or the lack of policies and procedures for training
new staff. Site managers also were asked to report on the quality and adequacy of the attended
professional development events. Thirteen (28 percent) of the site managers classified the
quality of professional development events as Excellent, 26 (56 percent) classified them as Good,
and three (7 percent) classified them as Fair or Poor. With regard to the adequacy of the
professional development events, most site managers indicated that they were either Adequate
(n = 28, or 61 percent) or Insufficient (n = 13, or 28 percent).

American Institutes for Research Statewide Evaluation of RI 21st CCLC Program: Final Report—28
Table 4. Types of Professional Development Events Attended by
Afterschool Program Staff, N = 46
Type of Professional Development Event Sites Attended
State meetings/trainings 70%
Regional and local meetings/trainings 70%
Trainings held for all staff before the start of the program cycle 59%
Training provided by partners/collaborators 54%
New-staff orientation 54%
School district professional development 52%
On-site trainings held during the fall programming period 50%
National trainings/conferences 26%
When asked to identify the topics on which they would like to receive professional development,
site mangers listed the following areas: staff management (including evaluation and motivation),
educational leadership, positive discipline, special education instruction, middle and high school
youth development, project-based learning, program sustainability (including fundraising, grant
writing, and community partnerships), family engagement, data use, and curriculum
development. Future professional development topics site managers suggested for their staff
included: developing lessons that align with academic standards, professional goal setting,
behavior/classroom management, student learning objectives, project-based learning, middle and
high school youth engagement, parent engagement, and using technology such as social media to
engage students.
Minimal Program Challenges in Relation to Staffing Afterschool Program. In the course of
delivering programs, staff management and administration are likely to experience a variety of
staffing challenges. However, minimizing and overcoming staffing challenges is not only
indicative of an effective organizational infrastructure but also contributes to the quality and
continuity of program experiences for participating youth. This indicator assesses the extent of
staffing challenges experienced by programs. Site managers were asked to rate the extent to
which various staffing issues were a challenge; responses were combined to create a scale score
that represents the general presence of staffing challenges according to site manager responses.
According to their scale scores, site managers fell into one of three response categories: Major
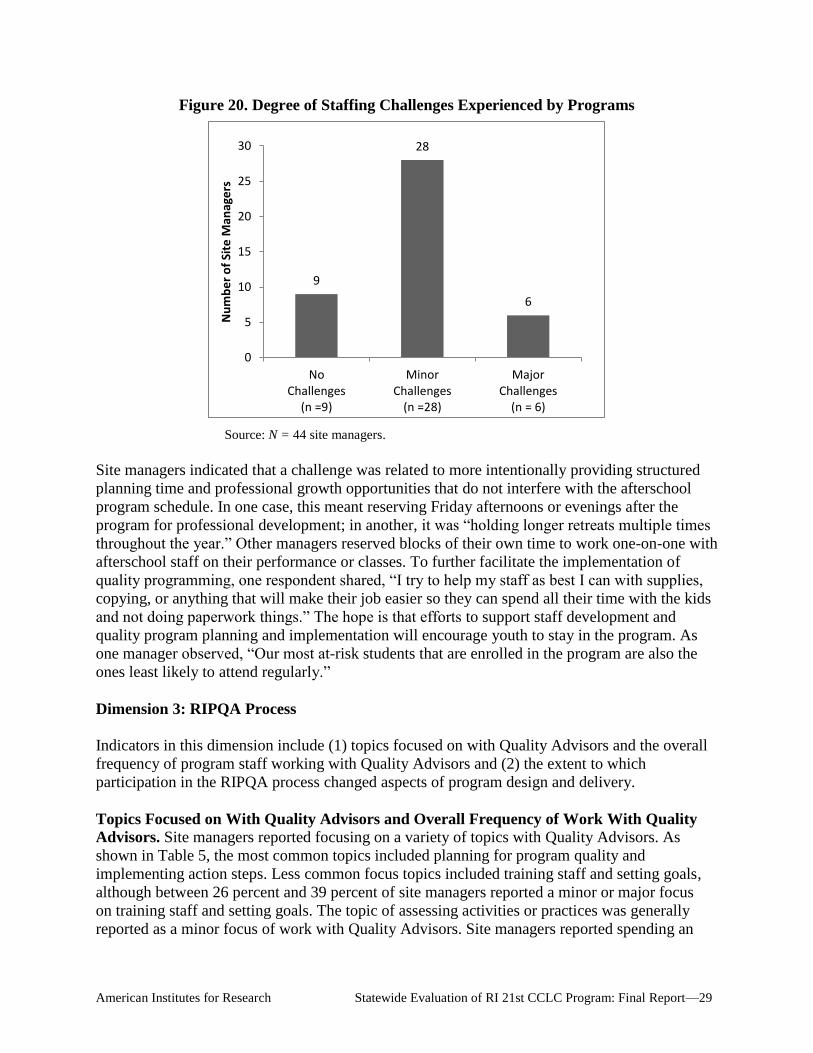
challenge, Minor challenge, and Not a challenge. Figure 20 summarizes the distribution of site
managers across these three response categories. Most site managers (n = 28, or 65 percent) fell
in the Minor challenge category, indicating overall minor staffing challenges. Only six (14
percent) of the site managers fell in the Major challenge category, indicating more extensive
staffing challenges overall. With the overall degree of staffing challenges taken into
consideration, the most commonly reported major staffing challenges included staff turnover,
lack of planning time for staff, and lack of time to hold staff meetings.
American Institutes for Research Statewide Evaluation of RI 21st CCLC Program: Final Report—29
Figure 20. Degree of Staffing Challenges Experienced by Programs
Source: N = 44 site managers.
Site managers indicated that a challenge was related to more intentionally providing structured
planning time and professional growth opportunities that do not interfere with the afterschool
program schedule. In one case, this meant reserving Friday afternoons or evenings after the
program for professional development; in another, it was “holding longer retreats multiple times
throughout the year.” Other managers reserved blocks of their own time to work one-on-one with
afterschool staff on their performance or classes. To further facilitate the implementation of
quality programming, one respondent shared, “I try to help my staff as best I can with supplies,
copying, or anything that will make their job easier so they can spend all their time with the kids
and not doing paperwork things.” The hope is that efforts to support staff development and
quality program planning and implementation will encourage youth to stay in the program. As
one manager observed, “Our most at-risk students that are enrolled in the program are also the
ones least likely to attend regularly.”
Dimension 3: RIPQA Process
Indicators in this dimension include (1) topics focused on with Quality Advisors and the overall
frequency of program staff working with Quality Advisors and (2) the extent to which
participation in the RIPQA process changed aspects of program design and delivery.
Topics Focused on With Quality Advisors and Overall Frequency of Work With Quality
Advisors. Site managers reported focusing on a variety of topics with Quality Advisors. As
shown in Table 5, the most common topics included planning for program quality and
implementing action steps. Less common focus topics included training staff and setting goals,
although between 26 percent and 39 percent of site managers reported a minor or major focus
on training staff and setting goals. The topic of assessing activities or practices was generally
reported as a minor focus of work with Quality Advisors. Site managers reported spending an
9
28
6
0
5
10
15
20
25
30
NoChallenges
(n =9)
MinorChallenges
(n =28)
MajorChallenges
(n = 6)
Nu
mb
er
of
Site
Man
age
rs
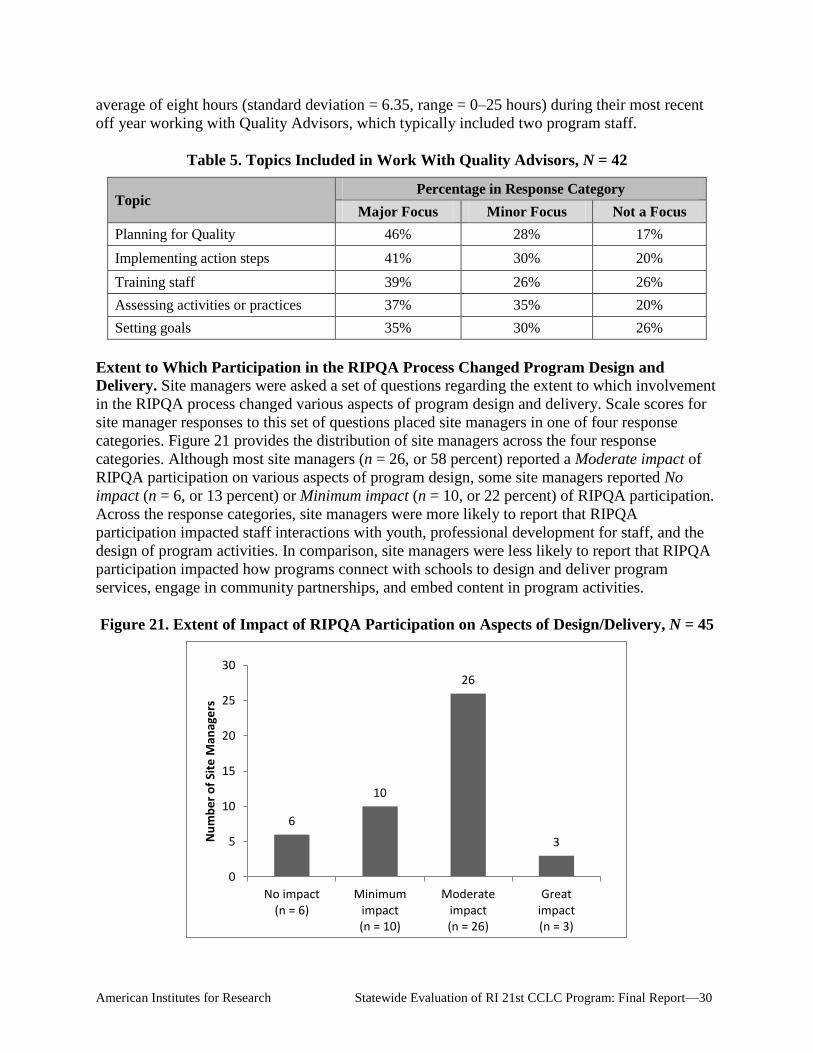
American Institutes for Research Statewide Evaluation of RI 21st CCLC Program: Final Report—30
average of eight hours (standard deviation = 6.35, range = 0–25 hours) during their most recent
off year working with Quality Advisors, which typically included two program staff.
Table 5. Topics Included in Work With Quality Advisors, N = 42
Topic Percentage in Response Category
Major Focus Minor Focus Not a Focus
Planning for Quality 46% 28% 17%
Implementing action steps 41% 30% 20%
Training staff 39% 26% 26%
Assessing activities or practices 37% 35% 20%
Setting goals 35% 30% 26%
Extent to Which Participation in the RIPQA Process Changed Program Design and
Delivery. Site managers were asked a set of questions regarding the extent to which involvement
in the RIPQA process changed various aspects of program design and delivery. Scale scores for
site manager responses to this set of questions placed site managers in one of four response
categories. Figure 21 provides the distribution of site managers across the four response
categories. Although most site managers (n = 26, or 58 percent) reported a Moderate impact of
RIPQA participation on various aspects of program design, some site managers reported No
impact (n = 6, or 13 percent) or Minimum impact (n = 10, or 22 percent) of RIPQA participation.
Across the response categories, site managers were more likely to report that RIPQA
participation impacted staff interactions with youth, professional development for staff, and the
design of program activities. In comparison, site managers were less likely to report that RIPQA
participation impacted how programs connect with schools to design and deliver program
services, engage in community partnerships, and embed content in program activities.
Figure 21. Extent of Impact of RIPQA Participation on Aspects of Design/Delivery, N = 45
6
10
26
3
0
5
10
15
20
25
30
No impact(n = 6)
Minimumimpact(n = 10)
Moderateimpact(n = 26)
Greatimpact(n = 3)
Nu
mb
er
of
Site
Man
age
rs

American Institutes for Research Statewide Evaluation of RI 21st CCLC Program: Final Report—31
Dimension 4: Intentional Program Services and Activities
Indicators within this dimension include: (1) intentional program development, (2) opportunities
for youth engagement and ownership of programming, and (3) intentional design and delivery of
content to support student development in core content areas.
Intentional Program Development. A key indicator of program quality is the degree to which
programming is intentionally developed on the basis of a needs assessment and a structured
planning process. Site managers were asked about the process of developing programming and
program objectives (see Table 6). More than one half (n = 29, or 63 percent) used a formal needs
assessment, fewer completed a structured planning process, and less than one fourth assessed
participants’ social-emotional competencies.
Table 6. Site Manager Responses Regarding Program Development, N = 46
Site managers also were asked to list the top three program objectives from a predefined list. As
Table 7 indicates, the most common high-priority program objective was raising levels of
academic performance for any students interested in participating in afterschool programming,
indicating that programs are not typically targeting the lowest performing students. Additional
priorities identified by site managers included providing students access to academic enrichment
opportunities, providing opportunities for students to participate in activities not offered during the
school day, and enhancing the social or civic development of students.
Question Informed Program
Development
Used formal needs assessment for program development 63%
For those completing formal needs assessment, types of data included:
Needs assessment 48%
Asset mapping 28%
School improvement plans 22%
Environmental scan 15%
Participatory analysis 15%
Completed structured planning process 44%
For those completing structured planning process, planning process involved:
Development of an action plan 30%
Development of a logic model 13%
Participatory action planning with program participants, staff, and
stakeholders 13%
Identification of smart goals 7%
Assessed participants’ social-emotional competencies 22%

American Institutes for Research Statewide Evaluation of RI 21st CCLC Program: Final Report—32
“Activities offered are hands-on
experiential learning that is
project-based, where students are
empowered to discover their love
of learning and its application to
academics and real life.”
Table 7. High-Priority Program Objectives, N = 46
Please indicate which of these program objectives
constitute the top three priorities for your program. Highest Priority
Top 3 Priority
Raise the academic performance levels of any students
who have an interest in participating. 37% 19%
Enable low-performing students to achieve grade-level
proficiency. 17% 11%
Provide students with access to academic enrichment
opportunities. 11% 41%
Provide opportunities for students to participate in
activities not offered during the school day. 11% 41%
Enhance the social or civic development of students. 7% 20%
Enhance the artistic development of students (e.g.,
visual and performing arts, etc.). 4% 4%
Provide supervised space for students to complete
homework. 2% 4%
Prepare students for college and work. 0% 13%
Provide students with the opportunity to participate in
sports and recreation activities. 0% 7%
Engage families 0% 15%
Site managers were then queried about how the activities provided support their main objectives.
To support the academic growth and enrichment of students, respondents described a process of
working closely with classroom teachers to determine student needs, providing one-on-one
support to students in greatest need, and creating clubs and programming with an academic focus
(e.g., writing, debate, science, and math). Also, classroom teachers were often hired as
afterschool instructors, which further contributed to the academic focus of activities.
Several managers emphasized the importance of
making learning fun or different by incorporating
hands-on activities and project-based concepts. One
respondent voiced the overall sentiment of many
respondents by noting, “Afterschool time is the
students’ time and it is to be fun, challenging and safe
for all those that want to participate. We try to offer an
array of programming that would be of interest to all
types of students with different learning styles.”
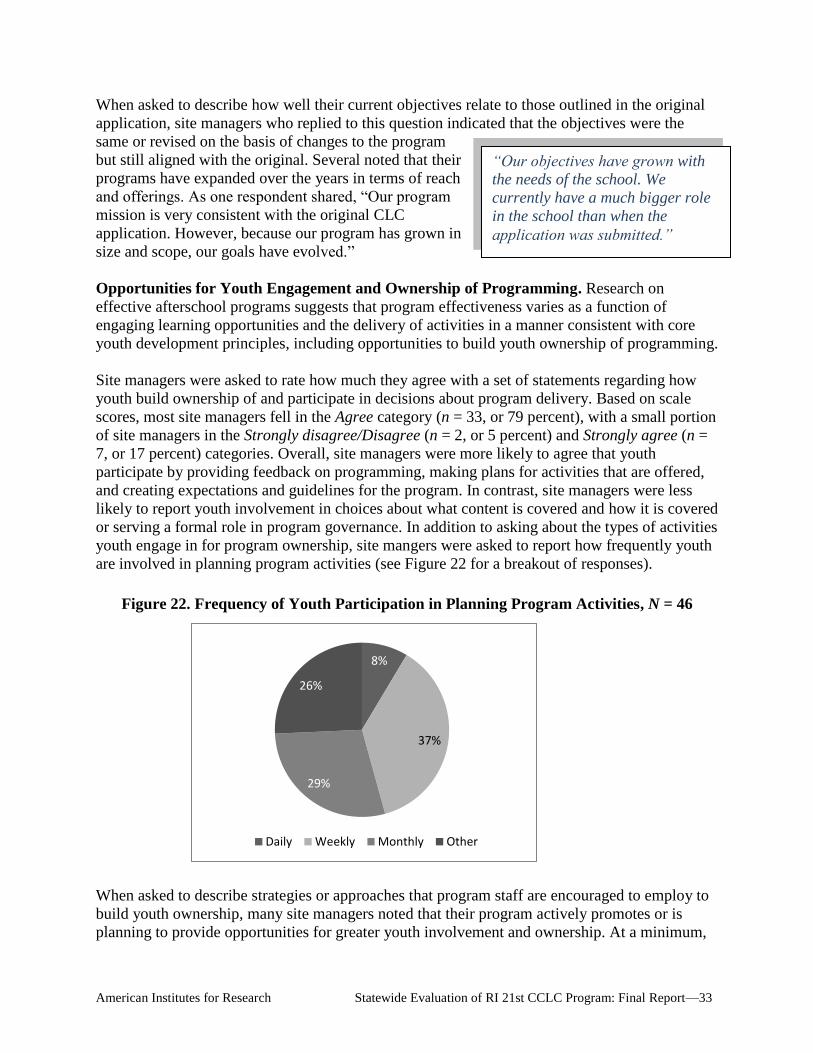
American Institutes for Research Statewide Evaluation of RI 21st CCLC Program: Final Report—33
“Our objectives have grown with
the needs of the school. We
currently have a much bigger role
in the school than when the
application was submitted.”
When asked to describe how well their current objectives relate to those outlined in the original
application, site managers who replied to this question indicated that the objectives were the
same or revised on the basis of changes to the program
but still aligned with the original. Several noted that their
programs have expanded over the years in terms of reach
and offerings. As one respondent shared, “Our program
mission is very consistent with the original CLC
application. However, because our program has grown in
size and scope, our goals have evolved.”
Opportunities for Youth Engagement and Ownership of Programming. Research on
effective afterschool programs suggests that program effectiveness varies as a function of
engaging learning opportunities and the delivery of activities in a manner consistent with core
youth development principles, including opportunities to build youth ownership of programming.
Site managers were asked to rate how much they agree with a set of statements regarding how
youth build ownership of and participate in decisions about program delivery. Based on scale
scores, most site managers fell in the Agree category (n = 33, or 79 percent), with a small portion
of site managers in the Strongly disagree/Disagree (n = 2, or 5 percent) and Strongly agree (n =
7, or 17 percent) categories. Overall, site managers were more likely to agree that youth
participate by providing feedback on programming, making plans for activities that are offered,
and creating expectations and guidelines for the program. In contrast, site managers were less
likely to report youth involvement in choices about what content is covered and how it is covered
or serving a formal role in program governance. In addition to asking about the types of activities
youth engage in for program ownership, site mangers were asked to report how frequently youth
are involved in planning program activities (see Figure 22 for a breakout of responses).
Figure 22. Frequency of Youth Participation in Planning Program Activities, N = 46
When asked to describe strategies or approaches that program staff are encouraged to employ to
build youth ownership, many site managers noted that their program actively promotes or is
planning to provide opportunities for greater youth involvement and ownership. At a minimum,
8%
37%
29%
26%
Daily Weekly Monthly Other
American Institutes for Research Statewide Evaluation of RI 21st CCLC Program: Final Report—34
“Many afterschool staff members
encourage students to determine
what their course will consist of.
They have discussions about what
the majority of the students would
like to ‘get’ from the class and ‘do’
in the class.”
most programs invited youth to provide input and
feedback on their own selection of activities and classes
via surveys and discussions. Others also involved
students in making decisions about how the program as
a whole runs and the range of classes that are offered.
As one manager noted, “Before each session, students
are asked to rate their experience with staff, community
providers. Students are asked what enrichment classes
should stay and what classes they don’t want to
participate in.” Some also noted that staff members were encouraged to listen to students, be
more cognizant about individual preferences and needs, and more intentionally invite youth
feedback.
A smaller number of programs also actively sought to develop leadership among students. This
was done formally through the formation of youth councils or youth membership on advisory
boards typically made up of program staff, community members, and students. Whether
students-only or mixed membership, these groups often were responsible for collecting youth
feedback, organizing events and celebrations, and participating in various decisions about
programming and operations, including hiring staff and setting behavior policies. As described
by one respondent, “There is a strong Youth Council who is very involved in the day-to-day
operations of the program.” Another shared, “We have a Youth Leadership Board of 15 members
who meet regularly throughout the year to organize and plan events and community-building
opportunities in our program.” One manager described using an inclusive “membership model”
in which all students and staff have regular community meetings. This practice sent the message
that students “are important members of our community, not just people who come once a week
for class.” In other programs, opportunities were less formal but still intentionally focused on
building youth leadership. For example, in some programs, students were encouraged to attend
staff and board meetings, participate in various committees, develop their own “clubs,” and act
as “peer buddies” with new or younger students.
Intentional Design and Delivery of Content to Support Student Development in Core
Content Areas. There is a growing body of research suggesting that desired student achievement
outcomes can be realized through afterschool programs by paying attention to how programming
is delivered through the creation of developmentally appropriate settings that are consistent with
core youth development principles (Birmingham et al., 2005; Durlak & Weissberg, 2007).
Site managers were asked to estimate the number of students targeted for program recruitment
for various reasons. As shown in Table 8, there was variation in the proportion of enrolled
students recruited for program participation on the basis of the listed selection criteria. The most
common selection criteria (with Some to Most enrolled) included (1) referral from a school-day
staff member indicating the need for additional assistance in reading or math and (2) below-
proficient scores on local or state assessments.

American Institutes for Research Statewide Evaluation of RI 21st CCLC Program: Final Report—35
Table 8. Proportion of Students Recruited for Program Based on Selection Criteria
Selection Criteria Estimate of Students Enrolled for Selection Criteria
No Students Some Students Most Students All Students
Referral from school-day staff 13% 52% 26% 0%
Below-proficient score on local
or state assessments 13% 52% 24% 2%
Failure to receive passing grade 20% 50% 20% 2%
English language learner 26% 63% 2% 0%
To further understand the extent of intentional planning of program activities, site managers were
asked a set of questions about staff access to and use of various types of data/information about
students for planning activities. Site manager responses across the questions were used to create
a scale score that reflects the overall range of data used and the extent of data use for planning
activities. Figure 23 provides the distribution of site managers within four frequency response
categories for use of various types of data/information about students to plan activities. Site
managers generally reported lack of access to (n = 9, or 21 percent), occasional use (n = 25,
or 60 percent), and frequent use (n = 8, or 19 percent) of various types of student data to plan
program activities. Overall, the most commonly used types of student data/information included
information about school-day attendance, students’ grades, and information about student
behavioral issues. Individualized education plans and student scores on district- or building-level
assessments were less likely to be used for planning program activities.
Figure 23. Use of Various Types of Student Data to Plan Program Activities, N = 42
9
25
8
0
5
10
15
20
25
30
Don't haveaccess to
(n = 9)
Occasional(n = 25)
Frequent(n = 8)
Nu
mb
er
of
Site
Man
age
rs

American Institutes for Research Statewide Evaluation of RI 21st CCLC Program: Final Report—36
“We provide additional supports
including one-on-one tutoring and
family support to help students that
are below grade level and/or
having behavioral problems in
school.”
Site managers were asked to provide additional details
about how student data are used to inform
programming. If available to them, afterschool
programs—sometimes through a trained evaluator—
review student behavior or discipline data as well as
academic records to inform individual student as well
as larger program plans. (Respondents, however, also
stressed the importance of informal but regular
communication with classroom teachers.) For example, instruction and enrollment in remedial
interventions, such as math or literacy tutoring, are often provided to participants based on
student academic or social-emotional needs.
Aggregated student data are also used to inform broader programming decisions, including
partnering with community organizations. This use of student data is summarized by one
respondent who stated, “If most of our students struggle with math as indicated by their data,
then we would offer more than one option for activities that include a math skill strengthening
focus.” Another noted, “We identify weaknesses and needs based on assessments, and we use
this information when selecting program providers.” Several programs also specifically
mentioned consideration of New England Common Assessment Program (NECAP) scores in
developing academic enrichment programming.
Site managers also were asked to describe how often specific subject areas were addressed
during the provision of program activities (see Figure 24). The areas addressed most frequently
(3–5 times per week) were reading/literacy, arts and music, mathematics, and health and
nutrition. Engineering and entrepreneurship were the least frequently addressed subject areas.
Figure 24. Percentage of Site Mangers Indicating Frequency of Addressing Subject Areas,
N = 41
43% 35%
33%
26% 24% 13%
13%
4%
2%
39% 46%
46%
43% 37%
52%
57%
24%
33%
2%
4%
2%
11% 15%
9%
13%
7%
9%
4%
2%
2%
7%
4%
9%
4%
13%
11%
2%
7%
2%
9%
7%
2%
41%
35%
0
10
20
30
40
50
60
70
80
90
100
4-5 times per week 1-3 times per week 1-3 times per month
Less than once a month Not addressed
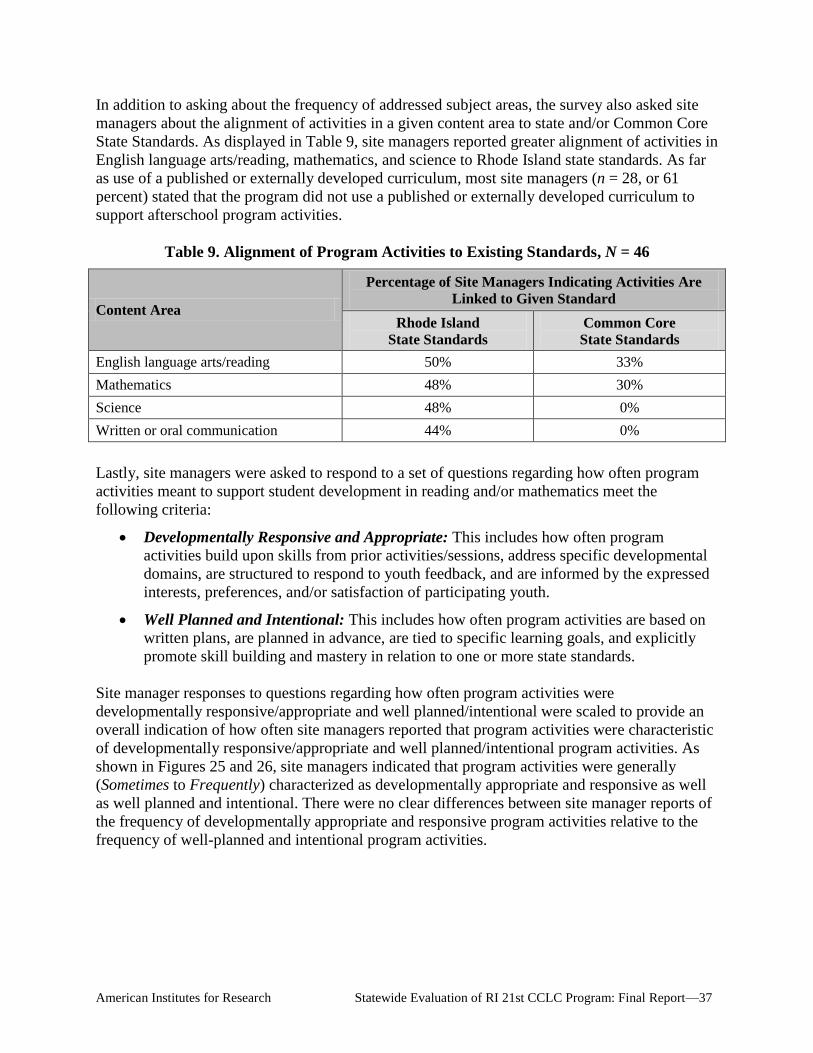
American Institutes for Research Statewide Evaluation of RI 21st CCLC Program: Final Report—37
In addition to asking about the frequency of addressed subject areas, the survey also asked site
managers about the alignment of activities in a given content area to state and/or Common Core
State Standards. As displayed in Table 9, site managers reported greater alignment of activities in
English language arts/reading, mathematics, and science to Rhode Island state standards. As far
as use of a published or externally developed curriculum, most site managers (n = 28, or 61
percent) stated that the program did not use a published or externally developed curriculum to
support afterschool program activities.
Table 9. Alignment of Program Activities to Existing Standards, N = 46
Content Area
Percentage of Site Managers Indicating Activities Are
Linked to Given Standard
Rhode Island
State Standards
Common Core
State Standards
English language arts/reading 50% 33%
Mathematics 48% 30%
Science 48% 0%
Written or oral communication 44% 0%
Lastly, site managers were asked to respond to a set of questions regarding how often program
activities meant to support student development in reading and/or mathematics meet the
following criteria:
Developmentally Responsive and Appropriate: This includes how often program
activities build upon skills from prior activities/sessions, address specific developmental
domains, are structured to respond to youth feedback, and are informed by the expressed
interests, preferences, and/or satisfaction of participating youth.
Well Planned and Intentional: This includes how often program activities are based on
written plans, are planned in advance, are tied to specific learning goals, and explicitly
promote skill building and mastery in relation to one or more state standards.
Site manager responses to questions regarding how often program activities were
developmentally responsive/appropriate and well planned/intentional were scaled to provide an
overall indication of how often site managers reported that program activities were characteristic
of developmentally responsive/appropriate and well planned/intentional program activities. As
shown in Figures 25 and 26, site managers indicated that program activities were generally
(Sometimes to Frequently) characterized as developmentally appropriate and responsive as well
as well planned and intentional. There were no clear differences between site manager reports of
the frequency of developmentally appropriate and responsive program activities relative to the
frequency of well-planned and intentional program activities.
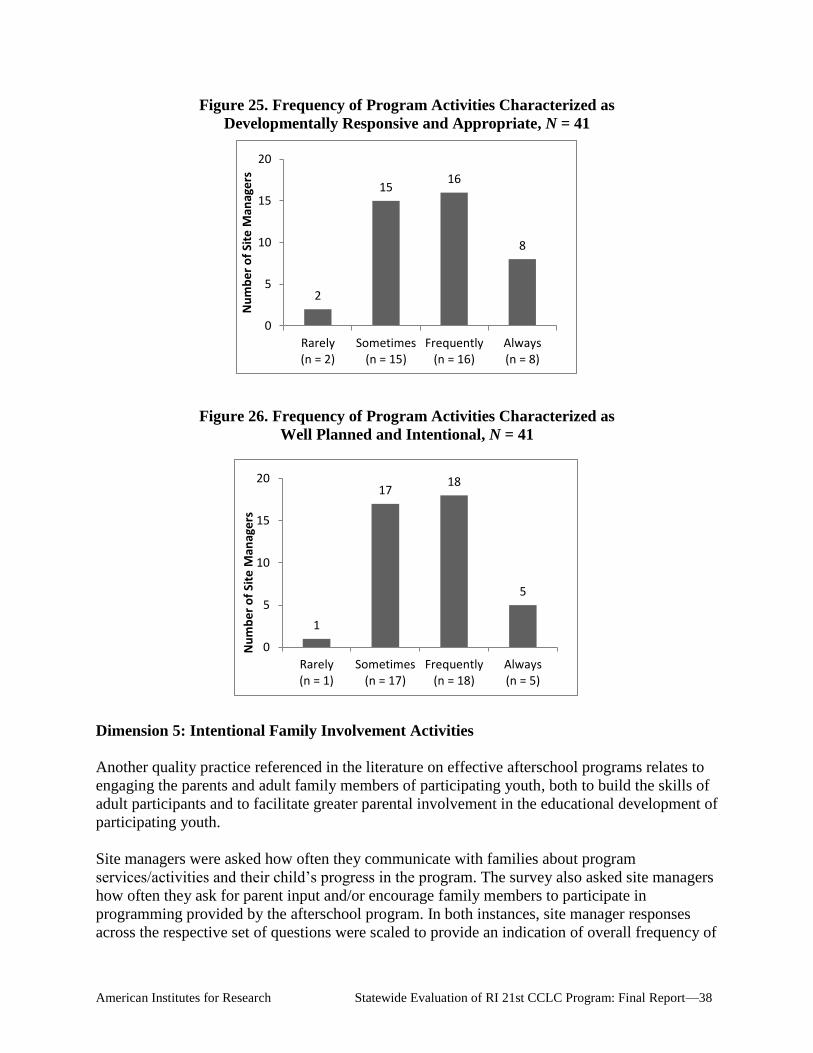
American Institutes for Research Statewide Evaluation of RI 21st CCLC Program: Final Report—38
Figure 25. Frequency of Program Activities Characterized as
Developmentally Responsive and Appropriate, N = 41
Figure 26. Frequency of Program Activities Characterized as
Well Planned and Intentional, N = 41
Dimension 5: Intentional Family Involvement Activities
Another quality practice referenced in the literature on effective afterschool programs relates to
engaging the parents and adult family members of participating youth, both to build the skills of
adult participants and to facilitate greater parental involvement in the educational development of
participating youth.
Site managers were asked how often they communicate with families about program
services/activities and their child’s progress in the program. The survey also asked site managers
how often they ask for parent input and/or encourage family members to participate in
programming provided by the afterschool program. In both instances, site manager responses
across the respective set of questions were scaled to provide an indication of overall frequency of
2
15 16
8
0
5
10
15
20
Rarely(n = 2)
Sometimes(n = 15)
Frequently(n = 16)
Always(n = 8)
Nu
mb
er
of
Site
Man
age
rs
1
17 18
5
0
5
10
15
20
Rarely(n = 1)
Sometimes(n = 17)
Frequently(n = 18)
Always(n = 5)
Nu
mb
er
of
Site
Man
age
rs
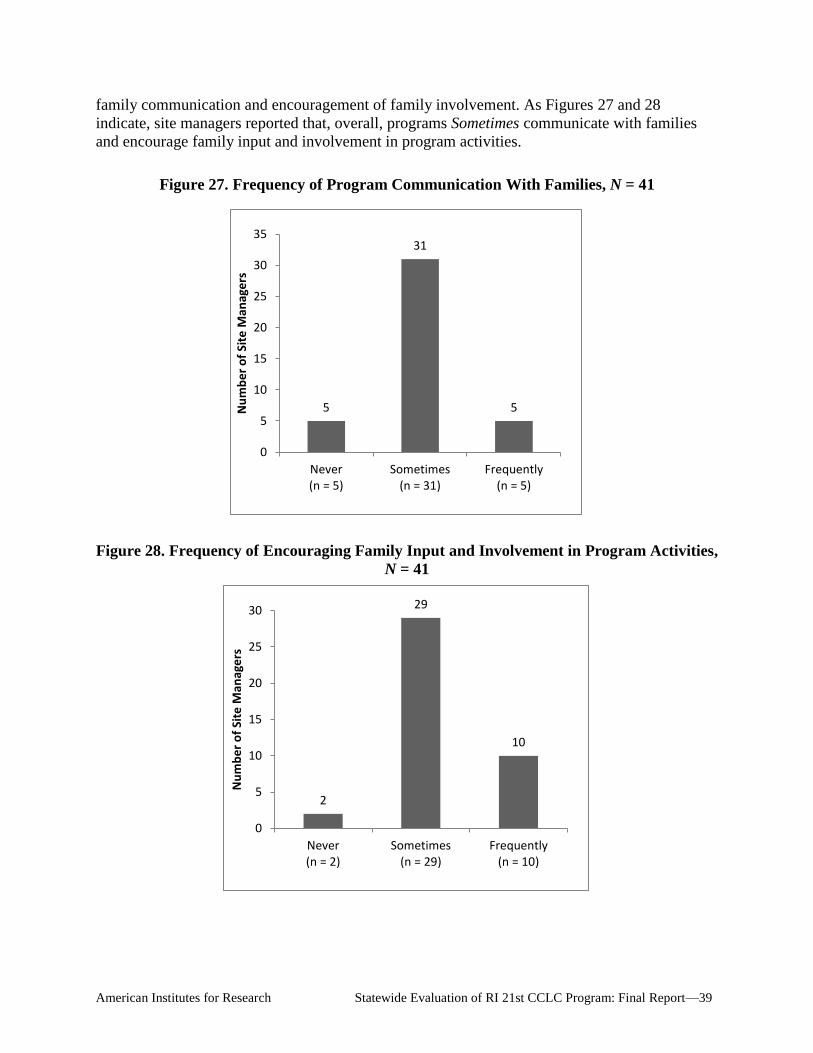
American Institutes for Research Statewide Evaluation of RI 21st CCLC Program: Final Report—39
family communication and encouragement of family involvement. As Figures 27 and 28
indicate, site managers reported that, overall, programs Sometimes communicate with families
and encourage family input and involvement in program activities.
Figure 27. Frequency of Program Communication With Families, N = 41
Figure 28. Frequency of Encouraging Family Input and Involvement in Program Activities,
N = 41
5
31
5
0
5
10
15
20
25
30
35
Never(n = 5)
Sometimes(n = 31)
Frequently(n = 5)
Nu
mb
er
of
Site
Man
age
rs
2
29
10
0
5
10
15
20
25
30
Never(n = 2)
Sometimes(n = 29)
Frequently(n = 10)
Nu
mb
er
of
Site
Man
age
rs

American Institutes for Research Statewide Evaluation of RI 21st CCLC Program: Final Report—40
VI. Impact Analysis
Data Source
To create the comparison datasets necessary for the impact analysis, student records provided to
AIR for upload into PPICS (as part of the APR 2012 reporting process) were matched by RIDE
with State-Assigned Student Identifiers (SASIDs). This matching was done through demographic
variables provided by the sub-grantees themselves. Once each student was matched with his or her
SASID, RIDE linked each student record with data stored in RIDE’s data warehouse, including
demographic information, school-of-attendance data, and outcome data (state assessment scale
scores for two years, unexcused absence data, and disciplinary information). Once linked, these
data were provided to AIR along with similar data for non-21st CCLC students who attended the
same schools as 21st CCLC students. This provided AIR with a large dataset that included student
demographic information, school-of-attendance information, and outcome data for both 21st CCLC
participants and non-participants.
Impact of 21st CCLC Participation on Student Outcomes
The evaluation team employed a quasi-experimental research design to examine the effect of
21st CCLC participation on three different student outcomes: 1) reading and math achievement
scores; 2) the number of unexcused absences; and 3) the number of disciplinary incidents.
Students’ reading and math achievement were measured by New England Common Assessment
Program (NECAP) reading and math tests for grades 3-8, while unexcused absence and
disciplinary rates were provided by RIDE. Note that unexcused absences were selected as an
outcome measure (as opposed to attendance or simple absence rates, excused or unexcused) due
to the value of this particular outcome measure as discovered through other evaluation work.
The goal of this analysis was to answer the following evaluation questions:
To what extent is there evidence that students participating in services and activities
funded by 21st CCLC demonstrated better performance on reading and math assessments
as compared with similar students not participating in the program?
To what extent is there evidence that there are differences between students participating
in services and activities funded by 21st CCLC and similar students not participating in
the program in the non-academic aspects, number of unexcused absences and number of
disciplinary incidents?
Two treatment groups were defined to address these questions, the first consisting of students
attending 21st CCLC 30 days or more during the reporting period and the second consisting of
students attending 21st CCLC 60 days or more during the reporting period (the latter group being
a subset of the first group to assess dosage differences). These treatment groups were compared
to a non-participant group of students using a propensity score stratification approach, described
in more detail below.

American Institutes for Research Statewide Evaluation of RI 21st CCLC Program: Final Report—41
Propensity Score Matching
In any evaluation of a program where participants are not randomly assigned to participate in the
program, the problem of selection is paramount. We know that it is likely that students who
participate in 21st CCLC programming are different from those who do not attend. These
differences can bias estimates of program effectiveness because they make it difficult to
disentangle pre-existing differences between students who attended the program and those who
did not from the effect of attending the program. In review of the datasets used in the analysis,
we found that students who attended the program tended to be higher achieving students than
those who did not prior to the start of the current academic year. The quasi-experimental
approach outlined here, propensity score matching (PSM), is a method for mitigating that
existing bias in program effect (i.e., if one were to simply compare the students who attended
and those who did not).
Propensity score matching is a two-stage process. In the first stage, the probability that each
student participates in the 21st CCLC program is modeled on available observable
characteristics. By modeling selection into the program, this approach allowed comparison of
participating and non-participating students who would have had a similar propensity to select
into the program based on observable characteristics (e.g., demographic data supplied by RIDE).
In the second stage, the predicted probability of participation was used to model student
outcomes while accounting for selection bias. Pretreatment group differences were balanced in
observed covariates using a propensity score stratification and marginal mean weighting
approach (Hong & Hong, 2009).
Creation of the Comparison Group
The outcome of interest in modeling propensity scores is treatment status (1 for students
participating in the program, 0 for the comparison group). To account for this binary outcome,
logistic regression was used to model the logit (or log-odds) of student group assignment status.
Examples of student-level variables used to fit the propensity score models included:
Prior achievement in reading and math
Student demographic information including
o Gender
o Racial Status
o Socioeconomic status
o Special Education status
o Migrant status
o Immigrant status
o School type
In addition to the student-level variables, the propensity score model also included school
variables which added information about the school a student attended (to account for school-
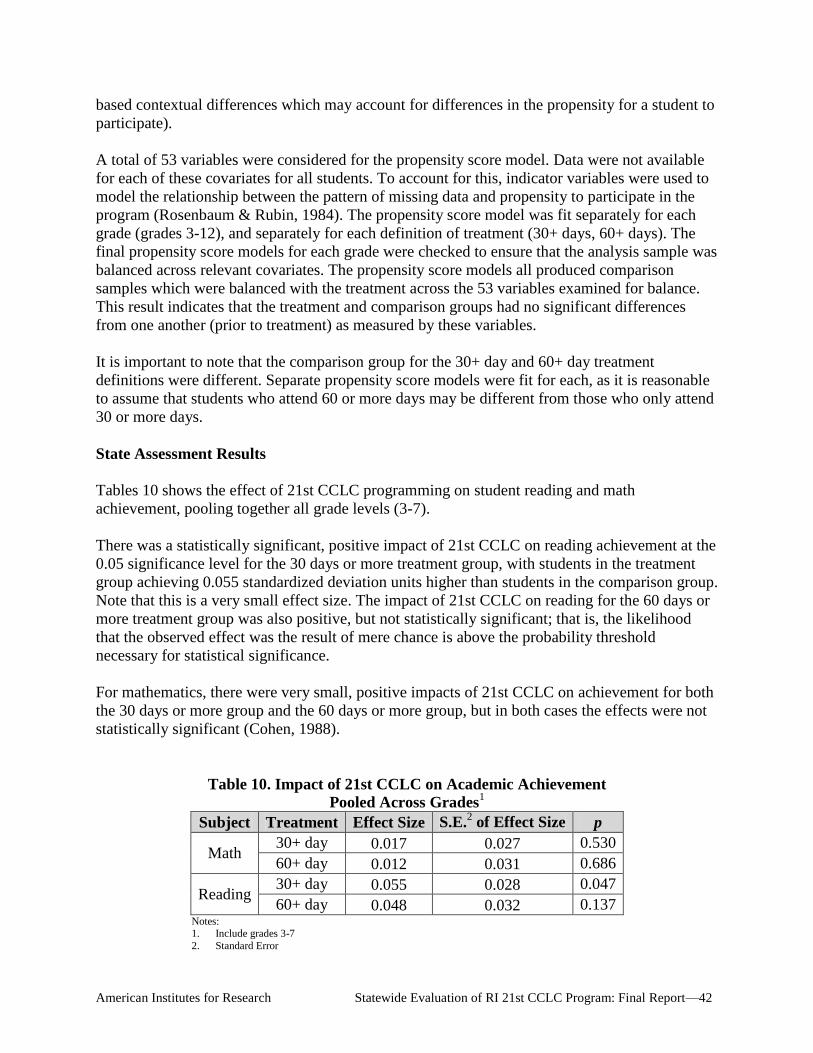
American Institutes for Research Statewide Evaluation of RI 21st CCLC Program: Final Report—42
based contextual differences which may account for differences in the propensity for a student to
participate).
A total of 53 variables were considered for the propensity score model. Data were not available
for each of these covariates for all students. To account for this, indicator variables were used to
model the relationship between the pattern of missing data and propensity to participate in the
program (Rosenbaum & Rubin, 1984). The propensity score model was fit separately for each
grade (grades 3-12), and separately for each definition of treatment (30+ days, 60+ days). The
final propensity score models for each grade were checked to ensure that the analysis sample was
balanced across relevant covariates. The propensity score models all produced comparison
samples which were balanced with the treatment across the 53 variables examined for balance.
This result indicates that the treatment and comparison groups had no significant differences
from one another (prior to treatment) as measured by these variables.
It is important to note that the comparison group for the 30+ day and 60+ day treatment
definitions were different. Separate propensity score models were fit for each, as it is reasonable
to assume that students who attend 60 or more days may be different from those who only attend
30 or more days.
State Assessment Results
Tables 10 shows the effect of 21st CCLC programming on student reading and math
achievement, pooling together all grade levels (3-7).
There was a statistically significant, positive impact of 21st CCLC on reading achievement at the
0.05 significance level for the 30 days or more treatment group, with students in the treatment
group achieving 0.055 standardized deviation units higher than students in the comparison group.
Note that this is a very small effect size. The impact of 21st CCLC on reading for the 60 days or
more treatment group was also positive, but not statistically significant; that is, the likelihood
that the observed effect was the result of mere chance is above the probability threshold
necessary for statistical significance.
For mathematics, there were very small, positive impacts of 21st CCLC on achievement for both
the 30 days or more group and the 60 days or more group, but in both cases the effects were not
statistically significant (Cohen, 1988).
Table 10. Impact of 21st CCLC on Academic Achievement
Pooled Across Grades1
Subject Treatment Effect Size S.E.2 of Effect Size p
Math 30+ day 0.017 0.027 0.530
60+ day 0.012 0.031 0.686
Reading 30+ day 0.055 0.028 0.047
60+ day 0.048 0.032 0.137 Notes: 1. Include grades 3-7
2. Standard Error
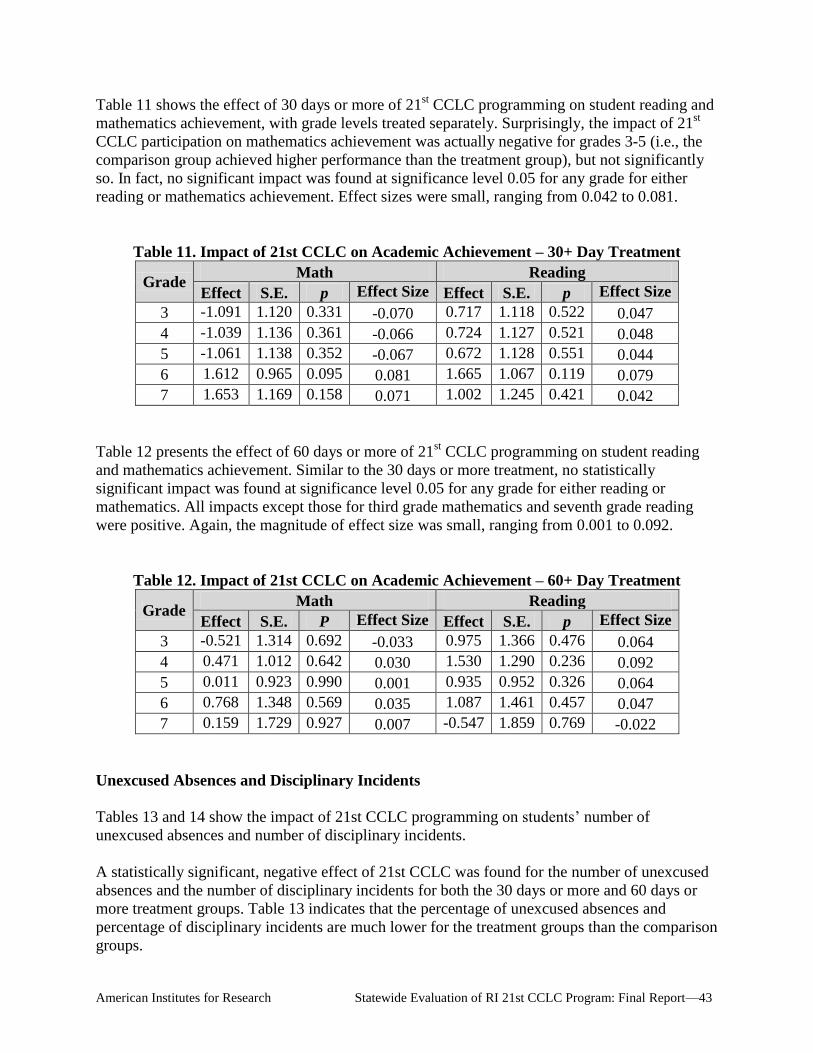
American Institutes for Research Statewide Evaluation of RI 21st CCLC Program: Final Report—43
Table 11 shows the effect of 30 days or more of 21st CCLC programming on student reading and
mathematics achievement, with grade levels treated separately. Surprisingly, the impact of 21st
CCLC participation on mathematics achievement was actually negative for grades 3-5 (i.e., the
comparison group achieved higher performance than the treatment group), but not significantly
so. In fact, no significant impact was found at significance level 0.05 for any grade for either
reading or mathematics achievement. Effect sizes were small, ranging from 0.042 to 0.081.
Table 11. Impact of 21st CCLC on Academic Achievement – 30+ Day Treatment
Grade Math Reading
Effect S.E. p Effect Size Effect S.E. p Effect Size
3 -1.091 1.120 0.331 -0.070 0.717 1.118 0.522 0.047
4 -1.039 1.136 0.361 -0.066 0.724 1.127 0.521 0.048
5 -1.061 1.138 0.352 -0.067 0.672 1.128 0.551 0.044
6 1.612 0.965 0.095 0.081 1.665 1.067 0.119 0.079
7 1.653 1.169 0.158 0.071 1.002 1.245 0.421 0.042
Table 12 presents the effect of 60 days or more of 21st CCLC programming on student reading
and mathematics achievement. Similar to the 30 days or more treatment, no statistically
significant impact was found at significance level 0.05 for any grade for either reading or
mathematics. All impacts except those for third grade mathematics and seventh grade reading
were positive. Again, the magnitude of effect size was small, ranging from 0.001 to 0.092.
Table 12. Impact of 21st CCLC on Academic Achievement – 60+ Day Treatment
Grade Math Reading
Effect S.E. P Effect Size Effect S.E. p Effect Size
3 -0.521 1.314 0.692 -0.033 0.975 1.366 0.476 0.064
4 0.471 1.012 0.642 0.030 1.530 1.290 0.236 0.092
5 0.011 0.923 0.990 0.001 0.935 0.952 0.326 0.064
6 0.768 1.348 0.569 0.035 1.087 1.461 0.457 0.047
7 0.159 1.729 0.927 0.007 -0.547 1.859 0.769 -0.022
Unexcused Absences and Disciplinary Incidents
Tables 13 and 14 show the impact of 21st CCLC programming on students’ number of
unexcused absences and number of disciplinary incidents.
A statistically significant, negative effect of 21st CCLC was found for the number of unexcused
absences and the number of disciplinary incidents for both the 30 days or more and 60 days or
more treatment groups. Table 13 indicates that the percentage of unexcused absences and
percentage of disciplinary incidents are much lower for the treatment groups than the comparison
groups.
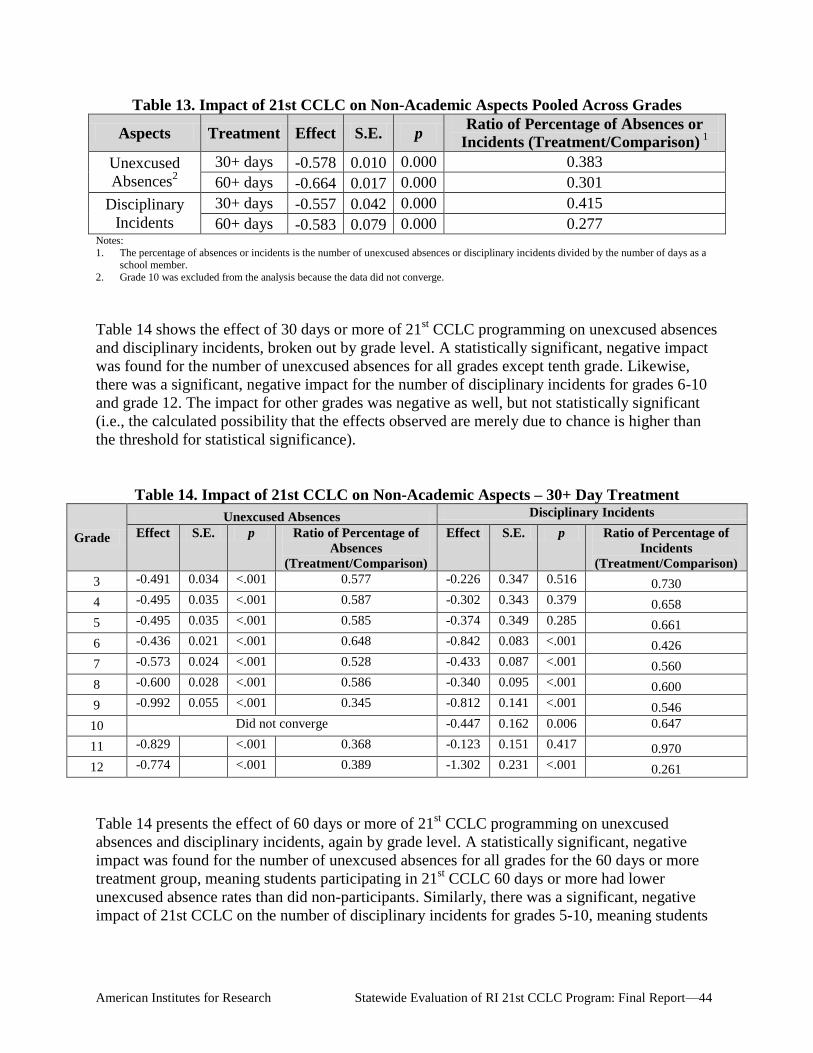
American Institutes for Research Statewide Evaluation of RI 21st CCLC Program: Final Report—44
Table 13. Impact of 21st CCLC on Non-Academic Aspects Pooled Across Grades
Aspects Treatment Effect S.E. p Ratio of Percentage of Absences or
Incidents (Treatment/Comparison) 1
Unexcused
Absences2
30+ days -0.578 0.010 0.000 0.383
60+ days
-0.664 0.017 0.000 0.301
Disciplinary
Incidents
30+ days -0.557 0.042 0.000 0.415
60+ days
-0.583 0.079 0.000 0.277 Notes:
1. The percentage of absences or incidents is the number of unexcused absences or disciplinary incidents divided by the number of days as a school member.
2. Grade 10 was excluded from the analysis because the data did not converge.
Table 14 shows the effect of 30 days or more of 21st CCLC programming on unexcused absences
and disciplinary incidents, broken out by grade level. A statistically significant, negative impact
was found for the number of unexcused absences for all grades except tenth grade. Likewise,
there was a significant, negative impact for the number of disciplinary incidents for grades 6-10
and grade 12. The impact for other grades was negative as well, but not statistically significant
(i.e., the calculated possibility that the effects observed are merely due to chance is higher than
the threshold for statistical significance).
Table 14. Impact of 21st CCLC on Non-Academic Aspects – 30+ Day Treatment
Grade
Unexcused Absences Disciplinary Incidents
Effect S.E. p Ratio of Percentage of
Absences
(Treatment/Comparison)
Effect S.E. p Ratio of Percentage of
Incidents
(Treatment/Comparison)
3 -0.491 0.034 <.001 0.577 -0.226 0.347 0.516 0.730
4 -0.495 0.035 <.001 0.587 -0.302 0.343 0.379 0.658
5 -0.495 0.035 <.001 0.585 -0.374 0.349 0.285 0.661
6 -0.436 0.021 <.001 0.648 -0.842 0.083 <.001 0.426
7 -0.573 0.024 <.001 0.528 -0.433 0.087 <.001 0.560
8 -0.600 0.028 <.001 0.586 -0.340 0.095 <.001 0.600
9 -0.992 0.055 <.001 0.345 -0.812 0.141 <.001 0.546
10 Did not converge -0.447 0.162 0.006 0.647
11 -0.829 <.001 0.368 -0.123 0.151 0.417 0.970
12 -0.774 <.001 0.389 -1.302 0.231 <.001 0.261
Table 14 presents the effect of 60 days or more of 21st CCLC programming on unexcused
absences and disciplinary incidents, again by grade level. A statistically significant, negative
impact was found for the number of unexcused absences for all grades for the 60 days or more
treatment group, meaning students participating in 21st CCLC 60 days or more had lower
unexcused absence rates than did non-participants. Similarly, there was a significant, negative
impact of 21st CCLC on the number of disciplinary incidents for grades 5-10, meaning students
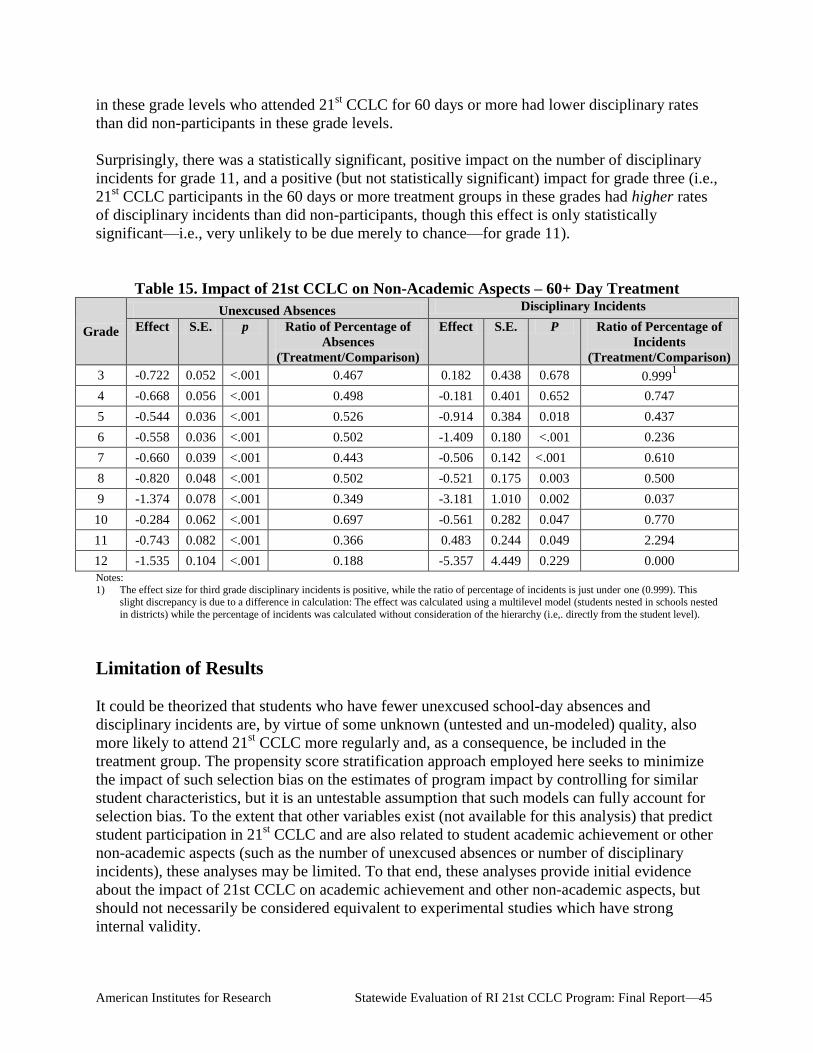
American Institutes for Research Statewide Evaluation of RI 21st CCLC Program: Final Report—45
in these grade levels who attended 21st CCLC for 60 days or more had lower disciplinary rates
than did non-participants in these grade levels.
Surprisingly, there was a statistically significant, positive impact on the number of disciplinary
incidents for grade 11, and a positive (but not statistically significant) impact for grade three (i.e.,
21st CCLC participants in the 60 days or more treatment groups in these grades had higher rates
of disciplinary incidents than did non-participants, though this effect is only statistically
significant—i.e., very unlikely to be due merely to chance—for grade 11).
Table 15. Impact of 21st CCLC on Non-Academic Aspects – 60+ Day Treatment
Grade
Unexcused Absences Disciplinary Incidents
Effect S.E. p Ratio of Percentage of
Absences
(Treatment/Comparison)
Effect S.E. P Ratio of Percentage of
Incidents
(Treatment/Comparison)
3 -0.722 0.052 <.001 0.467 0.182 0.438 0.678 0.9991
4 -0.668 0.056 <.001 0.498 -0.181 0.401 0.652 0.747
5 -0.544 0.036 <.001 0.526 -0.914 0.384 0.018 0.437
6 -0.558 0.036 <.001 0.502 -1.409 0.180 <.001 0.236
7 -0.660 0.039 <.001 0.443 -0.506 0.142 <.001 0.610
8 -0.820 0.048 <.001 0.502 -0.521 0.175 0.003 0.500
9 -1.374 0.078 <.001 0.349 -3.181 1.010 0.002 0.037
10 -0.284 0.062 <.001 0.697 -0.561 0.282 0.047 0.770
11 -0.743 0.082 <.001 0.366 0.483 0.244 0.049 2.294
12 -1.535 0.104 <.001 0.188 -5.357 4.449 0.229 0.000
Notes: 1) The effect size for third grade disciplinary incidents is positive, while the ratio of percentage of incidents is just under one (0.999). This
slight discrepancy is due to a difference in calculation: The effect was calculated using a multilevel model (students nested in schools nested
in districts) while the percentage of incidents was calculated without consideration of the hierarchy (i.e,. directly from the student level).
Limitation of Results
It could be theorized that students who have fewer unexcused school-day absences and
disciplinary incidents are, by virtue of some unknown (untested and un-modeled) quality, also
more likely to attend 21st CCLC more regularly and, as a consequence, be included in the
treatment group. The propensity score stratification approach employed here seeks to minimize
the impact of such selection bias on the estimates of program impact by controlling for similar
student characteristics, but it is an untestable assumption that such models can fully account for
selection bias. To the extent that other variables exist (not available for this analysis) that predict
student participation in 21st CCLC and are also related to student academic achievement or other
non-academic aspects (such as the number of unexcused absences or number of disciplinary
incidents), these analyses may be limited. To that end, these analyses provide initial evidence
about the impact of 21st CCLC on academic achievement and other non-academic aspects, but
should not necessarily be considered equivalent to experimental studies which have strong
internal validity.
American Institutes for Research Statewide Evaluation of RI 21st CCLC Program: Final Report—46
VII. Conclusion and Recommendations
As shown by the impact analysis, Rhode Island’s 21st CCLC program is having a significant,
positive impact on 21st CCLC participants, notably on student school-day attendance and
behavior as gauged by unexcused absences and disciplinary incidents. Less clear is the impact of
the 21st CCLC program on reading or mathematics state assessment results; most of the impact
analyses revealed a not-statistically-significant relationship between 21st CCLC participation and
assessment changes (though there was a very small, significant effect of 21st CCLC participation
on reading assessment score changes for students attending 30 days or more). In terms of the
theory of change used to frame this report, however, this shows that the program is in fact
yielding significant positive youth outcomes, a highly encouraging finding.
These positive effects are, however, associated with program participation across the state as a
whole without extensive consideration of program quality. That is, while the evaluation presents
some findings relating to quality via the survey results shown in Chapter V, the impact analysis
presents the effects of participation in 21st CCLC on desirable student outcomes without
reference to particular programming models or practices; while the findings are indeed positive,
it would be interesting to see more detail about how program quality directly relates (or does not
relate) to student outcomes. Inclusion of certain quality measures was in fact originally included
in AIR’s 2011-12 impact assessment plan (i.e., using RIPQA data), but was ultimately excluded
due to considerations of data quality and consistency. In future evaluation efforts, it may be
beneficial to look deeper into quality assessment for both descriptive and impact assessment
purposes. Research questions of particular interest would address:
The extent to which centers are serving the targeted student population (students in high-
poverty areas and students in need of academic improvement)
The extent to which centers are providing academic enrichment and additional
opportunities that support and contribute to the academic achievement and youth
development for all student participants
The extent to which centers are providing families of participating students with activities
that promote literacy and related educational development
The extent to which grantees are recruiting and engaging community partners to expand
capacity for program offerings and for sustaining the program beyond the grant period
The extent to which subgrantees are engaging in practices theorized to be linked to
desirable student outcomes
Each of these areas—with particular emphasis on the last—would provide useful data on
program quality, providing groundwork for further exploration of the linkages between program
implementation and student outcomes.
In terms of next steps, it is recommended that an analysis of program quality in the form of
activity observations be undertaken in order to create a measure of program quality at the point
of service. Further, given the findings relating to unexcused absences and disciplinary incidents,
along with the lack of significant findings concerning positive assessment score changes, it may
be advisable to collect data that will show more intermediary student outcomes that may “fall

American Institutes for Research Statewide Evaluation of RI 21st CCLC Program: Final Report—47
between” the outcomes of attendance and academic growth—for example, student beliefs or
perceptions about school, learning, or their own abilities. These data could be used as an
additional outcome measure, and would help to present a more complete picture of how 21st
CCLC activities affect student outcomes.
American Institutes for Research Statewide Evaluation of RI 21st CCLC Program: Final Report—48
References
Birmingham, J., Pechman, E. M., Russell, C. A., & Mielke, M. (2005). Shared features of high-
performing after-school programs: A follow-up to the TASC evaluation. Washington DC:
Policy Studies Associates.
Black, A. R., Doolittle, F., Zhu, P., Unterman, R., & Grossman, J. B. (2008). The
evaluation of enhanced academic instruction in after-school programs: Findings after the
first year of implementation (NCEE 2008-4021). Washington, DC: National Center for
Education Evaluation and Regional Assistance, Institute of Education Sciences, U.S.
Department of Education. Retrieved from http://ies.ed.gov/ncee/pdf/20084021.pdf
Cohen, J. (1988). Statistical Power Analysis for the Behavioral Sciences 2nd
edition. Hillsdale,
NJ: Lawrence Erlbaum.
Durlak, J., Mahoney, J., Bohnert, A., & Parente, M. (2010). Developing and improving after-
school programs to enhance youth’s personal growth and adjustment: A special issue of
AJCP. American Journal of Community Psychology, 45(3), 285–293.
Durlak, J. A., & Weissberg R. P. (2007). The impact of after-school programs that promote
personal and social skills. Chicago: Collaborative for Academic, Social, and Emotional
Learning.
Glisson, C. (2007). Assessing and changing organizational culture and climate for effective
services. Research on Social Work Practice, 17(6), 736–747.
Granger, R. (2008). After-school programs and academics: Implications for policy, practice, and
research. Social Policy Report, 22(2), 3–19.
Granger, R. C., Durlak, J. A., Yohalem, N., & Reisner, E. (2007). Improving after-school
program quality. New York: William T. Grant Foundation.
Hong, G., & Hong, Y. (2009). Reading instruction time and homogeneous grouping in
kindergarten: An application of marginal mean weighting through stratification.
Educational Evaluation and Policy Analysis, 31(1), 54-81.
Lauer, P. A., Akiba, M., Wilkerson, S. B., Apthorp, H. A., Snow, D., & Martin-Glenn, M.
(2006). Out-of-school-time programs: A meta-analysis of effects for at-risk students.
Review of Educational Research, 76(2), 275–313.
Little, P. (2007). The quality of school-age child care in after-school settings (Research to Policy
Connections, No. 7). New York: National Center for Children in Poverty, Columbia
University Mailman School of Public Health.
American Institutes for Research Statewide Evaluation of RI 21st CCLC Program: Final Report—49
Naftzger, N., Bonney, C., Donague, T., Hutchinson, C., Margolin, J., & Vinson, M. (2007). 21st
Century Community Learning Centers (21st CCLC) analytic support for evaluation and
program monitoring: An overview of the 21st CCLC performance data: 2005–06.
Naperville, IL: Learning Point Associates.
Noam, G. G. (2008). A new day for youth: Creating sustainable quality in out-of-school time.
New York: Wallace Foundation.
Rosenbaum. P., & Rubin, D. (1984). Reducing bias in observational studies using
subclassification on the propensity score. Journal of the American Statistical Association,
79, 516-24.
Smith, C. (2007, March). Predictors of quality at the point of service provision: Empirical and
methodological background for the YPQA field trial. Paper presented at the biennial
meeting of the Society for Research in Child Development, Boston, MA.
Smith, C., Peck, S., Denault, A., Blazevski, J., & Akiva, T. (2010). Quality at the point of
service: Profiles of practice in after-school settings. American Journal of Community
Psychology, 45(3), 358–369.
Vandell, D. L., Reisner, E. R., Brown, B. B., Dadisman, K., Pierce, K. M., Lee, D., et al. (2005).
The study of promising after-school programs: Examination of intermediate outcomes in
year 2. Madison, WI: Wisconsin Center for Education Research. Retrieved from
http://childcare.wceruw.org/pdf/pp/year2_executive_summary_and_brief_report.pdf
Wilson-Ahlstrom, A., & Yohalem, N. (with Pittman, K.). (2007). Building quality
improvement systems: Lessons from three emerging efforts in the youth-serving
sector. Washington, DC: Forum for Youth Investment, Impact Strategies.
Yohalem, N., Wilson-Ahlstrom, A., Fischer, S., & Shinn, M. (2009). Measuring youth program
quality: A guide to assessment tools (2nd ed.). Washington, DC: Forum for Youth
Investment.

American Institutes for Research Statewide Evaluation of RI 21st CCLC Program: Final Report—50
Appendix. Core Survey Items
Dimension 1: Collaboration and Partnership
To examine the level of partner involvement in program operations and activities, the evaluation
team developed a scale based on the following survey question and items:
Do you and representatives from partner agencies involved in afterschool programming work
together to do the following, and if you do, are these things done informally or formally?
(Response options were Do not work together, Work together informally, and Work together
formally.)
Establish goals and objectives for the program
Orient new staff to the program
Provide professional development opportunities to program staff
Review evaluation results and target areas for improvement
Develop and evaluate the effectiveness of operational procedures (e.g., recruitment,
scheduling, activity transitions, etc.)
Plan for program sustainability and/or expansion
To assess the level of collaboration and communication among center staff members, the
evaluation team developed a scale based on the following survey question and items:
How frequently do you engage in the following tasks with other staff working in the afterschool
program?
(Response options were Never, About once a year, About once a month, and Nearly every week.)
Conduct program planning based on a review of program data
Use evaluation data to set program improvement goals
Discuss progress on meeting program improvement goals
Observe other afterschool staff delivering programming in order to provide feedback on
their practice.
Conduct program planning in order to meet specific learning goals in coordinated ways
across multiple activities
Share ideas on how to make programming more engaging for participating students
Share experiences and follow up about individual youth
Engage in discussions with school-day teachers and/or administrators on how the
program could better support student learning needs
Participate in training and professional development on how to better serve youth
Discuss current research-based instructional practices
American Institutes for Research Statewide Evaluation of RI 21st CCLC Program: Final Report—51
To assess the extent of collaboration and communication between center staff and school-day
staff, the evaluation team developed a scale based on the following survey question and items:
What strategies are used to link the program to the regular school day?
(Response options were Not a strategy, Minor strategy, and Major strategy.)
Align programming to school-day curriculum and standards
Help with homework
Hire regular school-day teachers to deliver programming
Joint professional development between school-day teachers and afterschool staff
Co-teaching of programs between school-day teachers and afterschool staff
Use student assessment and/or grades to inform programming
Regular face-to-face meetings with school-day teachers
Regular face-to-face meetings with principals and other school-day administrative staff
Regular electronic communications with school-day teachers
Regular electronic communications with principals and other school-day administrative
staff
Regular monitoring of students’ academic performance on district- or building-level
assessments across the school year and use of this information to inform activity
provision
Ensure activities are informed by and meant to support schoolwide improvement targets
related to student performance
Dimension 2: Staffing
To determine program alignment with principles of quality staffing and professional
development, site managers were asked to report whether each of the following possible
challenges to staffing their programs was a Minor challenge, a Major challenge, or Not a
challenge:
Staff not adequately trained or experienced
Staff turnovers
Not enough staff
Not enough time to orient new staff
A lack of planning time for staff
Not enough time to hold staff meetings
Lack of staff dedication to the program
Staff not designing and delivering activities that are consistent with center goals and activities
Staff-to-student ratios are lower than what I would consider ideal

American Institutes for Research Statewide Evaluation of RI 21st CCLC Program: Final Report—52
Dimension 3: RIPQA Process
To gauge the level of impact of RIPQA participation, the evaluation team developed a scale
based on the following survey question and items:
To what extent has participation in the RIPQA process changed the following at your site?
(Response options were Not at all, Minimum extent, Moderate extent, and Great extent.)
Staff hiring policies
Professional development for staff
Connecting with schools
Involving the community in partnerships
Use of data for continuous improvement
Designing activities
Embedding content
Interacting with youth
Dimension 4: Intentional Program Services and Activities
To gauge the level of youth ownership among centers, the evaluation team developed a scale
based on the following survey question and items:
Please indicate your level of agreement or disagreement with the following statements about
how your students build ownership of the program:
(Response options were Strongly disagree, Disagree, Agree, and Strongly agree.)
Youth set goals for what they want to accomplish in the program.
Youth help make plans for what activities are offered at the program.
Youth make choices about what content is covered in program offerings.
Youth make choices about how content is covered in program offerings.
Youth help create expectations and guidelines for the program.
Youth provide feedback about the ways things should work in the program.
Youth have a formal role in program governance.
American Institutes for Research Statewide Evaluation of RI 21st CCLC Program: Final Report—53
To further understand the extent of intentional planning of program activities, site managers were
asked a set of questions about staff access to and use of various types of student data/information
for planning activities. The evaluation team developed a scale based on the following survey
question and items:
Please indicate whether your program has access to the following and to what extent this
information is used by program staff in planning for the activities provided:
(Response options were Do not have access to, Occasionally use, and Often use.)
Individualized Education Plans
Students’ state assessment scores
Students’ score on district- or building-level assessment
Students’ grades
Teacher-provided student progress reports
Information on student disciplinary incidents, referrals, or actions (i.e., detention,
suspensions, etc.)
To gauge the intentionality of program design, the evaluation team developed a scale based on
the following survey question and items:
How often do your staff leading activities that are especially meant to support student growth
and development in reading and/or mathematics provide program activities that meet the
following criteria?
(Response options were Rarely [once or twice a semester], Sometimes [once or twice a month],
Frequently [once or twice a week], and Always [daily for every session].)
Based on written plans for the session, assignments, and projects
Well planned in advance
Tied to specific learning goals
Build upon skills cultivated in a prior activity or session
Explicitly promote skill building and mastery in relation to one or more state standard
Explicitly address a specific developmental domain (e.g., cognitive, social, emotional,
civic, physical, etc.)
Structured to respond to youth feedback on what the content or format of the activity should
be
Informed by the expressed interests, preferences, and/or satisfaction of participating
youth
American Institutes for Research Statewide Evaluation of RI 21st CCLC Program: Final Report—54
Dimension 5: Intentional Family Involvement Activities
To gauge the level of communication with families among centers, the evaluation team
developed a scale based on the following survey question and items:
How often do you:
(Response options were Never, Sometimes [once or twice a semester, and Frequently [monthly
to weekly].)
Send materials about program offerings home to parents/adult family members.
Send information home about how the student is progressing in the program.
Hold events or meetings to which parents/adult family members are invited.
Have conversations with parents/adult family members over the phone.
Meet with one or more parent/adult family member.
Ask for input from parents/adult family members on what and how activities should be
provided.
Encourage parents/adult family members to participate in center-provided programming
meant to support their acquisition of knowledge or skills.
Encourage parents/adult family members to participate in center-provided programming
with their children.
To gauge the level of family input and involvement among centers, the evaluation team
developed a scale based on the following survey question and items:
How often do you:
(Response options were Never, Sometimes [once or twice a semester, and Frequently [monthly
to weekly].)
Ask for input from parents/adult family members on what and how activities should be
provided.
Send information home about how the student is progressing in the program.
Encourage parents/adult family members to participate in center-provided programming
meant to support their acquisition of knowledge or skills.
Encourage parents/adult family members to participate in center-provided programming
with their children.
Invite parents/adult family members to provide program guidance or advocacy.
LOCATIONS
Domestic
Washington, D.C.
Atlanta, GA
Baltimore, MD
Chapel Hill, NC
Chicago, IL
Columbus, OH
Frederick, MD
Honolulu, HI
Indianapolis, IN
Naperville, IL
New York, NY
Portland, OR
Sacramento, CA
San Mateo, CA
Silver Spring, MD
Waltham, MA
INTERNATIONAL
Côte d’Ivoire
Egypt
Honduras
Kenya
Liberia
Malawi
Pakistan
South Africa
Zambia
ABOUT AMERICAN INSTITUTES FOR RESEARCH
Established in 1946, with headquarters in Washington, D.C.,
American Institutes for Research (AIR) is an independent,
nonpartisan, not-for-profit organization that conducts behavioral
and social science research and delivers technical assistance
both domestically and internationally. As one of the largest
behavioral and social science research organizations in the world,
AIR is committed to empowering communities and institutions with
innovative solutions to the most critical challenges in education,
health, workforce, and international development.

1256_02/13
20 North Wacker Drive, Suite 1231
Chicago, IL 60606-2901
800-356-2735 312-288-7600
www.air.org