rhode island hospital volume trends
TRANSCRIPT

Coordinated
Health Planning
Council
Ju ly 19, 2012
RHODE ISLAND
HOSPITAL VOLUME
TRENDS

AG E N DA
(1) Demand: Inpatient & Outpatient
(2) Supply: Inpatient & Outpatient
(3) Impact of Supply and Demand Trends
7/19/2012 Rhode Island Coordinated Health Planning Council 2

This presentation uses information from several
data sources to test the strength and direction of
regional, statewide, and service area trends.
Kaiser S ta te Hea l th Facts v i a the Amer ica Hosp i ta l Assoc iat ion
Reg iona l data for pat ient days , admiss ions , l engths o f s tay, ER v i s i t s , and
outpat ient v i s i t s
Booz & Company Ana lys i s v i a L i fespan Hosp i ta l Corporat ion , BCBSRI
Se lec t Rhode I s l and s ta tewide data 2000 -2010 , ana lys i s o f fu ture t rends
Hosp i ta l D ischarge Database
Ser v ice l i ne and s ta tewide data 2007-2011
Hosp i ta l Assoc iat ion o f Rhode I s l and
Sta f f ing , occupancy, and bed data
Data Sources
7/19/2012 Rhode Island Coordinated Health Planning Council 3
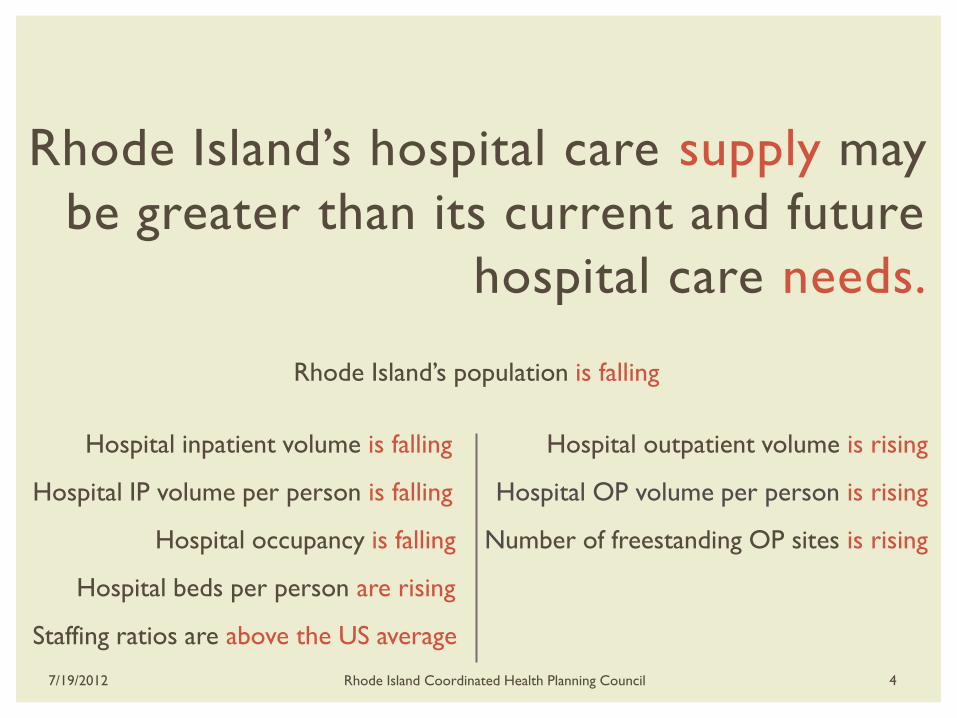
Rhode Island’s hospital care supply may
be greater than its current and future
hospital care needs.
Rhode Island’s population is falling
Hospital inpatient volume is falling Hospital outpatient volume is rising
Hospital IP volume per person is falling Hospital OP volume per person is rising
Hospital occupancy is falling Number of freestanding OP sites is rising
Hospital beds per person are rising
Staffing ratios are above the US average
7/19/2012 Rhode Island Coordinated Health Planning Council 4
Rhode Island’s
population
increased less than
one third of one
percent, or by 2,981
people, between
2000 and 2011
In contrast, total US
population
increased by 10.5%
during the same
time.
This lack of growth
affects future
healthcare demand
and infrastructure
needs. Data Sources: 2000 and 2010: US Census Actuals by State; Annual Estimate of the Resident Population by Selected Age Groups and
Counties in RI April 1, 2000 to July 1, 2011. Release date: May, 2012 | Slide prepared by Booz & Company and provided by Lifespan
Hospital Corporation and Blue Cross Blue Shield of Rhode Island
1,048,319
1,071,504
1,051,300
282,162,400
311,591,900
2000 2001 2002 2003 2004 2005 2006 2007 2008 2009 2010 2011
Rhode Island and United States Population | 2000-2011
US Population
+7.4%, 2003-2011
RI Population
-1.9%, 2003-2011
Rhode Island’s population is
declining from its 2003 peak
7/19/2012 Rhode Island Coordinated Health Planning Council 5
Regional,
Statewide,
and
Service Line
Analyses
VO L U M E ( D E M A N D )
H O S P I TA L
I N PAT I E N T & O U T PAT I E N T
7/19/2012 Rhode Island Coordinated Health Planning Council 6
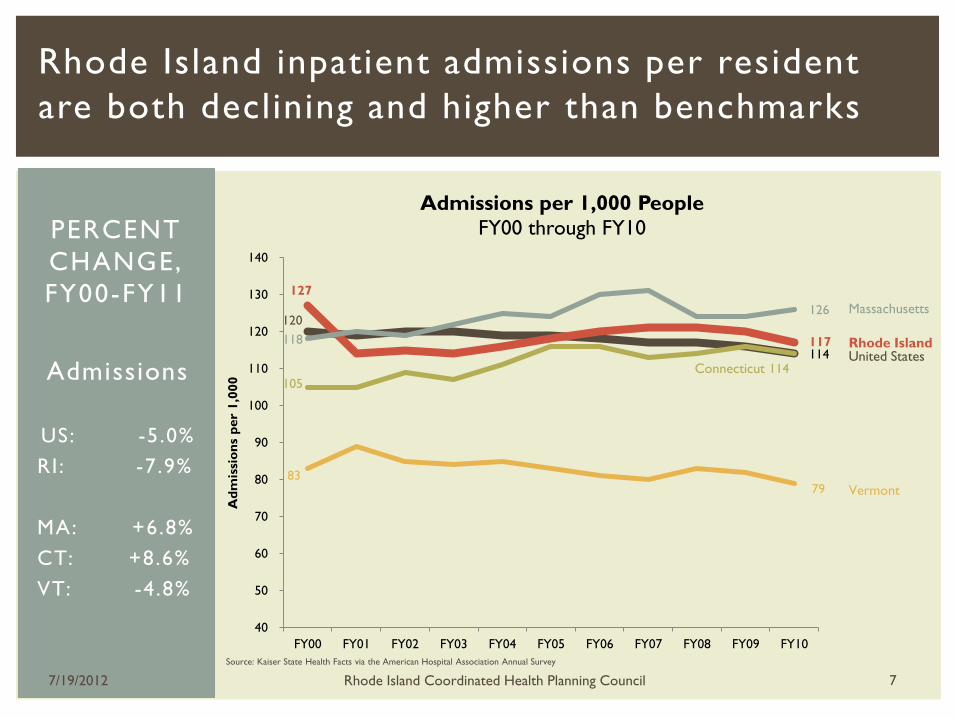
Rhode Island inpatient admissions per resident
are both declining and higher than benchmarks
Rhode Island
Massachusetts
Vermont
120
114
127
117 118
126
105 114
83 79
40
50
60
70
80
90
100
110
120
130
140
FY00 FY01 FY02 FY03 FY04 FY05 FY06 FY07 FY08 FY09 FY10
Ad
mis
sio
ns
per
1,0
00
Admissions per 1,000 People
FY00 through FY10
Admissions
US: -5 .0%
RI: -7.9%
MA: +6.8%
CT: +8.6%
VT: -4 .8%
PERCENT
CHANGE,
FY00-FY11
Connecticut United States
Source: Kaiser State Health Facts via the American Hospital Association Annual Survey
7/19/2012 Rhode Island Coordinated Health Planning Council 7
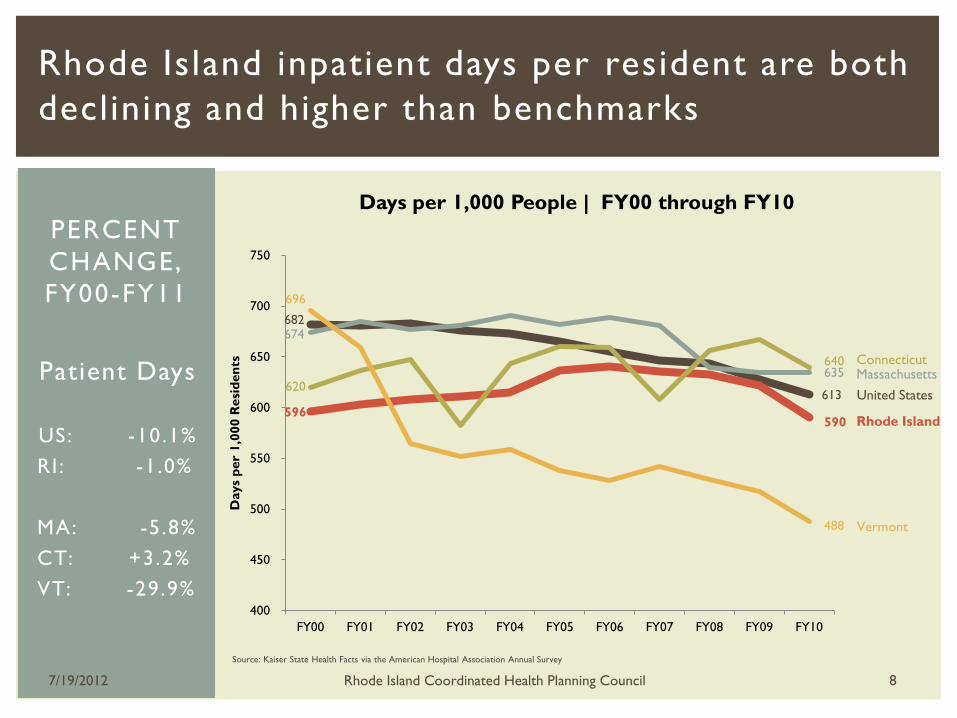
Source: Kaiser State Health Facts via the American Hospital Association Annual Survey
Rhode Island
Massachusetts Connecticut
United States
Vermont
Patient Days
US: -10.1%
RI: -1.0%
MA: -5 .8%
CT: +3.2%
VT: -29.9%
PERCENT
CHANGE,
FY00-FY11 682
613
596 590
674
635 620
640
696
488
400
450
500
550
600
650
700
750
FY00 FY01 FY02 FY03 FY04 FY05 FY06 FY07 FY08 FY09 FY10
Days
per
1,0
00 R
esi
den
ts
Days per 1,000 People | FY00 through FY10
Rhode Island inpatient days per resident are both
declining and higher than benchmarks
7/19/2012 Rhode Island Coordinated Health Planning Council 8
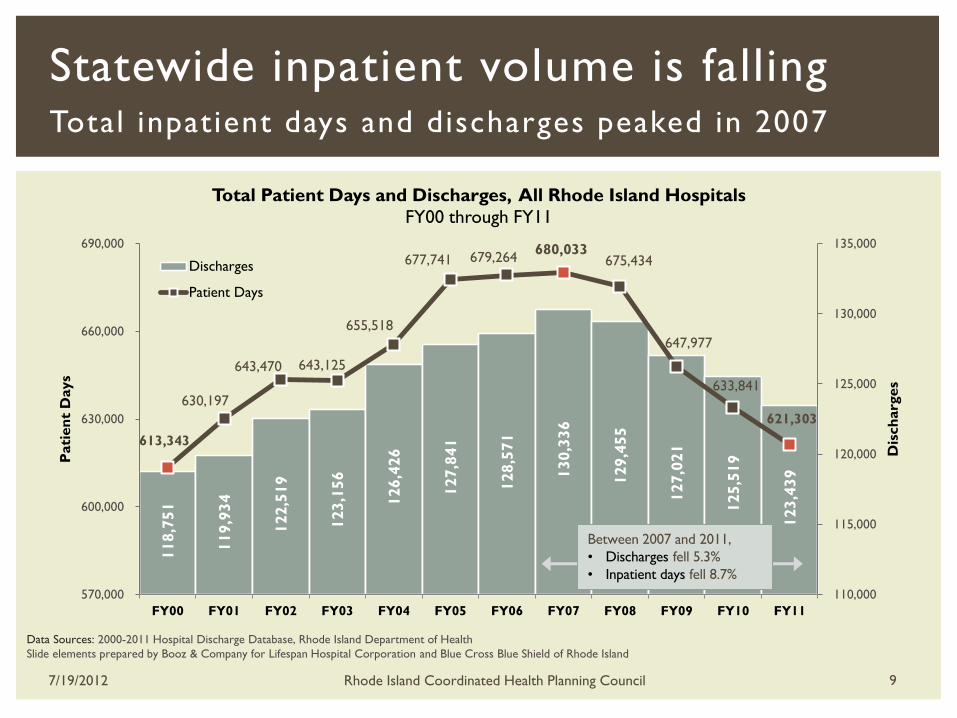
Statewide inpatient volume is falling Total inpatient days and discharges peaked in 2007
118,7
51
119,9
34
122,5
19
123,1
56
126,4
26
127,8
41
128,5
71
130,3
36
129,4
55
127,0
21
125,5
19
123,4
39
613,343
630,197
643,470 643,125
655,518
677,741 679,264 680,033
675,434
647,977
633,841
621,303
110,000
115,000
120,000
125,000
130,000
135,000
570,000
600,000
630,000
660,000
690,000
FY00 FY01 FY02 FY03 FY04 FY05 FY06 FY07 FY08 FY09 FY10 FY11
Dis
ch
arg
es
Pati
en
t D
ays
Total Patient Days and Discharges, All Rhode Island Hospitals
FY00 through FY11
Discharges
Patient Days
Between 2007 and 2011,
• Discharges fell 5.3%
• Inpatient days fell 8.7%
Data Sources: 2000-2011 Hospital Discharge Database, Rhode Island Department of Health
Slide elements prepared by Booz & Company for Lifespan Hospital Corporation and Blue Cross Blue Shield of Rhode Island
7/19/2012 Rhode Island Coordinated Health Planning Council 9
The average length of
stay (ALOS) declined in
all three states shown at
the left. ALOS may fall
for several reasons,
including rising hospitals
efficiency and reduced
patients acuity.
Shorter hospital stays
may reduce occupancy
and lower total hospital
demand.
Rhode Island’s ALOS,
however, is the highest
of the three states and
declined slower than
Connecticut over the
ten year period. Based
on regional trends,
further declines in are
expected.
Average Length of Stay (ALOS) is Falling
Across the Region
5.16
5.01
5.09
4.96
5.07
4.72
4.9
4.8
4.40
4.50
4.60
4.70
4.80
4.90
5.00
5.10
5.20
5.30
5.40
FY00 FY01 FY02 FY03 FY04 FY05 FY06 FY07 FY08 FY09 FY10
Average Length of Stay
FY00 through FY10
Data excludes Psychiatric, Rehabilitation, and Veteran’s hospitals as well as normal newborns
Data Sources: Market Data from Thompson Reuters (MA, CT, RI 2000-2006), Rhode Island Hospital Discharge Database (2007-2010); Kaiser State Health Facts (US)
Slide elements prepared by Booz & Company for Lifespan Hospital Corporation and Blue Cross Blue Shield of Rhode Island
Rhode Island
Massachusetts
Connecticut % Change FY00 – FY10
Rhode Island -3.0%
Massachusetts -2.6%
Connecticut -6.9%
United States (FY00-FY09) -2.0%
United States
7/19/2012 Rhode Island Coordinated Health Planning Council 10
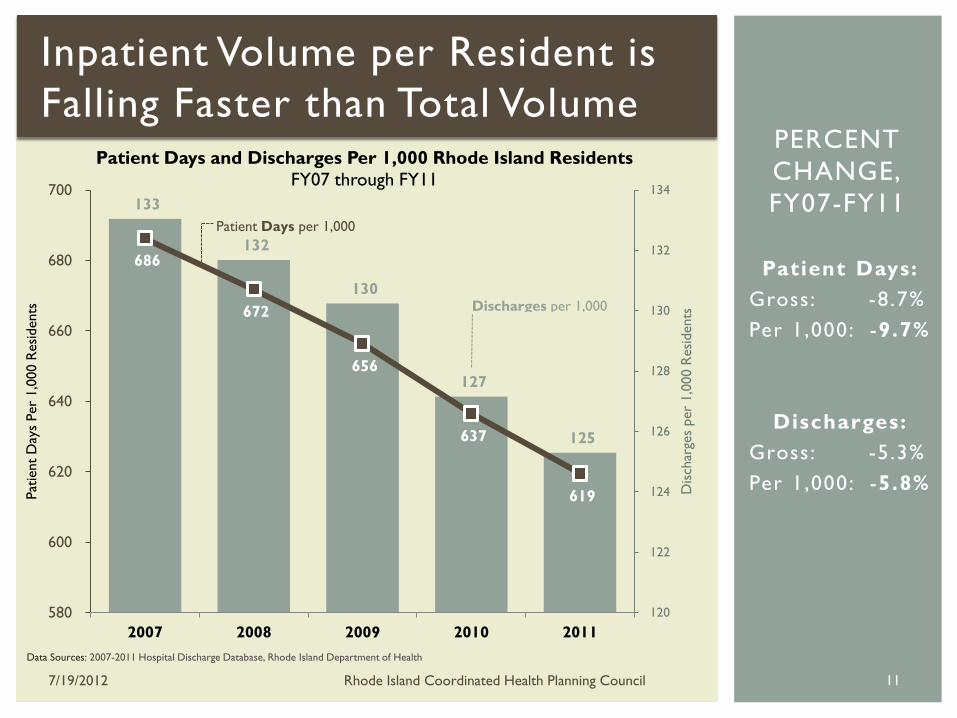
Patient Days:
Gross: -8 .7%
Per 1,000: -9.7%
Discharges:
Gross: -5 .3%
Per 1,000: -5.8%
PERCENT
CHANGE,
FY07-FY11 133
132
130
127
125
686
672
656
637
619
120
122
124
126
128
130
132
134
580
600
620
640
660
680
700
2007 2008 2009 2010 2011
Dis
char
ges
per
1,0
00 R
esi
dents
Pat
ient
Day
s Per
1,0
00 R
esi
dents
Patient Days and Discharges Per 1,000 Rhode Island Residents
FY07 through FY11
Discharges per 1,000
Patient Days per 1,000
Inpatient Volume per Resident is
Falling Faster than Total Volume
Data Sources: 2007-2011 Hospital Discharge Database, Rhode Island Department of Health
7/19/2012 Rhode Island Coordinated Health Planning Council 11
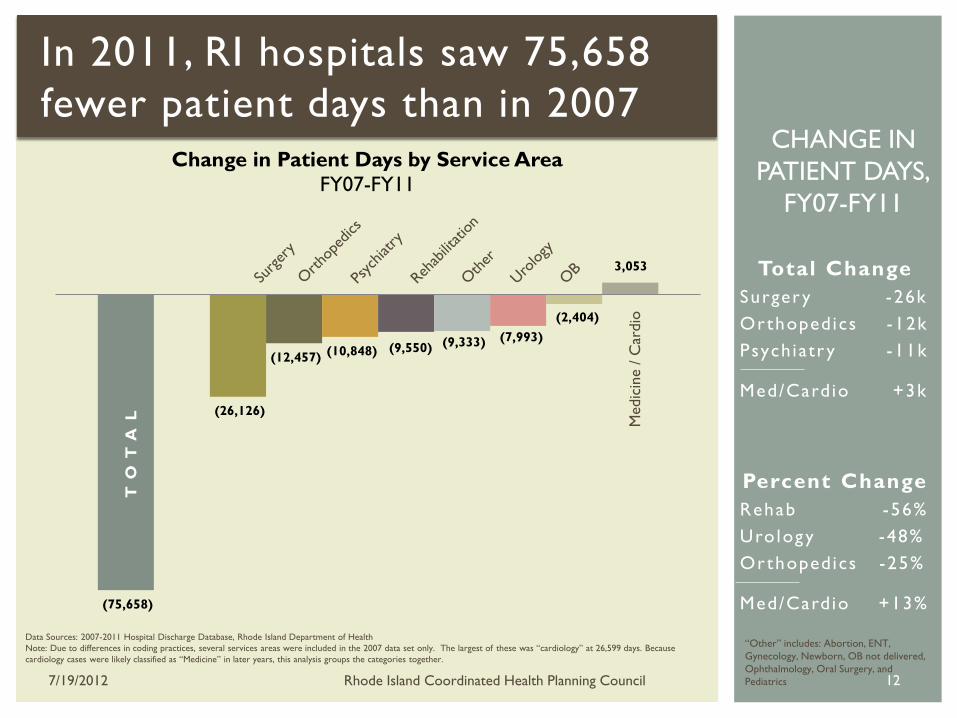
In 2011, RI hospitals saw 75,658
fewer patient days than in 2007
Data Sources: 2007-2011 Hospital Discharge Database, Rhode Island Department of Health
Note: Due to differences in coding practices, several services areas were included in the 2007 data set only. The largest of these was “cardiology” at 26,599 days. Because
cardiology cases were likely classified as “Medicine” in later years, this analysis groups the categories together.
(75,658)
(26,126)
(12,457) (10,848) (9,550) (9,333) (7,993)
(2,404)
3,053
Change in Patient Days by Service Area
FY07-FY11
TO
TA
L
Medic
ine /
Car
dio
Total Change
Surger y -26k
Orthopedics -12k
Psych iatr y -11k
Med/Cardio +3k
Percent Change
Rehab -56%
Uro logy -48%
Orthopedics -25%
Med/Cardio +13%
CHANGE IN
PATIENT DAYS,
FY07-FY11
“Other” includes: Abortion, ENT,
Gynecology, Newborn, OB not delivered,
Ophthalmology, Oral Surgery, and
Pediatrics 7/19/2012 Rhode Island Coordinated Health Planning Council 12

Hospital outpatient volume per person is
rising
Source: Kaiser State Health Facts via the American Hospital Association
Rhode Island
Massachusetts
Connecticut United States
Vermont
Outpatient
Visits
US: +14.0%
RI: +25.7%
MA: +26.3%
CT: +16.7%
VT: +162.8%
PERCENT
CHANGE,
FY07-FY11
1,848
2,106
2,627
3,317
2,311
5,356
1,981
2,491
-
1,000
2,000
3,000
4,000
5,000
6,000
FY00 FY01 FY02 FY03 FY04 FY05 FY06 FY07 FY08 FY09 FY10
OP Visits per 1,000 People | FY00 through FY10
7/19/2012 Rhode Island Coordinated Health Planning Council
13

Hospital outpatient volume per person is
rising
Source: Kaiser State Health Facts via the American Hospital Association
Rhode Island
Massachusetts
Connecticut
United States
Vermont
ER Visits
US: +12.3%
RI: +12.2%
MA: 12.6%
CT: +19.6%
VT: +45.7%
PERCENT
CHANGE,
FY07-FY11
366
411 419
470
427
481
388
464
387
564
300
350
400
450
500
550
600
FY00 FY01 FY02 FY03 FY04 FY05 FY06 FY07 FY08 FY09 FY10
ER Visits per 1,000 People | FY00 through FY10
7/19/2012 Rhode Island Coordinated Health Planning Council
14
Regional,
Statewide, and
Service Line Analyses
7/19/2012 Rhode Island Coordinated Health Planning Council 15
S U P P LY
I N PAT I E N T & O U T PAT I E N T

While inpatient demand per resident
decreased, staffed beds per 1,000 increased
Source: Kaiser State Health Facts via the American Hospital Association
Rhode Island Massachusetts
Connecticut
United States
Vermont
3.0
2.6 2.6
2.3
2.7
2.1
2.3
2.4
1.5
1.7
1.9
2.1
2.3
2.5
2.7
2.9
3.1
FY00 FY01 FY02 FY03 FY04 FY05 FY06 FY07 FY08 FY09 FY10
Staffed Beds per 1,000 People
FY00 through FY10
Staffed Beds
per 1,000
US: -13.3%
RI: +4.3%
MA: -7 .7%
CT: -0 .0%
VT: -22.2%
PERCENT
CHANGE,
FY00-FY11
7/19/2012 Rhode Island Coordinated Health Planning Council 16

RI, New England have higher staffing ratios
than the national average
Rhode Island’s ratio of
nursing full time
equivalents (FTEs) to
beds, across all hospitals,
is higher than the
national rate and lower
than other regional states
The average hourly wage
for nurses in Rhode
Island is $35.12, higher
than the national rate
and about equal to the
regional average.
Expanding the analysis to
all staff yields a similar
pattern: RI is in the
middle of the region, and
all of New England is well
above the national rate. Source: Hospital Association of Rhode Island via Medicare Occupational Mix dataset, FY10
7/19/2012 Rhode Island Coordinated Health Planning Council 17
2.47
1.54
2.97
2.44
2.83
$35.12
$31.82
$39.34
$35.31
$30.23
$0
$5
$10
$15
$20
$25
$30
$35
$40
$45
-
0.50
1.00
1.50
2.00
2.50
3.00
3.50
Rhode Island United States Massachusetts Connecticut Vermont
Nu
rsin
g A
vera
ge H
ou
rly W
age
Nu
rsin
g F
TE
s p
er
Sta
ffed
Bed
Nursing FTE per Staffed Bed and Nursing Average Hourly Wages, FY10
Nurse FTEs per Bed
Average Hourly Wages (Nurses)

1,700
1,800
1,900
2,000
2,100
2,200
2,300
2,400
Nu
mb
er
of
Facilit
ies
Number of Licensed Non-Hospital Outpatient Providers in Rhode Island Monthly, July 2008 - June 2012
2008 2009 2010 2011 2012
July 08: 2,194
June 12: 2,309
The number of non-hospital outpatient sites
is rising along with hospital outpatient volume
7/19/2012 Rhode Island Coordinated Health Planning Council 18
Non-hospital outpatient providers include organized ambulatory care, ambulatory surgical centers,
freestanding emergency care centers, kidney disease treatment centers, federally qualified health centers,
clinical labs, drawing stations, and radiation health facilities
Along with the shift
from inpatient sites
of care to
outpatient sites of
care, the number of
non-hospital
outpatient sites of
care have also
grown.
Non-hospital
outpatient centers
perform similar
services to hospital
outpatient units but
at a lower cost
since these
freestanding
centers do not have
the overhead of a
full-service acute
hospital.
Between July 2008 and
June 2012, the number of
non-hospital outpatient
providers rose by 5.2% or
115 providers.
Source: Rhode Island Department of Health Provider Licensure Data

Occupancy
Regional
Analysis
Future Impact
DEMAND & SUPPLY I M PA C T O F T R E N D S
7/19/2012 Rhode Island Coordinated Health Planning Council 19
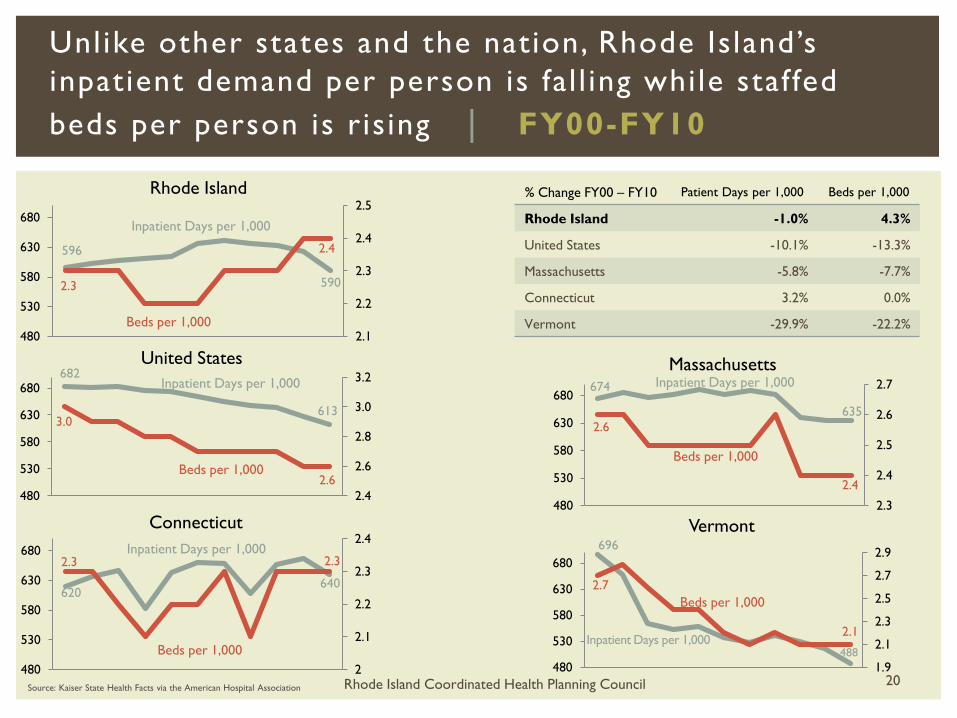
Unlike other states and the nation, Rhode Island’s
inpatient demand per person is fal l ing while staffed
beds per person is ris ing | FY00-FY10
Source: Kaiser State Health Facts via the American Hospital Association
682
613 3.0
2.6
2.4
2.6
2.8
3.0
3.2
480
530
580
630
680
United States
596
590 2.3
2.4
2.1
2.2
2.3
2.4
2.5
480
530
580
630
680
Rhode Island
674
635
2.6
2.4
2.3
2.4
2.5
2.6
2.7
480
530
580
630
680
Massachusetts
620 640
2.3 2.3
2
2.1
2.2
2.3
2.4
480
530
580
630
680
Connecticut 696
488
2.7
2.1
1.9
2.1
2.3
2.5
2.7
2.9
480
530
580
630
680
Vermont
Inpatient Days per 1,000
Beds per 1,000
% Change FY00 – FY10 Patient Days per 1,000 Beds per 1,000
Rhode Island -1.0% 4.3%
United States -10.1% -13.3%
Massachusetts -5.8% -7.7%
Connecticut 3.2% 0.0%
Vermont -29.9% -22.2%
Inpatient Days per 1,000
Beds per 1,000
Inpatient Days per 1,000
Beds per 1,000
Inpatient Days per 1,000
Beds per 1,000
Inpatient Days per 1,000
Beds per 1,000
Rhode Island Coordinated Health Planning Council 20

79%
78%
71%
67%
66%
61%
60%
51%
49%
45%
44%
67%
83%
78%
74%
71%
69%
70%
65%
59%
51%
47%
45%
70%
0% 10% 20% 30% 40% 50% 60% 70% 80% 90%
Rhode Island Hospital
Kent Hospital
Miriam Hospital
Landmark Medical Center
Women and Infants Hospital
South County Hospital
St. Joseph's Health Services of RI
Roger Williams Medical Center
Newport Hospital
Memorial Hospital
Westerly Hospital
Statewide Total
Occupancy Rates, FY11 and FY12 Average Daily Census / Average Staffed Beds
2011
2012
Oct. 2011-April 2012
Data Source: Hospital Association of Rhode Island
In FY12, the statewide
occupancy rate was
67%, down from 70% in
FY11. Only one of
Rhode Island’s hospitals
met or exceeded the
industry standard for a
“full occupancy” hospital
(80% and 85%*.)
The occupancy rate is
the ratio of the average
daily census to total
staffed beds. Hospitals
with lower occupancy
rates may have lower
net income as they must
cover the overhead
costs of a staffed bed
without receiving
patient reimbursement.
* See
http://www.medscape.com/viewarticle/546181
_4
Staffed Beds
Statewide Occupancy Rate (67%, FY 12) is Falling,
Below National Standard for Full Occupancy (83%)
7/19/2012 Rhode Island Coordinated Health Planning Council 21
2,417
96
159
135
161
231
76
247
140
247
295
630
Nat
ional
Sta
ndar
d for
Full
Occ
upan
cy

381
2,133
165
253
211
374
0 100 200 300 400 500 600 700 800 900 1,000 1,100 1,200 1,300 1,400 1,500 1,600 1,700 1,800 1,900 2,000 2,100 2,200
Carotid
Endarterectomy
Abdominal Aortic
Repair
Brain Aneurysm
Repair
Lower Extremity
Bypass
Coronary
Angioplasty
CABG
Actual Procedure Volume vs. Volume Thresholds 2010, Leapfrog Group thresholds
Low volume compromises hospitals’ ability to
achieve minimum essential scale for key
procedures
x x
x x x
x x x x
x x
x x x x x x x x
x
x
Procedure Volume
x x x x x x x
Source: Leapfrog Group, ICD-9 Codes, RI Hospital Discharge Data, Booz & Company analysis
Slide prepared by Booz & Company for Lifespan Hospital Corporation and Blue Cross Blue Shield of Rhode Island
= Volume Threshold
= Total RI Volume (2010)
= Indiv. Hospital Vol (2010) X
Hospital volume for most procedures is
below the recommended minimum
thresholds for realizing the quality and
cost benefits of scale

Rhode Island’s inpatient volume is
declining and shifting to outpatient,
and IP hospital supply exceeds current
demand. However, other factors may
increase demand in the future.
What is the net effect of the up and down
forces on inpatient util ization in the future?
7/19/2012 Rhode Island Coordinated Health Planning Council 23
Despite some upward pressure , Booz & Company
estimates that by 2015, RI uti l ization could fal l by
another 6% to 13% beyond exist ing decl ines
Source: DOH, AHD, RI Hospital Discharge Data, US Census, Statewide Planning Program - RI Department of Administration, Health Director, Booz & Company analysis;
Slide elements prepared by Booz & Company for Lifespan Hospital Corporation and Blue Cross Blue Shield of Rhode Island
Upward Pressure Downward Pressure
7/19/2012 Rhode Island Coordinated Health Planning Council 24
Factor Impact on
Utilization Factor
Impact on
Utilization Measure
Impact on
Utilization
Population
Growth + Aging
0.3%
Increase
Shifts to
Outpatient
2% - 4%
Decrease Bed days
38 - 82 thousand
day decrease
Access via Health
Care Reform
0.7% - 0.8%
Increase
Decreasing
Readmissions
2% - 3%
Decrease $ Savings $85-$170 million
Worsening Health 1.1% - 2.2%
Increase Decreasing ALOS
4% - 10%
Decrease Beds
105-120 fewer
beds
Increased Imports 0.05%- 0.11%
Increase
Avoided Exports 0.02% - 0.05%
Increase
Net Impact 2 - 3%
Increase
8% - 17%
Decrease
6 - 13%
Decrease
Net Impact
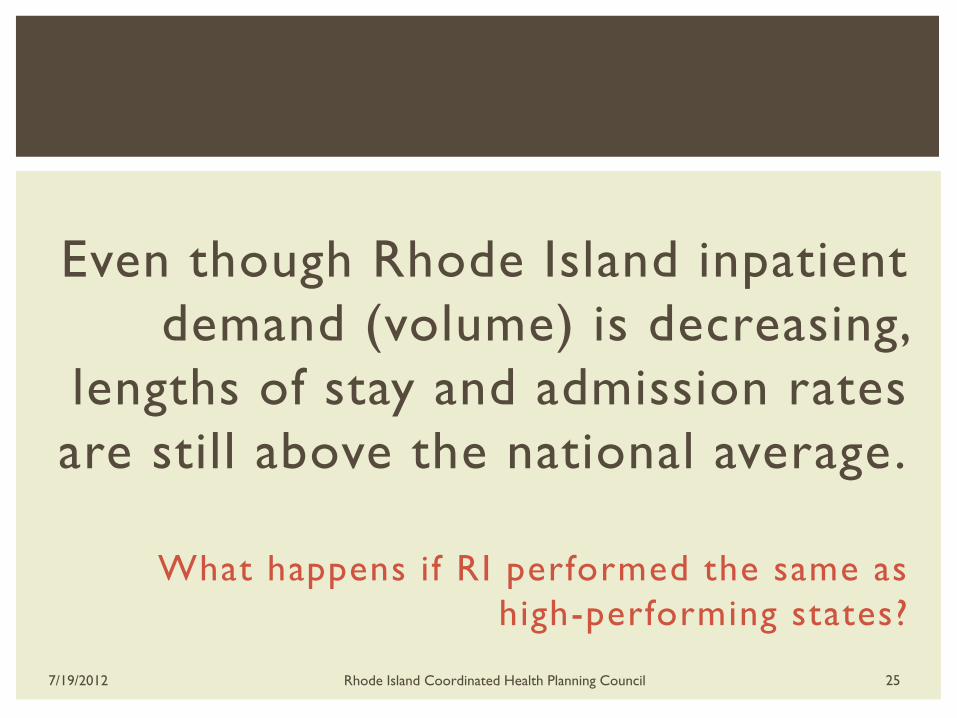
Even though Rhode Island inpatient
demand (volume) is decreasing,
lengths of stay and admission rates
are still above the national average.
What happens if RI performed the same as
high-performing states?
7/19/2012 Rhode Island Coordinated Health Planning Council 25
26
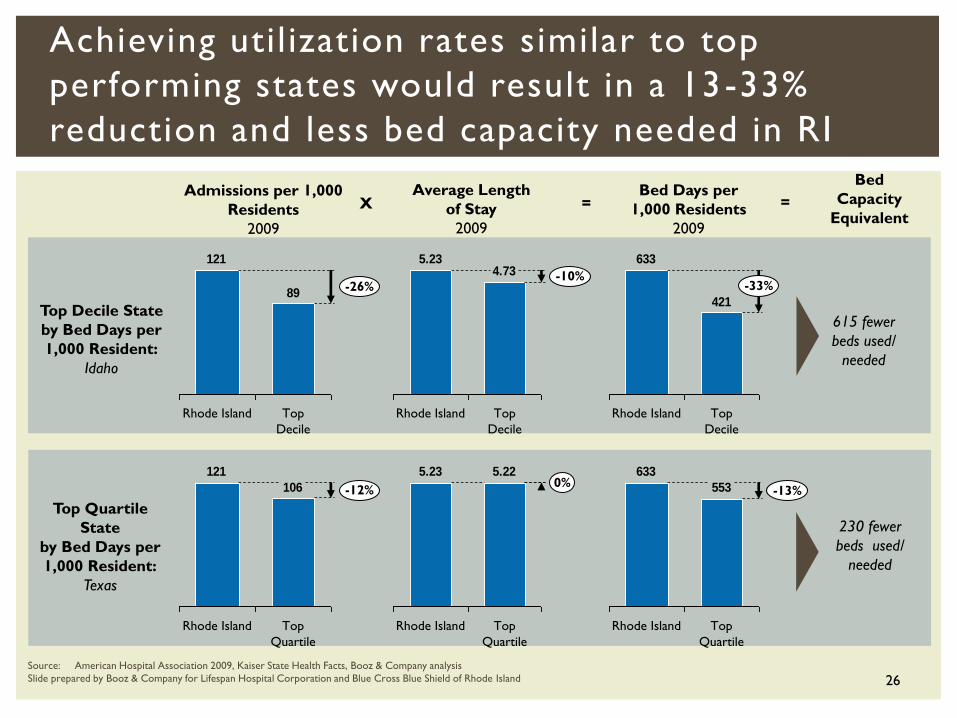
Achieving util ization rates similar to top
performing states would result in a 13-33%
reduction and less bed capacity needed in RI
89
121
-26%
Top
Decile
Rhode Island
106
121
Top
Quartile
-12%
Rhode Island
4.735.23
-10%
Top
Decile
Rhode Island
5.225.230%
Top
Quartile
Rhode Island
421
633
-33%
Top
Decile
Rhode Island
553
633
-13%
Rhode Island Top
Quartile
Top Decile State
by Bed Days per
1,000 Resident:
Idaho
Top Quartile
State
by Bed Days per
1,000 Resident:
Texas
Admissions per 1,000
Residents
2009
Average Length
of Stay
2009
Bed Days per
1,000 Residents
2009
X =
Source: American Hospital Association 2009, Kaiser State Health Facts, Booz & Company analysis
Slide prepared by Booz & Company for Lifespan Hospital Corporation and Blue Cross Blue Shield of Rhode Island
Bed
Capacity
Equivalent
=
615 fewer
beds used/
needed
230 fewer
beds used/
needed
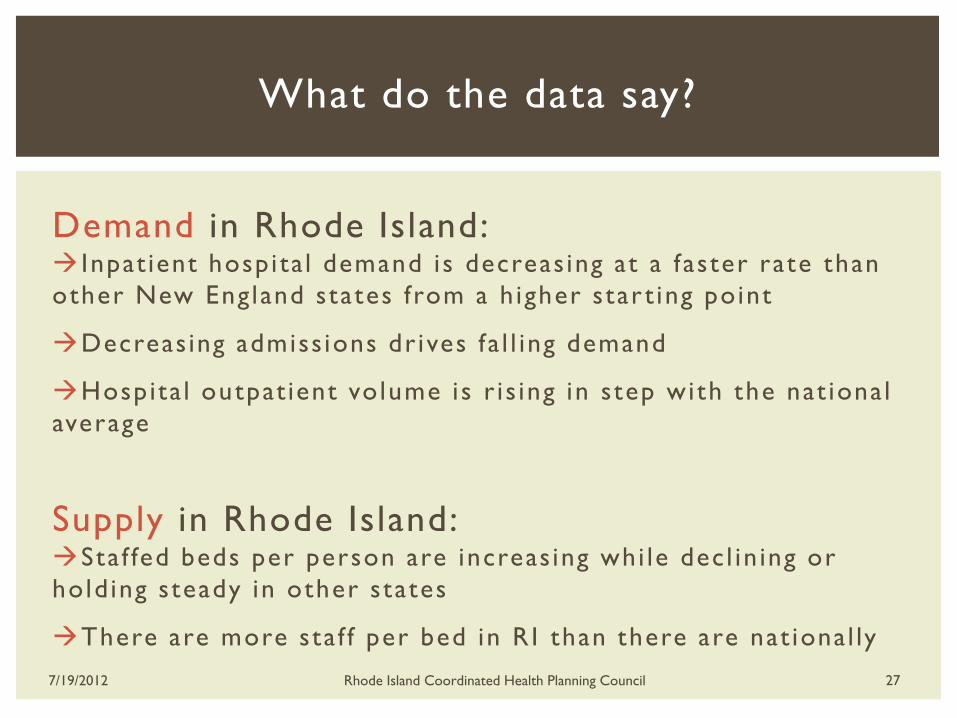
Demand in Rhode Island: Inpat ient hosp i ta l demand is decreas ing at a faster rate than
other New England states from a h igher star t ing point
Decreas ing admiss ions dr ives fa l l ing demand
Hospita l outpat ient volume is r i s ing in step with the nat ional
average
Supply in Rhode Island: Staf fed beds per person are increas ing whi le dec l in ing or
hold ing steady in other states
There are more sta f f per bed in RI than there are nat ional ly
What do the data say?
7/19/2012 Rhode Island Coordinated Health Planning Council 27
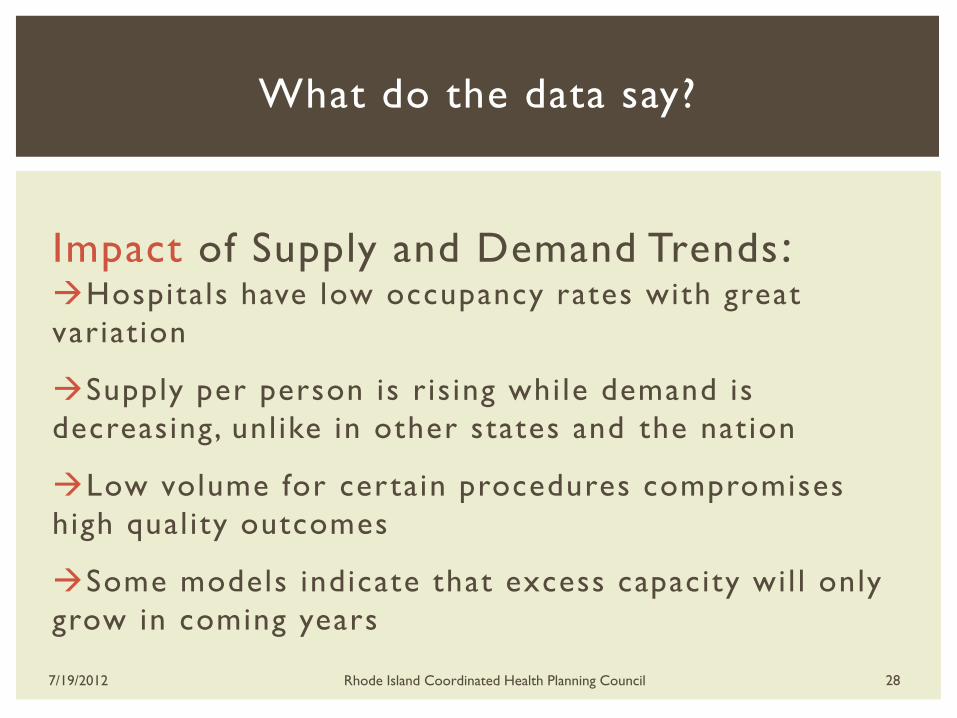
Impact of Supply and Demand Trends : Hospitals have low occupancy rates with great
variat ion
Supply per person is ris ing while demand is
decreasing, unl ike in other states and the nation
Low volume for certain procedures compromises
high qual ity outcomes
Some models indicate that excess capacity wil l only
grow in coming years
What do the data say?
7/19/2012 Rhode Island Coordinated Health Planning Council 28
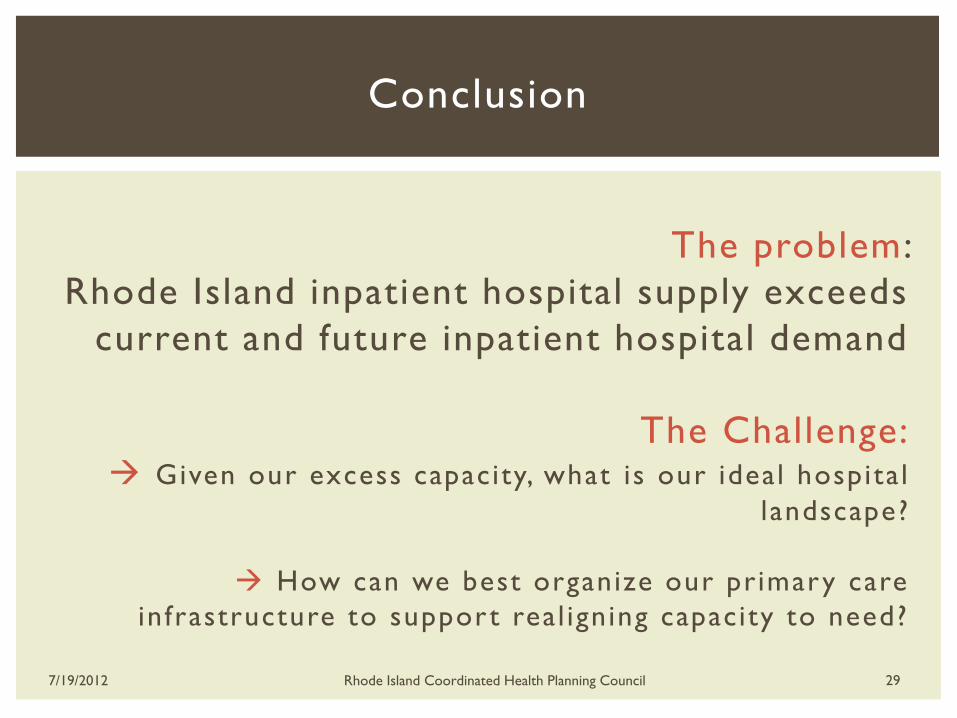
The problem:
Rhode Island inpatient hospital supply exceeds
current and future inpatient hospital demand
The Challenge: Given our excess capacity, what is our ideal hospita l
landscape?
How can we best organize our primary care
in frastructure to support real igning capacity to need?
Conclusion
7/19/2012 Rhode Island Coordinated Health Planning Council 29