rhythms of high-grade block in an ionic model of a strand of regionally ischemic ventricular muscle
TRANSCRIPT
ARTICLE IN PRESS
0022-5193/$ - se
doi:10.1016/j.jtb
�CorrespondE-mail addr
michael.guevara
Journal of Theoretical Biology 249 (2007) 29–45
www.elsevier.com/locate/yjtbi
Rhythms of high-grade block in an ionic model of a strand of regionallyischemic ventricular muscle
Alejandro Lopeza, Humberto Arcea, Michael R. Guevarab,�
aDepartamento de Fısica, Facultad de Ciencias, Universidad Nacional Autonoma de Mexico, Apartado Postal 70-542,
04510 Mexico, Distrito Federal, MexicobDepartment of Physiology and Centre for Nonlinear Dynamics in Physiology and Medicine, McGill University,
3655 Sir William Osler Promenade, Montreal, Quebec, Canada H3G 1Y6
Received 21 July 2006; received in revised form 11 June 2007; accepted 11 June 2007
Available online 21 June 2007
Abstract
Electrical alternans, a beat-to-beat alternation in the electrocardiogram or electrogram, is frequently seen during the first few minutes
of acute myocardial ischemia, and is often immediately followed by malignant cardiac arrhythmias such as ventricular tachycardia and
ventricular fibrillation. As ischemia progresses, higher-order periodic rhythms (e.g., period-4) can replace the period-2 alternans rhythm.
This is also seen in modelling work on a two-dimensional (2-D) sheet of regionally ischemic ventricular muscle. In addition, in the
experimental work, ventricular arrhythmias are overwhelmingly seen only after the higher-order rhythms arise. We investigate an ionic
model of a strand of ischemic ventricular muscle, constructed as a 3-cm-long 1-D cable with a centrally located 1-cm-long segment
exposed to an elevated extracellular potassium concentration ([K+]o). As [K+]o is raised in this ‘‘ischemic segment’’ to represent one
major effect of ongoing ischemia, the sequence of rhythms {1:1-2:2 (alternans)-2:1} is seen. With further increase in [K+]o, one sees
higher-order periodic 2N:M rhythms {2:1-4:2-4:1-6:2-6:1-8:2-8:1}. In a 2N:M cycle, only M of the 2N action potentials
generated at the proximal end of the cable successfully traverse the ischemic segment, with the remaining ones being blocked within the
ischemic segment. Finally, there is a transition to complete block {8:1-2:0-1:0} (in an n:0 rhythm, all action potentials die out within
the ischemic segment). Changing the length of the ischemic segment results in different rhythms and transitions being seen: e.g., when the
ischemic segment is 2 cm long, the period-6 rhythms are not seen; when it is 0.5 cm long, there is a 3:1 rhythm interposed between the 2:1
and 1:0 rhythms. We discuss the relevance of our results to the experimental observations on the higher-order rhythms that presage
reentrant ischemic ventricular arrhythmias.
r 2007 Elsevier Ltd. All rights reserved.
Keywords: Period multupling; Alternans; Bifurcations; Ventricular arrhythmias; Conduction block
1. Introduction
Reentrant arrhythmias such as ventricular tachycardiaand ventricular fibrillation often occur during myocardialischemia. It is often observed that the normal 1:1 activationsequence of the heart is disrupted before these arrhythmiasstart. There can be an alternans or 2:2 rhythm, in whichthere is a beat-to-beat alternation in some characteristic
e front matter r 2007 Elsevier Ltd. All rights reserved.
i.2007.06.015
ing author. Tel.: +1514 398 4320; fax: +1 514 398 7452.
esses: [email protected] (A. Lopez),
ias.unam.mx (H. Arce),
@mcgill.ca (M.R. Guevara).
feature of the recording, e.g., the T-wave in the electro-cardiogram or electrogram, the duration of the actionpotential in an intracellular recording. There can be 2:1block, in which every second action potential stopspropagating (‘‘blocks’’) somewhere within the ischemicarea. There are in fact dozens of experimental reportsshowing that these two period-2 rhythms exist seconds orminutes before malignant arrhythmias are initiated (e.g.,Scherlag et al., 1974; Downar et al., 1977; Russell et al.,1979; Cinca et al., 1980; Janse et al., 1980; Hashimotoet al., 1984; Carson et al., 1986; Dilly and Lab, 1988; Abeet al., 1989; Konta et al., 1990; Nearing et al., 1991;Tachibana et al., 1998; Nearing and Verrier, 2002, 2003).

ARTICLE IN PRESSA. Lopez et al. / Journal of Theoretical Biology 249 (2007) 29–4530
In contrast, with one exception, there have been only a fewscattered incidental reports of higher-order ‘‘period-mul-tupled’’ rhythms (e.g., period-3 and period-4 rhythms, inwhich it takes 3 or 4 beats for the rhythm to recur) in theacutely ischemic ventricle (Russell et al., 1979; Hashimotoet al., 1984; Dilly and Lab, 1988; Laguna et al., 1999; Wuand Zipes, 2001). In the only systematic experimental studyto date (Nearing and Verrier, 2002), these higher-orderrhythms always arose immediately out of a phase ofalternans rhythm as the ischemia progressed. Six of the 12dogs studied eventually went on to fibrillate, and higher-order rhythms were followed in five of these six dogs withina few tens of seconds by more complex rhythms andventricular fibrillation, with the remaining dog goingdirectly from high-amplitude alternans to fibrillation. Inthe six dogs that did not fibrillate, higher-order rhythmswere not seen; alternans was seen in four of these sixanimals, and in two of these four animals, the alternanswas at very low amplitude (see Figs. 2 and 3 of Nearing andVerrier, 2002).
The electrophysiological disturbances during ischemia arecaused by many factors (Wit and Janse, 1993; Carmeliet,1999). Perhaps chief among these is a rise in externalpotassium concentration ([K+]o). We have thus modelledthe regionally ischemic ventricle by increasing [K+]o within acircumscribed area (the ischemic zone) lying within theinterior of a 2-D sheet of ventricular muscle (Xu andGuevara, 1998; Arce et al., 2000). Reentrant arrhythmias ofthe spiral-wave type occur in this model in response toincremental pacing at a fixed elevated [K+]o (Xu andGuevara (1998); see also Bernus et al. (2005) for a morerecent 3-D simulation). When [K+]o is incrementally raised ata fixed pacing cycle length to simulate the natural progressionof events during acute ischemia, 1:1 rhythm is replaced in turnby 2:2 rhythm, 2:1 block, various higher-order rhythms (e.g.,4:1 block), and eventually complete block (Arce et al., 2000).We have also made a detailed modelling study of the mannerin which period-2 rhythms arise in the simpler case of a 1-Dstrand of ventricular muscle containing a central segmentwith elevated [K+]o (Arce et al., 2002). Since 4:1 block andother higher-order rhythms were seen in the earlier work onthe 2-D sheet (Arce et al., 2000), we decided to carry out amore systematic study of these higher-order rhythms of blockin the model of a 1-D strand of regionally ischemicventricular muscle.
2. Methods
We study an ionic model of a 1-D strand of normalventricular myocardium, with an area of elevated [K+]owithin its centre (the ‘‘ischemic segment’’) to represent theischemic zone (Tilg and Wach, 1995; Ferrero et al., 1997;Cimponeriu et al., 1998; Xu and Guevara, 1998; Feldmanet al., 1999; Arce et al., 2000, 2002; Wang and Rudy, 2000).We continue to use a simple ‘‘first-generation’’ model of theionic currents rather than one of the several more complex‘‘second-generation’’ models incorporating the Na+–K+
pump current and the Na+–Ca2+ exchange current thatare presently available, due to the fact that in their originalformulation, second-generation models have two attri-butes: (i) degeneracy, with non-uniqueness of equilibriasuch as steady states and limit cycles, and (ii) very slowlong-term drifts in the variables (further discussion of thesecomplicating factors can be found in Krogh-Madsen et al.(2005)). As in other recent studies, one can avoid both ofthese characteristics either by continuing to use anexplicitly first-generation model (ten Tusscher and Panfi-lov, 2003) or by using a second-generation model that isrendered essentially first-generation by keeping internalionic concentrations constant (Bernus et al., 2002). We takethe first of these approaches, selecting the Luo–Rudy (LR)model because it has [K+]o as a parameter, which isessential for our modelling of the ischemic segment (Luoand Rudy, 1991).One deficiency of the space-clamped LR model, which is
carried over from the Beeler–Reuter model from which it isderived (Beeler and Reuter, 1977), is that the time-constants for the activation and inactivation of the slowinward Ca2+ current (Isi) are both an order of magnitudetoo large with respect to the experimental values. We havethus decreased the time constant for the activation of Isi(td) by a factor of 10, which then puts td into thephysiologic range (Isenberg and Klockner, 1982; Xu andGuevara, 1998). As in our prior work on modellingalternans in ischemic muscle (Arce et al., 2000, 2002), weleave the inactivation time-constant of Isi (tf) unchanged,since reducing it results in the level of the plateau of theaction potential being too depressed. In addition, leaving tf
unchanged results in a long-lasting Isi waveform that is verysimilar to that seen in the action-potential-clamp currenttrace when Ca2+-entry is blocked in experiments onventricular cells (Linz and Meyer, 2000).We use the equations appearing in Table 1 and in the
body of the text of Luo and Rudy (1991). The ionicconcentrations given there are used to calculate the reversalpotentials ENa, EK, EKp, and EK1. Using the equations inTable 1 of Luo and Rudy (1991) results in current–voltagerelationships for IK1 and IK1(T) that are different fromthose shown in Figs. 2 and 3B, respectively, of that paper.Nevertheless, using those equations (i.e., with unmodified td),and starting from infinite-rest initial conditions at thenominal [K+]o of 5.4mM, we obtain an action potentialthat superimposes with that shown in Fig. 4A of Luo andRudy (1991). A full listing of the equations of our modifiedmodel is given in Supplementary Material I. In the steadystate, the action potential duration (measured between theupstroke and the crossing through of �60mV on therepolarizing limb of the action potential) is reduced to�237ms from �290ms in the standard LR space-clampedmodel when paced at a basic cycle length (BCL) of 400ms.We model a 1-D strand of muscle by the 1-D cable
equation
q2V=qx2 ¼ rSvðCmqV=qtþ I ionÞ, (1)

ARTICLE IN PRESSA. Lopez et al. / Journal of Theoretical Biology 249 (2007) 29–45 31
where V is the transmembrane potential (mV), x is thespatial coordinate in the strand (cm), r is the effectivelongitudinal resistivity (0.2 kO-cm), Sv is the surface-to-volume ratio (5000 cm�1), Cm is the specific membranecapacitance (1 mF cm�2), t is time (ms), and Iion is the totalionic current (mAcm�2) given by our modified LR model(Sharp and Joyner, 1980). We numerically integrate Eq. (1)using a central difference approximation for q2V/qx2 and aforward difference approximation for qV/qt
½Vi�1ðtÞ � 2ViðtÞ þ Viþ1ðtÞ�=Dx2
¼ rSv Cm½V iðtþ DtÞ � ViðtÞ�=Dtþ I ion;iðtÞ� �
, ð2Þ
where Vi is the voltage of the ith element in the cable,Iion,i is the ionic current in that element, Dx is the spatialstep-size (0.01 cm), and Dt is the temporal step-size(0.01ms). Each activation or inactivation variable xj iscalculated from
xjðtþ DtÞ ¼ xj1 � xj1 � xjðtÞ� �
e�Dt=tj , (3)
where xjN is the steady state or asymptotic value of xj andtj is the time constant of xj, both of which are functionsof V. A look-up table with linear interpolation (voltage-step ¼ 0.2mV) is used to calculate xjN and tj. The internalcalcium concentration [Ca2+]i is obtained from
½Ca2þ�iðtþ DtÞ ¼ ½Ca2þ�iðtÞ þ d½Ca2þ�iðtÞ=dt� �
Dt. (4)
The 1-D space-constant (l) is (Rm/rSv)1/2ffi0.06 cm, where
Rm is the specific membrane resistance (3.55 kO-cm2 at thenominal LR value of [K+]o of 5.4mM). The discretizationfactor (Dx/l) is thus �0.17, at which point the numericalerror is acceptable (see Fig. 1 of Arce et al., 2002). Thediffusion constant D ¼ 1/(rSvCm) ¼ 10�3 cm2ms�1, so thatthe von Neumann linear stability criterion ((Dx)2/Dt44D) issatisfied. Sealed-end (i.e., zero-current flux) Neumannboundary conditions (i.e., qV/qx ¼ 0) are set at both endsof the cable. Stimulation is carried out by injecting a 1msduration current pulse into the first five elements of thestrand at an amplitude of 100mAcm�2 (�2� threshold).
An implicit integration scheme (Crank–Nicholson) wasused to spot-check the results given below; the findingswere similar, but with a small shift in the exact value of[K+]o at which a particular rhythm is seen. The simulationsbelow were carried out using programs written in C (�16significant decimal places). Movies of propagation downthe cable (Supplementary Material III) were made bygenerating a GIF picture showing the voltage as a functionof position every 10ms and then assembling these picturefiles into QuickTime movie (.mov) files.
3. Results
As ischemia progresses, there is a gradual increase in[K+]o and in the size of the ischemic zone. We now explorethe effect of increasing [K+]o in the central part of thestrand (the ‘‘ischemic segment’’) at a fixed BCL of 400ms,but with the length of the ischemic segment kept fixed. We
choose this BCL since it is at the center of the 300–500msrange typically used in experimental work on ischemicarrhythmias (see Arce et al., 2000 for references). We firstexplore the case where the region of elevated [K+]ooccupies the central 1-cm portion of the strand, flankedon either side by a 1-cm segment of normal tissue (Arceet al., 2000, 2002). We then explore what happens when thelength of the ischemic segment is different from 1 cm.At the start of each simulation run at a new [K+]o, we
obtain approximate infinite-rest initial conditions bysetting the variables in the normal- and high-potassiumregions equal to their respective space-clamped steady-statevalues and then allowing the simulation to run for 1000msso as to allow some time for equilibration to occur, beforeinjecting the first stimulus at t ¼ 0ms. We inject at least 40stimuli to allow transients due to initial conditions todissipate. We now describe the sequence of rhythms seen as[K+]o is raised.
3.1. Period-1 rhythm
Fig. 1A shows the transmembrane potential (V) as afunction of time (t) at several points (x) along the 3-cm-long cable at [K+]o ¼ 5.4mM, i.e., in control conditionsbefore [K+]o is raised within the ischemic segment. In thesteady state there is a 1:1 rhythm, in which each stimulusproduces an action potential that travels down the cablewith an invariant morphology. A periodic N:M rhythmexists at a given point in the cable when for every N stimulithere are M action potentials seen at that point. The overallresponse of the cable is described as an N:M rhythm whenfor every N action potentials in the most proximal segmentthere are M action potentials in the most distal segment.Fig. 1B shows that the resting membrane potential (RMP)and Vmax (the maximum voltage achieved during onepacing cycle, which in this case corresponds to theovershoot potential of the action potential) do not changewith distance x, provided that one is far enough away fromthe ends of the cable to avoid edge-effects. Such edge-effects are expected over a distance on the order of a fewspace constants (l ¼ 0.6mm), and are in fact appreciableover a distance of �1.5mm, corresponding to 15 elementsof the discretized cable. Fig. 1C gives the classic ladderdiagram or laddergram, which plots the position of theupstroke of the action potential (arbitrarily defined here asthe crossing of �40mV) as a function of time, at asampling interval of 2ms. The reciprocal of the slope ofthis line is the conduction velocity, which is constant downthe cable at �60 cm s�1 (Arce et al., 2002).When [K+]o within the 1-cm-long ischemic segment is
raised, but to a level that is not too high, the 1:1 rhythmpersists. Fig. 1D–F shows that for [K+]o ¼ 13mM, as theaction potential propagates into the ischemic segment, theRMP depolarizes to about �65mV and Vmax falls, so thatthere is a large decrease in action potential amplitude(difference between Vmax and RMP). The action potentialduration (APD) also falls (Fig. 1D), there is a decrease in

ARTICLE IN PRESS
x (
cm
)m
Vx (
cm
)
x (
cm
)m
Vx (
cm
)
t (s) t (s)
x (cm)
t (s) t (s)
x (cm)
Vmax Vmax
RMP
RMP
1:1 1:1
Fig. 1. Period-1 rhythm: 1:1 rhythm. External potassium concentration ([K+]o) ¼ 5.4mM (A–C); 13.0mM (D–F). Length of ischemic segment ¼ 1 cm.
(A, C) Transmembrane potential as a function of time (t) at selected points spaced at a distance (x) of 0.3 cm on the cable. About 40 stimuli were injected
just before the start of these traces. (B, E) The maximum voltage of the action potential (Vmax) and the resting membrane potential (RMP) plotted as a
function of distance (x) down the cable. (C, F) Laddergram, showing position of action potential upstroke in the cable as a function of time. A data-point
is plotted every 2ms.
A. Lopez et al. / Journal of Theoretical Biology 249 (2007) 29–4532
the conduction velocity (Fig. 1F), and a two-componentupstroke appears (Fig. 1D, but seen much more clearly inFig. 2A of Arce et al., 2000). Similar results have been seenin experimental work (e.g., Scherlag et al., 1974; Downaret al., 1977; Russell et al., 1979; Cinca et al., 1980;Hashimoto et al., 1984; Carson et al., 1986; Abe et al.,1989; Koller et al., 2000; Wu and Zipes, 2001) and in earliermodelling work (Ferrero et al., 1997, 2003; Shaw andRudy, 1997; Arce et al., 2000). Note that while the actionpotential decrements in amplitude as it enters the ischemic
segment, it increments as it leaves (Fig. 1D and E). One canappreciate from the laddergram (Fig. 1F) that there is asignificant slowing of conduction within the ischemicsegment, both from the change in the slope of the lineand the denser packing of data-points within the ischemicsegment. Movies showing the action potential spreadingdown the strand for Fig. 1 and the other figures below areavailable as Supplementary Material III on the journalweb-site (and also at: http://www.medicine.mcgill.ca/physio/guevaralab/arce-III.htm).

ARTICLE IN PRESSA. Lopez et al. / Journal of Theoretical Biology 249 (2007) 29–45 33
3.2. Period-2 rhythms
As [K+]o is increased to just above �13.170mM, the 1:1rhythm is lost and is replaced with a 2:2 or alternansrhythm (Fig. 2A: [K+]o ¼ 13.173mM). The basic repeatingcycle of this rhythm consists of two different actionpotentials, both of which are full-sized provided that therecording site is far enough away from the distal part of theischemic segment (Fig. 2A). Fig. 2B gives Vmax for theodd- and even-numbered beats as a function of distance: asthe action potential enters the ischemic segment, everysecond action potential (even-numbered beats in Fig. 2A)
x (
cm
)m
Vx (
cm
)
t (s)
x (cm)
t (s)
[K+]°=13.173 mM
2:2
Fig. 2. Period-2 rhythms: Left column (A–C): 2:2 rhythm, [K+]o ¼ 13.173mM
Fig. 1, except that in (B) and (E), Vmax is plotted for more than one beat and
decrements to the point where it becomes very small inamplitude within the distal part of the ischemic segment(Fig. 2A). Note that while the even-numbered actionpotentials in Fig. 2A decrement sharply within the first halfof the ischemic segment, they attain a more-or-lessconstant Vmax within the distal portion of the ischemicsegment, before incrementing back up to full-sized actionpotentials as they leave the ischemic segment (beat 2 inFig. 2B). We have previously termed this propagatingresponse the ‘‘maintained small-amplitude response’’ (Arceet al., 2000, 2002). Since the maintained small-amplituderesponse travels more slowly than the full-sized action
x (
cm
)m
Vx (
cm
)
t (s)
t (s)
x (cm)
[K+]°=13.25 mM
2:1
; right column (D–F): 2:1 rhythm, [K+]o ¼ 13.25mM. Same format as
RMP is not plotted.
ARTICLE IN PRESSA. Lopez et al. / Journal of Theoretical Biology 249 (2007) 29–4534
potential, there is also a beat-to-beat alternation in theconduction time through the ischemic segment, which isjust barely discernible in the laddergram of Fig. 2C. Thesmaller APD and conduction velocity of the even-numbered beats are both presumably accounted for bythe fact that the diastolic interval or recovery timepreceding them is less than that preceding the odd-numbered beats (Fig. 2A).
With further increase in [K+]o to just beyond�13.219mM, the maintained small-amplitude response ofthe 2:2 rhythm (even-numbered beats in Fig. 2A–C) isreplaced by a decrementing response (even-numbered beats
t (s)
t (s)
x (
cm
)m
Vx (
cm
)
x (cm)
[K+]°=13.437 mM
4:2
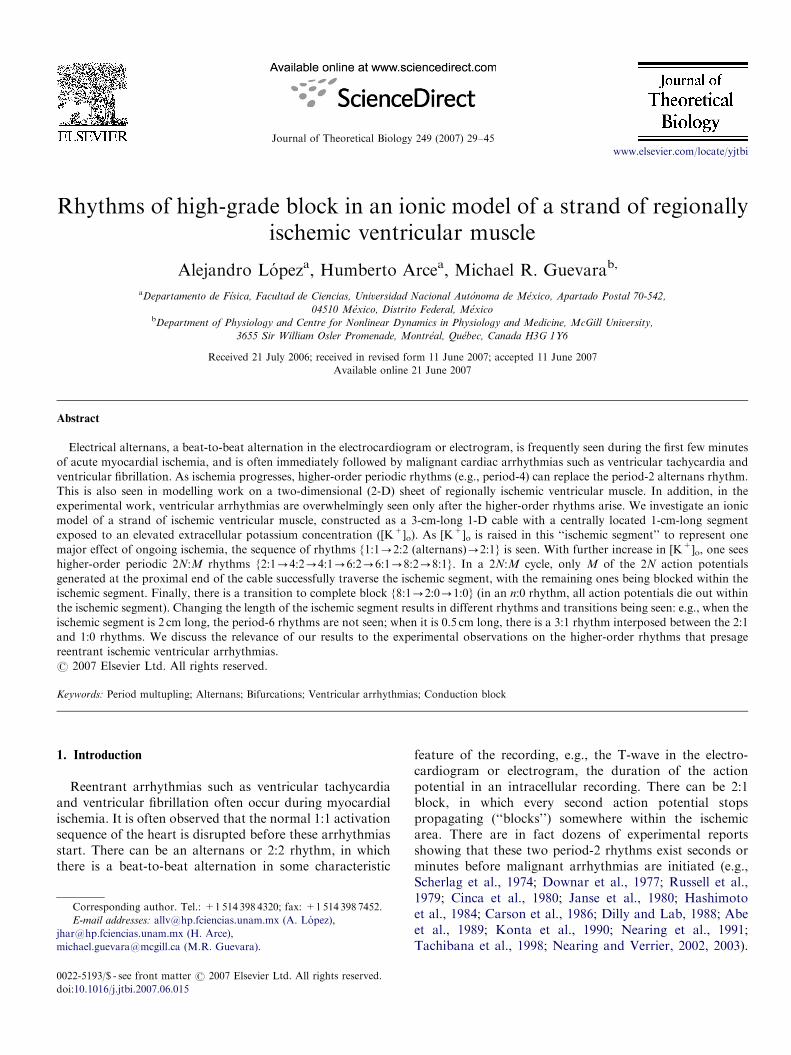
Fig. 3. Period-4 rhythms: Left column (A–C): 4:2 rhythm, [K+]o ¼ 13.437mM
Fig. 2.
in Fig. 2D–F: [K+]o ¼ 13.25mM) that eventually blockswithin the distal half of the ischemic segment. The 2:2rhythm is thus converted into a 2:1 rhythm, with therecovery time preceding the conducted beat being longerthan that preceding the blocked beat, the more so withincreasing penetration into the ischemic segment (Fig. 2D).
3.3. Higher-order rhythms
Still further increase in [K+]o eventually results in the2:1 rhythm converting into a 4:2 rhythm (Fig. 3A–C:[K+]o ¼ 13.437mM). A full-sized action potential (beat 1),
t (s)
t (s)
x (
cm
)m
Vx (
cm
)
x (cm)
[K+]°=13.442 mM
4:1
; right column (D–F): 4:1 rhythm, [K+]o ¼ 13.442mM. Same format as
ARTICLE IN PRESSA. Lopez et al. / Journal of Theoretical Biology 249 (2007) 29–45 35
which is the first conducted beat in Fig. 3A, is followed bya blocked beat (beat 2), which is in turn followed by amaintained small-amplitude response (beat 3) that is thesecond conducted beat of the cycle. This second conductedbeat is then followed by the second blocked beat of thecycle (beat 4), whereupon the period-4 cycle repeats. Notethat there is an alternation in the depth to which theischemic segment is penetrated by the two blocked beats(Fig. 3C), with the blocked beat (beat 4) that follows thesmall-amplitude response (beat 3) penetrating more deeplythan the blocked beat (beat 2) that follows the full-sizedaction potential (beat 1), presumably because the recovery
[K+]°=13.472 mM
x (
cm
)x (
cm
)m
V
t (s)
t (s)
x(cm)
6:2
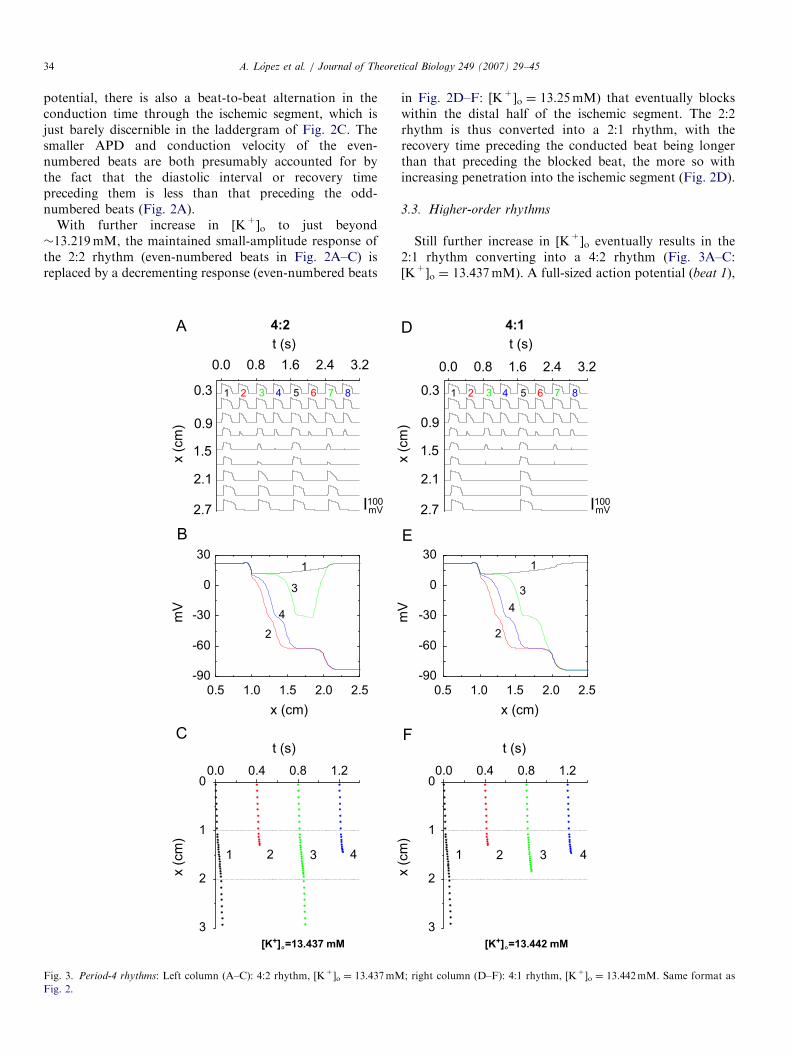
Fig. 4. Period-6 rhythms: Left column (A–C): 6:2 rhythm, [K+]o ¼ 13.472mM
Fig. 2.
time before beat 4 is longer than that preceding beat 2. As[K+]o is raised still further, beat 3 of this 4:2 rhythmincreasingly decrements, eventually blocking within theischemic segment, yielding a 4:1 rhythm (Figs. 3D–F:[K+]o ¼ 13.442mM).With still further increase in [K+]o, the above process is
repeated, resulting first in a 6:2 rhythm (Fig. 4A–C:[K+]o ¼ 13.472mM). The fifth beat in this rhythm(the maintained small-amplitude response) eventuallydies out with further increase in [K+]o (Fig. 4D–F:[K+]o ¼ 13.476mM), producing a 6:1 rhythm in the sameway that a 4:1 rhythm arose out of a 4:2 rhythm in Fig. 3.
[K+]°=13.476 mM
x (
cm
)x (
cm
)m
V
t (s)
t (s)
x(cm)
6:1
; right column (D–F): 6:1 rhythm, [K+]o ¼ 13.476mM. Same format as

ARTICLE IN PRESSA. Lopez et al. / Journal of Theoretical Biology 249 (2007) 29–4536
As [K+]o is raised further, there are then 8:2 (Fig. 5A–C:[K+]o ¼ 13.4855mM) and 8:1 (Fig. 5D–F: [K+]o ¼13.487mM) rhythms.
Each cycle of the 6:2 rhythm consists of alternating 4:1and 2:1 cycles (Fig. 4C), and not two different 3:1 cycles,as, e.g., one would expect if the 6:2 rhythm arose out of aperiod-doubling of a 3:1 rhythm. In the same way, an 8:2cycle is made up of alternating 6:1 and 2:1 cycles (Fig. 5C),and not two different 4:1 cycles, as one would expect froma period-doubling of a 4:1 rhythm. This is in contrast tothe 2:2 rhythm, each cycle of which is composed of twodifferent 1:1 cycles (Fig. 2A), and the 4:2 rhythm, eachcycle of which contains two different 2:1 cycles (Fig. 3A).
t (s)
t (s)
x (
cm
)x (
cm
)m
V
[K+]°=13.4855 mM
x (cm)
8:2
Fig. 5. Period-8 rhythms: Left column (A–C): 8:2 rhythm, [K+]o ¼ 13.4855mM
Fig. 2.
In these higher-order (i.e., N42) N:M rhythms, there is abeat-to-beat alternation in the depth of penetration of theischemic segment by the blocked beats.
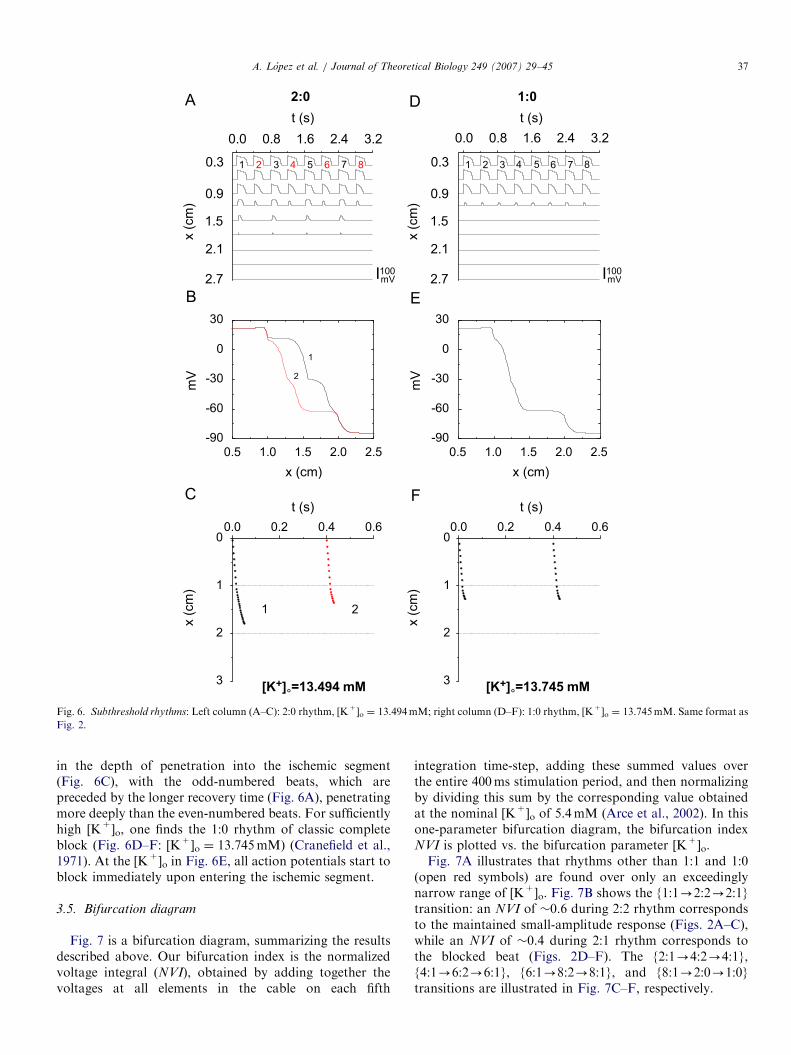
3.4. Subthreshold rhythms
Beyond the 8:1 rhythm, one encounters n:0 rhythmsof complete block, in which no action potentials survive tothe distal end of the cable, so that the rhythm sufficientlydistal in the cable is entirely subthreshold. A 2:0 rhythmis first seen, with both action potentials of the cycle dyingout within the ischemic segment (Fig. 6A–C: [K+]o ¼13.494mM). There is again a beat-to-beat alternation
t (s)
t (s)
x (
cm
)x (
cm
)m
V
[K+]°=13.487 mM
x (cm)
8:1
; right column (D–F): 8:1 rhythm, [K+]o ¼ 13.487mM. Same format as
ARTICLE IN PRESS
Fig. 6. Subthreshold rhythms: Left column (A–C): 2:0 rhythm, [K+]o ¼ 13.494mM; right column (D–F): 1:0 rhythm, [K+]o ¼ 13.745mM. Same format as
Fig. 2.
A. Lopez et al. / Journal of Theoretical Biology 249 (2007) 29–45 37
in the depth of penetration into the ischemic segment(Fig. 6C), with the odd-numbered beats, which arepreceded by the longer recovery time (Fig. 6A), penetratingmore deeply than the even-numbered beats. For sufficientlyhigh [K+]o, one finds the 1:0 rhythm of classic completeblock (Fig. 6D–F: [K+]o ¼ 13.745mM) (Cranefield et al.,1971). At the [K+]o in Fig. 6E, all action potentials start toblock immediately upon entering the ischemic segment.
3.5. Bifurcation diagram
Fig. 7 is a bifurcation diagram, summarizing the resultsdescribed above. Our bifurcation index is the normalizedvoltage integral (NVI), obtained by adding together thevoltages at all elements in the cable on each fifth
integration time-step, adding these summed values overthe entire 400ms stimulation period, and then normalizingby dividing this sum by the corresponding value obtainedat the nominal [K+]o of 5.4mM (Arce et al., 2002). In thisone-parameter bifurcation diagram, the bifurcation indexNVI is plotted vs. the bifurcation parameter [K+]o.Fig. 7A illustrates that rhythms other than 1:1 and 1:0
(open red symbols) are found over only an exceedinglynarrow range of [K+]o. Fig. 7B shows the {1:1-2:2-2:1}transition: an NVI of �0.6 during 2:2 rhythm correspondsto the maintained small-amplitude response (Figs. 2A–C),while an NVI of �0.4 during 2:1 rhythm corresponds tothe blocked beat (Figs. 2D–F). The {2:1-4:2-4:1},{4:1-6:2-6:1}, {6:1-8:2-8:1}, and {8:1-2:0-1:0}transitions are illustrated in Fig. 7C–F, respectively.

ARTICLE IN PRESS
Fig. 7. Bifurcation diagram: The normalized voltage integral (NVI) is plotted as a function of [K+]o: (A) overall bifurcation diagram. Closed black circles
indicate period-1 rhythms; open red circles indicate non-period-1 rhythms; (B) {1:1-2:2-2:1} transitions; (C) {2:1-4:2-4:1} transitions; (D) {4:1-6:2-6:1} transitions; (E) {6:1-8:2-8:1} transitions; and (F) {8:1-2:0-1:0} transitions. The dashed line in (E) and (F) indicates two lines that
superimpose on the scale of this diagram. To avoid excessive crowding of symbols, not all points computed are plotted. The computed [K+]o ranges are
(mM): 1.0�13.170 (1:1); 13.171–13.219 (2:2); 13.220–13.434 (2:1); 13.436–13.439 (4:2); 13.440–13.471 (4:1); 13.4715–13.473 (6:2); 13.474–13.485 (6:1);
13.48525–13.48575 (8:2); 13.486–13.4911 (8:1); 13.4912–13.524 (2:0); 13.528–19.0 (1:0).
A. Lopez et al. / Journal of Theoretical Biology 249 (2007) 29–4538
3.6. Other lengths of the ischemic segment
During ongoing ischemia, not only does [K+]o graduallyincrease, but the physical size of the ischemic zonegradually grows. We have thus carried out additionalsimulations in which [K+]o is increased in a cable with acentral ischemic segment that has a length (L) differentfrom the nominal value of 1 cm used above, maintainingthe lengths of both adjacent normal segments at 1 cm. Thetwo-parameter ([K+]o, L) bifurcation diagram of Fig. 8summarizes our results. We have not explored all values of
L in this diagram with increments in [K+]o as fine as thoseused in constructing Fig. 7 (L ¼ 1 cm). Nevertheless, onecan already see that the sequence of rhythms encounteredas [K+]o is increased is not the same at all L.As L is reduced below 1 cm (e.g., L ¼ 0.5 cm), elevation
of [K+]o eventually results in a 3:1 rhythm (very small areaat lower-right in Fig. 8), which we do not encounterat L ¼ 1 cm. Fig. 9 shows examples of the 2:1 ([K+]o ¼13.571mM) and 3:1 ([K+]o ¼ 13.574mM) rhythms en-countered at L ¼ 0.5 cm. During the 2:1 rhythm, theblocked beat is preceded by a much shorter recovery time

ARTICLE IN PRESS
Fig. 8. Global bifurcation diagram: Rhythm seen at a particular combina-
tion of external potassium concentration ([K+]o) and length of the
ischemic segment (L). Exploration is first made on a coarse grid (step-size
for [K+]o is 0.05mM; step-size for L is 0.2 cm, starting at L ¼ 0.2 cm).
Finer steps are then used to explore the boundaries between different
zones. Other rhythms (e.g. 6:2, 6:1, 8:2, 8:1, 5:2, 4:0) are found in the
stippled area. The asterisk at the top of the 4:1 zone indicates a very small
8:2 zone.
A. Lopez et al. / Journal of Theoretical Biology 249 (2007) 29–45 39
than the conducted beat (Fig. 9A), as it is in the L ¼ 1 cmcable (Fig. 2D). During the 3:1 rhythm the blocked beatthat penetrates the ischemic segment more deeply (beat 3) ispreceded by a recovery time that is considerably longerthan that preceding the other blocked beat (beat 2), whichdoes not penetrate as deeply. But while the recovery timepreceding the conducted beat (beat 1, or equivalentlybeat 4) is longer than that preceding the first blocked beat(beat 2), it is shorter than that preceding the secondblocked beat (beat 3), demonstrating that the simpleconcept of recovery time is not enough to explain thedynamics here. (A similar consideration applies when oneexamines the two conducted beats of the 4:2 rhythm inFig. 3A, where, in the more proximal elements of the cable,the full-sized action potential (beat 1) is preceded by arecovery time that is slightly shorter than that precedingthe maintained small-amplitude response (beat 3).) Thetransition from 2:1 to 3:1 rhythm at L ¼ 0.5 cm is not
direct, since, e.g., a 5:2 rhythm can be found at anintermediate value of [K+]o (13.572mM).While it cannot be appreciated on the scale of Fig. 8, for
L sufficiently larger than 1 cm (e.g., L ¼ 2.0 cm), the 6:2and 6:1 rhythms encountered at L ¼ 1 cm (Fig. 4) are nolonger seen, and there is instead a direct transition froma 4:1 rhythm (similar to that shown in Fig. 3) at [K+]o ¼13.4558mM to an 8:2 rhythm at [K+]o ¼ 13.4560mM(asterisk at the top of the 4:1 zone in Fig. 8). This 8:2rhythm consists of two different 4:1 cycles that alternate,with the conducted beat being a full-sized action potentialin one 4:1 cycle, and a maintained subthreshold response inthe other 4:1 cycle. This 8:2 rhythm is thus very differentfrom the 8:2 rhythm seen at L ¼ 1 cm (Fig. 5A–C), inwhich there is an alternation between 2:1 and 6:1 cycles.Should the transition here from 4:1 to 8:2 rhythm be asupercritical period-doubling bifurcation, the transitionwould be direct, with no intervening rhythms (e.g., period-6)being necessary (it is impossible to rule out the presence ofperiod-6 rhythms using numerical integration runs; how-ever, in the absence of bistability, any such rhythms wouldhave to exist over a range of [K+]o of less than0.0002mM). At L ¼ 2.0 cm, further increase in [K+]o leadsto a reversion from the 8:2 rhythm back to a 4:1 rhythm inwhich the conducted action potential is a maintainedsubthreshold response. (See Supplementary Material IIIfor movies of these two different 4:1 rhythms and the 8:2rhythm.) At the highest values of [K+]o at L ¼ 2 cm, onesees 4:0, 2:0, and 1:0 rhythms. More careful exploration ofFig. 8 is needed to work out definitively the bifurcationsequences, which have been explored very minutely onlyfor L ¼ 1 cm (Fig. 7).
4. Discussion
4.1. Period-2 rhythms in the ischemic ventricle
Alternans is commonly seen during acute myocardialischemia and often presages the imminent onset of malig-nant phase-1A reentrant ventricular arrhythmias in experi-mental work (see references in Introduction; see Narayan(2006) for clinical applications). Our simulations reveal twomechanisms underlying alternans. In the first scenario,there is a 2:2 rhythm within a circumscribed region, with a2:1 rhythm being present nowhere else (Fig. 2A–C):‘‘primary’’ alternans (Guevara, 1988). Unfortunately, inexperimental work one cannot prove the existence ofprimary alternans, given that it is impossible with present-day recording techniques to rule out the presence of somesmall—perhaps only intramural—area of 2:1 block. In thesecond scenario (Fig. 2D), there are coexisting areas of 2:2and 2:1 rhythm, as is found in the ischemic ventricle(Downar et al., 1977; Hashimoto et al., 1984; Carsonet al., 1986; Abe et al., 1989). This ‘‘secondary’’ alternans(Fig. 2D–F) has also been seen in a false tendon with acentral segment exposed to high [K+]o (Cranefield et al.,1971), as well as in modelling of an inhomogeneous

ARTICLE IN PRESS
Fig. 9. Period-3 rhythm: Length of ischemic segment: 0.5 cm. Left column (A–C): 2:1 rhythm, [K+]o ¼ 13.571mM; right column (D–F): 3:1 rhythm,
[K+]o ¼ 13.574mM. Same format as Fig. 2, but traces in (A) and (D) taken at x ¼ 0.3, 0.6, 0.9, 1.1, 1.25, 1.4, 1.6, 1.9 and 2.2 cm.
A. Lopez et al. / Journal of Theoretical Biology 249 (2007) 29–4540
Purkinje fibre cable (Guevara, 1988). In our simulations(Fig. 7B and C), primary alternans occurs over a muchnarrower range of [K+]o than secondary alternans (seeSection 1 of Supplementary Material II for furtherdiscussion of this point).
One often sees a gradual increase in the magnitude ofalternans (‘‘crescendo alternans,’’ Dilly and Lab, 1988) inthe extracellular recording (Downar et al., 1977; Russellet al., 1979; Abe et al., 1989; Nearing et al., 1991; Nearingand Verrier, 2002) that often heralds the onset ofventricular fibrillation (see, e.g., Fig. 3A(C) in Nearingand Verrier, 2002). This increase is likely due to aprogressive extension in the size of the areas of 2:2 rhythm
and 2:1 block, with a progressive conversion of areasinitially showing 2:2 rhythm into areas showing 2:1 block(Fig. 3 of Downar et al., 1977; Fig. 1 of Russell et al., 1979;Fig. 12 of Hashimoto et al., 1984).
4.2. Higher-order rhythms arise out of alternans and presage
tachyarrhythmias
As ischemia progresses, the simultaneous gradual rise in[K+]o and gradual expansion of the ischemic area (Coronelet al., 1988) would correspond to movement along a pathupwards and to the right in Fig. 8. Our computationsthus predict that immediately after alternans occurs, but
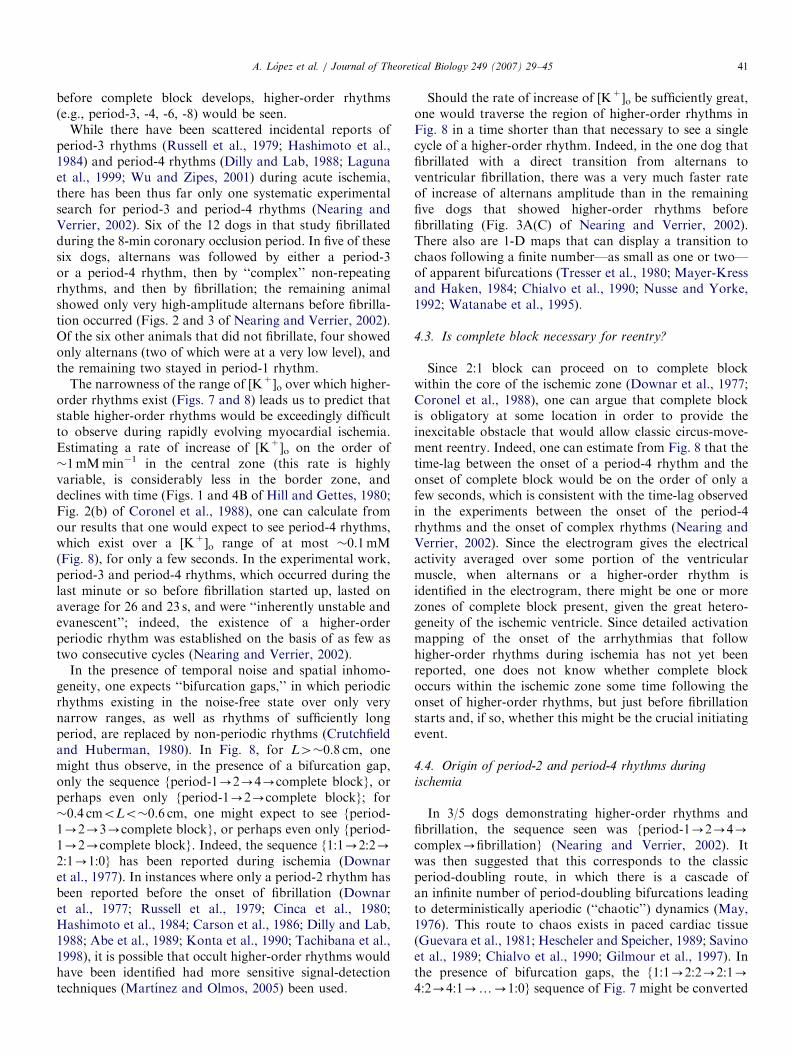
ARTICLE IN PRESSA. Lopez et al. / Journal of Theoretical Biology 249 (2007) 29–45 41
before complete block develops, higher-order rhythms(e.g., period-3, -4, -6, -8) would be seen.
While there have been scattered incidental reports ofperiod-3 rhythms (Russell et al., 1979; Hashimoto et al.,1984) and period-4 rhythms (Dilly and Lab, 1988; Lagunaet al., 1999; Wu and Zipes, 2001) during acute ischemia,there has been thus far only one systematic experimentalsearch for period-3 and period-4 rhythms (Nearing andVerrier, 2002). Six of the 12 dogs in that study fibrillatedduring the 8-min coronary occlusion period. In five of thesesix dogs, alternans was followed by either a period-3or a period-4 rhythm, then by ‘‘complex’’ non-repeatingrhythms, and then by fibrillation; the remaining animalshowed only very high-amplitude alternans before fibrilla-tion occurred (Figs. 2 and 3 of Nearing and Verrier, 2002).Of the six other animals that did not fibrillate, four showedonly alternans (two of which were at a very low level), andthe remaining two stayed in period-1 rhythm.
The narrowness of the range of [K+]o over which higher-order rhythms exist (Figs. 7 and 8) leads us to predict thatstable higher-order rhythms would be exceedingly difficultto observe during rapidly evolving myocardial ischemia.Estimating a rate of increase of [K+]o on the order of�1mMmin�1 in the central zone (this rate is highlyvariable, is considerably less in the border zone, anddeclines with time (Figs. 1 and 4B of Hill and Gettes, 1980;Fig. 2(b) of Coronel et al., 1988), one can calculate fromour results that one would expect to see period-4 rhythms,which exist over a [K+]o range of at most �0.1mM(Fig. 8), for only a few seconds. In the experimental work,period-3 and period-4 rhythms, which occurred during thelast minute or so before fibrillation started up, lasted onaverage for 26 and 23 s, and were ‘‘inherently unstable andevanescent’’; indeed, the existence of a higher-orderperiodic rhythm was established on the basis of as few astwo consecutive cycles (Nearing and Verrier, 2002).
In the presence of temporal noise and spatial inhomo-geneity, one expects ‘‘bifurcation gaps,’’ in which periodicrhythms existing in the noise-free state over only verynarrow ranges, as well as rhythms of sufficiently longperiod, are replaced by non-periodic rhythms (Crutchfieldand Huberman, 1980). In Fig. 8, for L4�0.8 cm, onemight thus observe, in the presence of a bifurcation gap,only the sequence {period-1-2-4-complete block}, orperhaps even only {period-1-2-complete block}; for�0.4 cmoLo�0.6 cm, one might expect to see {period-1-2-3-complete block}, or perhaps even only {period-1-2-complete block}. Indeed, the sequence {1:1-2:2-2:1-1:0} has been reported during ischemia (Downaret al., 1977). In instances where only a period-2 rhythm hasbeen reported before the onset of fibrillation (Downaret al., 1977; Russell et al., 1979; Cinca et al., 1980;Hashimoto et al., 1984; Carson et al., 1986; Dilly and Lab,1988; Abe et al., 1989; Konta et al., 1990; Tachibana et al.,1998), it is possible that occult higher-order rhythms wouldhave been identified had more sensitive signal-detectiontechniques (Martınez and Olmos, 2005) been used.
Should the rate of increase of [K+]o be sufficiently great,one would traverse the region of higher-order rhythms inFig. 8 in a time shorter than that necessary to see a singlecycle of a higher-order rhythm. Indeed, in the one dog thatfibrillated with a direct transition from alternans toventricular fibrillation, there was a very much faster rateof increase of alternans amplitude than in the remainingfive dogs that showed higher-order rhythms beforefibrillating (Fig. 3A(C) of Nearing and Verrier, 2002).There also are 1-D maps that can display a transition tochaos following a finite number—as small as one or two—of apparent bifurcations (Tresser et al., 1980; Mayer-Kressand Haken, 1984; Chialvo et al., 1990; Nusse and Yorke,1992; Watanabe et al., 1995).
4.3. Is complete block necessary for reentry?
Since 2:1 block can proceed on to complete blockwithin the core of the ischemic zone (Downar et al., 1977;Coronel et al., 1988), one can argue that complete blockis obligatory at some location in order to provide theinexcitable obstacle that would allow classic circus-move-ment reentry. Indeed, one can estimate from Fig. 8 that thetime-lag between the onset of a period-4 rhythm and theonset of complete block would be on the order of only afew seconds, which is consistent with the time-lag observedin the experiments between the onset of the period-4rhythms and the onset of complex rhythms (Nearing andVerrier, 2002). Since the electrogram gives the electricalactivity averaged over some portion of the ventricularmuscle, when alternans or a higher-order rhythm isidentified in the electrogram, there might be one or morezones of complete block present, given the great hetero-geneity of the ischemic ventricle. Since detailed activationmapping of the onset of the arrhythmias that followhigher-order rhythms during ischemia has not yet beenreported, one does not know whether complete blockoccurs within the ischemic zone some time following theonset of higher-order rhythms, but just before fibrillationstarts and, if so, whether this might be the crucial initiatingevent.
4.4. Origin of period-2 and period-4 rhythms during
ischemia
In 3/5 dogs demonstrating higher-order rhythms andfibrillation, the sequence seen was {period-1-2-4-complex-fibrillation} (Nearing and Verrier, 2002). Itwas then suggested that this corresponds to the classicperiod-doubling route, in which there is a cascade ofan infinite number of period-doubling bifurcations leadingto deterministically aperiodic (‘‘chaotic’’) dynamics (May,1976). This route to chaos exists in paced cardiac tissue(Guevara et al., 1981; Hescheler and Speicher, 1989; Savinoet al., 1989; Chialvo et al., 1990; Gilmour et al., 1997). Inthe presence of bifurcation gaps, the {1:1-2:2-2:1-4:2-4:1-y-1:0} sequence of Fig. 7 might be converted

ARTICLE IN PRESSA. Lopez et al. / Journal of Theoretical Biology 249 (2007) 29–4542
into the sequence {period-1-2-4-complete block}—rhythms of period higher than 4 were not searched for inNearing and Verrier (2002). The voltage traces in Figs. 2and 3 are suggestive of period-doubling bifurcations inthe {1:1-2:2} and {2:1-4:2} transitions. We have beenunable to establish this, with the ticklish numerical resultsleading to an effectively discontinuous 1-D map in theformer case (Arce et al., 2002). The {2:2-2:1} and {4:2-4:1} transitions are reminiscent of changes in firing number(Othmer and Xie, 1999).
The sequence {1:1-2:2-2:1-4:2-chaos} has beendescribed in paced tissue (Chialvo et al., 1990) and in ionicmodels (Lewis and Guevara, 1990; Vinet et al., 1990).While it is possible that period-8 and even higher-orderperiod-doubled rhythms were not found due to a bifurca-tion gap, discontinuous 1-D maps can display chaoticdynamics following as few as two period-doubling bifurca-tions (Lewis and Guevara, 1990).
Yet another explanation for the {period-1-2-4-y}sequence would be a {1:1-2:1} transition (Yehia et al.,1999), followed by a {2:1-4:1} transition. Coexisting areasof period-2 and period-4 rhythms (Nearing and Verrier,2002) as well as 2:1 and 4:1 block (but not 3:1 block) (Wuand Zipes, 2001) have been reported during ischemia.
For further discussion about chaos, see Section 4 ofSupplementary Material II.
4.5. Origin of period-3 rhythms during ischemia
In 2/6 dogs, the sequence seen was {period-1-2-3-complex-fibrillation} (Nearing and Verrier, 2002). Thefact that these period-3 rhythms occurred later (by �23 s)than the period-4 rhythms seen in three other dogs wastaken as being consistent with the classic period-doublingroute, where the period-3 orbit occurs later that the period-doubled and period-quadrupled orbits (May, 1976). But inboth cases of period-3 rhythm, the preceding period-2rhythm lasted for quite a long time, and so one might haveexpected to have seen other higher-order periodic andchaotic rhythms for a rather long time after the period-2rhythm ceased, but before the period-3 rhythm appeared(see, e.g., Fig. 4 of May, 1976). Instead, the period-3rhythm arose directly out of a long-lasting period-2 rhythm(Nearing and Verrier, 2002).
A second scenario here is an effectively direct {2:1-3:1}or {2:2-3:2} transition. The 2:1 and 3:1 zones lie veryclose to one another in Fig. 8, so that in the presence of abifurcation gap one would have a {2:1-3:1} transition.This transition to a period-3 rhythm takes place at a higherlevel of [K+]o than does the transition to period-4 rhythm,which might account for the later appearance of theformer rhythm in the experiments. Ischemic alternanscan be accompanied by ‘‘varying degrees of conductionblocks with either 2:1, 3:1, or more irregular patterns ofendocardial–epicardial conduction block’’ (Russell et al.,1979), and there can be the co-existence of period-2 and
period-3 rhythms at different locations (Hashimoto et al.,1984).A third scenario here is the sequence {1:1-2:2-2:1-
4:2-chaos-3:1-6:2-y}. In one case, the ranges of theperiod-doubled (2:2, 4:2, 6:2) and chaotic rhythms were sonarrow that, in the presence of even a very smallbifurcation gap, one would expect to see the reducedsequence {period-1-2-3} (see Fig. 5(a) of Lewis andGuevara, 1990).A fourth scenario occurs in piecewise-smooth systems,
where a period-2 orbit can make a direct transition to aperiod-3 orbit via a border-collision bifurcation (Nusse andYorke, 1992).For further discussion about the bifurcations underlying
period-2 and higher-order rhythms, see Section 3 of Supple-mentary Material II.
4.6. Subthreshold rhythms
The 1:0 rhythm of Fig. 6D–F (classic complete block)has been reported in the ischemic ventricle (Downar et al.,1977; Cinca et al., 1980; Coronel et al., 1988, 1989). The fallin action potential amplitude with distance (Fig. 6E) occursin false tendons in which the middle segment is exposed tohigh [K+]o (Cranefield et al., 1971). The subthreshold 2:0rhythm (Fig. 6A–C) has been described in the ischemicventricle (Cinca et al., 1980), in the space-clamped squidgiant axon (Kaplan et al., 1996), the space-clampedFitzHugh–Nagumo equations (Rajasekar and Lakshma-nan, 1988; Kaplan et al., 1996), and in homogeneous 1-DFitzHugh–Nagumo (Horikawa, 1994) and Hodgkin–Huxley(Horikawa, 1998) cables of reduced excitability.The transition from 1:0 to 2:0 rhythm (Fig. 6) appears to
be due to a period-doubling bifurcation. While there can bea cascade of these period-doubling bifurcations thatculminates in subthreshold chaotic dynamics (Rajasekarand Lakshmanan, 1988; Horikawa, 1994, 1998; Kaplanet al., 1996), we have not encountered this in our simu-lations at L ¼ 1 cm, changing [K+]o in steps of 0.0001mM.We see three possible explanations for this absence. First,higher-order period-doubled subthreshold rhythms andsubthreshold chaotic rhythms might exist over an exqui-sitely narrow range of [K+]o. Second, higher-order periodicand aperiodic subthreshold rhythms simply might not exist:the forward period-doubling cascade might be incompleteand be terminated by a partial reverse cascade of period-halving bifurcations (Horikawa, 1998). Third, if bistabilityis present, these rhythms would not have been encounteredif our computations did not start out from within theirbasins of attraction.
4.7. Atrioventricular block
Our model of regional ischemia can also be taken as acrude model of the atrioventricular node, with theproximal normal segment representing the right atrium,the ischemic segment representing the atrioventricular

ARTICLE IN PRESSA. Lopez et al. / Journal of Theoretical Biology 249 (2007) 29–45 43
(AV) node, and the distal normal segment representing theHis bundle. There are many correspondences of our resultswith experimental and clinical findings during AV block. Itis known that 3:1 AV block is rare: ‘‘In experiment, 4:1block is much more frequent than 3:1 block’’ (Lewis, 1920)(cf. our Fig. 8). In Figs. 2–5, 2N:2 rhythms are seen, inwhich there is an alternation of the conduction time, in theabsence of longitudinal dissociation (‘‘dual pathways’’)(Pick et al., 1962; Watanabe and Dreifus, 1972). Directtransitions between 2:1 and 4:1, 4:1 and 6:1, and 6:1 and 8:1AV block have been documented (Castellanos et al., 1998;see also Fig. 252 of Lewis, 1920). In paced strips of fetalsheep epicardial muscle, a sequence of period-4, -6, and -8rhythms uncannily similar to those seen in our cable wasdescribed (Watanabe et al., 1995). Direct transitionsbetween 4:1 and 8:1 AV block can occur (Castellanoset al., 2005). There are multiple levels of concealment ofblocked responses (Watanabe and Dreifus, 1972), as inFigs. 3–5. Finally, in the proximal elements of the cable inFig. 3A, there is behavior reminiscent of supernormal AVconduction (Pick et al., 1962).
4.8. Limitations of the model
The ventricles are 3-D and we use a 1-D structure, sothat effects due to, e.g., anisotropy and transmural fibreaxis rotation, cannot occur. Large-scale gradients (e.g.,apex-to-base and endocardial-to-epicardial gradients inAPD), as well as inhomogeneities on a smaller scale, arenot included. While we represent the effects of ischemia bychanging [K+]o, it is well-known that other factors, such ashypoxia, acidosis, and Ca2+-cycling play a considerablerole. We have set a sharp demarcation between the normalzone and the ischemic zone, but there is in fact a gradedborder zone. Our model is a guinea-pig model, and sincemost experiments on ischemia have been done in largeranimals (typically dogs and pigs), species differences mayplay a confounding role.
4.9. Future work
Recording of the transmembrane potential from manysites, e.g., with the optical-dye technique (Wu and Zipes,2001; Lakireddy et al., 2005) will help in elucidating thenature of any causal relationship between higher-orderrhythms and the induction of reentrant rhythms and also indiscriminating amongst the various rhythms that can allgive rise to a period-n rhythm on the electrogram (e.g., 3:2Wenckebach and 3:1 block both result in a period-3rhythm). Further modelling work should remove some ofthe limitations of the present model mentioned immedi-ately above. In particular, since Ca2+-cycling can theore-tically generate higher-order rhythms (Qu et al., 2007), itwill be interesting to see how any such rhythms intrinsicallygenerated in an ionic model of space-clamped membranemight interact with the rhythms of higher-order blockdescribed above. However, it might take some time to work
out the teething problems in the rather complicatedsecond-generation models that allow Ca2+-cycling (see,e.g., Cherry and Fenton, 2007). The modelling work shouldbe expanded to consider the later stages of ischemia (e.g.,phase 1b), when cellular uncoupling occurs (Pollard et al.,2002). The close temporal association of discordantalternans, higher-order rhythms, and spiral-wave reentry(Nearing and Verrier, 2002; Bernus et al., 2005) cries outfor further investigation (see also Section 2 of Supplemen-tary Material II). The 1-D map analysis accounting forthe {1:1-2:2-2:1} sequence (Arce et al., 2002) should beextended to higher-order transitions. Finally, will it bepossible to make connections between higher-orderrhythms, discordant alternans, and the induction ofreentry—presumably spiral-wave in origin—using a low-dimensional analysis?
Acknowledgements
Supported by grants to HA from PAPIIT-UNAM(Grant no. IN109307), and to MRG from the CanadianInstitutes of Health Research (MOP-43846). We thankEnrique Palacios Boneta for help in programming andDr. Max Lab for pointing out to us the existence of aperiod-4 rhythm in one of his papers. This work forms theM.Sc. thesis of one of the authors (AL).
Appendix. Supplementary materials
The online version of this article contains three sets ofadditional material: a listing of the modified Luo–Rudymodel (Supplementary Material I), some additional dis-cussion (Supplementary Material II), and movies corre-sponding to Figs. 1–6 and 9, as well as three other movies(Supplementary Material III). Please visit doi:10.1016/j.jtbi.2007.06.015.
References
Abe, S., Nagamoto, Y., Fukuchi, Y., Hayakawa, T., Kuroiwa, A., 1989.
Relationship of alternans of monophasic action potential and
conduction delay inside the ischemic border zone to serious ventricular
arrhythmia during acute myocardial ischemia in dogs. Am. Heart
J. 117, 1223–1233.
Arce, H., Xu, A., Gonzalez, H., Guevara, M.R., 2000. Alternans and
higher-order rhythms in an ionic model of a sheet of ischemic
ventricular muscle. Chaos 10, 411–426.
Arce, H., Lopez, A., Guevara, M.R., 2002. Triggered alternans in an ionic
model of ischemic cardiac ventricular muscle. Chaos 12, 807–818.
Beeler, G.W., Reuter, H., 1977. Reconstruction of the action potential of
ventricular myocardial fibres. J. Physiol. (London) 268, 177–210.
Bernus, O., Wilders, R., Zemlin, C.W., Verschelde, H., Panfilov, A.V.,
2002. A computationally efficient electrophysiological model of human
ventricular cells. Am. J. Physiol. Heart Circ. Physiol. 282,
H2296–H2308.
Bernus, O., Zemlin, C.W., Zaritsky, R.M., Mironov, S.F., Pertsov, A.M.,
2005. Alternating conduction in the ischaemic border zone as
precursor of reentrant arrhythmias: a simulation study. Europace 7,
S93–S104.

ARTICLE IN PRESSA. Lopez et al. / Journal of Theoretical Biology 249 (2007) 29–4544
Carmeliet, E., 1999. Cardiac ionic currents and acute ischemia: from
channels to arrhythmias. Physiol. Rev. 79, 917–1017.
Carson, D.L., Cardinal, R., Savard, P., Vermeulen, M., 1986. Character-
isation of unipolar waveform alternation in acutely ischaemic porcine
myocardium. Cardiovasc. Res. 20, 521–527.
Castellanos, A., Moleiro, F., Pastor, J.A., Interian Jr., A., Myerburg, R.J.,
1998. Reverse alternating Wenckebach periods and other modes of
regression of X8:1 to 2:1 atrioventricular block. Am. J. Cardiol. 82,
528–531.
Castellanos, A., Diaz, J., Interian Jr., A., Myerburg, R.J., 2005.
Wenckebach’s periods or alternating Wenckebach’s periods during
4:1 atrioventricular block? J. Electrocardiol. 38, 157–159.
Cherry, E.M., Fenton, F.H., 2007. A tale of two dogs: analyzing two
models of canine ventricular electrophysiology. Am. J. Physiol. Heart
Circ. Physiol. 292, H43–H55.
Chialvo, D.R., Gilmour Jr., R.F., Jalife, J., 1990. Low dimensional chaos
in cardiac tissue. Nature 343, 653–657.
Cimponeriu, A., Starmer, C.F., Bezerianos, A., 1998. Action potential
propagation in ischemic cardiac tissue: a theoretical computer
modeling. Computers in Cardiology 1998. IEEE Computer Society,
New York, NY, pp. 317–320.
Cinca, J., Janse, M.J., Morena, H., Candell, J., Valle, V., Durrer, D., 1980.
Mechanism and time course of the early electrical changes during acute
coronary artery occlusion. Chest 77, 499–505.
Coronel, R., Fiolet, J.W.T., Wilms-Schopman, F.J.G., Schaapherder,
A.F.M., Johnson, T.A., Gettes, L.S., Janse, M.J., 1988. Distribution of
extracellular potassium and its relation to electrophysiologic changes
during acute myocardial ischemia in the isolated perfused porcine
heart. Circulation 77, 1125–1138.
Coronel, R., Fiolet, J.W.T., Wilms-Schopman, F.J.G., Opthof, T.,
Schaapherder, A.F.M., Janse, M.J., 1989. Distribution of extracellular
potassium and electrophysiologic changes during two-stage coronary
ligation in the isolated, perfused canine heart. Circulation 80, 165–177.
Cranefield, P.F., Klein, H.O., Hoffman, B.F., 1971. Conduction of the
cardiac impulse. I. Delay, block, and one-way block in depressed
Purkinje fibers. Circ. Res. 28, 199–219.
Crutchfield, J.P., Huberman, B.A., 1980. Fluctuations and the onset of
chaos. Phys. Lett. A 77, 407–410.
Dilly, S.G., Lab, M.J., 1988. Electrophysiological alternans and restitution
during acute regional ischaemia in myocardium of anaesthetized pig.
J. Physiol. (London) 402, 315–333.
Downar, E., Janse, M.J., Durrer, D., 1977. The effect of acute coronary
artery occlusion on subepicardial transmembrane potentials in the
intact porcine heart. Circulation 56, 217–224.
Feldman, A.B., Esperer, H.D., Cohen, R.J., 1999. A mechanism
controlling the characteristics of T-wave alternans measurements in
the setting of myocardial ischemia. Computers in Cardiology 1999.
IEEE Computer Society, Piscataway, NJ, pp. 149–152.
Ferrero Jr., J.M., Torres, V., Saiz, J., Monserrat, M., Ferrero, J.M.,
Thakor, N.V., 1997. Simulation study of action potentials during acute
myocardial ischemia. Computers in Cardiology 1997. IEEE Computer
Society, New York, NY, pp. 705–708.
Ferrero Jr., J.M., Trenor, B., Rodrıguez, B., Saiz, J., 2003. Electrical
activity and reentry during acute regional myocardial ischemia:
insights from simulations. Int. J. Bifurc. Chaos 13, 3703–3715.
Gilmour Jr., R.F., Otani, N.F., Watanabe, M.A., 1997. Memory and
complex dynamics in cardiac Purkinje fibers. Am. J. Physiol. Heart
Circ. Physiol. 272, H1826–H1832.
Guevara, M.R., 1988. Spatiotemporal patterns of block in an ionic model
of cardiac Purkinje fibre. In: Markus, M., Muller, S.C., Nicolis, G.
(Eds.), From Chemical to Biological Organization. Springer, Berlin,
pp. 273–281.
Guevara, M.R., Glass, L., Shrier, A., 1981. Phase locking, period-
doubling bifurcations, and irregular dynamics in periodically stimu-
lated cardiac cells. Science 214, 1350–1353.
Hashimoto, H., Asano, M., Nakashima, M., 1984. Potentiating effects of
a ventricular premature beat on the alternation of the ST-T complex of
epicardial electrograms and the incidence of ventricular arrhythmias
during acute coronary occlusion in dogs. J. Electrocardiol. 17,
289–301.
Hescheler, J., Speicher, R., 1989. Regular and chaotic behaviour of
cardiac cells stimulated at frequencies between 2 and 20Hz. Eur.
Biophys. J. 17, 273–280.
Hill, J.L., Gettes, L.S., 1980. Effect of acute coronary artery occlusion on
local myocardial extracellular K+ activity in swine. Circulation 61,
768–778.
Horikawa, Y., 1994. Period-doubling bifurcations and chaos in the
decremental propagation of a spike train in excitable media. Phys.
Rev. E 50, 1708–1710.
Horikawa, Y., 1998. Bifurcations in the decremental propagation of a
spike train in the Hodgkin–Huxley model of low excitability. Biol.
Cybern. 79, 251–261.
Isenberg, G., Klockner, U., 1982. Calcium currents of isolated bovine
ventricular myocytes are fast and of large amplitude. Pflug. Arch.-Eur.
J. Physiol. 395, 30–41.
Janse, M.J., van Capelle, F.J.L., Morsink, H., Kleber, A.G., Wilms-
Schopman, F., Cardinal, R., Naumann D’Alnoncourt, C., Durrer, D.,
1980. Flow of ‘‘injury’’ current and patterns of excitation during early
ventricular arrhythmias in acute regional myocardial ischemia in
isolated porcine and canine hearts. Evidence for two different
arrhythmogenic mechanisms. Circ. Res. 47, 151–165.
Kaplan, D.T., Clay, J.R., Manning, T., Glass, L., Guevara, M.R., Shrier,
A., 1996. Subthreshold dynamics in periodically stimulated squid giant
axons. Phys. Rev. Lett. 76, 4074–4077.
Koller, M.L., Riccio, M.L., Gilmour Jr., R.F., 2000. Effects of [K+]o on
electrical restitution and activation dynamics during ventricular
fibrillation. Am. J. Physiol. Heart Circ. Physiol. 279, H2665–H2672.
Konta, T., Ikeda, K., Yamaki, M., Nakamura, K., Honma, K., Kubota,
I., Yasui, S., 1990. Significance of discordant ST alternans in
ventricular fibrillation. Circulation 82, 2185–2189.
Krogh-Madsen, T., Schaffer, P., Skriver, A.D., Taylor, L.K., Pelzmann,
B., Koidl, B., Guevara, M.R., 2005. An ionic model for rhythmic
activity in small clusters of embryonic chick ventricular cells. Am.
J. Physiol. Heart Circ. Physiol. 289, H398–H413.
Laguna, P., Moody, G.B., Garcia, J., Goldberger, A.L., Mark, R.G.,
1999. Analysis of the ST-T complex of the electrocardiogram using the
Karhunen–Loeve transform: adaptive monitoring and alternans
detection. Med. Biol. Eng. Comput. 37, 175–189.
Lakireddy, V., Baweja, P., Syed, A., Bub, G., Boutjdir, M., El-Sherif, N.,
2005. Contrasting effects of ischemia on the kinetics of membrane
voltage and intracellular calcium transient underlie electrical alternans.
Am. J. Physiol. Heart Circ. Physiol. 288, H400–H407.
Lewis, T., 1920. The Mechanism and Graphic Registration of the Heart
Beat. Shaw & Sons, London.
Lewis, T.J., Guevara, M.R., 1990. Chaotic dynamics in an ionic model of
the propagated cardiac action potential. J. Theor. Biol. 146, 407–432.
Linz, K.W., Meyer, R., 2000. Profile and kinetics of L-type calcium
current during the cardiac ventricular action potential compared in
guinea-pigs, rats and rabbits. Pflug. Arch.-Eur. J. Physiol. 439,
588–599.
Luo, C.-H., Rudy, Y., 1991. A model of the ventricular cardiac action
potential. Depolarization, repolarization, and their interaction. Circ.
Res. 68, 1501–1526.
Martınez, J.P., Olmos, S., 2005. Methodological principles of T wave
alternans analysis: a unified framework. IEEE Trans. Biomed. Eng. 52,
599–613.
May, R.M., 1976. Simple mathematical models with very complicated
dynamics. Nature 261, 459–467.
Mayer-Kress, G., Haken, H., 1984. Attractors of convex maps with
positive Schwarzian derivative in the presence of noise. Physica D 10,
329–339.
Narayan, S.M., 2006. T-wave alternans and the susceptibility to
ventricular arrhythmias. J. Am. Coll. Cardiol. 47, 269–281.
Nearing, B.D., Verrier, R.L., 2002. Progressive increases in complexity of
T-wave oscillations herald ischemia-induced ventricular fibrillation.
Circ. Res. 91, 727–732.

ARTICLE IN PRESSA. Lopez et al. / Journal of Theoretical Biology 249 (2007) 29–45 45
Nearing, B.D., Verrier, R.L., 2003. Tracking cardiac electrical instability
by computing interlead heterogeneity of T-wave morphology. J. Appl.
Physiol. 95, 2265–2272.
Nearing, B.D., Huang, A.H., Verrier, R.L., 1991. Dynamic tracking of
cardiac vulnerability by complex demodulation of the T wave. Science
252, 437–440.
Nusse, H.E., Yorke, J.A., 1992. Border-collision bifurcations including
‘‘period two to period three’’ for piecewise smooth systems. Physica D
57, 39–57.
Othmer, H.G., Xie, M., 1999. Subharmonic resonance and chaos in forced
excitable systems. J. Math. Biol. 39, 139–171.
Pick, A., Langendorf, R., Katz, L.N., 1962. The supernormal phase of
atrioventricular conduction. I. Fundamental mechanisms. Circulation
26, 388–404.
Pollard, A.E., Cascio, W.E., Fast, V.G., Knisley, S.B., 2002. Modulation
of triggered activity by uncoupling in the ischemic border: a model
study with phase 1b-like conditions. Cardiovasc. Res. 56, 381–392.
Qu, Z., Shiferaw, Y., Weiss, J.N., 2007. Nonlinear dynamics of cardiac
excitation–contraction coupling: an iterated map study. Phys. Rev. E
75, 011927.
Rajasekar, S., Lakshmanan, M., 1988. Period doubling route to chaos for
a BVP oscillator with periodic external force. J. Theor. Biol. 133,
473–477.
Russell, D.C., Smith, H.J., Oliver, M.F., 1979. Transmembrane potential
changes and ventricular fibrillation during repetitive myocardial
ischaemia in the dog. Br. Heart J. 42, 88–96.
Savino, G.V., Romanelli, L., Gonzalez, D.L., Piro, O., Valentinuzzi,
M.E., 1989. Evidence for chaotic behavior in driven ventricles.
Biophys. J. 56, 273–280.
Scherlag, B.J., El-Sherif, N., Hope, R., Lazzara, R., 1974. Characteriza-
tion and localization of ventricular arrhythmias resulting from
myocardial ischemia and infarction. Circ. Res. 35, 372–383.
Sharp, G.H., Joyner, R.W., 1980. Simulated propagation of cardiac action
potentials. Biophys. J. 31, 403–423.
Shaw, R.M., Rudy, Y., 1997. Electrophysiologic effects of acute
myocardial ischemia. A mechanistic investigation of action potential
conduction and conduction failure. Circ. Res. 80, 124–138.
Tachibana, H., Kubota, I., Yamaki, M., Watanabe, T., Tomoike, H.,
1998. Discordant S-T alternans contributes to formation of reentry: a
possible mechanism of reperfusion arrhythmia. Am. J. Physiol. Heart
Circ. Physiol. 275, H116–H121.
ten Tusscher, K.H.W.J., Panfilov, A.V., 2003. Reentry in heterogeneous
cardiac tissue described by the Luo–Rudy ventricular action potential
model. Am. J. Physiol. Heart Circ. Physiol. 284, H542–H548.
Tilg, B., Wach, P., 1995. Simulation of the 1-D cardiac excitation process
by varying extracellular potassium concentration and intracellular
resistivity. Computers in Cardiology 1995. IEEE Computer Society,
New York, NY, pp. 421–424.
Tresser, C., Coullet, P., Arneodo, A., 1980. On the existence of hysteresis
in a transition to chaos after a single bifurcation. J. Phys. Lett. (Paris)
41, L243–L246.
Vinet, A., Chialvo, D.R., Michaels, D.C., Jalife, J., 1990. Nonlinear
dynamics of rate-dependent activation in models of single cardiac cells.
Circ. Res. 67, 1510–1524.
Wang, Y., Rudy, Y., 2000. Action potential propagation in inhomoge-
neous cardiac tissue: safety factor considerations and ionic mechanism.
Am. J. Physiol. Heart Circ. Physiol. 278, H1019–H1029.
Watanabe, Y., Dreifus, L.S., 1972. Levels of concealment in second degree
and advanced second degree A-V block. Am. Heart J. 84, 330–347.
Watanabe, M., Otani, N.F., Gilmour Jr., R.F., 1995. Biphasic restitution
of action potential duration and complex dynamics in ventricular
myocardium. Circ. Res. 76, 915–921.
Wit, A.L., Janse, M.J., 1993. The Ventricular Arrhythmias of Ischemia
and Infarction. Electrophysiological Mechanisms. Futura, Mount
Kisco.
Wu, J., Zipes, D.P., 2001. Transmural reentry during acute global
ischemia and reperfusion in canine ventricular muscle. Am. J. Physiol.
Heart Circ. Physiol. 280, H2717–H2725.
Xu, A., Guevara, M.R., 1998. Two forms of spiral-wave reentry in an
ionic model of ischemic ventricular myocardium. Chaos 8, 157–174.
Yehia, A.R., Jeandupeux, D., Alonso, F., Guevara, M.R., 1999.
Hysteresis and bistability in the direct transition from 1:1 to 2:1
rhythm in periodically driven single ventricular cells. Chaos 9,
916–931.