rice energy may 2015 company presentation
TRANSCRIPT
First Quarter 2015 Supplemental SlidesMay 7, 2015
2 www.riceenergy.com
Concentrated, Core AssetsCORE ASSETS
Monroe
Harrison
Greene
WashingtonBelmont
Fayette
Monongalia
Utica Core
Marcellus Core
COMPANY TOTAL
OHIO
PENNSYLVANIA
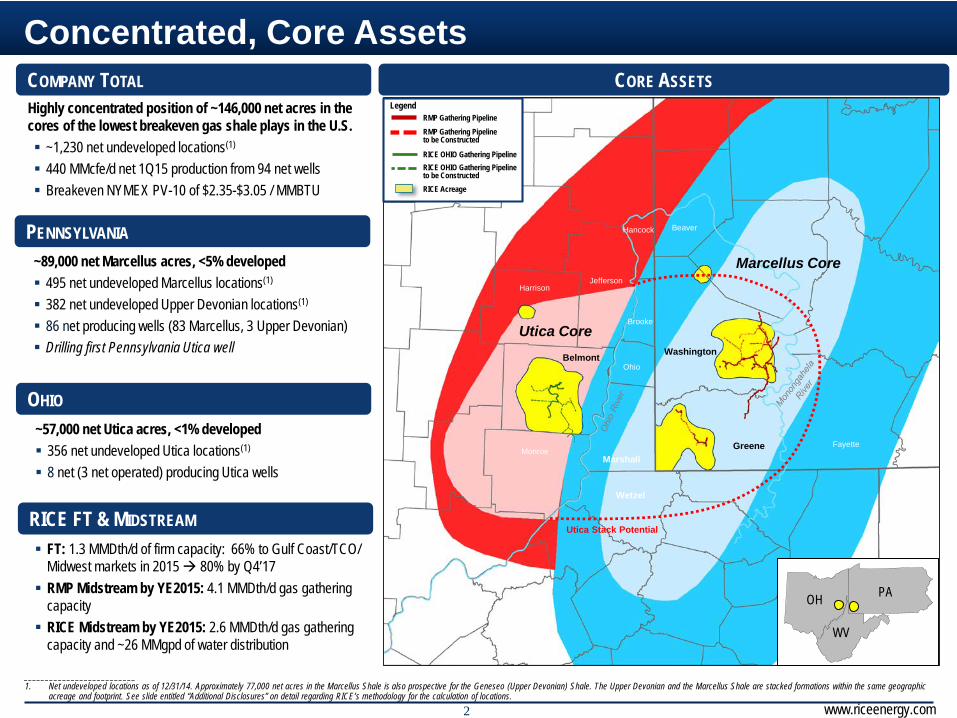
Highly concentrated position of ~146,000 net acres in the cores of the lowest breakeven gas shale plays in the U.S. ~1,230 net undeveloped locations(1)
440 MMcfe/d net 1Q15 production from 94 net wells Breakeven NYMEX PV-10 of $2.35-$3.05 / MMBTU
~57,000 net Utica acres, <1% developed 356 net undeveloped Utica locations(1)
8 net (3 net operated) producing Utica wells
RICE FT & MIDSTREAM
~89,000 net Marcellus acres, <5% developed 495 net undeveloped Marcellus locations(1)
382 net undeveloped Upper Devonian locations(1)
86 net producing wells (83 Marcellus, 3 Upper Devonian) Drilling first Pennsylvania Utica well
FT: 1.3 MMDth/d of firm capacity: 66% to Gulf Coast/TCO/ Midwest markets in 2015 80% by Q4’17 RMP Midstream by YE2015: 4.1 MMDth/d gas gathering
capacity RICE Midstream by YE2015: 2.6 MMDth/d gas gathering
capacity and ~26 MMgpd of water distribution
RMP Gathering PipelineRMP Gathering Pipeline to be Constructed
RICE OHIO Gathering PipelineRICE OHIO Gathering Pipeline to be ConstructedRICE Acreage
Legend
Marshall
Wetzel
Fayette
Ohio
Brooke
BeaverHancock
JeffersonHarrison
Monroe
Utica Stack Potential
__________________________1. Net undeveloped locations as of 12/31/14. Approximately 77,000 net acres in the Marcellus Shale is also prospective for the Geneseo (Upper Devonian) Shale. The Upper Devonian and the Marcellus Shale are stacked formations within the same geographic
acreage and footprint. See slide entitled “Additional Disclosures” on detail regarding RICE’s methodology for the calculation of locations.
OH PA
WV

3 www.riceenergy.com
100% of 2015 production covered by FT/FS & 66% receives non-Appalachia pricing
Diverse exposure includes Gulf Coast, Midwest and Canadian mkt. pricing 51% of 1Q15 production delivered to premium, non-Appalachian markets
– Increases to ~80% by year end 2015
Turned eight Pennsylvania Marcellus wells to sales– Average lateral length of 6,225 ft. & 60-day average rate of 13 MMcf/d
Initiated production from two Ohio Utica wells– Average lateral length of 8,879 ft. & 60-day average rate of 15 MMcf/d
1Q15 net production of 440 MMcfe/d, 11% above 4Q14
$1.2B pro forma liquidity (excl. CFFO) more than funds 2015 capex (1)
Systematic hedging program supports cash flows– ~75% 1Q15 production hedged and $0.70/Mcf hedging price uplift
<10% of ‘15 production unhedged and exposed to M2 & Dominion South Low risk growth profile and strong hedging & FT protect balance sheet
557 MDth/d of 1Q15 RMP PA throughput– 123% Y/Y increase & 8% above 4Q14
111 MDth/d of OH retained midstream throughput– 50% above 4Q14
668 MDth/d total throughput with 17% third party volumes
Execution is DrivingIndustry–Leading Growth
Well Protected Growth &Financial Flexibility
Diverse FT Portfolio Enhances Realized Pricing
Creating Value ThroughMidstream Development
First Quarter 2015 Highlights
__________________________1. Pro forma for April $650MM borrowing base re-determination and excludes RMP liquidity. CFFO = Cash Flow From Operations.

4 www.riceenergy.com
1Q15 net production of 440 MMcfe/d; 11% increase above 4Q14 51% of 1Q15 production sold to premium, non-Appalachian mkts. Adjusted EBITDAX of $84MM Completed successful $400MM bond offering at 7.25% due 2023 Increased borrowing base ~20% to $650MM in April
First Quarter 2015 Financial Summary
Financial SummarySolid first quarter results supported by well capitalized balance sheet and ample liquidity
Operating Statistics
Capitalization at 3/31/2015($ in millions) 3/31/2015
CashRice Energy 339$ Rice Midstream Holdings 1 Rice Midstream Partners 9
Total consolidated cash 349$
Long-term debtRice Energy
E&P credit facility -$ 6.25% Senior notes due 2022 900 7.25% Senior notes due 2023 397
Total Rice Energy debt 1,297 Rice Midstream Holdings revolver 17 Rice Midstream Partners revolver -
Total consolidated debt 1,314$ Net debt 965
Shareholders equity 1,996$ Total capitalization 3,310$ Total net capitalization 2,961
1Q 2015Actual
Total production (MMcfe/d) 440 % Gas 99%% Operated 92%% Marcellus 85%
NYMEX Henry Hub price ($/MMBtu) 2.87$ Average basis impact ($/MMBtu) (0.47) Firm transportation fuel & variables ($/MMBtu) (0.09) Btu uplift (MMBtu/Mcf) 0.11
Pre-hedge realized price ($/Mcf) 2.42 Realized hedging gain ($/Mcf) 0.70
Post-hedge realized price ($/Mcf) 3.12 Net firm transportation sales 0.08
Adjusted realized price ($/Mcf) 3.20$
Average costs per Mcfe: Actual ($MM) $ / McfeE&P Revenue (including net FT sales) 100$ 2.52$
Hedging gain 27 0.69 Lease operating 12 0.29 Gathering, compression and transportation 14 0.36 Production taxes and impact fees 1 0.04 General and administrative 17 0.44 Depletion, depreciation and amortization 63 1.58
Adjusted EBITDAX 84$ 2.12$

5 www.riceenergy.com
$536
$283 $450
$339
$875
$284
$459
–
$200
$400
$600
$800
$1,000
Rice Energy Rice Midstream Holdings Rice Midstream Partners
Cash
AvailableRevolver
Ample Liquidity and Financial Flexibility RICE is capable of funding 100% of 2015 capital plan with liquidity on-hand Favorable credit metrics & covenants ensure flexibility
Cash & Revolver Capacity – 3/31/15
Debt/EBITDA Covenant NONE 4.25x 4.75x1Q15 Debt/RR EBITDA(3) 3.3x 0.3x 0.0x
EBITDA/Interest Covenant 2.5x 2.5x 2.5xLTM EBITDA/Interest 5.9x NM NM
(E&P)
(1)
__________________________(1) E&P segment cash balance.(2) Assumes $650MM borrowing base less $114MM letters of credit balance at 3/31/15.(3) E&P leverage metric uses Net Debt / RR EBITDA.
$MM
(2)
Leverage Metrics as of 03/31/15
$1.2B pro forma liquidity (excl. CFFO) v. $890MM
2015 capex
$459MM liquidity (excl. CFFO) v. $180MM
2015 capex

6 www.riceenergy.com
Efficient Capital Allocation Drives Strong 2015 Growth
_______________________Note: 2014 Pro Forma for ASR transaction.1. Does not include wells from the Greene County Acquisition.2. Consolidated midstream includes Rice Midstream Holdings and Rice Midstream Partners.
36 26
–
–
7
10
10
21
43 36
0
10
20
30
40
50
2012 2013 2014 2015E
Wells
PA OH
2015E E&P Guidance
47
127
274
480
–
–
–
0
100
200
300
400
500
2012 2013 2014 2015E
MMcfe/d
Average Net Daily ProductionNet Wells Turned to Sales (1)
Midstream Capital Expenditures2015E Consolidated Midstream Guidance (2)
Daily Throughput 2015E Midstream EBITDA
$45 $150 $180
$150
$210
$45 $50
$300
$390
0
100
200
300
400
2012 2013 2014 2015E
$MM
RMP Rice Retained Midstream
61
612
200
175
401
812
0
150
300
450
600
750
900
2012 2013 2014 2015E
MDth/d
RMP Rice Retained Midstream
$58
$38
0
10
20
30
40
50
60
RMP Rice RetainedMidstream
$MM
Published Guidance
D&C & Land Capital Expenditures
$380 $340
$200 $220
$250 $120
$225
$545
$830
$680
0100200300400500600700800900
2012 2013 2014 2015E
$MM
PA D&C OH D&C Land
7 www.riceenergy.com
Strong Execution Drives Consistent ResultsHighlights
Greene
Washington
Marcellus Development Map
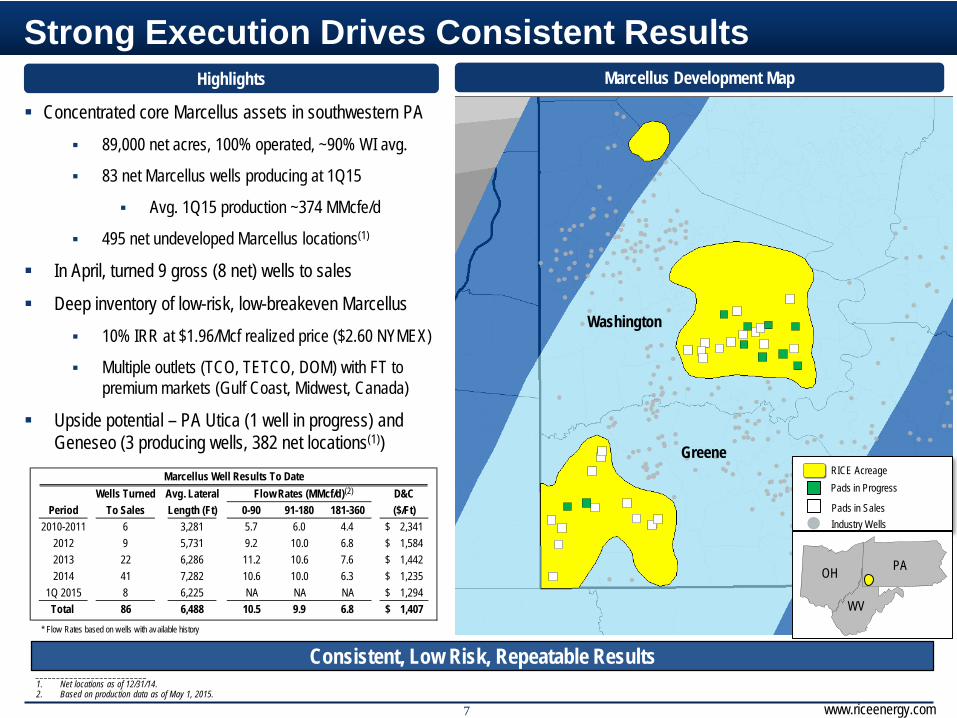
__________________________1. Net locations as of 12/31/14.2. Based on production data as of May 1, 2015.
Consistent, Low Risk, Repeatable Results
Pads in Progress
Pads in SalesIndustry Wells
RICE Acreage
Concentrated core Marcellus assets in southwestern PA 89,000 net acres, 100% operated, ~90% WI avg.
83 net Marcellus wells producing at 1Q15
Avg. 1Q15 production ~374 MMcfe/d
495 net undeveloped Marcellus locations(1)
In April, turned 9 gross (8 net) wells to sales
Deep inventory of low-risk, low-breakeven Marcellus 10% IRR at $1.96/Mcf realized price ($2.60 NYMEX)
Multiple outlets (TCO, TETCO, DOM) with FT to premium markets (Gulf Coast, Midwest, Canada)
Upside potential – PA Utica (1 well in progress) and Geneseo (3 producing wells, 382 net locations(1))
OH PA
WV
Wells Turned Avg. Lateral Flow Rates (MMcf/d) D&CPeriod To Sales Length (Ft) 0-90 91-180 181-360 ($/Ft)
2010-2011 6 3,281 5.7 6.0 4.4 2,341$ 2012 9 5,731 9.2 10.0 6.8 1,584$ 2013 22 6,286 11.2 10.6 7.6 1,442$ 2014 41 7,282 10.6 10.0 6.3 1,235$
1Q 2015 8 6,225 NA NA NA 1,294$ Total 86 6,488 10.5 9.9 6.8 1,407$
* Flow Rates based on wells with available history
Marcellus Well Results To Date(2)

8 www.riceenergy.com
Wells Turned Avg. Lateral Flow Rates (MMcf/d) D&CPeriod To Sales Length (Ft) 0-90 91-180 181-360 ($/Ft)2Q 2014 1 6,957 14.0 14.2 NA 3,316$ 3Q 2014 2 9,000 14.5 15.9 NA 2,000$ 4Q 2014 - NA NA NA NA NA1Q 2015 2 8,879 NA NA NA 1,837$ Total 5 8,543 14.3 15.3 NA 2,198$ * Flow Rates based on wells with available history
Utica Well Results To Date
Utica: Dry-Gas Core Established, Significant Growth AheadUtica Development MapOperational Highlights
Belmont
MonroeNoble
Guernsey
Harrison
Marshall
Wetzel
In Progress
RICE PA Utica Test (Drilling)
In Sales
RICE Acreage
__________________________1. Net locations as of 12/31/14.2. As of May 1, 2015.3. Based on production data as of May 1, 2015.
Concentrated core Utica assets in southeastern OH
57,000 net acres, 98% in Belmont County (~75% dry gas)
5 operated wells (3 net) and 20 non-operated (5 net) producing into sales through 1Q15
356 net undeveloped Utica locations in Belmont County(1)
In April, turned 3 gross (1 net) wells to sales
Rice’s peer-leading results underscore shale quality, our technical competency and low-breakeven potential
First 5 operated wells producing ~85 MMcf/d gross; expect each to produce 5-8 Bcf/well in first year(2)
10% IRR at $1.79 realized price ($2.35 NYMEX)
Early, but Consistent and Prolific Development Leads to Predictable ResultsOH PA
WV
20+ MMcf/d IP
(3)

9 www.riceenergy.com
Wells are extremely prolific and consistent in terms of production and pressure profiles
Utica: Demonstrating Consistency & Repeatability
Rate vs Time
Wellhead Pressure vs Cumulative Production
Cumulative Production vs Time
Rate vs Cumulative ProductionLegend:
BigfootBlue Thunder 10HBlue Thunder 12HGold Digger 1HGold Digger 3H
10 www.riceenergy.com
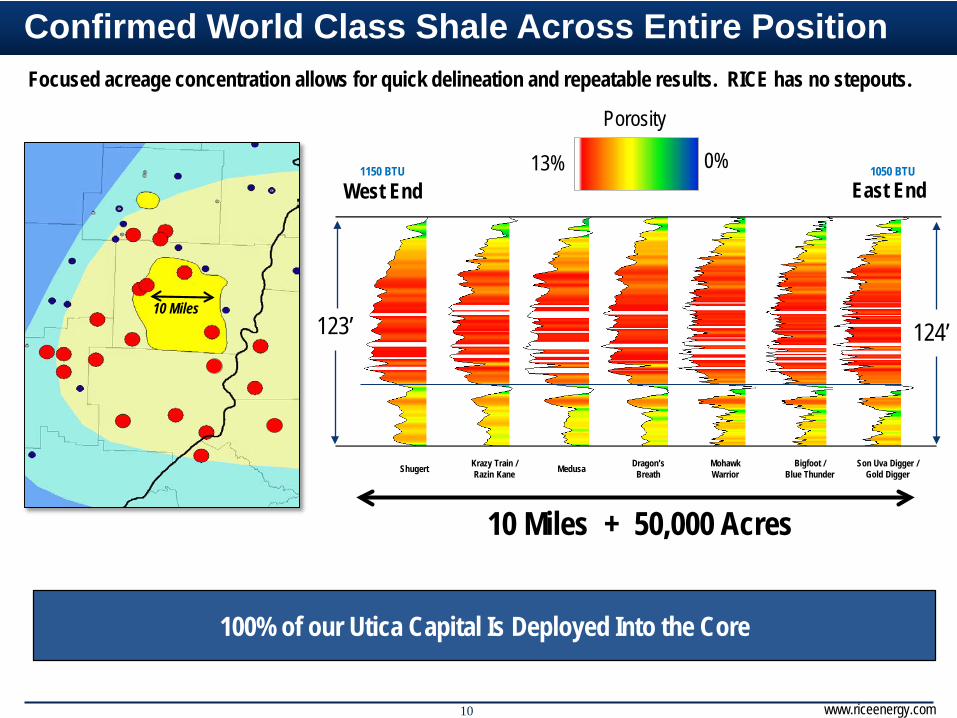
Confirmed World Class Shale Across Entire PositionFocused acreage concentration allows for quick delineation and repeatable results. RICE has no stepouts.
East EndWest End
124’123’
10 Miles + 50,000 Acres
13% 0%
Porosity
Son Uva Digger /Gold Digger
Bigfoot / Blue Thunder
Mohawk WarriorMedusa Dragon’s
BreathKrazy Train / Razin KaneShugert
10 Miles
100% of our Utica Capital Is Deployed Into the Core
1150 BTU 1050 BTU

11 www.riceenergy.com
Strategic Midstream Assets in Appalachia
Complete build-out of infrastructure by YE 2015 6.7 MMDth/d gathering capacity ~26 MMGPD water capacity
Build-out of 1.5 MMDth/d compression capacity complete by early 2016
Concentrated acreage Substantially all of RICE’s drilling
locations will be within 2 miles of gathering pipeline by YE2015(1)
Multiple long-haul takeaway options Provides producers with multiple
downstream markets
SYSTEM INFORMATION12/31/14
DedicatedGross
Acreage
1Q 2015 Throughput
(MDth/d)
2015E EBITDA ($MM)
2015E Capex ($MM)
RMP 86,000 557 $ 55 – 60 $ 180
Retained Midstream 57,000 111 $ 35 – 40 $ 210
Total 143,000 668 $ 90 – 100 $ 390
Overview SYSTEM MAP
Greene
WashingtonBelmont
Marshall
Wetzel
Fayette
Ohio
Brooke
Beaver
Hancock
Jefferson
Harrison
Monroe
Legend
RMP Gathering Pipeline to be Constructed
RICE Acreage
RMP Gathering Pipeline
RICE Gathering Pipeline RICE Gathering Pipeline to be Constructed
3rd Party Dedicated to RMP3rd Party Dedicated to RICERICE Acreage Dedicated to 3rd Party
PENNSYLVANIA
OHIO
WEST VIRGINIA
Build-out Substantially Complete by YE 2015__________________________1. Other than RICE acreage dedicated to 3rd parties.
Colum
bia Gas (TC
O)
National Fuel G
as Supply (NFG
S)
12 www.riceenergy.com
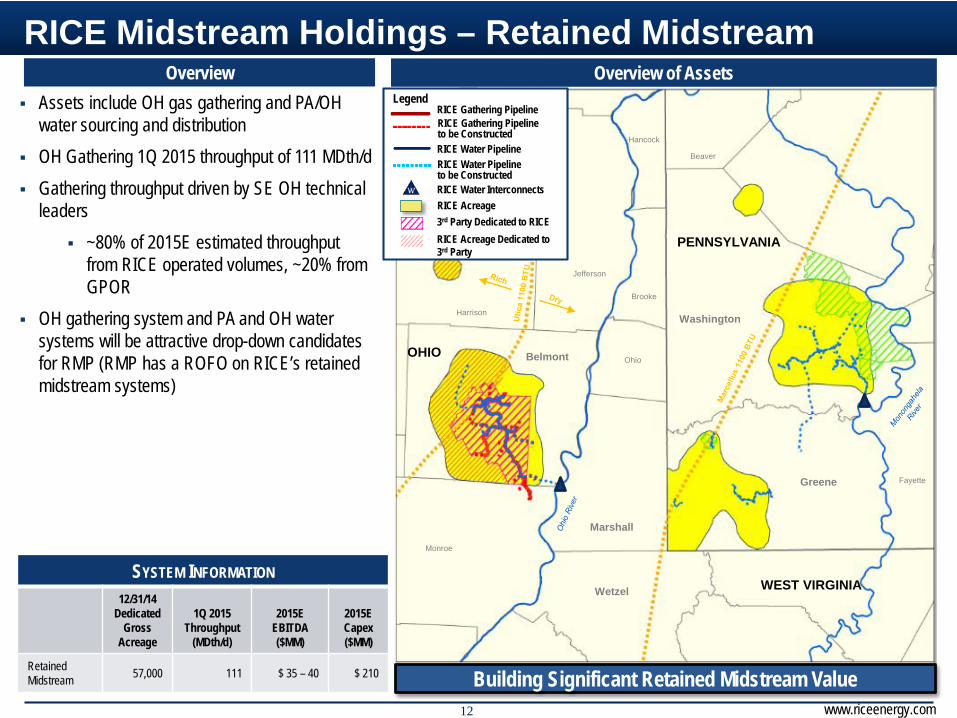
RICE Midstream Holdings – Retained Midstream Overview Overview of Assets
Assets include OH gas gathering and PA/OH water sourcing and distribution
OH Gathering 1Q 2015 throughput of 111 MDth/d Gathering throughput driven by SE OH technical
leaders ~80% of 2015E estimated throughput
from RICE operated volumes, ~20% from GPOR
OH gathering system and PA and OH water systems will be attractive drop-down candidates for RMP (RMP has a ROFO on RICE’s retained midstream systems)
SYSTEM INFORMATION12/31/14
DedicatedGross
Acreage
1Q 2015 Throughput
(MDth/d)
2015E EBITDA ($MM)
2015E Capex ($MM)
Retained Midstream 57,000 111 $ 35 – 40 $ 210
Greene
Washington
Belmont
Marshall
Fayette
Ohio
Brooke
Beaver
Hancock
Jefferson
Harrison
Monroe
PENNSYLVANIA
OHIO
WEST VIRGINIA
Legend
RICE Acreage
RICE Gathering Pipeline RICE Gathering Pipeline to be Constructed
3rd Party Dedicated to RICERICE Acreage Dedicated to 3rd Party
RICE Water Pipeline RICE Water Pipeline to be ConstructedRICE Water Interconnects
Wetzel
Building Significant Retained Midstream Value

13 www.riceenergy.com
27% 36% 35%
49% 39%
48%
23% 19% 16%
9%
16%
8% 1% –
17% 18%
10% 13% 10%
12%
12% 8%
11% 7% 39% 33%
20% 16% 24% 24%
($0.47)
($0.57)
($0.42)
($0.30)
($0.42)($0.38)
(0.60)
(0.50)
(0.40)
(0.30)
(0.20)
(0.10)
–
–
10%
20%
30%
40%
50%
60%
70%
80%
90%
100%
1Q15 2Q15 3Q15 4Q15 2015 2016
Gulf Coast TCO Midwest/Dawn TETCO-M2 Dominion
Basis Exposure and Realized Pricing
Expect Appalachian basis exposure (M2 + DOM) to decrease throughout the year as firm transportation projects come online: REX (July 2015) and TETCO Open (November 2015)
$0.42/MMBTU basis differential in 2015 (~15% of Henry Hub)
Firm transportation covers 100% of 2015 production volumes
Basis Exposure and Basis Differential$/MMBtu
_______________________1. Strip as of 4/23/15.
(1)
Full Year Full Year1Q15 2Q15 3Q15 4Q15 2015 2016
NYMEX Henry Hub Strip ($/MMBTU) $2.87 $2.54 $2.65 $2.85 $2.73 $3.06Plus/Less: Average Basis Impact (0.47) (0.57) (0.42) (0.30) (0.42) (0.38)Less: Firm Transportation Fuel & Variables (0.09) (0.14) (0.16) (0.18) (0.16) (0.17)Plus: BTU Uplift (MMBtu/Mcf) 0.11 0.09 0.10 0.12 0.11 0.13Pre-Hedge Realized Price ($/Mcf) $2.42 $1.92 $2.17 $2.49 $2.26 $2.64Plus: Realized Hedging Gain/Loss ($/Mcf) 0.70 1.11 1.05 0.95 0.98 0.39Post Hedged Realized Price ($/Mcf) $3.12 $3.03 $3.22 $3.44 $3.24 $3.03Plus: Firm Transportation Sales, Net ($/Mcf) 0.08 – – – – –Adjusted Post-Hedge Realized Price ($/Mcf) $3.20 $3.03 $3.22 $3.44 $3.24 $3.03FT Demand Expense (0.33) (0.29) (0.41) (0.43) (0.37) (0.41)FT Expense (Fuel & Variables + Demand) (0.42) (0.43) (0.57) (0.61) (0.54) (0.58)FT Expense + Basis + BTU Uplift (0.78) (0.90) (0.89) (0.79) (0.85) (0.84)
14 www.riceenergy.com
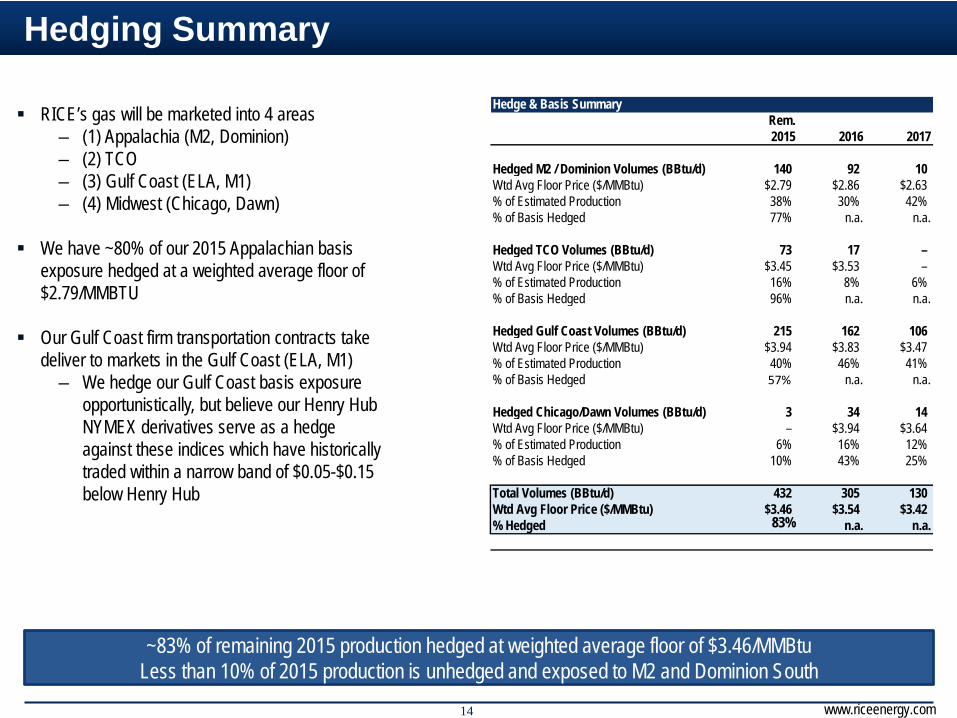
Hedging Summary
RICE’s gas will be marketed into 4 areas– (1) Appalachia (M2, Dominion)– (2) TCO– (3) Gulf Coast (ELA, M1) – (4) Midwest (Chicago, Dawn)
We have ~80% of our 2015 Appalachian basis exposure hedged at a weighted average floor of $2.79/MMBTU
Our Gulf Coast firm transportation contracts take deliver to markets in the Gulf Coast (ELA, M1)
– We hedge our Gulf Coast basis exposure opportunistically, but believe our Henry Hub NYMEX derivatives serve as a hedge against these indices which have historically traded within a narrow band of $0.05-$0.15 below Henry Hub
~83% of remaining 2015 production hedged at weighted average floor of $3.46/MMBtuLess than 10% of 2015 production is unhedged and exposed to M2 and Dominion South
Hedge & Basis SummaryRem.2015 2016 2017
Hedged M2 / Dominion Volumes (BBtu/d) 140 92 10Wtd Avg Floor Price ($/MMBtu) $2.79 $2.86 $2.63% of Estimated Production 38% 30% 42%% of Basis Hedged 77% n.a. n.a.
Hedged TCO Volumes (BBtu/d) 73 17 –Wtd Avg Floor Price ($/MMBtu) $3.45 $3.53 –% of Estimated Production 16% 8% 6%% of Basis Hedged 96% n.a. n.a.
Hedged Gulf Coast Volumes (BBtu/d) 215 162 106Wtd Avg Floor Price ($/MMBtu) $3.94 $3.83 $3.47% of Estimated Production 40% 46% 41%% of Basis Hedged 57% n.a. n.a.
Hedged Chicago/Dawn Volumes (BBtu/d) 3 34 14Wtd Avg Floor Price ($/MMBtu) – $3.94 $3.64% of Estimated Production 6% 16% 12%% of Basis Hedged 10% 43% 25%
Total Volumes (BBtu/d) 432 305 130Wtd Avg Floor Price ($/MMBtu) $3.46 $3.54 $3.42% Hedged 90% n.a. n.a.83%
15 www.riceenergy.com
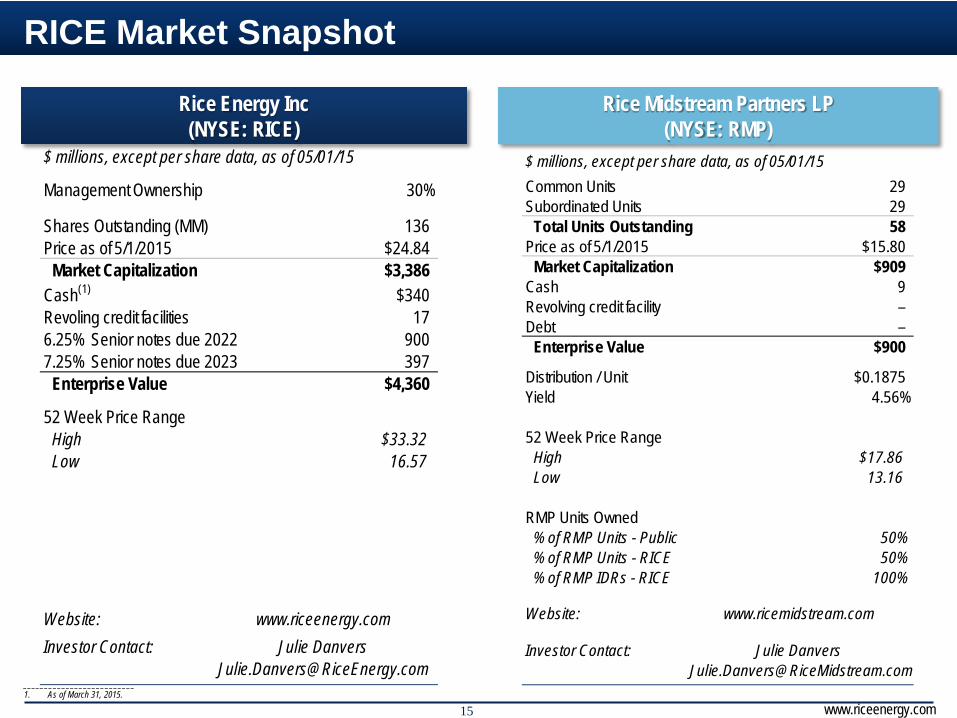
RICE Market Snapshot
Rice Midstream Partners LP(NYSE: RMP)
Rice Energy Inc(NYSE: RICE)
__________________________1. As of March 31, 2015.
$ millions, except per share data, as of 05/01/15Common Units 29Subordinated Units 29
Total Units Outstanding 58Price as of 5/1/2015 $15.80
Market Capitalization $909Cash 9Revolving credit facility –Debt –
Enterprise Value $900
Distribution / Unit $0.1875Yield 4.56%
52 Week Price RangeHigh $17.86Low 13.16
RMP Units Owned% of RMP Units - Public 50%% of RMP Units - RICE 50%% of RMP IDRs - RICE 100%
Website: www.ricemidstream.com
Investor Contact: Julie [email protected]
$ millions, except per share data, as of 05/01/15
Management Ownership 30%
Shares Outstanding (MM) 136Price as of 5/1/2015 $24.84
Market Capitalization $3,386Cash(1) $340Revoling credit facilities 176.25% Senior notes due 2022 9007.25% Senior notes due 2023 397
Enterprise Value $4,360
52 Week Price RangeHigh $33.32Low 16.57
Website: www.riceenergy.comInvestor Contact: Julie Danvers
16 www.riceenergy.com
Appendix
17 www.riceenergy.com
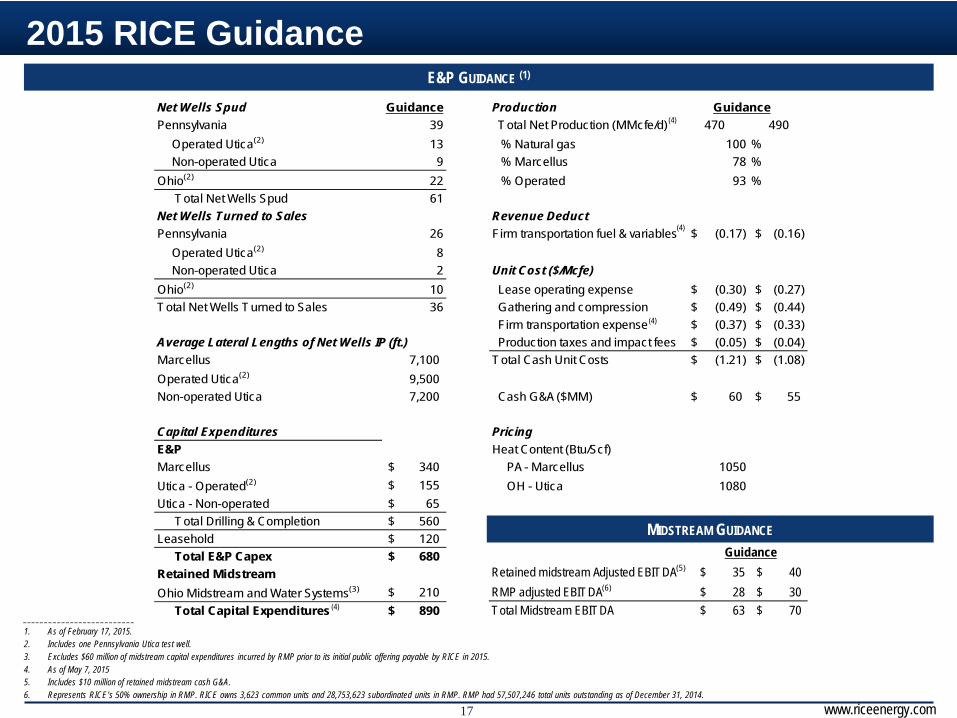
Net Wells Spud Guidance ProductionPennsylvania 39 Total Net Production (MMcfe/d) 470 490
Operated Utica(2) 13 % Natural gas 100 % Non-operated Utica 9 % Marcellus 78 %
Ohio(2) 22 % Operated 93 %Total Net Wells Spud 61
Net Wells Turned to Sales Revenue DeductPennsylvania 26 Firm transportation fuel & variables (0.17)$ (0.16)$
Operated Utica(2) 8 Non-operated Utica 2 Unit Cost ($/Mcfe)
Ohio(2) 10 Lease operating expense (0.30)$ (0.27)$ Total Net Wells Turned to Sales 36 Gathering and compression (0.49)$ (0.44)$
Firm transportation expense (0.37)$ (0.33)$ Average Lateral Lengths of Net Wells IP (ft.) Production taxes and impact fees (0.05)$ (0.04)$ Marcellus 7,100 Total Cash Unit Costs (1.21)$ (1.08)$ Operated Utica(2) 9,500Non-operated Utica 7,200 Cash G&A ($MM) 60$ 55$
Capital Expenditures PricingE&P Heat Content (Btu/Scf)Marcellus 340$ PA - Marcellus 1050Utica - Operated(2) 155$ OH - Utica 1080Utica - Non-operated 65$
Total Drilling & Completion 560$ Leasehold 120$
Total E&P Capex 680$ Retained MidstreamOhio Midstream and Water Systems(3) 210$
Total Capital Expenditures 890$
Guidance
2015 RICE GuidanceE&P GUIDANCE (1)
MIDSTREAM GUIDANCE
__________________________1. As of February 17, 2015.2. Includes one Pennsylvania Utica test well.3. Excludes $60 million of midstream capital expenditures incurred by RMP prior to its initial public offering payable by RICE in 2015.4. As of May 7, 20155. Includes $10 million of retained midstream cash G&A.6. Represents RICE’s 50% ownership in RMP. RICE owns 3,623 common units and 28,753,623 subordinated units in RMP. RMP had 57,507,246 total units outstanding as of December 31, 2014.
(4)
(4)
(4)
(4)
Retained midstream Adjusted EBITDA(5) 35$ 40$ RMP adjusted EBITDA(6) 28$ 30$ Total Midstream EBITDA 63$ 70$
Guidance

18 www.riceenergy.com
Economic Assumptions Summary
NYMEXBreakeven (Adj Fees) $2.60 $3.05 $2.35 $2.25
NYMEXBreakeven (Full Fees) $2.85 $3.05 $2.90 $2.25
__________________________Note: Single well IRRs and breakeven PV-10 estimates shown under two scenarios. (1) “Adjusted Midstream Fee” adjusts the gathering and compression fee paid by E&P by RICE’s ownership in the midstream assets. For example, in the Marcellus, RICE owns a 50% interest in RMP which provides gathering and compression services to RICE and thus the single well returns analysis assumes the midstream fee is adjusted by 50%. In the Utica, RICE owns 100% of the RICE OH Midstream assets which provide gathering and compression services to RICE and the single well returns assume RICE does not pay a gathering and compression fee. (2) “Full Midstream Fees” assume E&P pays for the full gathering and compression fee regardless of RICE’s ownership in the midstream assets.
@ $4 NYMEX and $27/bbl NGLs
Marcellus W. Greene Utica Dry Utica WetType Well AssumptionsLateral Length 7,000 7,000 8,000 8,000EUR (Bcf/1,000') 2.0 2.0 2.5 2.2NGL Yield (bbls/mmcf) – – – 80Gas Shrink – – – 25%Pre-Processed EUR (Bcfe) 13.9 13.9 20.0 17.6Post-Processed EUR (Bcfe) 13.9 13.9 20.0 21.6% Gas 100% 100% 100% 61%Residue Gas Heat Content (Btu/Scf) 1,050 1,090 1,080 1,159Initial Choke (MMcf/d per 1,000') 1.85 1.85 1.87 1.70Flat Period (days) 150 150 270 270120-Day Avg. IP (MMcf/d) 12.6 12.6 14.5 13.1
D&C AssumptionsD&C ($mm) $8.75 $8.75 $12.00 $12.00D&C per Lateral ($ per foot) $1,250 $1,250 $1,500 $1,500
Operating ExpensesFixed Operating Expenses ($/well/month) -- WI $5,000 $5,000 $5,000 $5,000Variable Operating Expenses ($/mcf) -- WI $0.23 $0.23 $0.23 $0.23All-In Estimated Opex ($/mcf) - WI, year 1 of well $0.25 $0.25 $0.24 $0.24Fixed Operating Expenses ($/well/month) -- NRI $6,098 $6,098 $6,250 $6,250Variable Operating Expenses ($/mcf) -- NRI $0.27 $0.27 $0.28 $0.28All-In Estimated Opex ($/mcf) - NRI, year 1 of well $0.30 $0.30 $0.30 $0.30
Other Costs/ExpensesWell Impact Fee? Yes Yes No NoSeverance Taxes -- % of WI Sales Revenue – – 2.5% 2.5%Royalty 18% 18% 20% 20%
Gathering and Compression Fees (Full Midstream Fees -- see footnote)$/dth -- WI $0.37 $0.57 $0.37 n.d.$/dth -- NRI $0.45 $0.70 $0.46 n.d.$/mcf -- WI $0.39 $0.62 $0.40 n.d.$/mcf -- NRI $0.47 $0.76 $0.50 n.d.
Gathering and Compression Fees (Adjusted Midstream Fees -- see footnote)$/dth -- WI $0.19 $0.57 – n.d.$/dth -- NRI $0.23 $0.70 – n.d.$/mcf -- WI $0.19 $0.62 – n.d.$/mcf -- NRI $0.24 $0.76 – n.d.
Firm Transportation and Basis$/dth -- WI $0.52 $0.52 $0.52 $0.52$/dth -- NRI $0.63 $0.63 $0.65 $0.65$/mcf -- WI $0.55 $0.57 $0.56 $0.60$/mcf -- NRI $0.67 $0.69 $0.70 $0.75Long Term Basis Pricing (% of NYMEX) 9% 9% 9% 9%All-in FT + Basis -- NRI ($/dth) assuming $4/NYMEX $0.99 $0.99 $1.01 $1.01
InventoryNet Undeveloped Locations 356 139 302 54NRI Undeveloped Horizontal Feet (mm ft) 2.1 0.8 1.9 0.3
Economics Summary (Adjusted for Ownership of Midstream In Each Area, $4 NYMEX, $27 NGL barrel)PV-10 Single Well $9.6 $6.7 $15.1 $12.2IRR 81% 53% 87% 59%Payback (Months) 15 19 14 18Breakeven NYMEX ($/dth) $2.60 $3.05 $2.35 $2.25
356
139
302
54
81%
53%
87%
59%64%
53% 55% 59%
0%
10%
20%
30%
40%
50%
60%
70%
80%
90%
100%
–
50
100
150
200
250
300
350
400
Marcellus W. Greene Utica Dry Utica Wet
Net Locations IRR (adj midstream fees) IRR (full midstream fees)

19 www.riceenergy.com
RICE Hedging Detail
FIXED PRICE HEDGES
We employ financial instruments (primarily swaps & costless collars) to mitigate commodity price risk Assures base level of cash flow to reinvest in growth
Target hedging ~50% of forecasted production up to two years out Add incremental hedges opportunistically beyond two years
__________________________Hedge position as of 4/5/15.
BASIS HEDGESAll-In Fixed Price Derivatives Rem. 2015 2016 2017NYMEX Natural Gas SwapsVolume Hedged (BBtu/d) 178 274 80Wtd. Avg. Swap Price ($/MMbtu) $4.08 $3.95 $4.01NYMEX Natural Gas CollarsVolume Hedged (BBtu/d) 144 – 50Wtd. Avg. Collar Price ($/MMbtu) $4.65 – $3.78Wtd. Avg. Floor Price ($/MMbtu) $3.96 – $3.00Total NYMEX Price DerivativesNYMEX Volume Hedged (BBtu/d) 323 274 130Swap & Collar Floor ($/MMbtu) $4.03 $3.95 $3.62Dominion Natural Gas SwapsVolume Hedged (BBtu/d) 72 31 –Wtd. Avg. Swap Price ($/MMbtu) $2.50 $2.62 –TCO Natural Gas SwapsVolume Hedged (BBtu/d) 38 – –Wtd. Avg. Swap Price ($/MMbtu) $3.30 – –Total Fixed Price DerivativesNYMEX Volume Hedged (BBtu/d) 432 305 130Swap & Collar Floor ($/MMbtu) $3.71 $3.82 $3.62
Basis Contract Derivatives Rem. 2015 2016 2017TCO Basis SwapsVolume Hedged (BBtu/d) 36 17 –Wtd. Avg. Swap Price ($/MMbtu) ($0.42) ($0.42) –DOM Basis SwapsVolume Hedged (BBtu/d) 17 30 10Wtd. Avg. Swap Price ($/MMbtu) ($1.12) ($1.08) ($0.99)M2 Basis SwapsVolume Hedged (BBtu/d) 27 10 –Wtd. Avg. Swap Price ($/MMbtu) ($0.94) ($1.08) –ELA Basis SwapsVolume Hedged (BBtu/d) 30 10 –Wtd. Avg. Swap Price ($/MMbtu) ($0.13) ($0.12) –MichCon Basis SwapsVolume Hedged (BBtu/d) 1 4 4Wtd. Avg. Swap Price ($/MMbtu) ($0.04) ($0.04) ($0.04)Chicago Basis SwapsVolume Hedged (BBtu/d) – 20 –Wtd. Avg. Swap Price ($/MMbtu) – ($0.04) –ANR SE Basis SwapsVolume Hedged (BBtu/d) – 15 –Wtd. Avg. Swap Price ($/MMbtu) – ($0.13) –Physical Triggered Basis Rem. 2015 2016 2017Appalachian Fixed Basis (Physical)Volume Hedged (BBtu/d) 25 21 –Wtd. Avg. Swap Price ($/MMbtu) ($0.79) ($0.79) –MichCon Fixed Basis (Physical)Volume Hedged (BBtu/d) 2 10 10Wtd. Avg. Swap Price ($/MMbtu) $0.05 $0.05 $0.05Gulf Coast Fixed Basis (Physical)Volume Hedged (BBtu/d) 81 100 100Wtd. Avg. Swap Price ($/MMbtu) ($0.17) ($0.17) ($0.17)
20 www.riceenergy.com
1Q 2015 Adjusted EBITDA Reconciliation
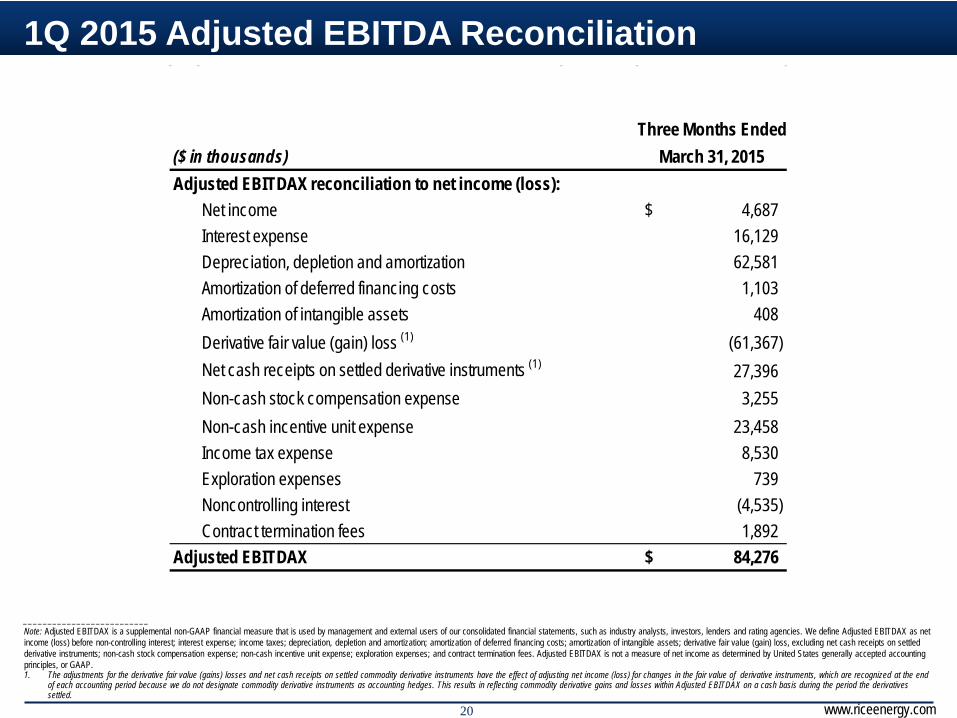
__________________________Note: Adjusted EBITDAX is a supplemental non-GAAP financial measure that is used by management and external users of our consolidated financial statements, such as industry analysts, investors, lenders and rating agencies. We define Adjusted EBITDAX as net income (loss) before non-controlling interest; interest expense; income taxes; depreciation, depletion and amortization; amortization of deferred financing costs; amortization of intangible assets; derivative fair value (gain) loss, excluding net cash receipts on settled derivative instruments; non-cash stock compensation expense; non-cash incentive unit expense; exploration expenses; and contract termination fees. Adjusted EBITDAX is not a measure of net income as determined by United States generally accepted accounting principles, or GAAP.1. The adjustments for the derivative fair value (gains) losses and net cash receipts on settled commodity derivative instruments have the effect of adjusting net income (loss) for changes in the fair value of derivative instruments, which are recognized at the end
of each accounting period because we do not designate commodity derivative instruments as accounting hedges. This results in reflecting commodity derivative gains and losses within Adjusted EBITDAX on a cash basis during the period the derivatives settled.
Three Months Ended($ in thousands) March 31, 2015Adjusted EBITDAX reconciliation to net income (loss):
Net income 4,687$ Interest expense 16,129Depreciation, depletion and amortization 62,581Amortization of deferred financing costs 1,103Amortization of intangible assets 408Derivative fair value (gain) loss (1) (61,367)Net cash receipts on settled derivative instruments (1) 27,396Non-cash stock compensation expense 3,255Non-cash incentive unit expense 23,458Income tax expense 8,530Exploration expenses 739Noncontrolling interest (4,535)Contract termination fees 1,892
Adjusted EBITDAX 84,276$
21 www.riceenergy.com
Cautionary StatementsFORWARD-LOOKING STATEMENTS
This presentation and the oral statements made in connection therewith may contain “forward looking statements” within the meaning of Section 27A of the Securities Act of 1933 and Section 21E of the Securities Exchange Act of 1934. All statements, other than statements of historical fact, regarding Rice Energy’s strategy, future operations, financial position, estimated revenues and income/losses, projected costs, prospects, plans and objectives of management are forward-looking statements. These statements often include the words “could,” “believe,” “anticipate,” “intend,” “estimate,” “expect,” “project” and similar expressions intended to identify forward-looking statements, although not all forward-looking statements contain such identifying words. Without limiting the generality of the foregoing, forward-looking statements contained in this presentation specifically include estimates of the Rice Energy’s reserves, expectations of plans, strategies, objectives and anticipated financial and operating results of Rice Energy, including as to Rice Energy’s drilling program, production, hedging activities, capital expenditure levels and other guidance included in this presentation. These forward-looking statements are based on Rice Energy’s current expectations and assumptions about future events and are based on currently available information as to the outcome and timing of future events. Rice Energy assumes no obligation to and does not intend to update any forward looking statements included herein. Rice Energy cautions you that these forward-looking statements are subject to all of the risks and uncertainties, most of which are difficult to predict and many of which are beyond their control, incident to the exploration for and development, production, gathering and sale of natural gas, natural gas liquids and oil. These risks include, but are not limited to, commodity price volatility, inflation, lack of availability of drilling and production equipment and services, environmental risks, drilling and other operating risks, regulatory changes; the uncertainty inherent in estimating natural gas reserves and in projecting future rates of production, cash flow and access to capital, the timing of development expenditures, and the other risks described under “Risk Factors” in Rice Energy’s most recent Form 10-K, Form 10-Q and other filings with the Securities and Exchange Commission. Should one or more of these risks or uncertainties occur, or should underlying assumptions prove incorrect, Rice Energy’s actual results and plans could differ materially from those expressed in any forward-looking statements.
This presentation has been prepared by Rice Energy and includes market data and other statistical information from sources believed by Rice Energy to be reliable, including independent industry publications, government publications or other published independent sources. Some data are also based on Rice Energy’s good faith estimates, which are derived from its review of internal sources as well as the independent sources described above. Although Rice Energy believes these sources are reliable, it has not independently verified the information and cannot guarantee its accuracy and completeness.
NON-PROVEN OIL AND GAS RESERVES
The SEC permits oil and gas companies, in their filings with the SEC, to disclose proved reserves, which are reserve estimates that geological and engineering data demonstrate with reasonable certainty to be recoverable in future years from known reservoirs under existing economic and operating conditions and certain probable and possible reserves that meet the SEC’s definition for such terms. We may use certain broader terms such as EUR (estimated ultimate recovery of resources), and we may use other descriptions of volumes of potentially recoverable hydrocarbon resources throughout this presentation that the SEC does not permit to be included in SEC filings. These broader classifications do not constitute reserves as defined by the SEC, and we do not attempt to distinguish these classifications from probable or possible reserves as defined by SEC guidelines.
Our estimates of EURs have been prepared by our independent reserve engineers. These estimates are by their nature more speculative than estimates of proved, probable and possible reserves and accordingly are subject to substantially greater risk of being actually realized, particularly in areas or zones where there has been limited or no drilling history. We include these estimates to demonstrate what we believe to be the potential for future drilling and production by the company. Actual locations drilled and quantities that may be ultimately recovered from our properties will differ substantially. In addition, we have made no commitment to drill all of the drilling locations which have been attributed to these quantities. Ultimate recoveries will be dependent upon numerous factors including actual encountered geological conditions, the impact of future oil and gas pricing, exploration and development costs, and our future drilling decisions and budgets based upon our future evaluation of risk, returns and the availability of capital and, in many areas, the outcome of negotiation of drilling arrangements with holders of adjacent or fractional interest leases. Estimates of resource potential and other figures may change significantly as development of our properties provide additional data and therefore actual quantities that may ultimately be recovered will likely differ from these estimates.
Our forecast and expectations for future periods are dependent upon many assumptions, including estimates of production decline rates from existing wells, the undertaking and outcome of future drilling activity and activity that may be affected by significant commodity price declines or drilling cost increases.
Certain of Rice Energy's wells are named after superheroes and monster trucks, some of which may be trademarked. Despite their size and strength, Rice Energy's wells are in no manner affiliated with such superheroes or monster trucks.
Initial production rates are subject to decline over time and should not be regarded as reflective of sustained production levels. In particular, production from horizontal drilling in shale oil and natural gas resource plays and tight natural gas plays that are stimulated with extensive pressure fracturing are typically characterized by significant early declines in production rates.
22 www.riceenergy.com
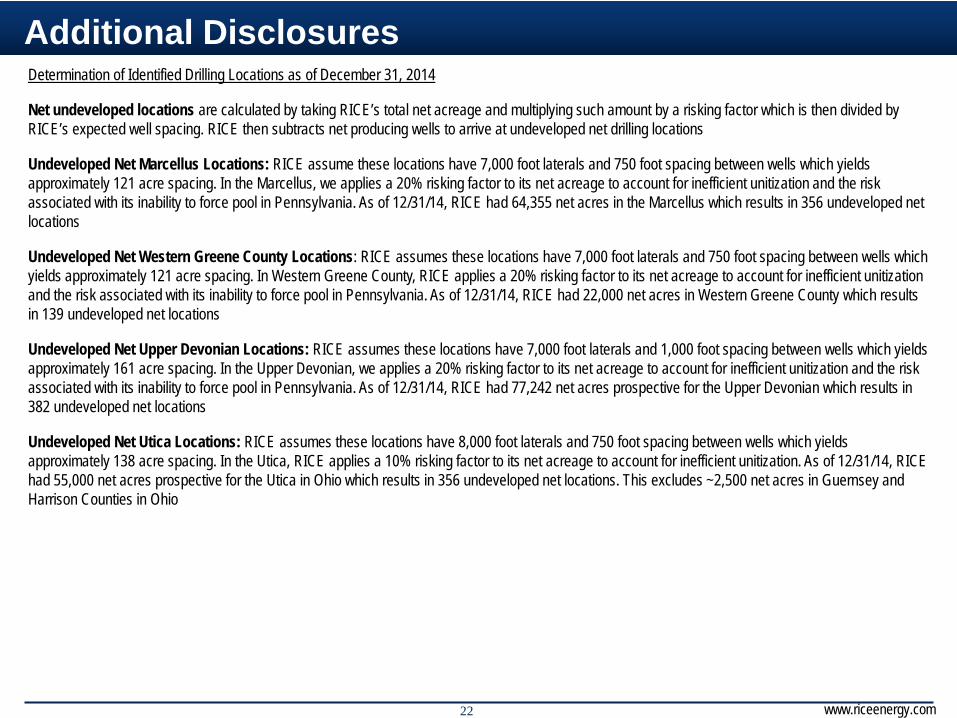
Determination of Identified Drilling Locations as of December 31, 2014
Net undeveloped locations are calculated by taking RICE’s total net acreage and multiplying such amount by a risking factor which is then divided by RICE’s expected well spacing. RICE then subtracts net producing wells to arrive at undeveloped net drilling locations
Undeveloped Net Marcellus Locations: RICE assume these locations have 7,000 foot laterals and 750 foot spacing between wells which yields approximately 121 acre spacing. In the Marcellus, we applies a 20% risking factor to its net acreage to account for inefficient unitization and the risk associated with its inability to force pool in Pennsylvania. As of 12/31/14, RICE had 64,355 net acres in the Marcellus which results in 356 undeveloped net locations
Undeveloped Net Western Greene County Locations: RICE assumes these locations have 7,000 foot laterals and 750 foot spacing between wells which yields approximately 121 acre spacing. In Western Greene County, RICE applies a 20% risking factor to its net acreage to account for inefficient unitization and the risk associated with its inability to force pool in Pennsylvania. As of 12/31/14, RICE had 22,000 net acres in Western Greene County which results in 139 undeveloped net locations
Undeveloped Net Upper Devonian Locations: RICE assumes these locations have 7,000 foot laterals and 1,000 foot spacing between wells which yields approximately 161 acre spacing. In the Upper Devonian, we applies a 20% risking factor to its net acreage to account for inefficient unitization and the risk associated with its inability to force pool in Pennsylvania. As of 12/31/14, RICE had 77,242 net acres prospective for the Upper Devonian which results in 382 undeveloped net locations
Undeveloped Net Utica Locations: RICE assumes these locations have 8,000 foot laterals and 750 foot spacing between wells which yields approximately 138 acre spacing. In the Utica, RICE applies a 10% risking factor to its net acreage to account for inefficient unitization. As of 12/31/14, RICE had 55,000 net acres prospective for the Utica in Ohio which results in 356 undeveloped net locations. This excludes ~2,500 net acres in Guernsey and Harrison Counties in Ohio
Additional Disclosures