rice: global competitiveness of the u.s. rice industry 1 rice: global competitiveness of the u.s....
TRANSCRIPT

10/7/2015
1
Rice: Global Competitiveness of the U.S. Rice Industry
October 7, 2015
The views expressed here are those of the presenters, and do not necessarily represent those
of any individual Commissioner or of the Commission as a whole.
Disclaimer:

10/7/2015
2
Agenda
3
Overview of the Global Rice Market
Competitiveness: Cross‐country Comparison
Competitiveness: Country‐specific Findings
Competition in Export Markets
Assessment of the Impact of Government Programs
Overview: Global Rice Market

10/7/2015
3
Global White Rice Production
Asia90%
South America3.6%
Africa3.5%
North America1.5%
RoW1.6%All other
10%
All other: 46 million mtAsia: 409 million mt
Source: USDA, PSD Online (average for 2007/08‐13/14)
Most Rice is Consumed Locally
6Source: USDA, PSD Online (average for 2007/08‐13/14)
Exports7%
Domestic Consumption and Residual
92%
Annual addition to Stocks 1%
10/7/2015
4
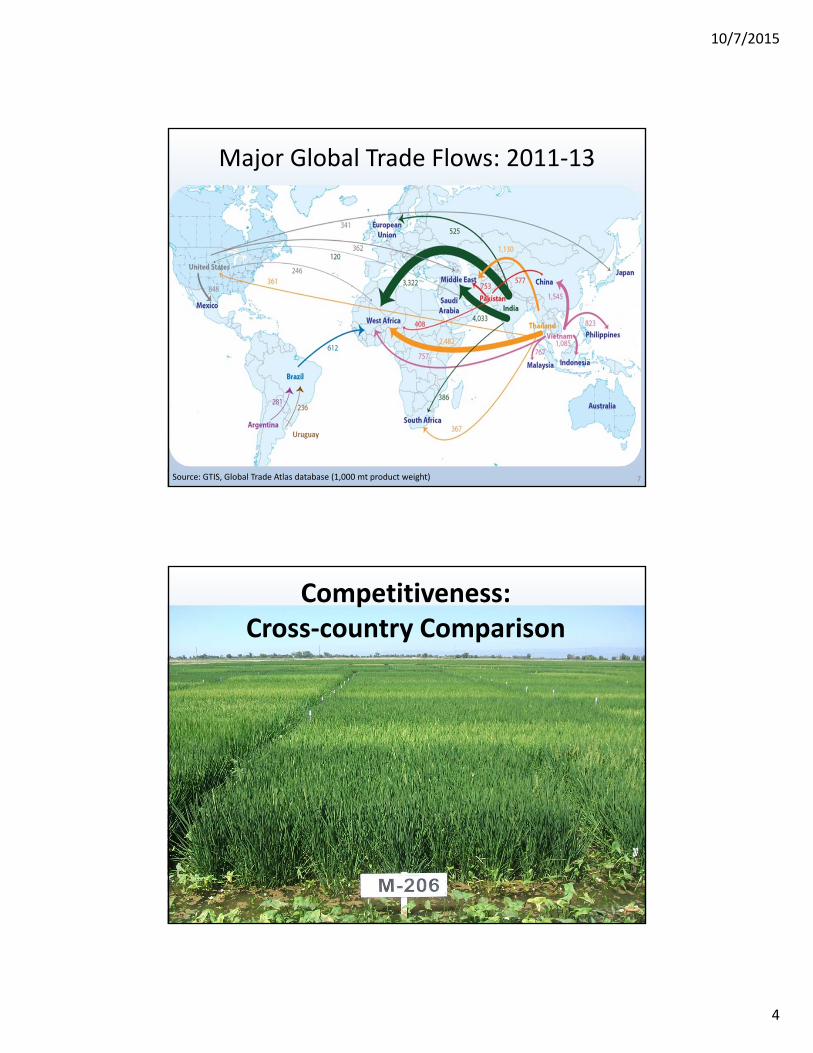
Major Global Trade Flows: 2011‐13
•
7Source: GTIS, Global Trade Atlas database (1,000 mt product weight)
Competitiveness: Cross‐country Comparison

10/7/2015
5
Highlighted Countries Country
Export Import Consumption Production
Global ranking
India 1 ‐‐ 2 2
Thailand 2 17 7 6
Vietnam 3 50 5 5
Pakistan* 4 ‐‐ 22 11
USA 5 16 14 12
Burma* 6 ‐‐ 8 7
Cambodia* 7 104 15 13
Brazil 8 14 10 9
Uruguay 9 ‐‐ 96 32
China 14 1 1 1
Indonesia ‐‐ 5 3 3
Philippines* ‐‐ 3 6 8
* Additions to the countries listed in request letter
Source: USDA, PSD Online (rankings based on 2013/14 data).
Highlighted Country GroupingsCountry
Export Import Consumption Production
Global ranking
China 14 1 1 1
Indonesia ‐‐ 5 3 3
Philippines* ‐‐ 3 6 8
India 1 ‐‐ 2 2
Thailand 2 17 7 6
Vietnam 3 50 5 5
Burma* 6 ‐‐ 8 7
Cambodia* 7 104 15 13
Brazil 8 14 10 9
Uruguay 9 ‐‐ 96 32
Pakistan* 4 ‐‐ 22 11
USA 5 16 14 12
10Source: USDA, PSD Online (based on 2013/14 data).
* Additions to the countries listed in request letter

10/7/2015
6
Country Delivered cost Product differentiation (quality)
Reliability of supply
Domestic Export Domestic Export
Brazil High Medium Medium Medium Low
Burma Low Low Low High Low
Cambodia Low Low Low High Low
China High Low N/A Medium N/A
India Low Medium Low High Low
Indonesia High Low N/A Low N/A
Pakistan Low Medium Low High Medium
Philippines Medium Low N/A Low N/A
Thailand Medium Medium High High Medium
Uruguay Low High High High High
United States Medium High High High High
Vietnam Low Low Low High Medium
Comparison of Factors of Competitiveness
Competitiveness: Country‐specific Findings
Rice ExportingCountries

10/7/2015
7
Factors Affecting Competitiveness:India
• Low cost of production
• Supportive government policies
• Innovation benefits Indian rice farmers
• Poor storage and milling infrastructure
13
Factors Affecting Competitiveness:Pakistan
• Government assistance for inputs lowers production costs
• Investment in processing facilities improves quality
• Lack of innovation keeps crop yields low
• Water– Extensive resources create favorable growing conditions
– . . . but poor water management raises delivered costs and reduces supply
• Road infrastructure also hinders competiveness
14
10/7/2015
8
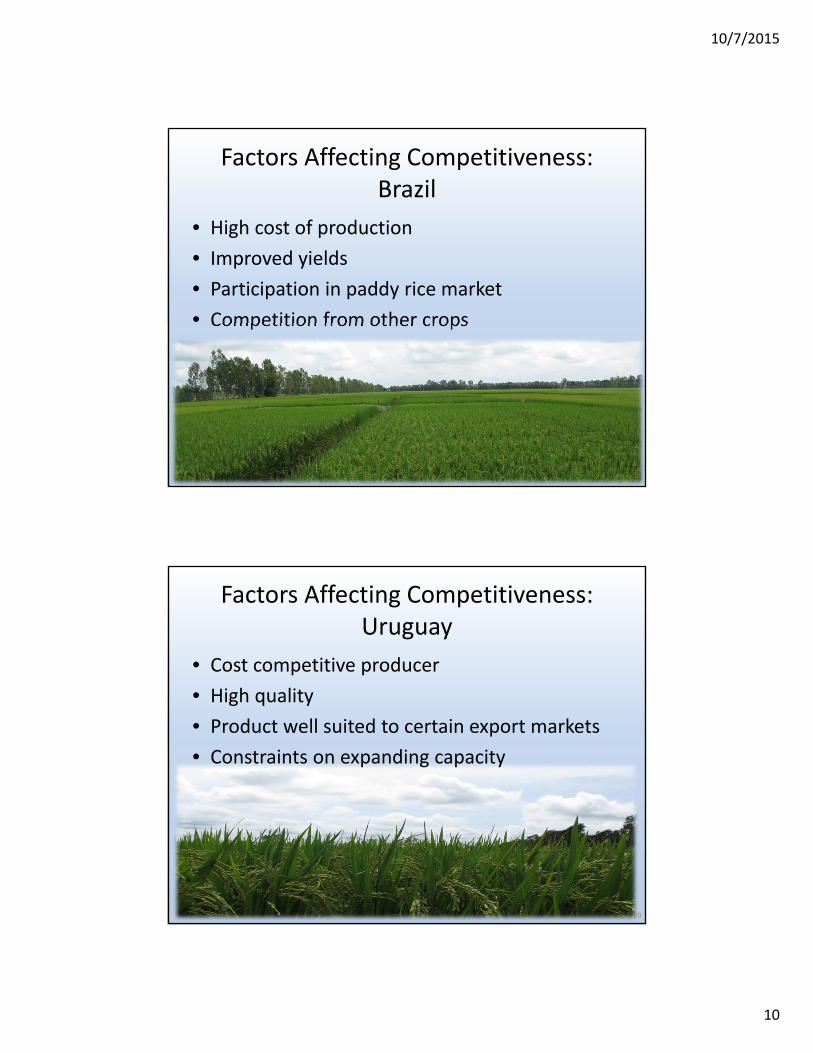
Factors Affecting Competitiveness: Thailand
• Regionally high cost of production
• Reputation for premium quality
• Reliability of supply
– Historically highly reliable…
– … but recent problems with reliability
15
Factors Affecting Competitiveness: Vietnam
• Low cost of production
• Natural resource endowments
• Better seed varieties and crop management increase yields and quality
16
• Poor government data & lack of market information

10/7/2015
9
Factors Affecting Competitiveness:Burma
• Low cost of production
• Abundant natural resources favor rice production
• Inefficient milling infrastructure and poor quality
• Poor road and port infrastructure
17
Factors Affecting Competitiveness:Cambodia
• Low cost of production
• Poor irrigation, utility, and transportation infrastructure
• The inefficient milling sector reduces quality and reliability of supply
• Efforts to improve quality and reliability
• Tariff preferences benefit the export sector
18
10/7/2015
10
Factors Affecting Competitiveness:Brazil
• High cost of production
• Improved yields
• Participation in paddy rice market
• Competition from other crops
19
Factors Affecting Competitiveness:Uruguay
• Cost competitive producer
• High quality
• Product well suited to certain export markets
• Constraints on expanding capacity
20

10/7/2015
11
Factors Affecting Competitiveness: USA
• Production costs limit U.S. exports in price‐sensitive markets
• Ability to supply various rice types and forms
• Developments in long grain rice breeding research
• Reputation for high quality
• Inability to meet certain customer specifications
21
Competition in Export Markets
10/7/2015
12
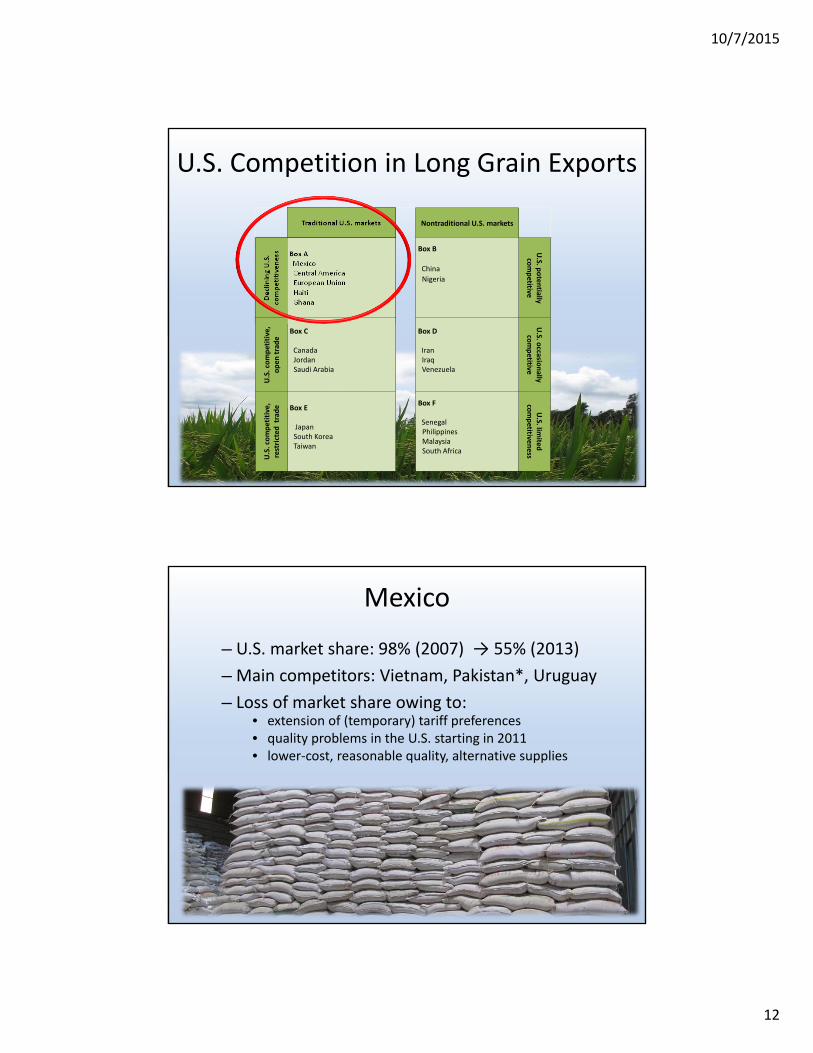
U.S. Competition in Long Grain Exports
23
Traditional U.S. markets Nontraditional U.S. markets
Declin
ing U.S.
competitiven
ess Box A
Mexico Central America European Union Haiti Ghana
Box B
China
NigeriaU.S. p
oten
tially competitive
U.S. competitive,
open
trade
Box C
CanadaJordanSaudi Arabia
Box D
IranIraqVenezuela
U.S. o
ccasionally
competitive
U.S. competitive,
restricted
trade Box E
JapanSouth KoreaTaiwan
Box F
Senegal PhilippinesMalaysia South Africa
U.S. lim
ited
competitiven
ess
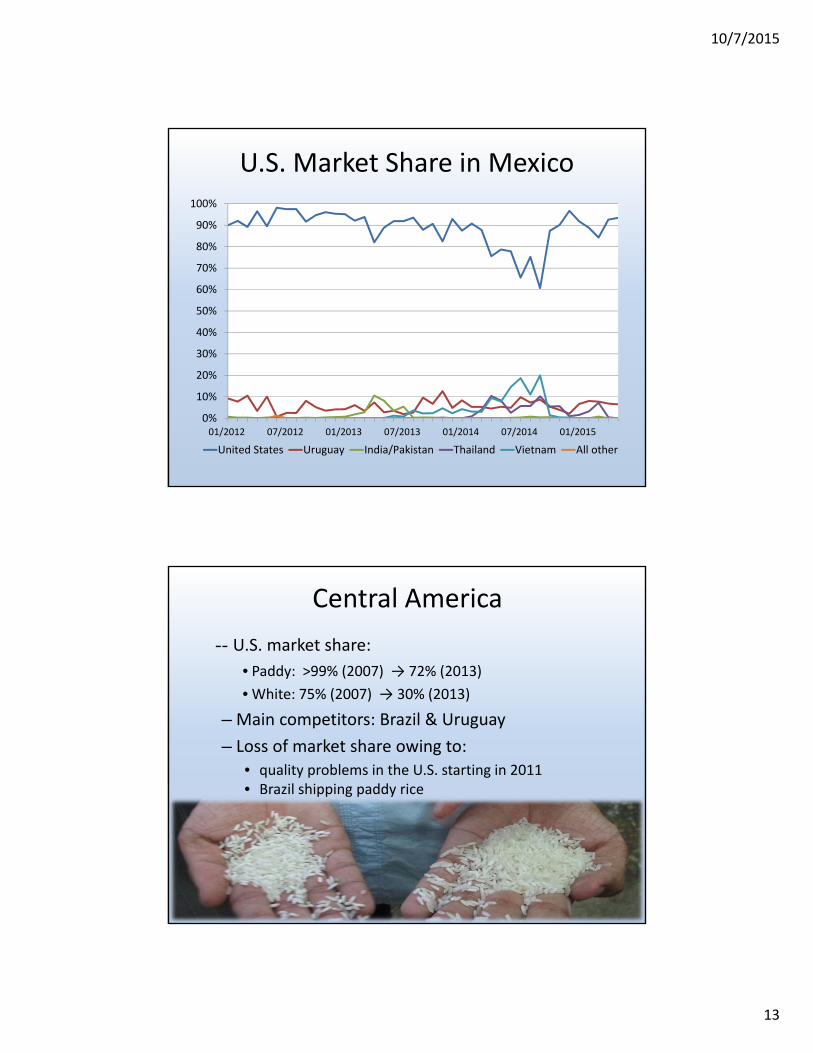
Mexico
– U.S. market share: 98% (2007) → 55% (2013)
– Main competitors: Vietnam, Pakistan*, Uruguay
– Loss of market share owing to:• extension of (temporary) tariff preferences • quality problems in the U.S. starting in 2011• lower‐cost, reasonable quality, alternative supplies
10/7/2015
13
U.S. Market Share in Mexico
0%
10%
20%
30%
40%
50%
60%
70%
80%
90%
100%
01/2012 07/2012 01/2013 07/2013 01/2014 07/2014 01/2015
United States Uruguay India/Pakistan Thailand Vietnam All other
Central America
‐‐ U.S. market share:
• Paddy: >99% (2007) → 72% (2013)
• White: 75% (2007) → 30% (2013)
– Main competitors: Brazil & Uruguay
– Loss of market share owing to:• quality problems in the U.S. starting in 2011• Brazil shipping paddy rice

10/7/2015
14
European Union
– U.S. market share: 24% (2005) → 4% (2013)
– Main competitors: India, Cambodia, Thailand, and Pakistan
– Owing to:
• Discovery of GE traits in U.S. rice in 2006
• EU tariff rate quotas
• EBA preferences for Cambodia
Haiti
– U.S. market share: near 100%
– Main competitor: Vietnam (2013)
– Loss of market share owing to:
• shipping delays ↑ US price and delivery mes, 2012
• G2G contract with Vietnam 2012/13

10/7/2015
15
Ghana
–U.S. market share: peaked in 2012 at 23%
–Fell to 16.5% in 2013
– Main competitors: Vietnam, Thailand
– Loss of market share owing to:
• lower priced aromatic rice from Vietnam
U.S. Competition in Long Grain Exports
30
Traditional U.S. markets Nontraditional U.S. markets
Declin
ing U.S.
competitiven
ess Box A
Mexico Central America European Union Haiti Ghana
Box B
China Nigeria
U.S. p
oten
tially competitive
U.S. competitive,
open
trade
Box C
CanadaJordanSaudi Arabia
Box D
IranIraqVenezuela
U.S. o
ccasionally
competitive
U.S. competitive,
restricted
trade Box E
JapanSouth KoreaTaiwan
Box F
Senegal PhilippinesMalaysia South Africa
U.S. lim
ited
competitiven
ess

10/7/2015
16
Impact of Government Programs: Modeling Results
Measurable Policies & ProgramsAffecting Rice
Price Support
Production Support
Consumer Support
Tariffs/Export Taxes

10/7/2015
17
Other Policies &Programs Affecting Rice
33
Seed Research
Infrastructure Projects
Extension Services
Export Market Development
Global Simulations Modeling Results
Policy Instrument United States Global total
Removal of Production Consumption Exports Imports Production Consumption
1,000 mt
Producer price support 105 <0.5 107 1 ‐329 ‐329
Factor input support 44 <0.5 46 1 ‐523 ‐523
Intermediate input support 51 <0.5 47 ‐4 ‐3,098 ‐3,098
Consumption support ‐14 <0.5 ‐12 2 ‐6,066 ‐6,066
Tariffs 1,269 ‐7 1,349 75 2,190 2,189
Export tax ‐2 <0.5 ‐2 <0.5 14 14
All except tariffs 182 ‐1 182 ‐1 ‐9,950 ‐9,950
All including tariffs 1,359 ‐7 1,435 69 ‐7,650 ‐7,651
10/7/2015
18
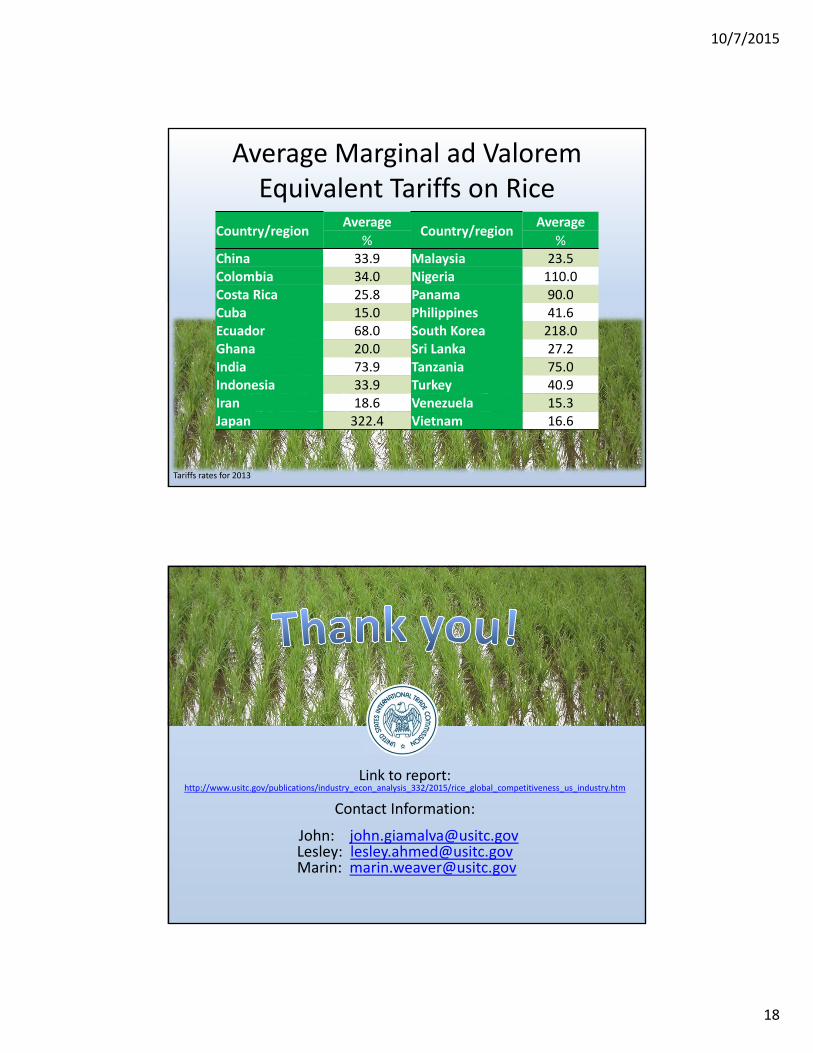
Average Marginal ad Valorem Equivalent Tariffs on Rice
Country/regionAverage
Country/regionAverage
% %China 33.9 Malaysia 23.5Colombia 34.0 Nigeria 110.0Costa Rica 25.8 Panama 90.0Cuba 15.0 Philippines 41.6Ecuador 68.0 South Korea 218.0Ghana 20.0 Sri Lanka 27.2India 73.9 Tanzania 75.0Indonesia 33.9 Turkey 40.9Iran 18.6 Venezuela 15.3Japan 322.4 Vietnam 16.6
Tariffs rates for 2013
Link to report: http://www.usitc.gov/publications/industry_econ_analysis_332/2015/rice_global_competitiveness_us_industry.htm
Contact Information:
John: [email protected]: [email protected]: [email protected]