rice production and marketing in indonesia
TRANSCRIPT

B *{UU!;fi~~*~ (1990~ 4 f.I 4 B) II
Rice Production and Marketing In Indonesia
Sri Widodo*
1. Introduction
Rice is very important as a consumption good and in food production in Asia since most people in Asia depend on rice as their staple food and more than 90% of the world's rice is produced in Asia. Therefore rice is also an important employer of resources, a strong political focal point, and a focus of considerable research attention (Barker and Herdt (2J). Over one-third of the world population, predominantly in Asia, depends on rice as a primary staple food. Most Asian farmers are small farmers and employ intensive labor practice in place of mechanization. Only about half the rice enters the market and less than 5% is internationally traded. However, the volume of rice traded in the market has grown at 4% per year or more over the past three decades, due to the rapid urbanization and increase in production. Output elasticity of marketed surplus for food grain with respect to production is greater than unity (Barker and Herdt (2J). Government intervention in the Asia rice market, production, and input market was common after World War II for social and economic reasons.
Like other countries in Asia, in Indonesia rice is also a very important commodity; as the main staple food, the main source of nutrition intake; the influence of its price on the inflation rate and economic stabilization; and because of the shortage of domestic rice supply for several decades. The success story of the green revolution in Indonesia is a long story of many efforts of government intervention in the production process, which is called the BIMAS Program, promoted with technological change by transferring modern varieties, expansion of irrigation infrastructure, subsidized input prices, and guaranteed farm gate price combined with rice procurement. In this
Paper presented in the Symposium of Rice Production in Asia and International Market. The Agricultural Economics Society of Japan, Tokyo, April 4, 1990.
* Gadjah Mada University, Yogyakarta, Indonesia.
development process, modernization of the agrarian structure has accrued with strengthening of the institution personnel, work procedure, and budget to serve the farmers in a better way.
2. Rice Self-Sufficiency
Historically, Indonesia for many decades was a rice importer since before independence and this continued after independence. The population growth in Indonesia is about 2.3% per annum, and it is expected to slow down later. With the growth rate of rice production of about 4% per annum in Pelita I (the first Five-Year Development Program, 1969-1979) and Pelita II (1974-1979), greater than the population growth, the self-sufficiency target was still not achieved. This growth of rice production was not sufficient to satisfy the demand because of the original shortage, the population increase, the great income elasticity of demand, and the relative decline in the rice price (Mears (14J).
In Pelita III (third Five-Year Development Program) (1979-1984), after the introduction of INSUS or Special Intensification Program, the increase of rice production of 7. 44% per annum exceeded the increase of demand, and in 1984, at the end of Pelita III, Indonesia attained rice self-sufficiency.
The main contribution of the production increase has been from yield (about 75%) and the rest has come from the area expansion (Table 1).
The production success began with two successive years of big increases in rice production in 1980 and 1981. This large gain resulted from almost ideal weather, minimum lost from pest, the improved condition procedure in the INSUS Program (Arndt (IJ, Mears (14), the improvement of irrigation system (Collier et at. (4J, Dick (7J), and the input price subsidy (Dick (7J, McCawley (13J). In 1982 there was a serious drought that decreased the harvest area, but there was still an increase in production due to the yield increase.
Five years later, in 1987, there was again an-

78
Table I. Rice harvested area, yield, and production (in milled rice)
Year Area Yield Production (1000 ha) (tJha) (1000 t)
1950 5,534 1. 20 6, 619 1955 6,381 1. 30 8,309 1960 7, 078 1. 36 9,644 1965 7, 125 1. 37 9, 765 1969 8,014 1. 53 12, 249 1974 8,505 1. 80 15,276 1979 8,804 2. 03 17,872 1980 9, 005 2. 24 20, 163 1981 9,382 2. 38 22,286 1982 8, 988 2. 54 22,837 1983 9, 163 2.62 24, 006 1984 9, 764 2. 66 26, 542 1985 9,902 2.68 26, 542 1986 9,989 2.70 27,014 1987 9, 908 2.77 27,453 1988* 9,942 2.85 28,285 1989* 10, 089 2.99 30, 191
Growth(%) 1950-55 2. 84 1. 60 4.55
55-60 2. 07 0.90 2.98 60-65 0.13 0.15 O. 25 65-69 2.94 2.76 5. 67
1950-69 1. 95 1. 28 3. 24 69-74 1. 20 3. 25 4. 42 74-79 o. 68 2. 40 4.14 79-84 2. 07 5.41 7.44
1969-84 1. 32 3.69 5. 00 1984-87 0.46 1. 35 1. 90
-------
* Projected. Source: Central Be Can of Statistic.
other serious drought that caused poor rice harvest and the domestic price increased considerably. It seems that this drought weather is periodical, occurring every five years, since it also happened in 1972, 1977, 1982, and 1987 (Jatileksono et at. (11). The problem is not simply the recent drought. Since rice self-sufficiency was achieved in 1984, rice production has increased by only 1. 9% per annum, compared with over 5% per annum in the period of 1969 to 1984. This is because the farmers substituted other crops for rice (e.g., soybeans, peanuts, etc.) due to the integrated pestcontrol campaign that restricted rice triple-cropping, the slowdown of irrigation development, and insignificant impact on yield of the expensive growth hormone included in the SUPRA INSUS package of technology (Evans (8]).
3. Price Policy
Historically, rice price policy has been imple-
mented since the mid-seventeenth century, in the era of the Kingdom of Sunan Amangkurat I (1655), in the Dutch colonial government era, and during the Japanese occupation (1942-45) (Jatileksono (10). Soon after full independence (1950), BAMA(Yayasan Bahan Makanan, or Foundation for Food, and then changed to an other foundation) was assigned to implement importing and buying rice from domestic rice millers, then distributing it to the military, police, civil servants, estate and mining workers, and for market injection in the urban market and in rice-deficit areas.
The market injection was oriented to subsidizing consumers through a market mechanism, which did not always reach the target, and this caused an increase in the quantity injected and became the source of government budget deficit and higher inflation rate.
After dealing with many problems in these rice policy implementations, some changes in the implementing agencies, and unsuccessful implementatic)lls, in 1967 Mears and Affif(15) proposed a comprehensive operational rice policy, which consists of (1) support for a floor price to stimulate production, (2) ceiling price protection assuring a reasonable price to consumers, (3) sufficien t range between these two prices to provide traders and millers reasonable profits, (4) appropriate price relationships within the country for insulation from the world market but in the long run should be close to the world price to reduce import subsidy, and (5) creation of bufferstock.
This price policy was implemented in the 1969-70 wet season rice crop. The floor price was always increased every year to support production increase and the ceiling price decreased. The margin between these prices decreased and became too small, smaller than the handling cost needed to bring rice from harvest time to nonharvest time, that is about 28%(Mears (16). This condition did not create a favorable economic activity. Consequently BULOG (Badan Urusan Logistic, or Agency for Logistic Affairs, founded in 1967), supported with the government budget, carried out rice storage and operation activities, and successfully dealt with importation, domestic procurement, distribution, and bufferstock creation. Then the domestic rice market tended to be more stabilized, in general, and it has been isolated from the fluctuating world market.
The difference between the domestic price and

Rice Production and Marketing in Indonesia 79
Table 2. The average NPR (net protection rate) for rice in Indonesia 1950-1984
Year NPR
1950-54 20.86 55-59 12.11 60-65 34.9
1950-65 23. 29
1966-70 -31. 4 71-75 -16.19 76-80 - 3.85 81-84 1. 56
1966-84 -13.22
Source: Masyhuri (12J.
the international price of rice can be regarded as price protection. The net protection rate (NPR, or the price deviation from the border price) before 1966 was generally positive, which means that the domestic price was generally higher than the border price (elF price) (Masyhuri [12J). During that time the price could not be held low, despite the government policy to maintain a low and stable rice price for consumers. Several explanations were ineffectiveness of government organization, foreign exchange shortage, and marketing inefficiency. After 1966, the domestic price of rice was lower than the border price, which seems more favorable to rice consumers, especially in the late sixties and the early seventies.
This subsidy to the consumers was paid by producers and the government (import). The government monopoly in international rice trade and control in domestic price made it possible for the domestic price to be stable, so that when the world price was lower in 1980, the domestic price was higher than the border price and it was favorable to producers.
While there was a relatively more stable rice price in 1970s and 1980s, the rice farmers also benefited from input subsidy policy. The government subsidized fertilizers and pesticides to maintain their price at low levels, and the ratio of fertilizer-to-rice price became smaller and small-
er, up to 0.51 in 1982, to encourage farmers to apply more fertilizers and pesticides, which led to the successful self-sUfficiency in rice, The government expenditure on the input subsidy in the four years of Pelita IV (1984-88) was Rp. 2,843.46 billion, most of which was for fertilizers-Rp. 2,256.47 billion or 79% (Table 3).
The government rice stock managed by BULOG consisted of (1) commitment stock(for armed forces, civil servants, etc.), (2) stabilization stock, (3) emergency stock, and (4) carry-over stock. The ratios of procurement price to retail price in the major cities in 1969 and after were generally higher than before. This is because, since 1969, the government has procured rice through free market mechanism whereas BULOG through its local branch bought rice at least at floor price, instead of buying through local officials by quota system before 1968. Prior to 1981 the government rice procurement depended mainly on import, except for several years of the mid-1960s. But since 1981, domestic procurement has been more dominant since import has been decreasing. In average, the procurement is about 10% of the total supply, although there were several years of lower procurement, and in 1977 and after it was more than 10%.
4. Rice Consumption
The available rice from the total production per capita in Indonesia is very high. Even after one deducts the seed rice requiring about 40 kg rough rice per hectare and the rice lost in transportation, storage, and other handling-estimated to be about 7.7%, all told-there were still more than 140 kg per capita. However, this is not all consumed directly as staple food; part of it is in the form of crackers and some rice is used as animal feeds.
Some studies estimated the rice expenditure elasticity of rice demand in 1987 to be O. 29 and price elasticity to be -0.17. These elasticities have fallen sharply over the recent period while
Table 3. The government expenditure input subsidy in 1984/85-1987/88 (billion Rp)
1984/85 1985/86 1986/87 1987/88 Total
Seed 4.5 3. 4 7. 37 15.9 27.77 Fertilizer 601. 9 709. 6 666. 95 278. 02 2, 256. 47 Pesticides 124.7 125. 1 168. 18 99.64 517. 62 Others 41. 6 41. 6 Total 772. 7 838.1 842. 5 390. 16 2,843.46
Source: Repelita V Pertanian, Volume I.

80
total expenditure has increased (Tabor et al. (17)). The share of rice expenditure has fallen as the share of food expenditure as a whole in the total expenditure budget. This decline in elasticities and budget share of food expenditure is fully consistent with the logic of economic development in staple food economy.
The low income and price elasticities of rice demand imply that future rice demand growth will depend mainly on population growth. The difficulty in maintaining rice production growth suggests that it will be difficult to keep the real price of rice under certain control without stimulating inflation. Maintaining rice prices within a narrow range becomes much more difficult in a more inelastic market, while stabilizing interseasonal rice prices remains important for consumer uncertainty.
Although aggregate elasticities may be low, elasticity for low-income groups will likely be higher. Maintaining a low real price of rice will confer nutritional benefit on low-income consumers. Rice price policy will still be important especially as a means of reducing supply risk and constraining inflationary growth.
5. Rice Production
Indonesia is a country of more than fifteen thousand islands spread over almost three thousand miles along the equator, with a very diverse set of physical, socioeconomic, and cultural conditions for a widely varied agricultural system. The very productive volcanic soils found in the island of Java and Bali allowed these islands to be the center of agriculture and also the center of population for centuries, while Sumatra and Sulawesi have some highly developed agricultural areas, for estate crops especially.
Rice is grown under a variety of ecological conditions in' Indonesia, including irrigated lowland (sawah) , rain-fed lowland, upland, and swamp. The main land for rice production is irrigated lowland covering about 2,874 thousand ha or about 53% of all lowland in 1983 (data from agricultural census 1983), and the other is mainly rain-fed lowland (2,222 thousand ha). Swamp accounted for only 353 thousand ha or 6. 5% of all lowland. From the' total cultivated upland of 5,671 thousand ha, there were only 1,176 thousand ha of rice harvest in 1983. The irrigated lowland has been the main source 'of rice production, not only because of the largest rice harvest with two rice crops or inore, but also due to greater development in applying modern technology and to higher yield. The average yield of lowland rice has achieved more than 4 t/ha. of rough rice, while the yield of upland rice is about 1. 8 t/ha.
Most of the irrigated lowland, especially with two rice crops or more, is in Java, about 1,404 thousand ha or 71%,' and the rest is in Sumatra (13%); Sulawesi (8%) , and Nusa Tenggara(7%), while the tidal swamp is mostly in Sumatra (54%) and Kalimantan (30%).
6. Irrigation
There are two aspects to irrigation water management: (1) adequate quantities of water; (2) efficient utilization. With regard to the first aspect, water supplies can be obtained in many ways: (1) pumped from the ground water, (2) drawn from the natural flow of a stream, and (3) by damming or regUlating the flow of a stream. In Indonesia, most of the irrigation water is obtained mostly by diversion methods from rivers, with dams or weirs or other regulatory means.
The irrigated lowland has been the main
Table 4. The heetarages of various kinds of lowland (sawah) in several islands
Irrigated Rain-fed Swamp
Island Two crops or more One rice crop Total
(ha) (%) (ha) (%) (ha) (%) (ha) (%) (ha) (%)
Sumatra 260,733 13.2 254,239 28.2 514,972 17.9 551,249 . 24. 8 181,009 54.0 Java 1,403,886 71.2 402,804 46.6 1,806,670 62.8 1,014,883 45.7 42,679 12.7 Nusa Tenggara 133,989 ,6.8 100,033 11. 1 234,022 8. 1 86,005 3. 9 1,307 O. 4 Kalimantan 12,283 .6 47,716 .5.3 59,999 2.1 344,045 15.5 102,455 30 .. 6 Sulawesi 160, 138 8.1 80, 172 8.9 240,310 8.4 221, 101 10.0 7,425 2.2 Maluku & Irian 462 338 800 4,939 0.2 165 0.1
Indonesia 1,971,470 100.0 903,301 100.0 2,874,711 100.0 2,222,221 100.0 335,043 100. 0
Source: Agriculture Census 1983, PBS Publication. -: Less than O. 05%.

Rice Production and Marketing in Indonesia 81
source of rice production and growth. Higher rice production and yield need water in terms of its availability and 'control at field level. With ample water, the command area of an irrigation system can be cultivated twice or more, the yield response of the rice crop to chemical input will substantially exceed that in a non-irrigated area, and the implementation of rice technology will be more effective. Therefore, in Indonesia, the rehabilitation, improvement, and expansion of the irrigation system has received priority in the agricultural development effort, indicated by the portion of the expenditure of the development funds originating from both national and international sources.
In Pelita I (1969-1974), more than half of the expenditure on agriculture was spent for irrigation. Up to Pelita III (1984), the expenditure on irrigation increased steadily from Rp. 13. 55 billion in 1969/1970 to Rp. 317.49 billion in 1982/ 1983. In terms of constant price, this expenditure was still increasing too (Jatileksono [10). However, in percentage, this irrigation expenditure decreased up to about 30% in Pelita III.
In Pelita I and the beginning of Pelita II, it was considered that the priority was the rehabilitation of the existing large-scale irrigation system (mostly in Java) to get a higher growth rate and more employment opportunity. Since the late 1970s, it has shifted to more new irrigation system development covering small irrigation system, swamp reclamation, and tidal swamp development; these were more expensive than the rehabilitation. In three Pelitas (1969-1984), the irrigation development covered 4,864 thousand ha or 324. 3 thousand ha per year in average. It consists of rehabilitation of 2, 000 thousand ha (41. 1%), expansion of 1, 700 thousand ha (35 %), and flood control 1, 164 thousand ha (23. 9%).
The efficient utilization of irrigation water needs adequate operation and maintenance services(O&M), and efficient water management. The irrigation infrastructure is generally more developed in the large primary system and the O&M from the government is limited to the main system only up to secondary canals, with the O&M and the managementf or the tertiary level up to the rice field is the responsibility of the village or water-user association (OPP A, P3A, Dharmatirta, etc.). There is no direct water tax in Indonesia. For tubewell irrigation, the farmers had to pay the O&M cost, while investment cost was paid by the government. Farmers paid about 7% for
Table 5. The social cost of irrigation service and farmers' contribut~on on water use in Indonesia, 1983 (rupiah per hectare)
Type of irrigation system
Farmers' contribution
Gravity irrigation West Java 3, 263 Central Java 3, 000 East Java 4,917 Average 3,727
Tubewell irrigation 15, 063
Source: Masyhuri (12].
( 7.05%) ( 5.83%) ( 9.44%) ( 7.46%) (19. 58%)
Social cost
46, 251 51,442 52,112 49,935 76, 942
their water use in gravity irrigation, while for the tubewell irrigation it was about 20%; in other words, they received subsidies of 93% and 80%, respectively.
7. Rice Technology
The expansion of the use of new vanetles, fertilizers, and pesticides, in IndoItesia is closely linked with the expansion of the BIMAS Program initiated in 1963-64. In the BIMAS Program, farmers were provided with credit in kind and in cash, extension, and direct guidance on how to deal with new inputs and improved technology. The BIMAS package of practices, called panca usaha or five efforts, consists of high-yielding seeds, fertilizers, water management, better cultivation, and pest control. The objective of the BIMAS is to increase agricultural production and farmers' income through intensification facilitated with loan in the form of seed, fertilizer, pesticides, and cash to cover living expenses.
The area under the program increased rapidly, and this program has been modified and improved continuously. In the 1969-70 wet season crop, a new approach to BIMAS was introduced with the participation of the Bank (B. R. I. or Bank Rakyat Indonesia) as credit supplier, more incentive, organized around "village unit" or locality, and letting the farmers decide whether and how much to take of each input. By the end of the 1970s, there was a phenomenon of a leveling-off in rice production in this improved BIMAS. Then the later approach in 1979 is INSUS or special intensification with more active participation of farmers' groups and direct contact with extension workers in group meetings at the field. This INSUS successfully brought the rice production in Indonesia to self-sufficiency in 1984. And in 1986 there was again decreasing production growth d~e to the difficulty of increasing number
82
of farmers participating in the INSUS, and some other problems. Based on this justification, a new program W(l.S created, called SUPRA INSUS, with improvements that included working together among farmer groups in a certain area of 80.0.-1,0.0.0. ha, cooperatives (KUD) , and extension workers, and a change in the package of inputs including growth hormone.
Biochemical technology Biological and chemical technology in rice
farming has been widely applied since the second half of the 196Ds, especially in 1967 in the irrigated lowland in Java, Bali, and Sumatra, in the form of modern rice varieties, inorganic fertilizers, and improved pest control together with other practices and supported by better irrigation infrastructure and the BIMAS program (inchldes INSUS and SUPRA INSUS).
Starting in 1941, LP3 (Lembaga Pusat Penelitian Pertanian or the Central Research Institute of Agriculture) began to release improved varieties, such as Bengawan, Fajar, Peta, followed in 1952 by the release of Shynta, Sigadis, and others. These varieties were called national improved varieties. In 1967, the IR8 and IR5 were released in Indonesia in new BIMAS with a higher dosage of fertilizer. The IR5 spread more rapidly due to its intermediate height and slightly stronger resistance to several diseases and diverse environment (Bernsten [3]). Since 1969, C4-63 was introduced and soon spread rapidly because of earlier maturing and superiority in eating quality. LP3 altered its breeding objective to produce modern rice varieties of Pelita 1/1 and Pelita 1/2, which were released in 1971 and soon adopted by farmers due to the better taste, higher yield and price, and performed well across a wider range of environments. Unfortunately, Pelita varieties and also IR5 and IR8 were susceptible to blast, tungro virus, brown plant hopper, and grazy stunt virus. To overcome the outbreak of the brown plant hopper biotype I and later II, several IR varieties were released, such as IR26, IR28, IR3D, IR32, IR 34, IR36, IR38, and IR42. Later there were still more IR varieties, such as IR5D up to IR64. From the research institute in Indonesia, there were also several modern varieties such as Cisadane, Citandui, Barito, Cipunegara, Kruing Aceh, etc. In 1986-87, the varieties used mostly were IR36, Cisadane, Kruing Aceh, IR54, IR64, etc.
Recently, most of the lowland rice in Indonesia was under modern varieties. In 1983, 74% of the rice harvested area of lowland was under modern
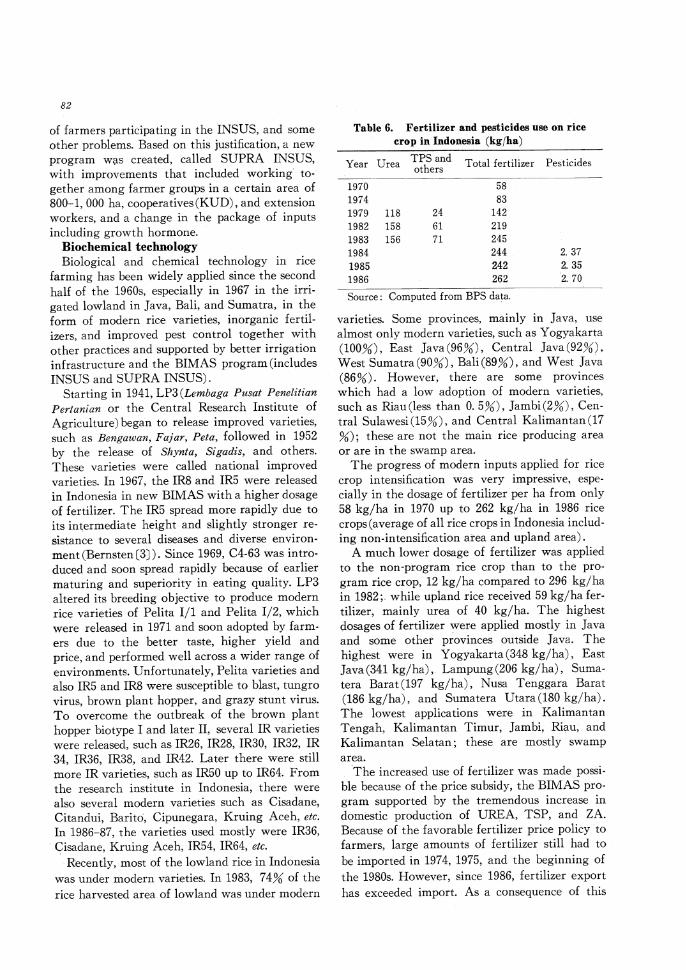
Table 6. Fertilizer and pesticides use on rice crop in Indonesia (kgjha)
Year Urea TPS and Total fertilizer Pesticides others ------.-~--- ~----
1970 58 1974 83 1979 118 24 142 1982 158 61 219 1983 156 71 245 1984 244 2. 37 1985 242 2.35 1986 262 2. 70
Source: Computed from BPS data.
varieties. Some provinces, mainly in Java, use almost only modern varieties, such as Y ogyakarta (100.%), East Java (96%) , Central Java (92%) , West Sumatra(9D%), Bali (89%), and West Java (86%). However, there are some provinces which had a low adoption of modern varieties, such as Riau(less than 0..5%), Jambi(2%) , Central Sulawesi(15%), and Central Kalimantan(17 %); these are not the main rice producing area or are in the swamp area.
The progress of modern inputs applied for rice crop intensification was very impressive, especially in the dosage of fertilizer per ha from only 58 kg/ha in 1970. up to 262 kg/ha in 1986 rice crops (average of all rice crops in Indonesia including non-intensification area and upland area).
A much lower dosage of fertilizer was applied to the non -program rice crop than to the program rice crop, 12 kg/ha compared to 296 kg/ha in 1982; while upland rice received 59 kg/ha fertilizer, mainly urea of 40. kg/ha. The highest dosages of fertilizer were applied mostly in Java and some other provinces outside Java. The highest were in Y ogyakarta (348 kg/ha), East Java (341 kg/ha), Lampung (20.6 kg/ha), Sumatera Barat (197 kg/ha), Nusa Tenggara Barat (186 kg/ha), and Sumatera Utara (180. kg/ha). The lowest applications were in Kalimantan Tengah, Kalimantan Timur, Jambi, Riau, and Kalimantan Selatan; these are mostly swamp area.
The increased use of fertilizer was made possible because of the .price subsidy, the BIMAS program supported by the tremendous increase in domestic production of UREA, TSP, and ZA. Because of the favorable fertilizer price policy to farmers, large amounts of fertilizer still had to be imported in 1974, 1975, and the beginning of the 198Ds. However, since 1986, fertilizer export has exceeded import. As a consequence of this

Rice Production and Marketing in Indonesia 83
policy, the subsidy increased to become the greatest proportion in the expenditure on agriculture, about 42% in the beginning of the 1980s.
The use of pesticides also increased significantly, with a growth rate of 10.3% in Pelita III (1979-1984) up to 2 liters or more per ha on lowland rice crop, and 3. 8% up to abo'ut half a liter per ha on upland rice in 1985.
Mechan.ical technology The densely concentrated population in Java
and Bali with very small farm size has generated economic forces that lead to the highly developed land-saving technology through the BIMAS program with high yield. The other islands without any population pressure, however, are still in the stage of surplus labor economy, which is not favorable for the development of mechanical technology. Instead of a high man/land ratio in Java and Bali, selective mechanical technology was developed because of the labor shortage at land preparation time, especially in the north coastal plain of Java, such as Krawang, Subang, Indramayu. This was also because of the introduction of double cropping, which was made possible by better irrigation infrastructure and early-maturing rice varieties. This selective mechanization, especially the small tractor, has spread out slowly to other densely populated rice-producing areas. The number of two-wheeled tractors in 1984 was 8, 881 compared to 6, 443 in 1982 - a growth rate of 16.2%. Mini four-wheeled tractors of 12-15 horsepower numbered 2,470 in 1984, with a growth rate of 9. 6;0 in 1982-84. The 16-39 HP four-wheeled tractors numbered 788 in 1984, with a growth rate of 14.5%. Bigger tractors (40-60 HP) decreased 23. 7% per annum in 1982-84.
The use of a sprayer, especially the hand sprayer, was common in rice farming. A simple tool for weeding in the form of a rotary or spiketoothed push weeder has been adopted throughout the rice farm area in combination with manuallabor for weeding.
Changes have also happened in the use of the harvesting tool: ani-ani(a hand-held knife)with the bawon system (share labor) to sickle with the daily wage system. One of the reasons was that the IR varieties mostly shatter easily. This simple mechanization involved a change in the labor relationship and employment opportunity for the landless rural people, especially when it was associated with the tebasan system, where farmers sell crops before harvest to the middlemen and then usually the buyers limit the number of harvesting
laborers and reduce the harvest wage (Collier et al. [5J [6J, U tami and Ihalauw [18J).
In contrast to the low adoption of mechanical technology in pre harvest production technology, the rice mill is now widely used in most areas throughout Indonesia; . since 1970, the hand pounding of rice by women, once almost universal, has almost ceased to exist. This is another shift from traditional to modern technology in the surplus labor economy that eliminated one of theincome sources of landless villagers. In irrigation there was limited adoption of non-mobile engine-powered water pumps in places with shallow ground water and in the water-problem area of the conventional irrigation.
S. Farm Management Structure
From the 1983 agricultural census data, there are 17.07 million farm households in Indonesia consisting of 11. 588 million farm households (67. 9%) of food crops only, 906. 4 thousand farm households of food crops and fish, 4,074.4 thousand farm households of food crops and animals; and 250. 7 thousand food crops-fish-animals: a total of 16.8 million farm households (98.5%) of food crops.
Most of the farms are very small. The average farm size was 1. 05 ha in 1983. In Java it was the smallest, O. 66 ha on average, while the largest farm size was in Kalimantan, with 2. 78 ha on average. The average farm size of the other islands was in between these two: Sulawesi, 1. 45 ha; Sumatra, 1. 44 ha; and so on.
The distribution of the farm size was skewed to the small size: 12. 5% of the farm households were under O. 1 ha in size, and 36. 4% were between O. 1-0. 5 ha, i.e., almost 50% were under
Table 7 .. The percentage of number or farm households of each category of farm size in Indonesia, 1983
Farm size Lowland-rice farm household (%)
(ha) Farm size C%)
Less than o. 1 12.5 Less than O. 25 20. 4 O. 1-0. 5 36.4 O. 25-0. 5 23. 9 O. 5-1. 0 21. 8 O. 5-1. 0 24. 9 .1. 0-2. 0 16.9 1. 0-1. 5 12. 7 2. 0-3. 0 6.6 1. 5-2. 0 5.8
More than 3. 0 5.8 2.0-5.0 9.6 5. 0-10. 0 1.4
More than 10. 0 0.4
Source: Various issues of BPS based on Agricultural Census 1983.

84
half a hectare. This also happened in the lowlandrice farm size: almost 45% of lowland-rice farm households were half a hectares, but there were some larger than 2 ha (11. 4%).
Most of the farmers in Indonesia are owneroperators; these included about 16. 15 million or 94.6% in 1983, but some of these owner-operator farmers had some addition of rented land, i.e., 4.32 million farmers or 25.3%, while the pure owner-operator farmers were 11. 83 million or 69'.3%, and only 924 thousand farmers were pure tenants without any land ownership. Therefore , there were 5.25 million farmers who dealt with tenancy.
Among the 5. 25 million tenant farmers, there were 3. 21 million (59. 5%) farmers who dealt with a share-cropping arrangemeh t, and the rest (40. 5 %) by fi~ed rent. The smaller the farm size, the greater is the proportion of share-cropping arrangement. In this share-cropping, the tenant share is usually more than half of output but almost all input cost was borne by the tenants; 2.67 million share-cropping tenants or 85.6% got more than the half of output, but 1. 6 million or 51. 9% tenants paid all input cost. This is still similar to the share-cropping tenants that got only less than half of output; mostly they paid all input cost or more than half of input cost.
The agrarian structure of the Indonesian village communities, especially in rice villages of Java, did not develop into one of non-cultivating landlords and landless tenants, although the majority of peasants continued to be small owneroperators, as also stated by Hayami and Kikuchi (9J that the Javanese villages maintained their posture as a relatively homogeneous peasant society bound by traditional norms. However, there is a possible aggregation process on some farm land around big cities such as Jakarta and Surabaya, although there is no legal data of that.
9. Conclusion
In Indonesia, rice is still regarded as a political commodity due to its influence on the economic development process in relation to economic stabilization and in supporting industrial development. Rice self-sufficiency has been targeted for a long time, since the first development plan at the beginning of independence. And for a very long period, this target seemed difficult to attain in spite of various improvements prior to and during BIMAS. Many possible explanations can be stated; among others, the large initial short-
age of domestic production, high income elasticity of demand, ,unfavorable prices of output and input to farmers, undeveloped institution servicing farmers, etc.
After there were substantial changes in these problem factors-such as improvement in the BIMAS program (INSUS), with more participation of farmer groups, more favorable input-output price ratio to farmers, more stable price due to successful procurement-after about two decades, in 1984, self-sufficiency was successfully achieved.
The periodic five-year drought in 1987, with poor harvest, considerably increased the domestic price despite the extensive market operation by BULOG. The problem is not simply a result of the recent drought but also the slower growth rate of domestic rice production due to the campaign of integrated pest control (IPC) against brown plant hopper, the slowdown of irrigation development, and the new package of technology in SUPRA INSUS including an ineffective, expensive growth hormone.
A short-term choice has to be made: among others, large price increase of rice, occasional import, relocation of other crops outside lowland rice field (e.g., sugarcane), greater attention(i.e., greater budget) to irrigation development, focusing policy again on rice production, and/or relaxing the restriction of triple rice cropping as part of IPC. The occasional import can be done one over a five- or ten-year agricultural cycle for example.
Biological and chemical technology with landsaving character has highly developed mainly in the densely populated areas with good irrigation infrastructure-mostly in Java and some other places outside Java-supported by government policy in production program and price policy, such as the priority of the development expenditure on irrigation development and input price subsidy ..
Selected mechanical technology in land preparation has been developed in some densely populated areas and it spread out slowly to the similar area. Simple mechanization tools were devised for weeding and harvesting, while post-harvest rice mills have been widely adopted throughout Indonesia.
Rice production in Indonesia is based on very small family farms and mostly owner-operators. A very small portion of these farmers were tenant farmers and owner-tenants which are mostly in

Rice Production and Marketing in Indonesia 85
a share-cropping arrangement with most input cost paid by the tenants.
References
( 1) Arndt, H. W., "Survey of Recent Developments," Bulletin of Indonesian Economic Studies, Vol. XVII( No.2, 1983, pp. 1-26.
(2) Barker, Rand R W. Herdt (withB. Rose), The Rice Economy of Asia Resources fot the Future, 1985.
( 3) Bernsten, R H., "The Development and Diffusion of Rice Varieties in Indonesia," IRRI Research Pap~r Series, IRRI, 1981.
( 4 ) Collier, W. L., S. Gunawan Wiradi, E. Basandaran, K. Santoso, and J. F. Stepanek, "The Acceleration of. Rural Development on Java: From Village Studies to a National Perspective," Occasional Paper No. 061, Agro·Economic Survey, 73 pp., 1982.
( 5 ) ---, G. Wiradi, and S. Gunawan Wiradi, "Recent Change in Rice Harvesting Methods," Bulletin of Indonesian Economic Studies, Vol. IX, No.2, 1973, pp. 31-49.
( 6) --, J. C. Sinarhadi, and R d' A Shaw, "Choice of Technique in Rice Milling-A Comment," Bulletin of Indonesian Economic Studies, Vol. X, No. 1, 1974, pp. 106-12l.
( 7 ) Dick, H, "Survey of Recent Developments," Bulletin of Indonesian Economic Studies, Vol. XVIII, No·. 1, 1982, pp. 1-38.
( 8 ) Evans, D., "Survey of Recent Development," Bulletin of Indonesian Economic Studies, Vol. XXIV, No. 3, 1988, pp. 3-30.
( 9) Hayami, Y. and M. Kikuchi, Asian Village &onomy at the Crossroads, University of Tokyo Press, 1981.
(10) Jatileksono, T., Equity Achievement in the Indonesia Rice Economy, Gadjah Mada University Press, 1987. .
(11) --- et al., Evaluasi Dampak kemarau Panjang terhadap Produksi dan :penyediaan Pangan, Fakultas Pertanian UGM, 1988.
(12) Masyhuri, "Economic Incentives and Comparative Advantage in Rice Production in Indonesia," unpublished dissertation, UPLB, Los Banos, Philip· pines, 1988.
(13) McCawley, P., "Survey of Recent Development," Bulletin of Indonesian Eco;'omic Studies, Vol. XIX, No. 7, 1983, pp. 1-3l.
(14) Mears, L. A., "Rice and Food Self-Sufficiency in Indonesia," Bulletin of Indonesian Economic Studies, Vol. XX, No.2, 1984, pp. 122-138.
(15) --- and S. Affif, "An Operational Rice Price Policy for Indonesia," Ekonomi dan Keuangan Indonesia, Vol. 17, No.2, University of Indonesia, 1969.
(16J ---, The New Rice &onomy of Indonesia, Gadjah Mada University Press, 1981.
(17) Tabor, S. R, K. Altemeier, and B. Adinugroho, "Food Crop Demand in Indonesia: A Systems Approach," Bulletin of Indonesian Economic Studies, Vol. 25, No.2, 1989, pp. 32-52.
(18) Utami, W. and J. Ihalauw, "Some Consequences of Small Farm Size," Bulletin of Indonesian Economic Studies, Vol. IX, No.2, 1973, pp. 46-56.