richard scheines peter spirtes, clark glymour, dept. of...
TRANSCRIPT

Graphical Models --11/30/05 1
Causal Discovery
Richard Scheines
Peter Spirtes, Clark Glymour, and many others
Dept. of Philosophy & CALDCarnegie Mellon

Graphical Models --11/30/05 2
Outline
1. Motivation
2. Representation
3. Connecting Causation to Probability (Independence)
4. Searching for Causal Models
5. Improving on Regression for Causal Inference

Graphical Models --11/30/05 3
1. Motivation
Non-experimental Evidence
Typical Predictive Questions
• Can we predict aggressiveness from the amount of violent TV watched
• Can we predict crime rates from abortion rates 20 years ago
Causal Questions:
• Does watching violent TV cause Aggression?
• I.e., if we change TV watching, will the level of Aggression change?
Day Care Aggressivenes
John
Mary
A lot
None
A lot
A little

Graphical Models --11/30/05 4
Bayes Networks Disease
[Heart Disease, Reflux Disease, other]
Shortness of Breath[Yes, No]
Chest Pain [Yes, No]
Qualitative Part:Directed Graph
P(Disease = Heart Disease) = .2P(Disease = Reflux Disease) = .5P(Disease = other) = .3
P(Chest Pain = yes | D = Heart D.) = .7P(Shortness of B = yes | D= Hear D. ) = .8
P(Chest Pain = yes | D = Reflux) = .9P(Shortness of B = yes | D= Reflux ) = .2
P(Chest Pain = yes | D = other) = .1P(Shortness of B = yes | D= other ) = .2
Quantitative Part:Conditional
Probability Tables

Graphical Models --11/30/05 5
Bayes Networks: Updating
Given: Data on Symptoms
Chest Pain = yes
Wanted:
P(Disease | Chest Pain = yes )
Disease [Heart Disease, Reflux Disease, other]
Shortness of Breath[Yes, No]
Chest Pain [Yes, No]
Updating P(D = Heart Disease) = .2P(D = Reflux Disease) = .5P(D = other) = .3
P(Chest Pain = yes | D = Heart D.) = .7P(Shortness of B = yes | D= Hear D. ) = .8
P(Chest Pain = yes | D = Reflux) = .9P(Shortness of B = yes | D= Reflux ) = .2
P(Chest Pain = yes | D = other) = .1P(Shortness of B = yes | D= other ) = .2

Graphical Models --11/30/05 6
Causal Inference
Given: Data on Symptoms
Chest Pain = yes
P(Disease | Chest Pain = yes ) Updating
P(Disease | Chest Pain set= yes )
Causal Inference

Graphical Models --11/30/05 7
Causal Inference
When and how can we use non-experimental data to tell us about the effect of an intervention?
Manipulated Probability P(Y | X set= x, Z=z)
from
Unmanipulated Probability P(Y | X = x, Z=z)

Graphical Models --11/30/05 8
2. Representation
1. Association & causal structure - qualitatively
2. Interventions
3. Statistical Causal Models
1. Bayes Networks
2. Structural Equation Models

Graphical Models --11/30/05 9
Causation & Association
X and Y are associated (X _||_ Y) iff
∃x1 ≠ x2 P(Y | X = x1) ≠ P(Y | X = x2)
Association is symmetric: X _||_ Y ⇔ Y _||_ X
X is a cause of Y iff∃x1 ≠ x2 P(Y | X set= x1) ≠ P(Y | X set= x2)
Causation is asymmetric: X Y ⇔ X Y

Graphical Models --11/30/05 10
Direct Causation
X is a direct cause of Y relative to S, iff∃z,x1 ≠ x2 P(Y | X set= x1 , Z set= z)
≠ P(Y | X set= x2 , Z set= z)
where Z = S - {X,Y}
X Y

Graphical Models --11/30/05 11
Causal Graphs
Causal Graph G = {V,E} Each edge X → Y represents a direct causal claim:
X is a direct cause of Y relative to V
Exposure Rash Chicken Pox
Exposure Infection Rash

Graphical Models --11/30/05 12
Causal GraphsDo Not need to be Cause Complete Omitted Causes 2Omitted Causes 1
Exposure Infection Symptoms
Do need to be Common Cause Complete
Exposure Infection Symptoms
Omitted Common Causes

Graphical Models --11/30/05 13
Modeling Ideal Interventions
Ideal Interventions (on a variable X):
• Completely determine the value or distribution of a variable X
• Directly Target only X (no “fat hand”)E.g., Variables: Confidence, Athletic PerformanceIntervention 1: hypnosis for confidenceIntervention 2: anti-anxiety drug (also muscle relaxer)

Graphical Models --11/30/05 14
Modeling Ideal Interventions
Interventions on the Effect
Pre-experimental SystemPost
Sweaters On
Room Temperature

Graphical Models --11/30/05 15
Modeling Ideal Interventions
Interventions on the Cause
Pre-experimental SystemPost
SweatersOn
Room Temperature

Graphical Models --11/30/05 16
Interventions & Causal Graphs
• Model an ideal intervention by adding an “intervention” variable outside the original system
• Erase all arrows pointing into the variable intervened upon
Intervene to change Inf
Post-intervention graph?Pre-intervention graph
Exp Inf Rash
I
Exp Inf Rash

Graphical Models --11/30/05 17
Conditioning vs. Intervening
P(Y | X = x1) vs. P(Y | X set= x1)
Teeth Slides

Graphical Models --11/30/05 18
Causal Bayes Networks
S m o k in g [0 ,1 ]
L u n g C an ce r[0 ,1 ]
Y e llo w F in g e rs[0 ,1 ]
The Joint Distribution Factors
According to the Causal Graph,
i.e., for all X in V
P(V) = ΠP(X|Immediate Causes of(X))
P(S = 0) = .7P(S = 1) = .3
P(YF = 0 | S = 0) = .99 P(LC = 0 | S = 0) = .95P(YF = 1 | S = 0) = .01 P(LC = 1 | S = 0) = .05P(YF = 0 | S = 1) = .20 P(LC = 0 | S = 1) = .80P(YF = 1 | S = 1) = .80 P(LC = 1 | S = 1) = .20
P(S,YF, L) = P(S) P(YF | S) P(LC | S)

Graphical Models --11/30/05 19
Structural Equation Models
Education
LongevityIncome
Causal Graph
Statistical Model
1. Structural Equations2. Statistical Constraints

Graphical Models --11/30/05 20
Structural Equation Models
Education
LongevityIncome
Causal Graph
z Structural Equations:One Equation for each variable V in the graph:
V = f(parents(V), errorV)for SEM (linear regression) f is a linear function
z Statistical Constraints:Joint Distribution over the Error terms

Graphical Models --11/30/05 21
Structural Equation Models
Equations:Education = εed
Income = β1 Education + εincome
Longevity = β2 Education + εLongevity
Statistical Constraints:(εed, εIncome,εIncome ) ~N(0,Σ2)
− Σ2 diagonal- no variance is zero
Education
LongevityIncome
Causal Graph
Education
εIncome εLongevity
β1 β2
LongevityIncome
SEM Graph
(path diagram)

Graphical Models --11/30/05 22
3. Connecting
Causation to Probability

Graphical Models --11/30/05 23
Causal Structure
Statistical Predictions
The Markov Condition
Causal Markov Axiom
Independence
X _||_ Z | Yi.e.,
P(X | Y) = P(X | Y, Z)
Causal Graphs
ZY X

Graphical Models --11/30/05 24
Causal Markov Axiom
If G is a causal graph, and P a probability distribution over the variables in G, then in P:
every variable V is independent of its non-effects, conditional on its immediate causes.

Graphical Models --11/30/05 25
Causal Markov Condition
Two Intuitions:
1) Immediate causes make effects independent of remote causes (Markov).
2) Common causes make their effects independent(Salmon).

Graphical Models --11/30/05 26
Causal Markov Condition
1) Immediate causes make effects independent of remote causes (Markov).
E = Exposure to Chicken Pox
I = Infected
S = SymptomsMarkov Cond.
E || S | I SI E

Graphical Models --11/30/05 27
Causal Markov Condition
2) Effects are independent conditional on their commoncauses.
Sm oking(S)
Y ellow F ingers (Y F)
Lung C ancer(L C )
Markov Cond.YF || LC | S

Graphical Models --11/30/05 28
Causal Structure ⇒ Statistical Data
X3 | X2 X1
X2 X3 X1
Causal Markov Axiom (D-separation)
Independence
Acyclic Causal Graph

Graphical Models --11/30/05 29
Causal Markov Axiom
In SEMs, d-separation follows from assuming independence among error terms that have no connection in the path diagram -
i.e., assuming that the model is common cause complete.

Graphical Models --11/30/05 30
Causal Markov and D-Separation
• In acyclic graphs: equivalent
• Cyclic Linear SEMs with uncorrelated errors:• D-separation correct
• Markov condition incorrect
• Cyclic Discrete Variable Bayes Nets:• If equilibrium --> d-separation correct
• Markov incorrect

Graphical Models --11/30/05 31
D-separation: Conditioning vs. Intervening
X3
T
X2 X1
P(X3 | X2) ≠ P(X3 | X2, X1)
X3 _||_ X1 | X2
X3
T
X2 X1
I
P(X3 | X2 set= ) = P(X3 | X2 set=, X1)
X3 _||_ X1 | X2 set=

Graphical Models --11/30/05 32
4. Search
From Statistical Datato Probability to Causation

Graphical Models --11/30/05 33
Causal DiscoveryStatistical Data ⇒ Causal Structure
Background Knowledge
- X2 before X3
- no unmeasured common causes
X3 | X2 X1
Independence
Data
Statistical Inference
X2 X3 X1
Equivalence Class of Causal Graphs
X2 X3 X1
X2 X3 X1
Discovery Algorithm
Causal Markov Axiom (D-separation)

Graphical Models --11/30/05 34
Representations ofD-separation Equivalence Classes
We want the representations to:
• Characterize the Independence Relations Entailed by the Equivalence Class
• Represent causal features that are shared by every member of the equivalence class
Graphical Models --11/30/05 35
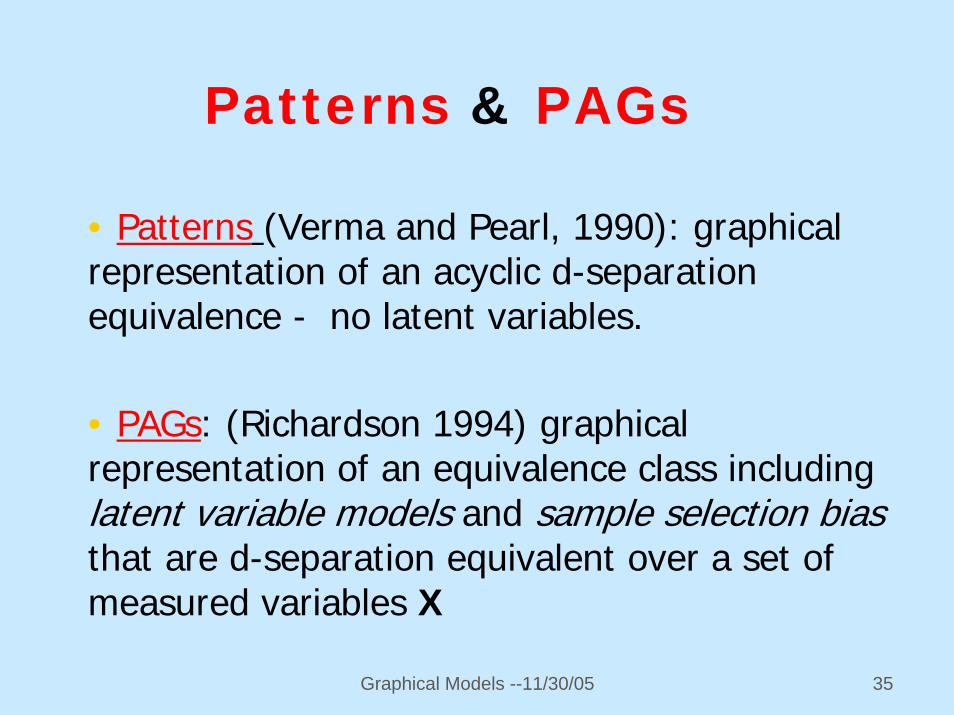
Patterns & PAGs
• Patterns (Verma and Pearl, 1990): graphical representation of an acyclic d-separation equivalence - no latent variables.
• PAGs: (Richardson 1994) graphical representation of an equivalence class includinglatent variable models and sample selection biasthat are d-separation equivalent over a set of measured variables X
Graphical Models --11/30/05 36
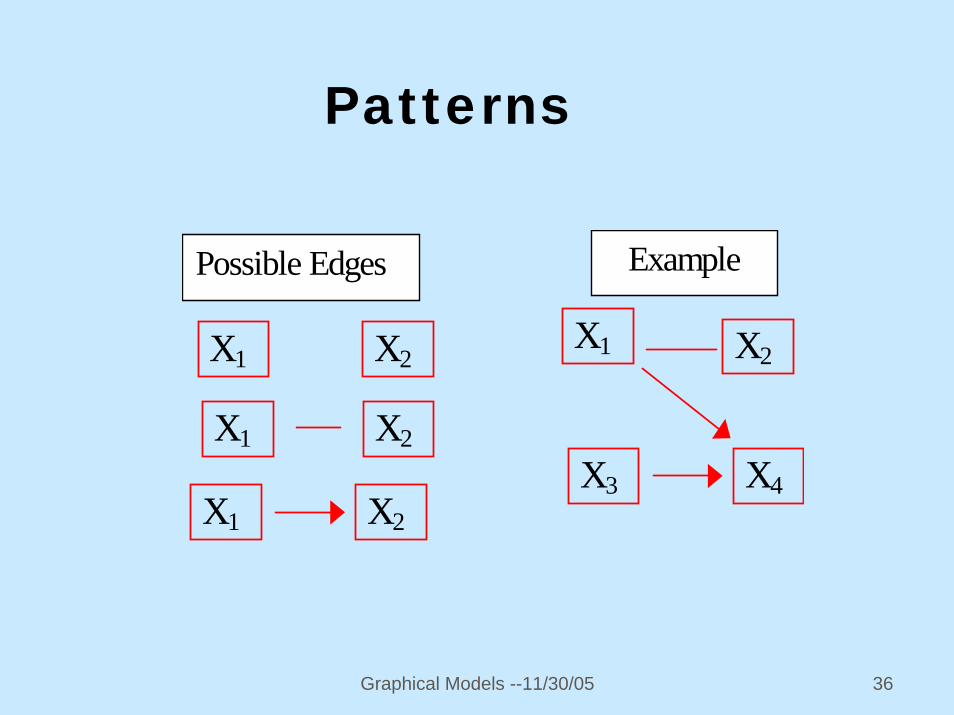
Patterns
X2 X1
X2 X1
X2 X1
X4 X3
X2 X1
Possible Edges Example

Graphical Models --11/30/05 37
Patterns: What the Edges Mean
X2 X1
X2 X1X1 → X2 in some members of theequivalence class, and X2 → X1 inothers.
X1 → X2 (X1 is a cause of X2) inevery member of the equivalenceclass.
X2 X1 X1 and X2 are not adjacent in anymember of the equivalence class

Graphical Models --11/30/05 38
Patterns
X2
X4X3
X1
X2
X4X3
Represents
Pattern
X1 X2
X4 X3
X1

Graphical Models --11/30/05 39
PAGs: Partial Ancestral Graphs
What PAG edges mean.
X2 X1
X2 X1
X2 X1
X2 There is a latent commoncause of X1 and X2
No set d-separates X2 and X1
X1 is a cause of X2
X2 is not an ancestor of X1
X1
X2 X1 X1 and X2 are not adjacent

Graphical Models --11/30/05 40
PAGs: Partial Ancestral Graph
X 2
X 3
X 1
X 2
X 3
Represents
PAG
X 1 X 2
X 3
X 1
X 2
X 3
T 1
X 1
X 2
X 3
X 1
etc.
T 1
T 1 T 2

Graphical Models --11/30/05 41
Overview of Search Methods
• Constraint Based Searches• TETRAD
• Scoring Searches• Scores: BIC, AIC, etc.• Search: Hill Climb, Genetic Alg., Simulated Annealing• Very difficult to extend to latent variable models
Heckerman, Meek and Cooper (1999). “A Bayesian Approach to Causal Discovery” chp. 4 in Computation, Causation, and Discovery, ed. by Glymour and Cooper, MIT Press, pp. 141-166

Graphical Models --11/30/05 42
Tetrad 4 Demo
www.phil.cmu.edu/projects/tetrad_download/

Graphical Models --11/30/05 43
5. Regession and Causal Inference

Graphical Models --11/30/05 44
Regression to estimate Causal Influence
• Let V = {X,Y,T}, where
- Y : measured outcome
- measured regressors: X = {X1, X2, …, Xn}- latent common causes of pairs in X U Y: T = {T1, …, Tk}
• Let the true causal model over V be a Structural Equation Model in which each V ∈ V is a linear combination of its direct causes and independent, Gaussian noise.

Graphical Models --11/30/05 45
Regression and Causal Inference
• Consider the regression equation:Y = b0 + b1X1 + b2X2 + ..…bnXn
• Let the OLS regression estimate bi be the estimated causal influence of Xi on Y.
• That is, holding X/Xi experimentally constant, bi is an estimate of the change in E(Y) that results from an intervention that changes Xi by 1 unit.
• Let the real Causal Influence Xi → Y = βi
• When is the OLS estimate bi an unbiased estimate of βi ?
Graphical Models --11/30/05 46
Linear Regression
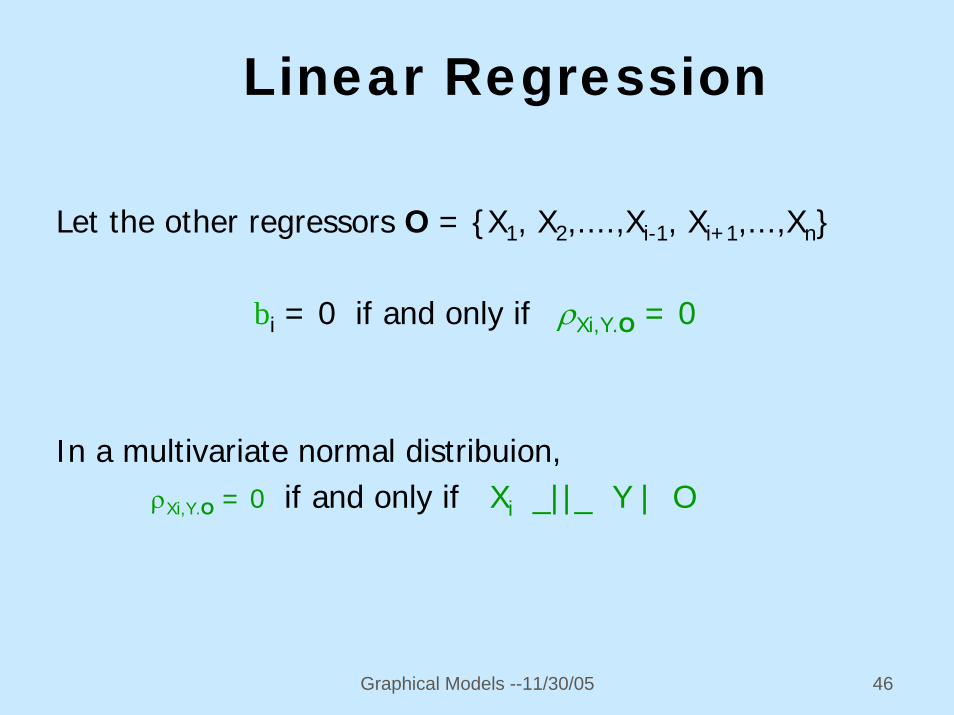
Let the other regressors O = {X1, X2,....,Xi-1, Xi+1,...,Xn}
bi = 0 if and only if ρXi,Y.O = 0
In a multivariate normal distribuion,ρXi,Y.O = 0 if and only if Xi _||_ Y | O

Graphical Models --11/30/05 47
Linear Regression
So in regression: bi = 0 ⇔ Xi _||_ Y | O
But provably :βi = 0 ⇐ ∃S ⊆ O, Xi _||_ Y | S
So ∃S ⊆ O, Xi _||_ Y | S ⇒ βi = 0~ ∃S ⊆ O, Xi _||_ Y | S ⇒ don’t know (unless we’re
lucky)

Graphical Models --11/30/05 48
Regression Example
b1≠ 0X1 _||_ Y | X2 X2
Y
X1
True Model
b2 = 0X2 _||_ Y | X1
Don’t know
~∃S ⊆ {X2} X1 _||_ Y | S
β2 = 0∃S ⊆ {X1} X2 _||_ Y | {X1}

Graphical Models --11/30/05 49
Regression Example
b1≠ 0
X2
Y
X3 X1
T1
True Model
T2
~∃S ⊆ {X2,X3}, X1 _||_ Y | S
X1 _||_ Y | {X2,X3}
X2 _||_ Y | {X1,X3} b2≠ 0
b3≠ 0X3 _||_ Y | {X1,X2}
DK
β2 = 0∃S ⊆ {X1,X3}, X2 _||_ Y | {X1}
~∃S ⊆ {X1,X2}, X3 _||_ Y | S DK
Graphical Models --11/30/05 50
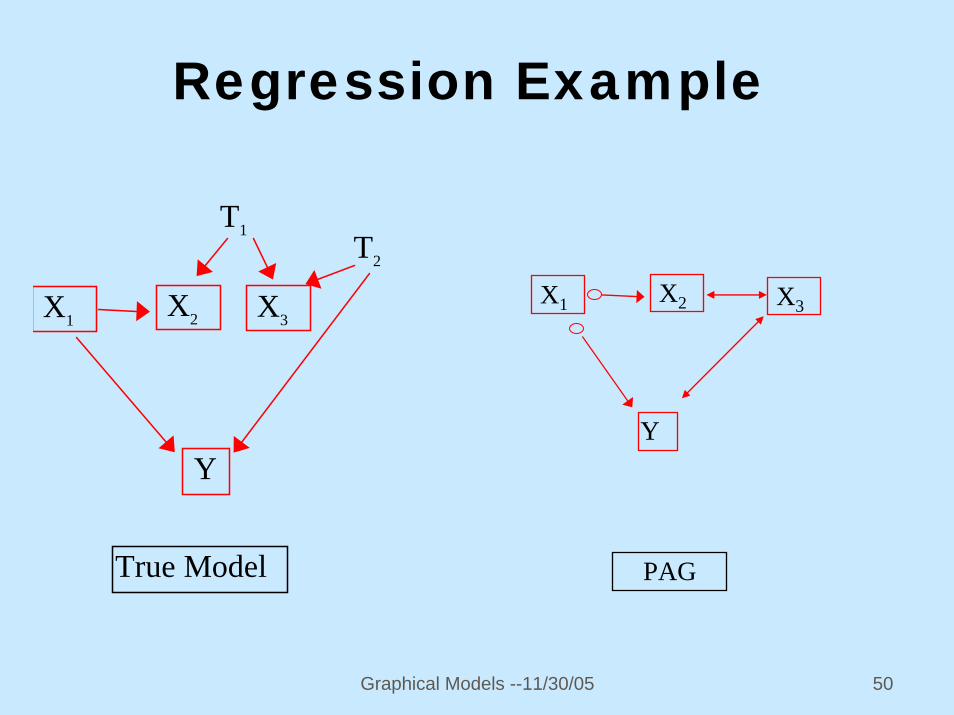
Regression Example
X2
Y
X3 X1
T1
True Model
T2
X2
Y
X3X1
PAG

Graphical Models --11/30/05 51
Regression Bias
If • Xi is d-separated from Y conditional on X/Xi
in the true graph after removing Xi → Y, and • X contains no descendant of Y, then:
bi is an unbiased estimate of βi
See Using Path Diagrams as a Structural Equation Modeling Tool, (1998). Spirtes, P., Richardson, T., Meek, C., Scheines, R., and Glymour, C., Sociological Methods & Research, Vol. 27, N. 2, 182-225

Graphical Models --11/30/05 52
Ongoing Projects
• Finding Latent Variable Models (Ricardo Silva, Gatsby Neuroscience, former CALD PhD)
• Ambiguous Manipulations (Grant Reaber, Philosophy)
• Strong Faithfulness (Jiji Zhang, Philosophy)
• Educational Data Mining (Benjamin Shih, CALD)
• Sequential Experimentation (Active Discovery), (Frederick Eberhardt, CALD & Philosophy)

Graphical Models --11/30/05 53
References
• Causation, Prediction, and Search, 2nd Edition, (2000), by P. Spirtes, C. Glymour, and R. Scheines ( MIT Press)
• Causality: Models, Reasoning, and Inference, (2000), Judea Pearl, Cambridge Univ. Press
• Computation, Causation, & Discovery (1999), edited by C. Glymour and G. Cooper, MIT Press
• Causality in Crisis?, (1997) V. McKim and S. Turner (eds.), Univ. of Notre Dame Press.
• TETRAD IV: www.phil.cmu.edu/projects/tetrad
• Causality Lab: www.phil.cmu.edu/projects/causality-lab
• Web Course: www.phil.cmu.edu/projects/csr/